Page 1
CUSTOMER PROFILING OF ONLINE GROCERY SHOPPERS- A COMPARISON
OF TWO TECHNIQUES
Seema Sambargi
Research Scholar, Adarsh Institute of Management and Information Technology
Research Centre, Bangalore University, Bangalore, India
Anitha Ramachander
Research Guide, Adarsh Institute of Management and Information Bangalore,I ndia
Technology
Research Centre, Bangalore University,
Uma Devi Ananth
Adarsh Institute of Management and Information Technology, Bangalore, India
R K Gopal
PES University, Bangalore, India
Corresponding author contact details:
Seema Sambargi,
Adarsh Institute of Management and Information Technology
5th
Main Chamarajpet, Bangalore 560085
Email: [email protected]
ADALYA JOURNAL
Volume 9, Issue 1, January 2020
ISSN NO: 1301-2746
http://adalyajournal.com/243
Page 2
ABSTRACT
Consumer profiling is gaining a lot of traction in the recent past among marketers .The
availability of techniques and computing power to harness big data to profile
prospective customers is enabling them get additional insights into customers and to
help to identify and gain a deeper understanding of the target market. This empirical
study compares two statistical techniques- one traditional, binomial logistic regression
and other modern, neural networks in profiling the online women grocery customers.
The results are encouraging and lend credibility to new age statistical techniques like
neural networks
Keywords: Customer profiling, Neural Networks, Binomial logistic regression, Profiling
ADALYA JOURNAL
Volume 9, Issue 1, January 2020
ISSN NO: 1301-2746
http://adalyajournal.com/244
Page 3
Introduction
Among the various sectors contributing to the changing life standards of consumers in
India, an important one is the retail sector. This sector has been characterized by a shift from
the unorganized to an organized one, which included a shift from the kirana store format to
the formats like department stores, hypermarkets, supermarkets and specialty stores across
the different range of product categories. The use of Internet is catching up as alternative
channel for retailing in India, and it is now an acknowledged and important part of the retail
experience. The momentum and growth of the Indian retail industry coupled with the
development of the requisite infrastructure and increasing awareness of online shopping
would give a further boost to the online shopping industry.
While online retail has been a considerable success in airlines, train or movie tickets
on the internet and, online marketing of books and music have also been considerably
successful despite the fact that internet penetration in India is very low, e-tailing in sectors
like grocery and FMCG has not met the same kind of success. In this context, it is important
for marketers to understand which kind of customers have a higher propensity to shop
groceries on line. Considering that grocery shopping is a chore traditionally carried out by
women it is important for online grocers to understand the profile of online women grocery
shoppers.
Review of Literature
In an exploratory research through survey of literature to find the prospects of grocery
e-tailing, profile of online grocery customer, sustainability of e-tailers, the key success
factors and impediments to success by (Keh & Shieh, 2001)it was found that grocery
ADALYA JOURNAL
Volume 9, Issue 1, January 2020
ISSN NO: 1301-2746
http://adalyajournal.com/245
Page 4
shopping online appeals to time pressed, elderly, infirm .But characteristics like impulse
buying, browsing ,instant gratification and product freshness are hard to replicate online .In
their opinion ,in all likelihood both e-tail and retail would co-exist.
Lynch & Beck (2001) in their study to find if internet buyers' beliefs, attitudes and
internet behavior will differ among world regions, between countries within a world region,
as well depend on the amount of time they spend on the internet, found that there is a need to
micro market to different niches because of differences in culture albeit this study did not
include India.
In a study involving survey of US consumers Hansen (2005), found that online
grocery shopping adopters had higher house hold income than the non-adopters.
Brashear, Kashyap, Musante, & Donthu (2009)in their study across six countries to
understand the characteristics relating to attitudes, motivations and demographics in six
countries(USA, UK, NZ, China, Brazil & Bulgaria) ,and the differences between internet
users and online shoppers showed with the help of statistical tools like ANOVA and chi
square tests that online shoppers across the countries show similar traits-desire for
convenience, impulsive, favorable attitude towards direct marketing and ads, wealthier and
are heavy users of both email and internet.
In an India specific study, to profile Indian online shoppers, Parikh (2006) the results
suggested strong association between length of Internet surfing and actual Internet shopping.
Also, a strong association was revealed between Internet usage and actual Internet shopping.
In addition to this, prior experience of Internet shopping had a multiplying impact on future
intention to shop through the Internet. Contrary to expectations there were no significant
associations between the shopping segments and demographic variables.
ADALYA JOURNAL
Volume 9, Issue 1, January 2020
ISSN NO: 1301-2746
http://adalyajournal.com/246
Page 5
In line with the findings of the above study, another study conducted in Delhi on
college going students by (Handa & Gupta, 2009) also found that gender has no influence on
the innovativeness of online shoppers.
In a comprehensive survey(Zhou, Dai, & Zhang, 2007) , an attempt to identify the
convergent factors that were highlighted from 35 empirical researches regarding online
shopping behavior it was opined that with increasing competition in online business,
business needs to devise strategies that are based on sound consumer demographics and
psycho graphics recognized by consumer behavioral research.’
Walters & Bekker (2017) describe the on-going development of a proposed simulator
and demonstration tool that includes big data analytics to reveal patterns within the customer
dataset, and hence generate a customer profile.Fares, Lebbar, & Sbihi (2018) opine that data
science and machine learning tools are the latest trend in big data analysis, with short
calculation time.
Yoseph, Malim, & AlMalaily (2019) applied soft clustering Fuzzy C-Means (FCM)
and hard clustering Expectation Maximization (EM) algorithms to classify individual
consumers who exhibit similar purchase history into specific groups.
The review of extant literature shows that studies to understand the behavior of
women online shoppers have not been documented so far. Also, studies on online
FMCG/grocery retailing are few and far between in India. No studies have been undertaken
to profile women internet shoppers in India.
Objectives of the study
i. To profile women who shop groceries online based on demographic
characteristics
ADALYA JOURNAL
Volume 9, Issue 1, January 2020
ISSN NO: 1301-2746
http://adalyajournal.com/247
Page 6
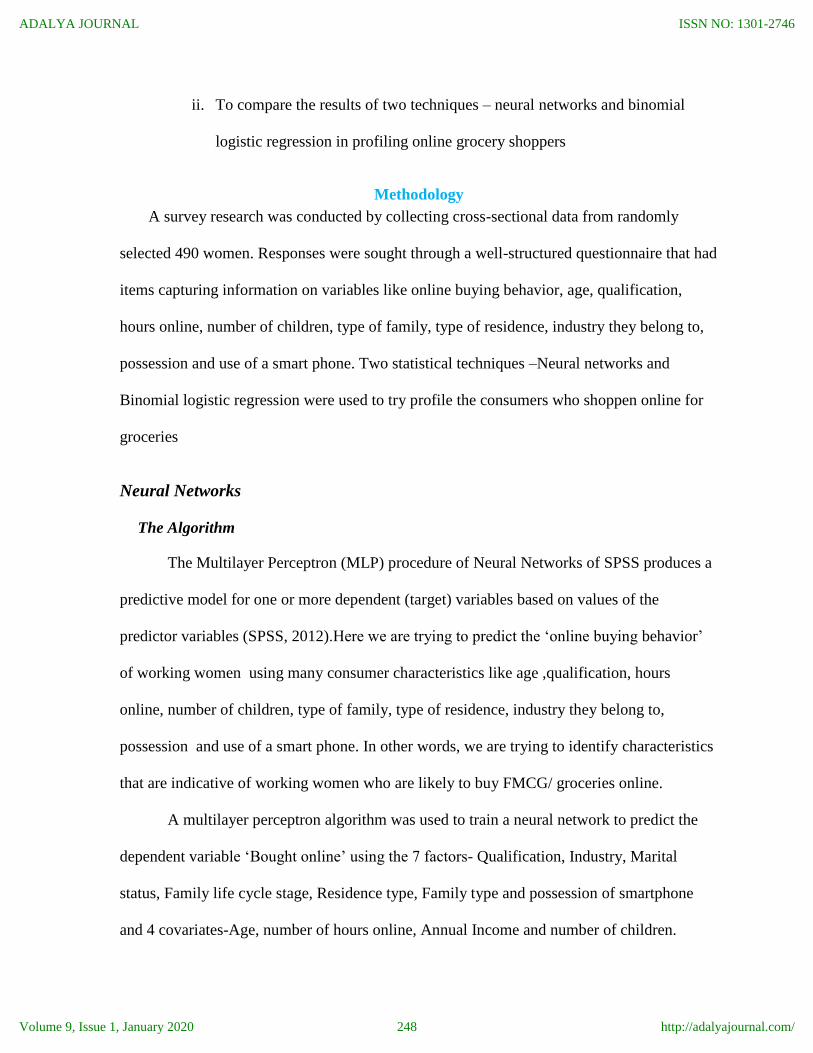
ii. To compare the results of two techniques – neural networks and binomial
logistic regression in profiling online grocery shoppers
Methodology
A survey research was conducted by collecting cross-sectional data from randomly
selected 490 women. Responses were sought through a well-structured questionnaire that had
items capturing information on variables like online buying behavior, age, qualification,
hours online, number of children, type of family, type of residence, industry they belong to,
possession and use of a smart phone. Two statistical techniques –Neural networks and
Binomial logistic regression were used to try profile the consumers who shoppen online for
groceries
Neural Networks
The Algorithm
The Multilayer Perceptron (MLP) procedure of Neural Networks of SPSS produces a
predictive model for one or more dependent (target) variables based on values of the
predictor variables (SPSS, 2012).Here we are trying to predict the ‘online buying behavior’
of working women using many consumer characteristics like age ,qualification, hours
online, number of children, type of family, type of residence, industry they belong to,
possession and use of a smart phone. In other words, we are trying to identify characteristics
that are indicative of working women who are likely to buy FMCG/ groceries online.
A multilayer perceptron algorithm was used to train a neural network to predict the
dependent variable ‘Bought online’ using the 7 factors- Qualification, Industry, Marital
status, Family life cycle stage, Residence type, Family type and possession of smartphone
and 4 covariates-Age, number of hours online, Annual Income and number of children.
ADALYA JOURNAL
Volume 9, Issue 1, January 2020
ISSN NO: 1301-2746
http://adalyajournal.com/248
Page 7
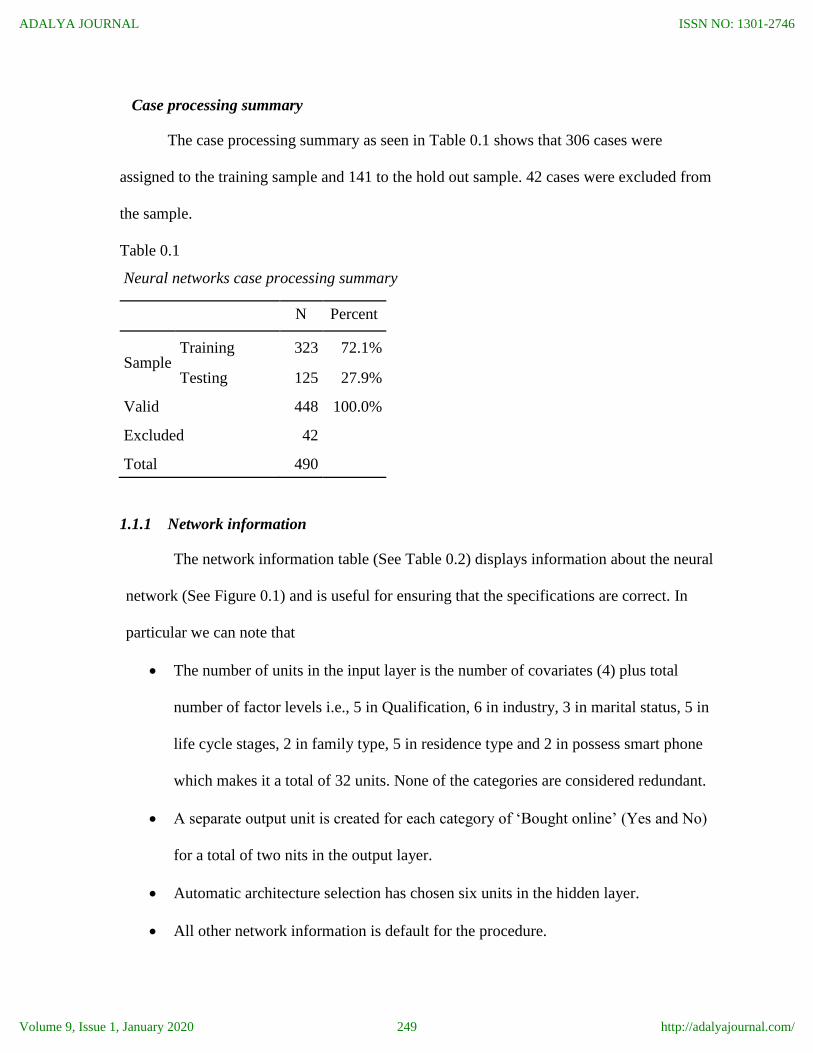
Case processing summary
The case processing summary as seen in Table 0.1 shows that 306 cases were
assigned to the training sample and 141 to the hold out sample. 42 cases were excluded from
the sample.
Table 0.1
Neural networks case processing summary
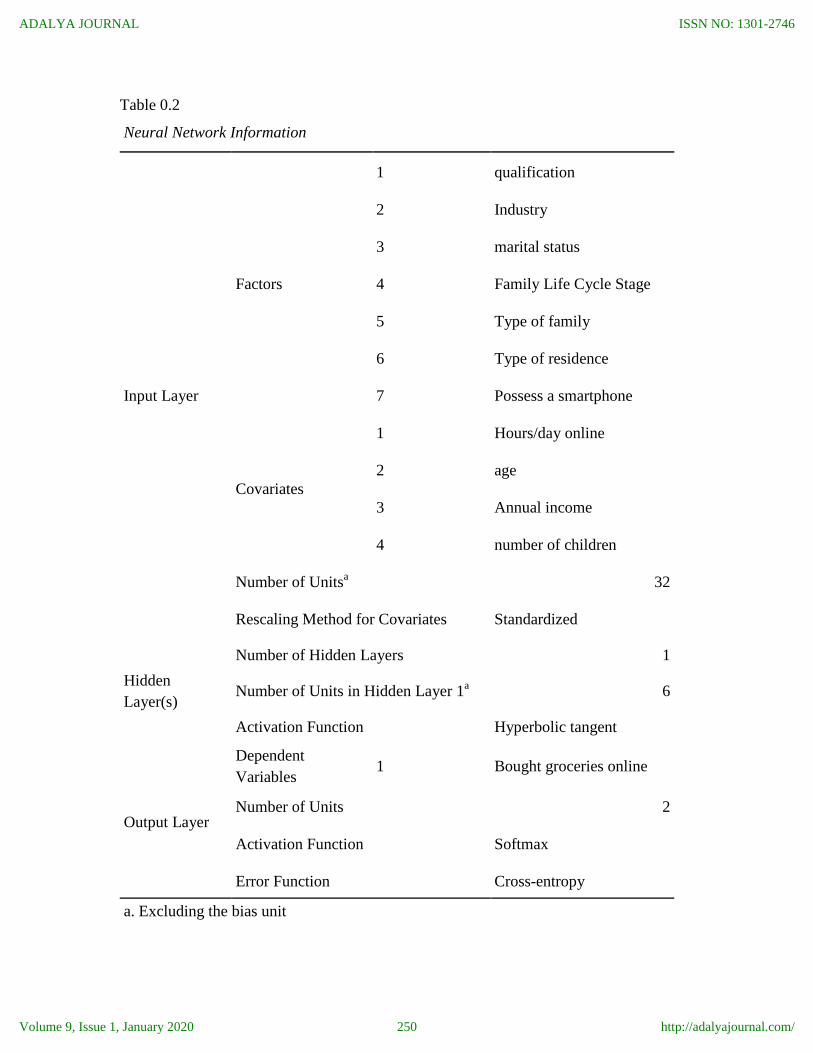
1.1.1 Network information
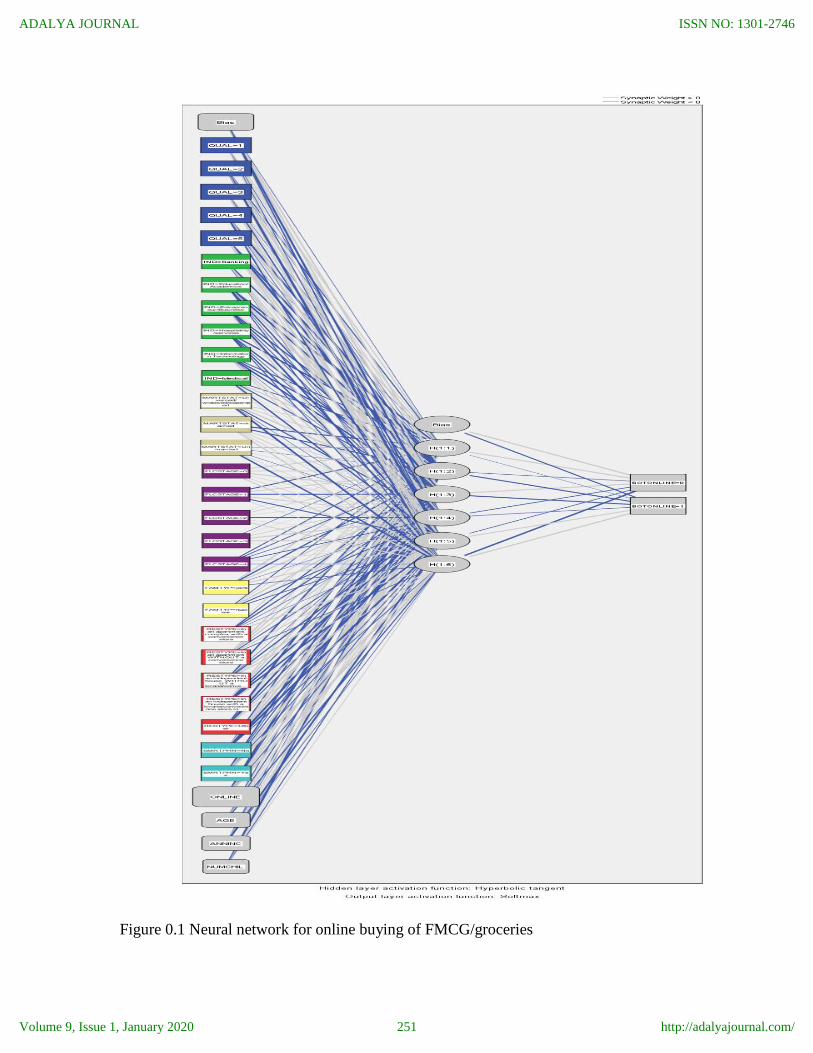
The network information table (See Table 0.2) displays information about the neural
network (See Figure 0.1) and is useful for ensuring that the specifications are correct. In
particular we can note that
The number of units in the input layer is the number of covariates (4) plus total
number of factor levels i.e., 5 in Qualification, 6 in industry, 3 in marital status, 5 in
life cycle stages, 2 in family type, 5 in residence type and 2 in possess smart phone
which makes it a total of 32 units. None of the categories are considered redundant.
A separate output unit is created for each category of ‘Bought online’ (Yes and No)
for a total of two nits in the output layer.
Automatic architecture selection has chosen six units in the hidden layer.
All other network information is default for the procedure.
N Percent
Sample Training 323 72.1%
Testing 125 27.9%
Valid 448 100.0%
Excluded 42
Total 490
ADALYA JOURNAL
Volume 9, Issue 1, January 2020
ISSN NO: 1301-2746
http://adalyajournal.com/249
Page 8
Table 0.2
Neural Network Information
Input Layer
Factors
1 qualification
2 Industry
3 marital status
4 Family Life Cycle Stage
5 Type of family
6 Type of residence
7 Possess a smartphone
Covariates
1 Hours/day online
2 age
3 Annual income
4 number of children
Number of Unitsa 32
Rescaling Method for Covariates Standardized
Hidden
Layer(s)
Number of Hidden Layers 1
Number of Units in Hidden Layer 1a 6
Activation Function Hyperbolic tangent
Output Layer
Dependent
Variables 1 Bought groceries online
Number of Units 2
Activation Function Softmax
Error Function Cross-entropy
a. Excluding the bias unit
ADALYA JOURNAL
Volume 9, Issue 1, January 2020
ISSN NO: 1301-2746
http://adalyajournal.com/250
Page 9
Figure 0.1 Neural network for online buying of FMCG/groceries
ADALYA JOURNAL
Volume 9, Issue 1, January 2020
ISSN NO: 1301-2746
http://adalyajournal.com/251
Page 10
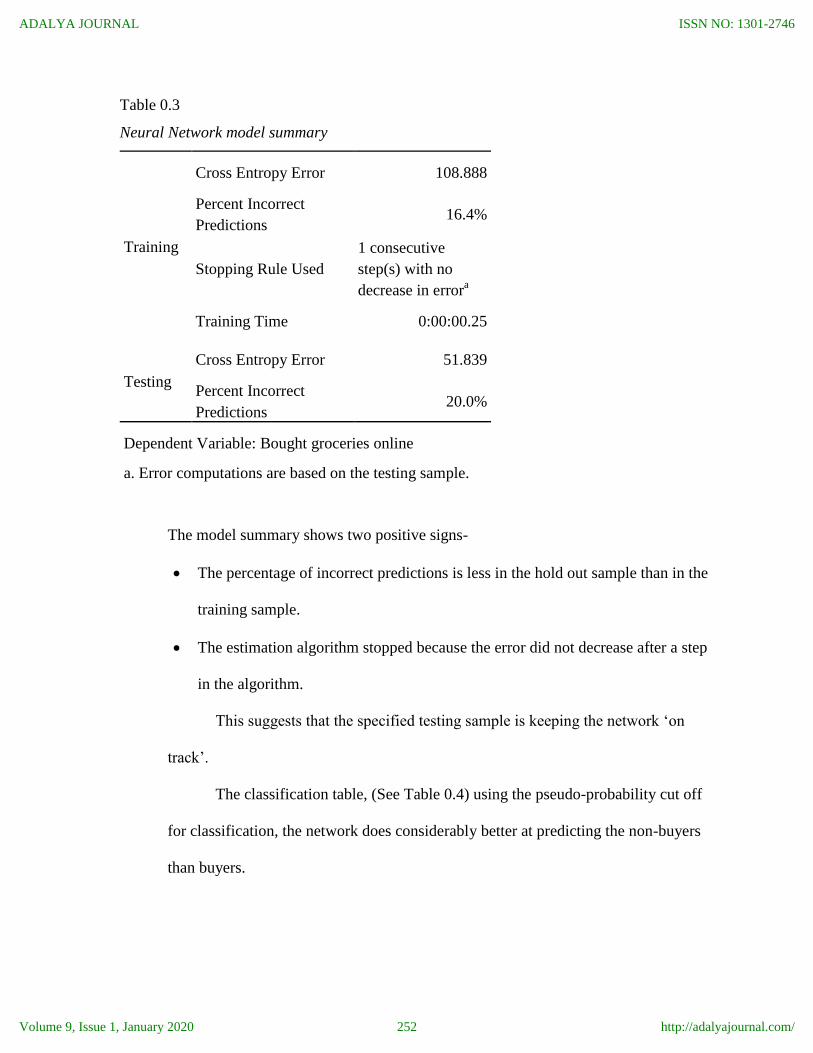
Table 0.3
Neural Network model summary
Training
Cross Entropy Error 108.888
Percent Incorrect
Predictions 16.4%
Stopping Rule Used
1 consecutive
step(s) with no
decrease in errora
Training Time 0:00:00.25
Testing
Cross Entropy Error 51.839
Percent Incorrect
Predictions 20.0%
Dependent Variable: Bought groceries online
a. Error computations are based on the testing sample.
The model summary shows two positive signs-
The percentage of incorrect predictions is less in the hold out sample than in the
training sample.
The estimation algorithm stopped because the error did not decrease after a step
in the algorithm.
This suggests that the specified testing sample is keeping the network ‘on
track’.
The classification table, (See Table 0.4) using the pseudo-probability cut off
for classification, the network does considerably better at predicting the non-buyers
than buyers.
ADALYA JOURNAL
Volume 9, Issue 1, January 2020
ISSN NO: 1301-2746
http://adalyajournal.com/252
Page 11
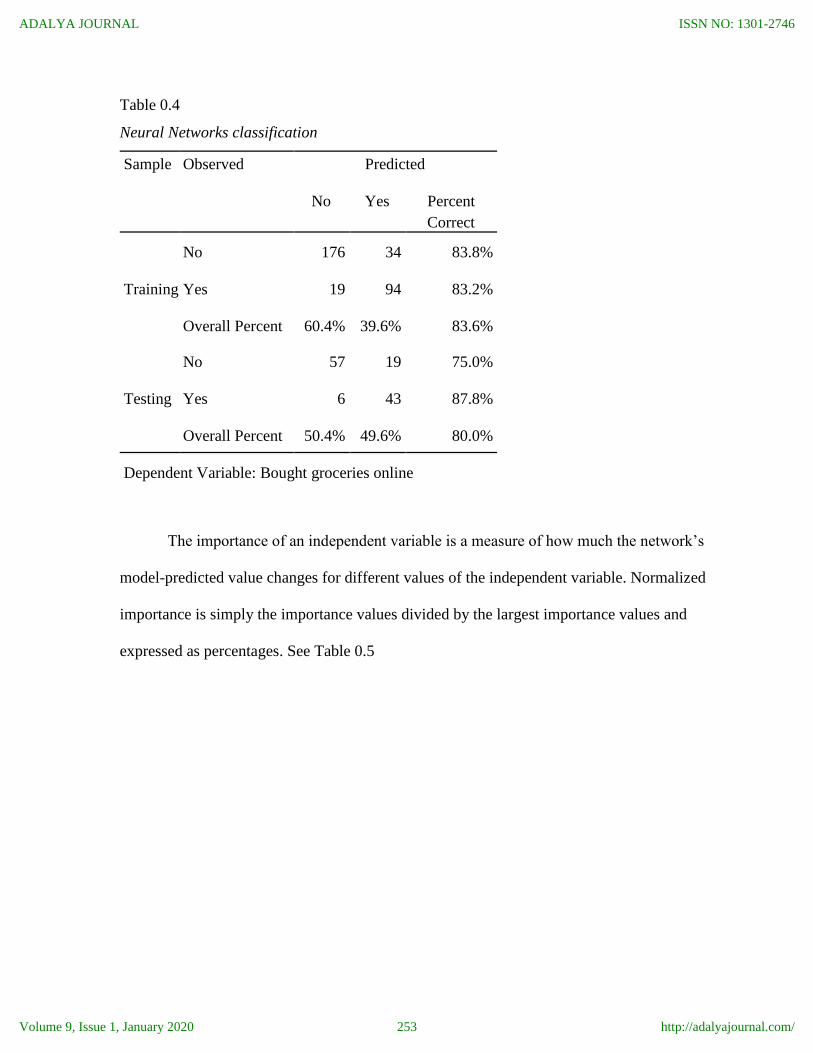
Table 0.4
Neural Networks classification
Sample Observed Predicted
No Yes Percent
Correct
Training
No 176 34 83.8%
Yes 19 94 83.2%
Overall Percent 60.4% 39.6% 83.6%
Testing
No 57 19 75.0%
Yes 6 43 87.8%
Overall Percent 50.4% 49.6% 80.0%
Dependent Variable: Bought groceries online
The importance of an independent variable is a measure of how much the network’s
model-predicted value changes for different values of the independent variable. Normalized
importance is simply the importance values divided by the largest importance values and
expressed as percentages. See Table 0.5
ADALYA JOURNAL
Volume 9, Issue 1, January 2020
ISSN NO: 1301-2746
http://adalyajournal.com/253
Page 12
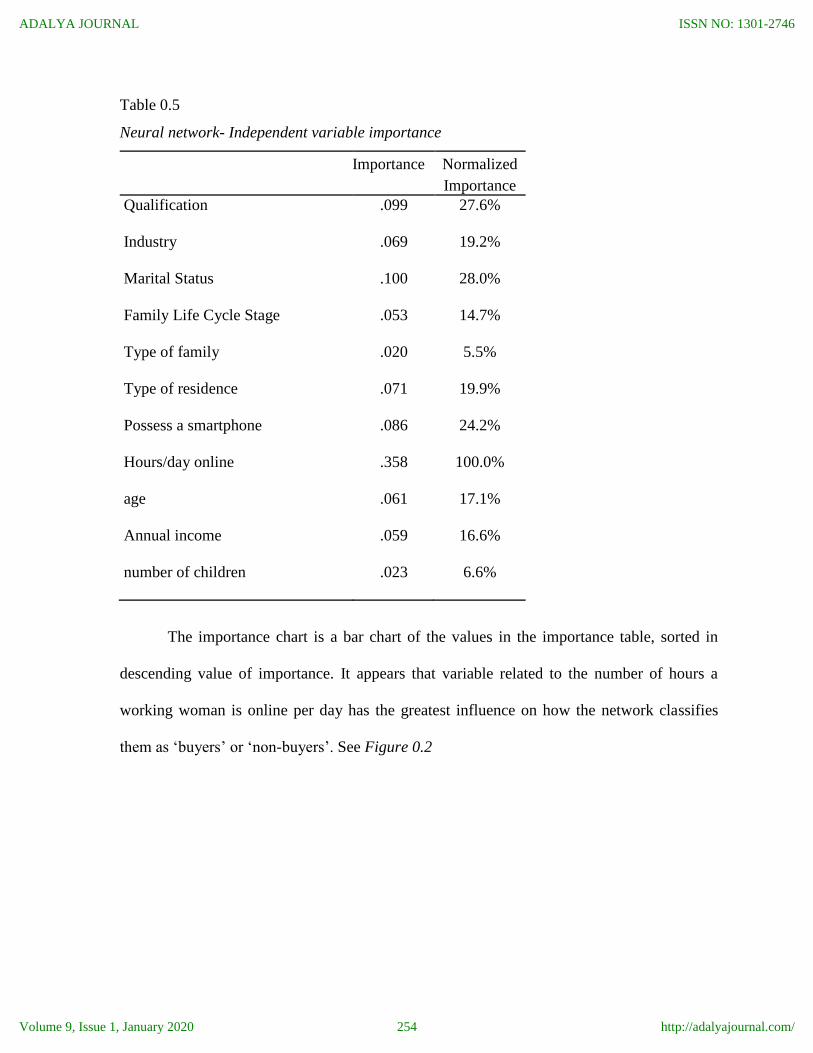
Table 0.5
Neural network- Independent variable importance
Importance Normalized
Importance
Qualification .099 27.6%
Industry .069 19.2%
Marital Status .100 28.0%
Family Life Cycle Stage .053 14.7%
Type of family .020 5.5%
Type of residence .071 19.9%
Possess a smartphone .086 24.2%
Hours/day online .358 100.0%
age .061 17.1%
Annual income .059 16.6%
number of children .023 6.6%
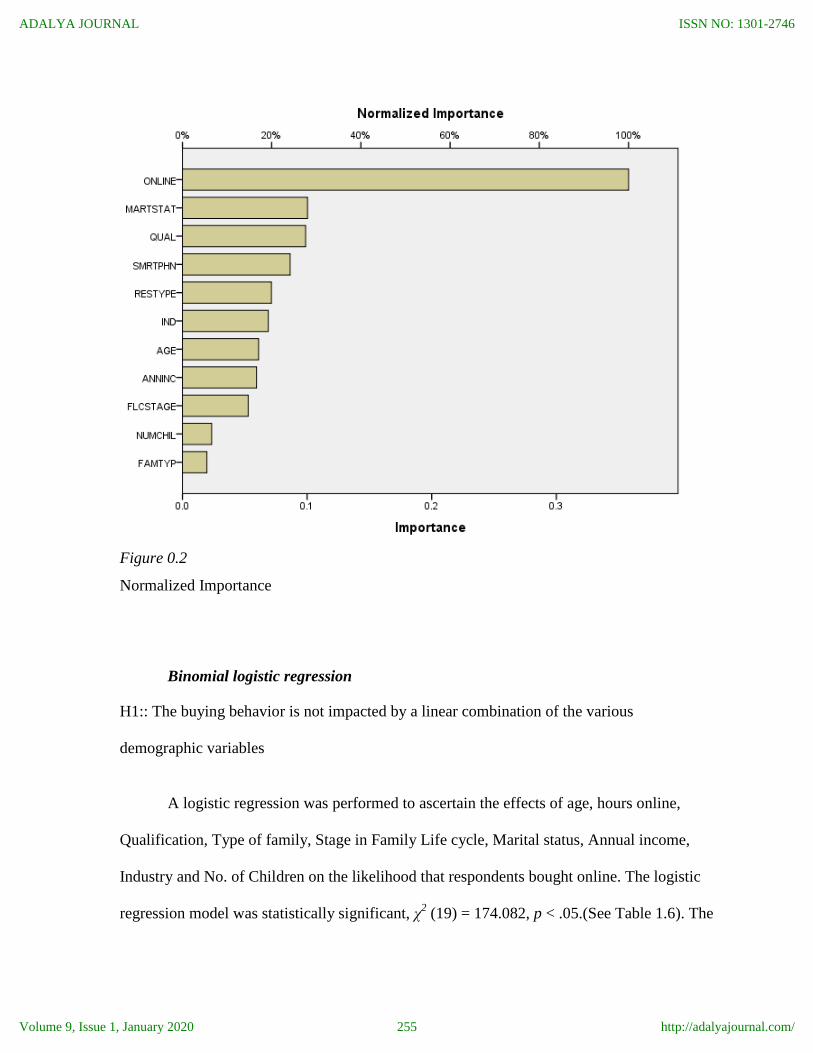
The importance chart is a bar chart of the values in the importance table, sorted in
descending value of importance. It appears that variable related to the number of hours a
working woman is online per day has the greatest influence on how the network classifies
them as ‘buyers’ or ‘non-buyers’. See Figure 0.2
ADALYA JOURNAL
Volume 9, Issue 1, January 2020
ISSN NO: 1301-2746
http://adalyajournal.com/254
Page 13
Figure 0.2
Normalized Importance
Binomial logistic regression
H1:: The buying behavior is not impacted by a linear combination of the various
demographic variables
A logistic regression was performed to ascertain the effects of age, hours online,
Qualification, Type of family, Stage in Family Life cycle, Marital status, Annual income,
Industry and No. of Children on the likelihood that respondents bought online. The logistic
regression model was statistically significant, χ2 (19) = 174.082, p < .05.(See Table 1.6). The
ADALYA JOURNAL
Volume 9, Issue 1, January 2020
ISSN NO: 1301-2746
http://adalyajournal.com/255
Page 14
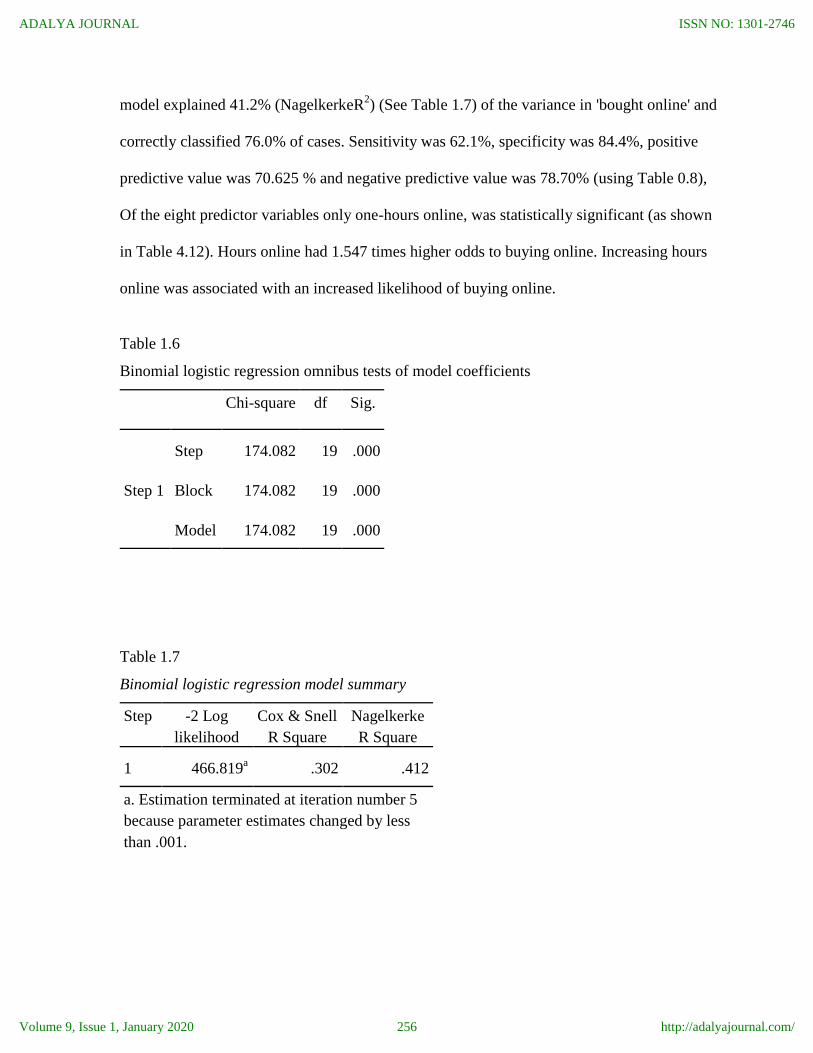
model explained 41.2% (NagelkerkeR2) (See Table 1.7) of the variance in 'bought online' and
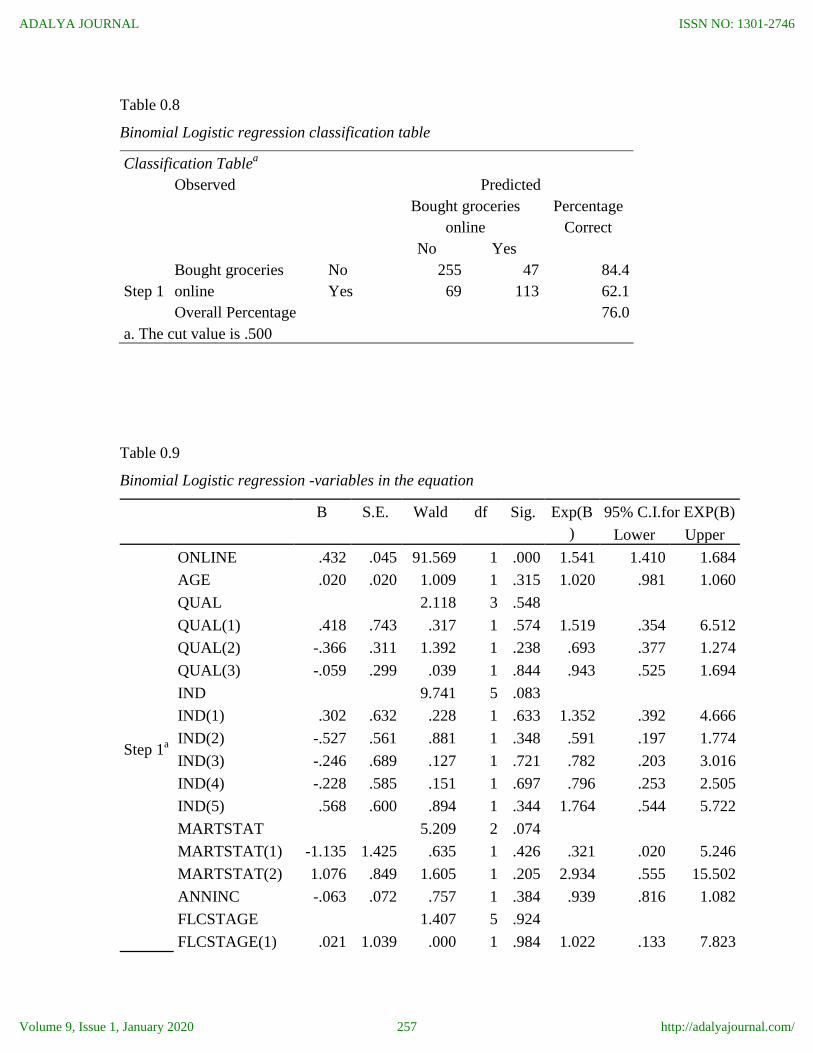
correctly classified 76.0% of cases. Sensitivity was 62.1%, specificity was 84.4%, positive
predictive value was 70.625 % and negative predictive value was 78.70% (using Table 0.8),
Of the eight predictor variables only one-hours online, was statistically significant (as shown
in Table 4.12). Hours online had 1.547 times higher odds to buying online. Increasing hours
online was associated with an increased likelihood of buying online.
Table 1.6
Binomial logistic regression omnibus tests of model coefficients
Chi-square df Sig.
Step 1
Step 174.082 19 .000
Block 174.082 19 .000
Model 174.082 19 .000
Table 1.7
Binomial logistic regression model summary
Step -2 Log
likelihood
Cox & Snell
R Square
Nagelkerke
R Square
1 466.819a .302 .412
a. Estimation terminated at iteration number 5
because parameter estimates changed by less
than .001.
ADALYA JOURNAL
Volume 9, Issue 1, January 2020
ISSN NO: 1301-2746
http://adalyajournal.com/256
Page 15
Table 0.8
Binomial Logistic regression classification table
Classification Tablea
Observed Predicted
Bought groceries
online
Percentage
Correct
No Yes
Step 1
Bought groceries
online
No 255 47 84.4
Yes 69 113 62.1
Overall Percentage 76.0
a. The cut value is .500
Table 0.9
Binomial Logistic regression -variables in the equation
B S.E. Wald df Sig. Exp(B
)
95% C.I.for EXP(B)
Lower Upper
Step 1a
ONLINE .432 .045 91.569 1 .000 1.541 1.410 1.684
AGE .020 .020 1.009 1 .315 1.020 .981 1.060
QUAL 2.118 3 .548
QUAL(1) .418 .743 .317 1 .574 1.519 .354 6.512
QUAL(2) -.366 .311 1.392 1 .238 .693 .377 1.274
QUAL(3) -.059 .299 .039 1 .844 .943 .525 1.694
IND 9.741 5 .083
IND(1) .302 .632 .228 1 .633 1.352 .392 4.666
IND(2) -.527 .561 .881 1 .348 .591 .197 1.774
IND(3) -.246 .689 .127 1 .721 .782 .203 3.016
IND(4) -.228 .585 .151 1 .697 .796 .253 2.505
IND(5) .568 .600 .894 1 .344 1.764 .544 5.722
MARTSTAT 5.209 2 .074
MARTSTAT(1) -1.135 1.425 .635 1 .426 .321 .020 5.246
MARTSTAT(2) 1.076 .849 1.605 1 .205 2.934 .555 15.502
ANNINC -.063 .072 .757 1 .384 .939 .816 1.082
FLCSTAGE 1.407 5 .924
FLCSTAGE(1) .021 1.039 .000 1 .984 1.022 .133 7.823
ADALYA JOURNAL
Volume 9, Issue 1, January 2020
ISSN NO: 1301-2746
http://adalyajournal.com/257
Page 16
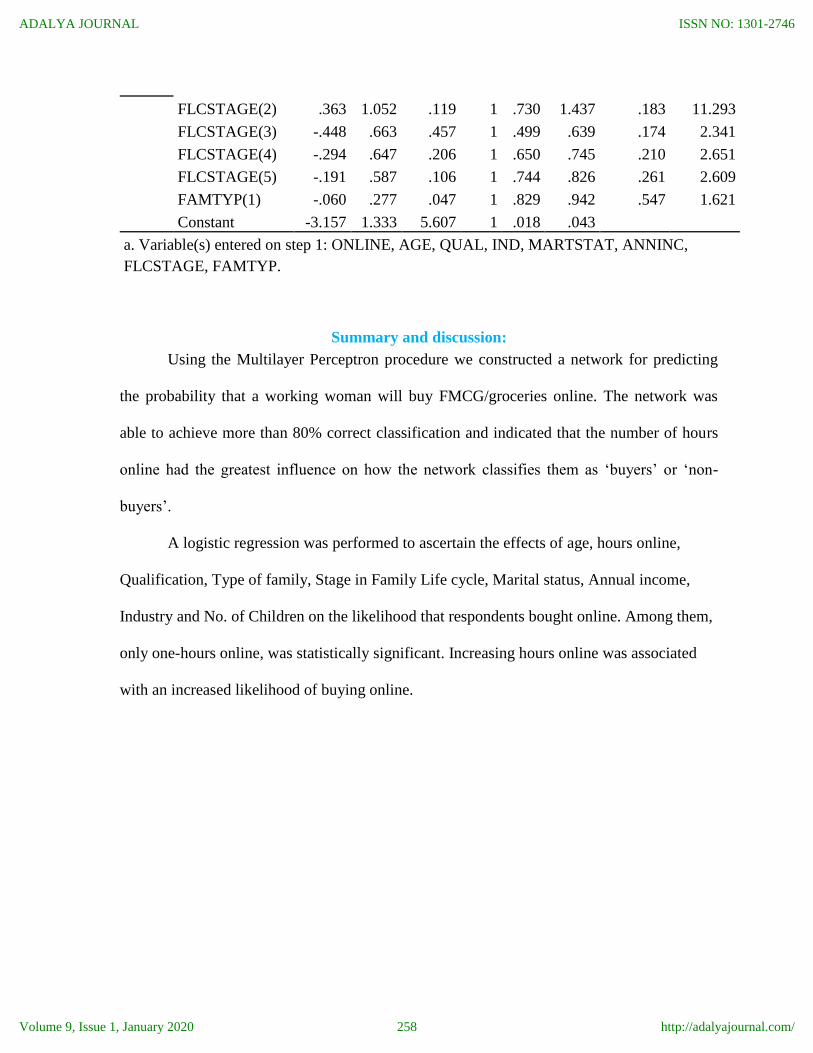
FLCSTAGE(2) .363 1.052 .119 1 .730 1.437 .183 11.293
FLCSTAGE(3) -.448 .663 .457 1 .499 .639 .174 2.341
FLCSTAGE(4) -.294 .647 .206 1 .650 .745 .210 2.651
FLCSTAGE(5) -.191 .587 .106 1 .744 .826 .261 2.609
FAMTYP(1) -.060 .277 .047 1 .829 .942 .547 1.621
Constant -3.157 1.333 5.607 1 .018 .043
a. Variable(s) entered on step 1: ONLINE, AGE, QUAL, IND, MARTSTAT, ANNINC,
FLCSTAGE, FAMTYP.
Summary and discussion:
Using the Multilayer Perceptron procedure we constructed a network for predicting
the probability that a working woman will buy FMCG/groceries online. The network was
able to achieve more than 80% correct classification and indicated that the number of hours
online had the greatest influence on how the network classifies them as ‘buyers’ or ‘non-
buyers’.
A logistic regression was performed to ascertain the effects of age, hours online,
Qualification, Type of family, Stage in Family Life cycle, Marital status, Annual income,
Industry and No. of Children on the likelihood that respondents bought online. Among them,
only one-hours online, was statistically significant. Increasing hours online was associated
with an increased likelihood of buying online.
ADALYA JOURNAL
Volume 9, Issue 1, January 2020
ISSN NO: 1301-2746
http://adalyajournal.com/258
Page 17
REFERENCES
Brashear, T. G., Kashyap, V., Musante, M. D. & Donthu, N. (2009). A profile of the internet
shopper: evidence from six countries. The Journal of Marketing Theory and Practice,
17(3), 267–282.
Fares, N., Lebbar, M. & Sbihi, N. (2018). A Customer Profiling’Machine Learning
Approach, for In-store Sales in Fast Fashion. In International Conference on Advanced
Intelligent Systems for Sustainable Development (pp. 586–591).
Handa, M. & Gupta, N. (2009). Gender influence on the innovativeness of young urban
Indian online shoppers. Vision: The Journal of Business Perspective, 13(2), 25–32.
Hansen, T. (2005). Consumer adoption of online grocery buying: a discriminant analysis.
International Journal of Retail \& Distribution Management, 33(2), 101–121.
Keh, H. T. & Shieh, E. (2001). Online grocery retailing: success factors and potential pitfalls.
Business Horizons, 44(4), 73–83.
Lynch, P. D. & Beck, J. C. (2001). Profiles of internet buyers in 20 countries: evidence for
region-specific strategies. Journal of International Business Studies, 32(4), 725–748.
Parikh, D. (2006). Profiling internet shoppers: a study of expected adoption of online
shopping in India. IIMB Management Review, 18(3), 221–231.
SPSS, I. (2012). Neural Networks 21.
Walters, M. & Bekker, J. (2017). Customer super-profiling demonstrator to enable efficient
targeting in marketing campaigns. South African Journal of Industrial Engineering, 28(3),
113–127.
Yoseph, F., Malim, N. H. A. H. & AlMalaily, M. (2019). NEW BEHAVIORAL
SEGMENTATION METHODS TO UNDERSTAND CONSUMERS IN RETAIL
INDUSTRY.
Zhou, L., Dai, L. & Zhang, D. (2007). Online shopping acceptance model-A critical survey
of consumer factors in online shopping. Journal of Electronic Commerce Research, 8(1),
41–62.
ADALYA JOURNAL
Volume 9, Issue 1, January 2020
ISSN NO: 1301-2746
http://adalyajournal.com/259