Page 1
California State University, San Bernardino California State University, San Bernardino
CSUSB ScholarWorks CSUSB ScholarWorks
Theses Digitization Project John M. Pfau Library
2003
Customer satisfaction in communicating with reservation staffs Customer satisfaction in communicating with reservation staffs
of Thai Airways International of Thai Airways International
Alina Homsangpradit
Follow this and additional works at: https://scholarworks.lib.csusb.edu/etd-project
Part of the Business Administration, Management, and Operations Commons
Recommended Citation Recommended Citation Homsangpradit, Alina, "Customer satisfaction in communicating with reservation staffs of Thai Airways International" (2003). Theses Digitization Project. 2183. https://scholarworks.lib.csusb.edu/etd-project/2183
This Thesis is brought to you for free and open access by the John M. Pfau Library at CSUSB ScholarWorks. It has been accepted for inclusion in Theses Digitization Project by an authorized administrator of CSUSB ScholarWorks. For more information, please contact [email protected] .
Page 2
CUSTOMER SATISFACTION IN COMMUNICATING WITH
RESERVATION STAFFS OF THAI AIRWAYS INTERNATIONAL
A Thesis
Presented to the
Faculty of
California State University,
San Bernardino
In Partial Fulfillment
of the Requirements for the Degree
Master of Arts
in
Interdisciplinary Studies
by
Alina Homsangpradit
March 2003
Page 3
CUSTOMER SATISFACTION IN COMMUNICATING WITH
RESERVATION STAFFS OF THAI AIRWAYS INTERNATIONAL
A Thesis
Presented to the
Faculty of
California State University,
San Bernardino
by
Alina Homsangpradit
March 2003
Approved by:
Eric Newman, Marketing
Page 4
ABSTRACT
Purpose: The purpose of this research study is to
investigate 1) the correlation between customer
satisfaction and demographic data, 2) the correlation
between the level of customer satisfaction towards THAI'S
reservation staff and customer's attitude, and 3) the
correlation between customer satisfaction and the
communication behavior of THAI'S reservation staff.
Subjects and Settings: One hundred fifty
questionnaires were handed out to respondents at three
locations in Los Angeles. The questionnaires were handed
out at the THAI airport counter at Los Angeles
International Airport, THAI'S main ticketing counter at
the main office in Los Angeles, California, and the
Thaitown area in Hollywood, California. One hundred fifty
questionnaires were handed out, one hundred thirty nine
questionnaires were returned but only one hundred twenty
one surveys were completed. The sample population
consisted of sixty-six (66%) males and fifty-five (55%)
females. The sample population range in ages from
seventeen to over fifty-six.
This research study used questionnaires to collect
data systematically. Participants were customers of THAI
in the Los Angeles area and were randomly selected at
iii
Page 5
three locations. Participants used a data collection
questionnaire to provide demographic information and also
to rate their level of satisfaction with various aspects
of THAI'S service.
The research results show as follows: No correlation
was reported between age, gender, educational level of
customers and customer satisfaction with the reservation
staff of THAI. The communication behavior of the
reservation staff of THAI is not correlated to the
customer satisfaction towards the service of THAI'S
reservation staff. However, customer's level of income and
customer's attitude toward THAI'S reservation staff
correlated to customer satisfaction.
Within this study sample, customer satisfaction is
affected by customer level of income. Along with this,
customer satisfaction is also affected by customer
attitude towards THAI'S reservation staff. Therefore it
can be concluded that interventions to positively improve
customer attitude towards THAI's reservation staff will
result in increased customer satisfaction.
iv
Page 6
TABLE OF CONTENTS . .
ABSTRACT................................... ...............iii
LIST OF TABLES............................ '............. ix
CHAPTER ONE: INTRODUCTION
Background............................. ............ 1
Statement of Problems........................... . . 2
Purpose of Study ........... 3
Hypotheses ......................... 4
Organization of the Study................. 4
Definition of Terms . ............................... 5
Limitations ........................................ 6
CHAPTER TWO: LITERATURE REVIEW
Background on the Airline Industry ............... 7
Regulation and Deregulation ....................... 8
International Reform ............................... 9
Background on Thai Airways International ......... 10
Company Background......................... 10
Overseas Offices .............................. 11
Thai Airways in Los Angeles................. 11
Reservation Department of Thai in LosAngeles............ 12
Reservation and Communication ............... 13
Why is Consumer Satisfaction Important? .......... 15
What is Consumer Satisfaction?....... 15
Confirmation/Disconfirmation of Expectations Paradigm............................... 17
v
Page 7
Factor Structure of Consumer Satisfaction ........ 19
Affect in Consumer Satisfaction ................... 20
General States of Affect .......................... 23
Consumption Emotion andSatisfaction/Dissatisfaction ...................... 26
Incorporating Desires in ConsumerSatisfaction ....................................... 28
Market-Level View of Satisfaction ................ 30
How is Consumer Satisfaction Measured? ........... 33
Antecedents of Consumer Satisfaction ............. 34
Objective versus Perceived Performance ........... 35
Mixed Findings..................................... 3 6
Consequences of Consumer Satisfaction ............ 37
Consumer Satisfaction and Profitability • ; , for a Firm.................................... 37
Attribution Theory and Consumer Satisfaction .... 40
, Consumer Responses toSatisfaction/Dissatisfaction ...................... 41
Complaining Behavior as a Reaction toDissatisfaction ................................. 42
Consumer Satisfaction as a Mediator ofAttitude Change .................................... 43
What are Attitudes?................................ 44
Why do we Have Attitudes?......................... 45
Theories of Attitude Change ....................... 46
CHAPTER THREE: METHODOLOGY
Population.......................................... 4 9
Questionnaire Design ............................... 50
vi
Page 8
Data Collection Method ............................ 51
Data Entry and Analysis...................... 53
Samples............................................. 53
Scoring Criteria ................................... 54
Statistical Analysis ............................... 55
CHAPTER FOUR: RESULTS
Descriptive Analysis ............................... 56
Hypothesis Testing ................................. 56
Descriptive Analysis of Respondents .............. 57
General Background of Respondents ............ 57
Respondents' Information about Service of Reservation................................ 59
Customer's Satisfaction towardReservation Staff ............ 61
Customer Attitude toward Staff .............. 68
Hypothesis Testing ................................. 70
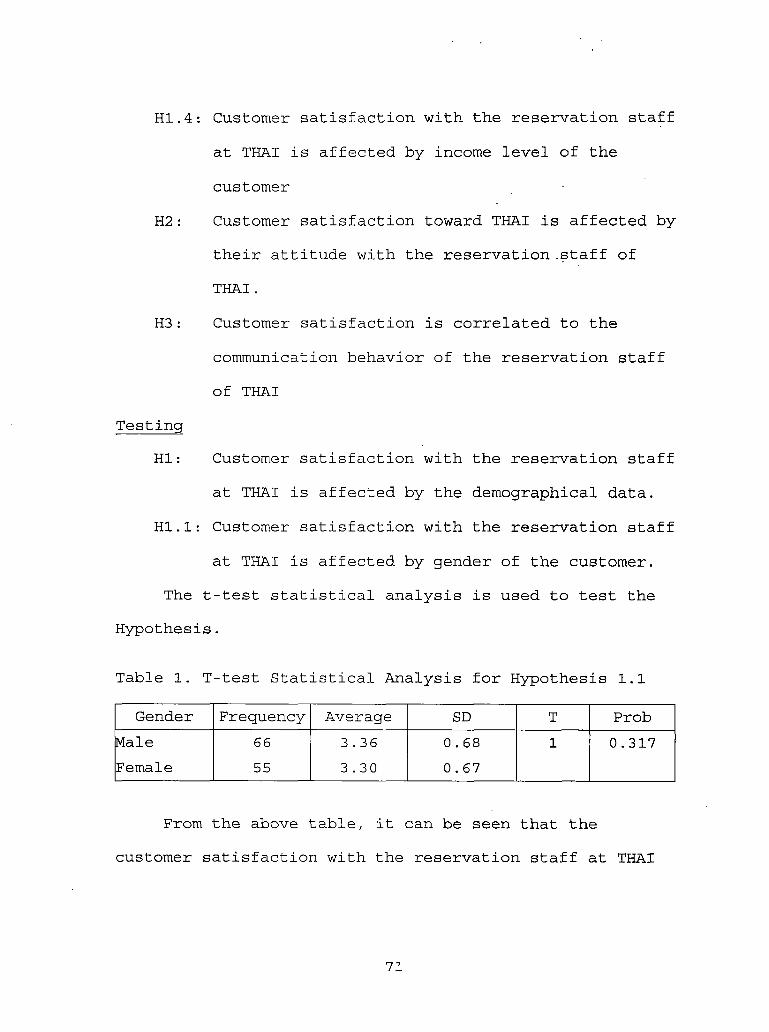
Testing....................................... 71
CHAPTER FIVE: CONCLUSIONS AND RECOMMENDATIONS FORFUTURE RESEARCH .......................... 77
Conclusions........................................ 78
Demographical Data of the Samples........... 78
Service....................................... 79
Customer Satisfaction with theReservation Service .......................... 79
Customer Attitude towards theReservation Staff ............................ 80
Recommendation to Improve the ServiceQuality of Reservation Staff ................ 80
vii
Page 9
Recommendations for Future Research ..............
APPENDIX A: LETTER TO RESPONDENTS ......................
APPENDIX B: QUESTIONNAIRE ...............................
APPENDIX C: TABLES ......................................
REFERENCES...................................... ........
82
84
86
91
99
viii
Page 10
LIST OF TABLES
Table 1. T-test Statistical Analysis forHypothesis 1.1................................. 71
Table 2. Statistical Analysis for Hypothesis 1.2 ...... 72
Table 3. Statistical Analysis for Education ........... 73
Table 4. Statistical Analysis for Annual Income ....... 74
Table 5. Customer's Attitude towards ReservationStaff........................................... 75
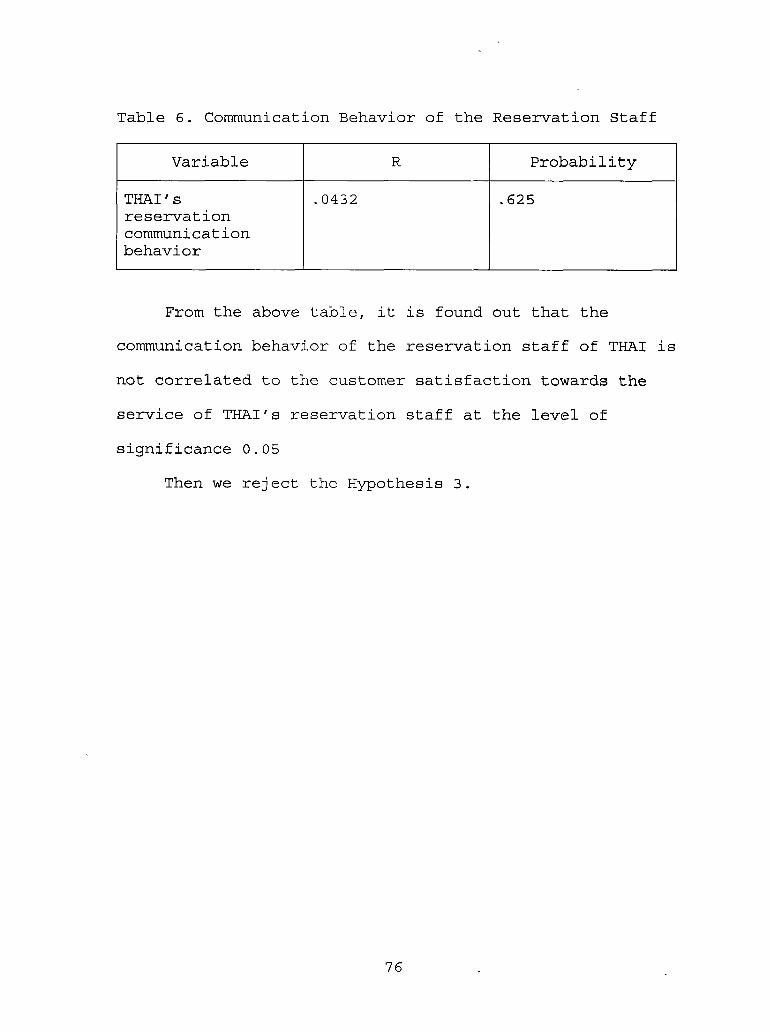
Table 6. Communication Behavior of the ReservationStaff........................................... 76
ix
Page 11
CHAPTER ONE
INTRODUCTION
Background
In business, customer satisfaction is one of the most
important factors leading to customer loyalty, which
eventually will result in repeat sales. Customer's
satisfaction level is positively correlated to the level
of the quality of service. In the airline industry, the
most important thing an airline sells is its services. In
order to increase the level of customer satisfaction,
every employee who comes into contact with a customer must
be "service oriented" this is what helps make the airline
industry known for its care and courteous treatment of its
passengers. Satisfaction is usually conceived of as a
function of a customer's expectations prior to a purchase,
and perceptions of performance after a purchase (Oliver,
1996). Customers start forming their satisfaction opinion
as soon as they interact with the first point of contact.
For the airline industry the reservation staff or customer
service staff are usually in the first line of contact
with the customers. The reservation staff is becoming more
important as their communication skills and behavior can
provide comfort and reassurance to the existing and
1
Page 12
prospective customers. Cushman (1985) said that
communication is an important tool for establishing,
maintaining, and terminating personal relationships.
The focus of this study is customer satisfaction with
the reservation staff communication behavior of Thai
Airways International Public Company Limited (North
America) THAI. In our world of instant communication,
satisfying customers is a challenge. Both listening skills
and communication skills are essential to the reservation
staff to increase customer satisfaction. Therefore, one
way to improve THAI customer satisfaction is to improve
listening and communication skills of THAI reservation
staff in order to effectively communicate with their
customers.
Statement of Problems
Due to the importance of customer satisfaction, it is
crucial that companies must improve their service in order
to compete in this fiercely competitive industry. The
transpacific airline sector is one of the most competitive
sectors in the airline industry. Most flights are long
with the shortest flight from Los Angeles to Japan taking
twelve hours. Although in-flight service is the heart of
the battle, the initial contact between the potential
2
Page 13
customers with the reservation staff can make or break the
sales. It is apparent that to improve customer
satisfaction at the first point of the contact, the
reservation staff, must be improved.
Purpose of Study
The study has two main purposes. The fyrst purpose isi
to evaluate the importance of customer satisfaction with
THAI'S reservation staff. The second purpose is to
understand the impact of communication behavior and skills
of THAI'S reservation staff on customer satisfaction
level.
The purpose can be decomposed into the following
objectives of study:
1. To investigate if the customer satisfaction
level with THAI'S reservation staff affect the
customer attitude.
2. To examine correlation between customer
satisfaction and the THAI's communication
behavior.
3. To examine the correlation between the THAI'S
customer satisfaction and the demographic data.
3
Page 14
The objective of this study is to provide the
findings to the management of THAI in Los Angeles to
improve the service quality at the concerned departments.
.The study seeks to answer the following questions:
1. Is customer satisfaction affected by their
demographical data?
2. Is customer attitude toward THAI affected their
satisfaction with reservation staff?
3. Is customer satisfaction correlated to the
communication behavior of THAI?
Hypotheses
a. Customer satisfaction is significantly affected
by the demographical data.
b. Customer attitude toward THAI affected their
satisfaction with the reservation staffs of
THAI.
c. Customer satisfaction is directly correlated to
the communication behavior of THAI
Organization of the Study
This chapter provides background of the research
problems, statement of problems, purpose of study,
hypothesis, organization of the study, limitations, and
definition of terms. Chapter two provides a comprehensive
4
Page 15
literature review where background of airline industry and
other principles in customer satisfaction are reviewed. A
brief review of the airline situations is presented to
give an idea of the circumstances.
Chapter three describes the methodology used in this
study. Chapter four presents the findings. The statistical
evaluations of' customer satisfaction with reservation
staff of THAI are presented. The findings are compared to
results of other studies in the same area. Chapter five
provides conclusions, implications, and recommendations
for future research direction.
Definition of Terms
THAI - Thai Airways International Public Company Limited
but in this paper THAI means the operation of Thai
Airways International Public Company Limited in North
America region.
Reservation Staff - THAI's employees who have contact with
customers via telephone or in persons, by giving customers
information in reservation service, answering customers'
questions and solving customers' problems with the
intention of using THAI'S services.
Customer - People who have contact with THAI's
reservation.
5
Page 16
Communication Behavior - The conversation between
reservation staff of THAI and customer over the
telephone or in person. Communication behavior is
measured by verbal statement and tone of voice.
Customer Satisfaction - A customer's positive, neutral, or
negative feeling about the value received from an
organization's product or service (Harrell, 2002).
Attitude - Attitude is a person's enduring favorable or
unfavorable cognitive evaluation emotional feeling,
and action tendencies toward some object or idea
(Kolter, 1999).
Limitations
1. The population in this research is small
considering it covers only City of Los Angeles.
There may be differences between the samples and
the general population in regards to the
demographical environments, the local patronage
system, and the competition in the local market.
2. Some of the respondents answering the
questionnaires may not have given the answers
accurately because of the fear that the data,
especially the demographical one might be
misused to trespass their privacy.
6
Page 17
CHAPTER TWO
LITERATURE REVIEW
Background on the Airline Industry
Since the passage of the 1979 Airline Deregulation
Act, air travelers in the United States have enjoyed lower
fares and greater choices of services. Despite the success
of domestic liberalization in the United States, the
European Union, and elsewhere, international air travel is
still heavily regulated, and the U.S. domestic air travel
market remain closed to foreign competition.
America's closed domestic market weakens the U.S.
negotiating position abroad. Under the current policy, the
U.S. government seeks to open international markets
through its "Open Skies" initiative while keeping the
world's largest domestic market, which represents more
than one-quarter of global air travel, closed to foreign
competition. >
The events of September 11, 2001 have had some of
their worst economic effects on the airline industry,
leading to a dramatic fall-off in passenger demand and
substantially higher costs. But even before that day, the
industry was facing bad times, with few airlines
anticipating profitable performances in 2001. Some have
7
Page 18
argued that deregulation has contributed to the industry's
problems, and, furthermore, to problems for passengers.
Regulation and Deregulation
Before deregulation of the airline industry began in
1979, the Civil Aeronautics Board controlled both the
routes airlines flew and the ticket prices the charged,
with the goal of servicing public interest. With
deregulation, any domestically owned airlines that was
deemed "fit, willing, and able" by the Department of
Transportation (DOT) could fly on any domestic route. The
primary regulatory role of the DOT changed from approving
whether an airline was operating in the public interest to
deciding whether an airline was operating in accordance
with safety standards and other operating procedures.
While route schedules and pricing for the airline
industry have been largely deregulated for over 20 years,
many other aspects of the industry are still highly
regulated. Perhaps, the most important regulation comes
from local governments, which own and manage the airports
in their region and therefore control key bottlenecks to
airport services: Access to boarding gates and runways.
Most local airport commissions allocate gates without a
formal market mechanism, such as bidding process; often
8
Page 19
they require proof that the airline would operate in the
best interest of the public.
In addition, international routes have been
deregulated only gradually, through negotiated bilateral
open-skies agreements, which generally .allow airline
companies from the two countries in question to fly
between those countries without restriction. These
open-skies agreements do not create a fully competitive
market, as they do not allow foreign carriers to transport
passengers within the United States or vice versa.
In summary, even though the end-consumers for airline
tickets face a market-driven menu of prices and services,
key inputs into the industry are allocated using
non-market mechanisms. Thus, 22 years after airline
deregulation, the airline market is still partly
regulated.
International Reform
Despite the developments in other regions, problems
remain in Asian-Pacific, one of the two largest overseas
markets served by U.S. carriers. Asian-Pacific routes were
the subject of the Open Skies initiatives in the early
1980s and again in the late 1990s. Although the number of
liberalizing agreements signed was impressive, several key
9
Page 20
countries, including Japan, did not reach an agreement.
That deadlock led to protracted discussion about reforming
the existing system of agreements that dated back to 1952.
Japan is important in the Asian portion of any global
network of services because of its location and market
size. It currently generates 78 million domestic
passengers and 11 million international passengers
annually. Current technology does not enable aircraft to
fly nonstop from the United States to many major
Asian-Pacific destinations beyond Japan. Even if the
ranges were extended, many of those markets would not
justify frequent service. Japan is, therefore, a natural
Asian hub for U.S. passengers and freight carriers serving
the Asian-Pacific region.
Thai Airways International also uses Japan as a
stopover for its U.S. to Thailand flights.
Background on Thai Airways International
Company Background
Thai Airways International Public Company Limited
(THAI) is the country's national airline. THAI is the
symbol of Thailand. THAI now flies more than 72
destinations in 37 countries on four continents. THAI
flies more than 1,000 daily flights worldwide, over 500
10
Page 21
internationally. THAI is also a member of Star Alliance
comprising of Air Canada, Air New Zealand, All Nippon
Airways, Austrian Airlines, BMI British Midland,
Lufthansa, Mexicana, Scandinavian Airlines, Singapore
Airlines, United Airlines, and VARIG Airlines.
Overseas Offices
THAI has established overseas sales offices in 28 of
Thailand's top 30 tourist-generating markets. In all, THAI
operates 54 overseas offices in 40 countries around the
world. Apart from these "on-line" offices, in cities where
THAI flies, the airline also has a strong "off-line"
presence in 24 cities.
Although their primary function is to assist
passengers, sell and issue air tickets, THAI'S overseas
offices are also responsible for promoting Thailand as a
tourist and convention destination.
Thai Airways in Los Angeles
Thai Airways International Public Company Limited
(THAI) in Los Angeles is responsible for all sales and
flight operations in North America. THAI closed all of its
seven offices in North America except its office in Los
Angeles after the September 11, 2001 terrorist attacks in
New York and Washington D.C.
11
Page 22
Thai Airways International in Los Angeles office
consists of:
1. Administration Department
2. Accounting Department
3. Sales Department
4. Reservation Department
5. Airport Operations
6. Flight Operations
7. Line Station Maintenance
8. Los Angeles Cargo
9. Material Administration Division
Reservation Department of Thai in Los Angeles
The reservation department hours of operation are
Monday to Friday from 7:00 a.m. to 5:00 p.m. (Pacific
Time). The reservation staff in Los Angeles takes care of
customers all over North America.
The main responsibilities of THAI reservation staff
are:
.. 1. To provide information to customers who want to
travel to Thailand
2. To provide information to customers who want to
travel to ASIA
3. To provide flight confirmation or flight
schedules for customers before their departure
12
Page 23
4 Reserve tickets for customers
5. Assist customers with changing their flight
schedules
Reservation and Communication
Communication skills are the gear of the travel
industry and are used in every aspect of the travel
industry. A survey of all major airlines revealed that the
average time for each reservation varied from a low of one
minute to maximum of six minutes. Statistics from this
study also revealed that THAI's reservation staff handled
a high volume of calls within an hour's time. This demands
an alert mind and a temperament that can stand dealing
with never-ending succession of phone calls; each
requiring individualized treatment and service (Woodring,
1991) therefore the reservation staffs' main function is
to communicate with the customers so, communication skills
are extremely important for the reservation staff.
Harrell (2002) states "Communication is the exchange
of meaning between or among parties. It involves sharing
points of view and is at the heart of forming
relationships." You simply cannot connect with customers
unless you communicate with them.
According to Schiffman (1978), "Communication is the
transmission of a message from a sender to a receiver by
13
Page 24
means of a signal of some sort sent through a channel of
some,? sort."
Cooley describes communication as "the mechanism
through which human relations exist and develop-all
symbols of the mind, together with the means of conveying
them through space and preserving them in time" (1909) .
Communication is natural, necessary, omnipresent
activity (Schramm & Porter, 1982). Communication pervades
everything humans do. It is the stuff of which human
relations are made. It is a current that has flowed
through all human history, constantly extending our senses
and or channels of information. Every day, humans
communicate, speak, write, and draw, to let people know
what we are thinking and feeling. Berio's (1960) research
indicated that the average American spends about 70 per
cent of his/her active hours communicating
verbally-listening, speaking, reading, and writing, in
that order.
This paper will concentrate on the customer
satisfaction with the reservation staff communication
behavior of THAI in the North America region. One of the
possible ways to improve customer satisfaction of THAI is
by being able to efficiently communicate with customers.
14
Page 25
Why is Consumer Satisfaction Important?
Consumer satisfaction is important to the firm
because it is generally assumed to be a significant
determinant of•repeat sales, positive word-of-mouth, and
consumer loyalty. Satisfaction is important to the
consumer because it reflects a positive outcome from the
outlay of scarce resources and/or the fulfillment of unmet
needs (Day & Landon 1977; Landon 1977). Previous research
has demonstrated that unsatisfactory purchases, though
varying by product class or service category, appear to be
prevalent. For example, Andreasen and Best (1977) reported
that as many as one in five purchase experiences resulted
in some dissatisfaction. Thus, minimizing dissatisfaction
and maximizing satisfaction are seen as important goals
for both the firm and the consumer.
What is Consumer Satisfaction?
Kotler and Armstrong (1999) held that consumer
satisfaction depends on a product perceived performance in
delivering value relative to a buyer's expectation. If the
product performance falls short of the consumer's
expectations, the buyer is dissatisfied. If the
performance matches expectations, the buyer is satisfied.
If performance exceeds expectations, the buyer is
15
Page 26
delighted. Outstanding marketing companies go out of their
way to keep their customers satisfied. Satisfied customers
make repeat purchases, and they tell others about their
good experience with the product. The key is to match
customer expectations with the companies' performance.
Smart companies aim to delight the customers by promising
only what they can deliver, then delivering more than they
promise.
Consumer satisfaction with a product/service refers
to the favorability of the individual's subjective
evaluation of the various outcomes and experiences
associated with using or consuming the products/services
(Hunt, 1977). According to theories of buyer behavior
(Engel, Kollat, & Blackwell, 1973; Howard & Sheth, 1969),
the evaluation is based on a cognitive process in which
consumers prepare their prior expectations of product
outcomes (e.g. product performance and other important
attributes) to those actually obtained from the products.
The extent to which expectations are realized is assumed
to be directly related to the level of satisfaction
experienced. If actual product outcomes meet or exceed
those expected, satisfaction results. If, however, product
outcomes are judged below expectations, dissatisfaction
occurs. Swan and Combs (1976) have provided empirical
16
Page 27
support for these propositions. This view of customer
satisfaction/dissatisfaction has been conceptualized as
the confirmation/disconfirmation paradigm and has been
widely accepted as the process by which consumers develop
feelings of satisfaction or dissatisfaction.
Confirmation/Disconfirmation of Expectations Paradigm
At time t, a choice of a particular brand (the focal
brand) is made. The choice is based on the hierarchy of
effects process involving expectations or brand attribute
beliefs, attitudes and intentions (Oliver, 1980a). At some
subsequent time, t + 1, an occasion occurs in which the
focal brand is used. A perception of the brand's performance is triggered and the consumer evaluates the
use experience. Because evaluation implies comparison of
actual performance with some standard, three outcomes of
this evaluation are possible. Confirmation occurs when
performance matches the standard, leading to a neutral
feeling. Performance exceeding the standard results in
positive 'disconf irmation and, in turn, leads to
satisfaction. Performance below the standard creates
negative disconfirmation and, subsequently,
dissatisfaction.
17
Page 28
Other evaluative standards besides expectations have
been investigated in the literature, including desired
levels of product performance or outcomes (Westbrook &
Reiley, 1983), brand or product-category norms (Woodruff,
Cadotte, & Jenkins, 1983), and equitable performance or
outcomes (Oliver & Swan, 1989). The evaluative aspect of
the satisfaction judgment is typically assumed to vary
along a hedonic continuum, from unfavorable to favorable.
In this regard, satisfaction is generally assumed to be a
uni-dimensional concept. Although, attitude-like in some
respects, the concept of satisfaction is distinguished
from attitude towards the product or brand, which
represents a more generalized evaluation of a class of
purchase objects (Oliver, 1981).
Consumer satisfaction definitions differ in their
level of specificity. Commonly employed levels include
satisfaction with a product (Churchill & Surprenant, 1982;
Oliver & Linda, 1981; Swan & Trawick, 1981), with a
consumption experience (Bearden & Teel, 1983; Fisk &
Young, 1985), with a purchase decision (Westbrook & Newman
1978), with the salesperson (Swan & Oliver, 1989), with a
store (Oliver, 1981), and with a pre-purchase experience
(Westbrook, 1977).
18
Page 29
Factor Structure of Consumer Satisfaction
As already mentioned, it is generally assumed that
customer satisfaction is a uni-dimensional construct,
however, a few studies have investigated the possibility
that it may be multi-dimensional (Czepiel, Rosenbreg, &
Akerele, 1974; Leavitt, 1977; Oliver & Westbrook, 1982;
Swan & Combs, 1976; Maddox, 1981). The most frequently
proposed theory is a dual factor theory, which is similar
to Herzberg's two-factor theory of job satisfaction
(Herzberg, Mausner, & Snyderman, 1959). According to the
two-factor theory, satisfaction and dissatisfaction are
different constructs, which are caused by different facets
of interaction between a product and consumer. Since the
constructs are unrelated, the level of satisfaction can be
independent of the level of dissatisfaction. For example,
an individual can be both very satisfied and very
dissatisfied with a product, according to the dual factor
theory. This approach can be contrasted with the
one-factor theory postulating that satisfaction and
dissatisfaction are opposites on a single, bipolar
continuum.
19
Page 30
Affect in Consumer Satisfaction
It has also been argued that satisfaction is not
solely a cognitive phenomenon. Rather, it also comprises
an element of affect or feeling, in that consumers feel
subjectively good in connection with satisfaction, and bad
connection with dissatisfaction. In addition to affect,
the construct of satisfaction also involves an element of
conation, in that high levels are associated with
intentions to repeat the purchase choice if faced again by
a similar buying situation, and low levels with intentions
to purchase differently (Hunt, 1977).
Not well represented in the cognitive perspectives is
consideration of the affective basis of satisfaction.
Westbrook has made progress in this area. Westbrook (1987)
posits that consumers from two summary affect states, one
based on the positive affects in consumption and the other
on the negative affects. Using Izard's (1977) Differential
Emotions Scale (DES), he showed that the affects of joy
and interest load on a factor separate from that of anger,
disgust, and contempt, and that these factors are
relatively uncorrelated. Moreover, both were significantly
related to satisfaction in the expected direction. These
relationships held up to the introduction of cognition
(i.e., disconfirmation) in the satisfaction equations. On
20
Page 31
the basis of the consumer satisfaction/dissatisfaction
reviewed in the discussions of cognitive and affect
influences, Oliver (1993), presents the satisfaction
response as being represented by the constructs. The
cognitive antecedents include expectations, performance,
disconfirmation, attribution, and equity/inequity.
Further, the model shows affect as augmenting these
variables in the prediction of satisfaction and, in
addition, shows affect as mediating an indirect influence
on attribution.
The emergence of affect as a proposed component of
post-purchase expression is not unusual in light of other
emerging work in the consumer area (Batra & Holbrook,
1990; Havlena & Holbrook, 1986). Earlier writings on
consumer affect, however, can be traced to Bradburn (1969)
in the quality-of-life area. Bradburn was, perhaps, the
first to propose an "affect balance theory" which
recognized that the positive experiences of life (e.g.,
excitement, pleasure) are not necessarily inversely
correlated with negative experiences (e.g. loneliness,
boredom). Generally, positive and negative affect have
been found to make independent contributions to life
satisfaction/dissatisfaction judgments in the life quality
literature (Horley & Little, 1985). In other words,
21
Page 32
Bradburn's "independent hypothesis" states that events in
life alternate between the positive and negative, and that
instance of one do not preclude occurrences of the other.
This argument is especially relevant to product and
service consumption, where numerous and varied attributes
exist at different levels of abstraction. Because each
attribute is a potential source of pleasure or
frustration, the likelihood of positive and negative
experience is enhanced, a premise underlying the use of
multi-attribute models of attitude.
The role of events (e.g., attribute performance
experiences) as causal agents for positive and negative
affective states has not been well conceptualized in the
consumer satisfaction/dissatisfaction literature (Oliver,
1993). Via a mechanism similar to the emergence of
attribution-dependent affect, research in the affect
literature (Scherer & Tannenbaum, 1986) suggests that
various affects are also event specific. That is,
different types of everyday experiences may directly
trigger different type of affect.
Additionally, prior research has not elaborated on
how consumers could entertain both positive and negative
affect toward the same product simultaneously (Oliver,
1993). Yet regressions of satisfaction on positive and
22
Page 33
negative affect in Oliver's (1993) studies clearlyI
indicate concurrent effects. The explanation draws on the
Bradburn (1969) affect-balance theory which would propose
the simultaneous operation of multifaceted product or
service attributes, thereby providing differentially
valence product.
General States of Affect
Westbrook (1980) argued that since satisfaction is an
evaluative response comprising an affective model, it
should be influenced by other more general states of
affect concurrently experienced by the individual. The
presence of appreciable positive or negative affect,
unrelated to the product, may well shape the affect evoked
by the evaluation process inherent in satisfaction
judgments. For example, arousal of a good mood, or the
presence of a happy, contended disposition, may cause the
individual to feel relatively more satisfied not only with
specific products, but also with other familiar objects in
his/her experience. There exists empirical evidence for
this proposition in the work of Isen, Clark, Shalker, and
Karp (1978). These researchers explained their results
with the "accessibility and cognitive loop" hypothesis
which states: that affective states partially determines
23
Page 34
the cognitive materials available in memory for stimulus
evaluation and decision making, which in turn reinforce
the prevailing affective state.
A number of distinct sources of affect may influence
consumers' product satisfaction/dissatisfaction,
differentiated by relative permanence and domain. Certain
affective states are relatively more permanent and
invariant, whereas others are particularized to a specific
time or situation. Independent of temporal stability,
affective states also differ in focus, some being
relatively general, and others limited to a more specific
domain (in this instance, consumption activity). Thus, at
least four relatively different types of affective
influences may be distinguished (Westbrook, 1980) :
1. Stable/generalized affective influences are
typified by basic personality dispositions, as
well as relatively enduring global attitude
structures. Optimism and pessimism
(Goldman-Eisler, 1960; Tiger, 1979) and
happiness (Cantril, 1965) illustrate the former,
and life satisfaction (Andrew & Withey, 1976),
the latter.
2. Transient/generalized affective influences
consist of the various elements of mood, such as
24
Page 35
elation, depression, tranquility, manifest
anxiety, harmony, anger, etc. (Wessman & Ricks,
1966).
3. Stable/consumer domain affective influences are
those pertaining to attitudinal structures
specific to the domain of consumption, e.g. the
goods and services offered in the marketplace,
its producers, merchants, and other
institutions, and its business practices.
Attitudes towards business, the market place and
consumerism, as well as sentiments of private
consumer discontent typify this class of
influences (Lundstom & Lamont, 1976).
4. Transient/consumer domain affect is typified by
temporarily favorable or unfavorable sentiments
in connection with elements of the domain of
consumption, e.g., product offerings, marketing
practices and retail institutions, as prompted
by prior experience or news revelations.
Westbrook (1980) stated that these affective
influences do not deny the role of cognitive processes
such as expectancy confirmation or disconfirmation, but
rather combine with them in the determination of consumer
satisfaction. He also suggest that the role of affective
25
Page 36
influences on the process through which satisfaction is
determined may vary by product category adding that
perhaps judgments of satisfaction are-not mediated by’ the
individual's more general affective states for relatively
less important products.
Consumption Emotion and Satisfaction/Dissatisfaction
Consumption emotion refers to the set of emotional
responses elicited specifically during product usage or
consumption experiences, as described either by the
distinctive categories of emotional experience (e.g., joy,
anger, and fear) or by the structural dimensions
underlying emotional categories, such as
pleasantness/unpleasantness, relaxation/action, or
calmness/excitement (Russel, 1979). Since judgments of
satisfaction vary along a hedonic continuum, a natural
question is whether satisfaction and consumption emotion
are distinguishable theoretical constructs. As stated by
Hunt (1977, p. 459) "satisfaction is not the pleasure of
the consumption experience, it is the evaluation rendered
that the experience was at least as good as it was
supposed to be." Westbrook (1987) further argued that
satisfaction necessarily incorporates an evaluation of the
emotional aspects of the antecedent consumption emotions
26
Page 37
elicited by product usage. This position was supported by
an empirical study demonstrating that 1) separate and
independent dimensions of positive and negative affect
underlie discrete emotional responses elicited during
consumption (i.e. joy, interest, surprise, anger, disgust,
and contempt), and 2) both these dimensions contributed
significantly to satisfaction above and beyond
expectancy-disconfirmation beliefs.
These distinctions are reaffirmed by the Cohen and
Areni (1991) review of affective processing mechanisms, in
which emotions elicited during consumption experiences are
believed to leave strong affective traces or "markers" in
episodic memory. So marked, these memory elements are
believed to be highly accessible to current cognitive
operations. When an evaluation of the relevant consumption
experience is required, the affective traces are readily '
retrieved and their valences integrated into the
evaluative judgment along with other pertinent semantic
memories, such as prior expectancies, disconfirmation
beliefs, and so on. Under these interpretations, only the
valence of the consumption emotion response is translated
into satisfaction judgment. Oliver (1989) has questioned
this assumption by theorizing that specific types or
categories of emotional response may be causally
27
Page 38
antecedent to, and coexist with, the satisfaction
judgment. He proposed five qualitatively different
emotional states for instances of satisfaction. Ordered by
increasing favorableness and contribution to satisfaction,
these are acceptance, happiness, relief,
interest/excitement, and delight. For dissatisfaction, the
emotional groupings in order of decreasing favorableness
are tolerance, sadness, regret, agitation, and outrage.
In contrast to the foregoing distinctions between
consumption emotion and satisfaction, other investigators
have conceptualized satisfaction as itself an emotional
response to the judgmental disparity between product
performance and a normative standard (Cadotte, Woodruff, &
Jenkins, 1987; Woodruff et al., 1983). Studies of emotion
meaning and knowledge (Plutchik, 1980; Russell, 1979)
reveal that the state of high satisfaction does indeed
have unequivocal emotional connotations, notably "happy,"
"pleased," and "contended" (dissatisfaction is less
specific in connotation).
Incorporating Desires in Consumer Satisfaction
According to Spreng, McKenzie, and Olshavsky (1996)
satisfaction research has focused primarily on the
disconfirmation of expectations, rather than of desires,
28
Page 39
as the key determinant of satisfaction. These researchers
believe that the extent to which a product or service
fulfills a person's desires also plays an important role
in shaping his or her feelings of satisfaction-much as the
marketing concept would predict and has been acknowledged
by some in the satisfaction literature (Olshavsky &
Spreng, 1989; Westbrook & Reilly, 1983) . They further
argue that the failure to consider the extent to which a
product or service fulfills a person's desires has led to
logical inconsistencies, such as predicting that a
consumer who expects and receives poor performance will be
satisfied (LaTour & Peat, 1979) and research that
sometimes shows no relationship between disconfirmation of
expectations and satisfaction (Churchill & Surprenant,
1982) .
Thus, they propose a model of consumer
satisfaction/dissatisfaction stating that feelings of
satisfaction arise when consumers compare their
perceptions of the performance of a product or service to
both their desires and expectations. They claim,that this
comparison process produces of satisfaction with the
product or service, but also feelings of satisfaction with
the information (often supplied by marketers in such forms
as advertising, package information and'salesperson
29
Page 40
communications) on which their expectations are based. An
empirical test of the model provided support for the
hypothesized relationships and a better understanding of
the mechanisms that produce satisfaction.
Market-Level View of Satisfaction
The preceding discussion of consumer satisfaction can
be conceptualized as "transaction specific," however, it
is important to note that there exists another
conceptualization of satisfaction that can be defined as
"cumulative." It is an overall evaluation based on the
total purchase and consumption experience with a good or
service over time (Fornell, 1992; Johnson & Fornell,
1991). It is considered as a more fundamental indicator of
the firm's past, current, and future performance
(Anderson, Fornell, & Lehmann, 1994).
According to Johnson, Anderson, and Fornell (1995)
relatively little attention has been paid to the
determinants of market-level satisfaction, which is
defined as the aggregate satisfaction of those who
purchase and consume a particular product offering. They
suggest scientific and pragmatic reasons for studying
market-level customer satisfaction and its antecedents.
30
Page 41
Drawing on economic psychology and economic
perspectives they conceptualized market-level customer
satisfaction as a cumulative construct that is affected by
market expectations and performance perceptions in any
given period and is affected by past satisfaction from
period to period. Their results suggest that market
performance expectations have a large rational component
yet remain adaptive to changing market conditions.
Additionally, market-level satisfaction was found to be
relatively stable over time and was positively affected by
performance and expectations in any given time period.
This finding suggests that managers who are interested in
increasing market satisfaction in order to improve future
profitability should invest in long-run quality
improvement programs and strategies. Short-run tactics
that temporarily increase performance or benefits per
customer dollar spent will have little long-run impact
(Johnson, Anderson, & Fornell, 1995).
From a scientific standpoint, satisfaction research
stands to gain by augmenting existing individual-level
studies with market-level analyses. They propose that
studying customers in the aggregate is one way to
establish empirical generalizations in the domain of
satisfaction research. While individual-level studies
31
Page 42
demonstrate the range of possible behavioral phenomena,
psychologists have long recognized the difficulties
involved in obtaining generalizations from them (Warneryd,
1988). According to Johnson et al. (1995), a lack of
emerging empirical generalization is clearly evident in
the quality and satisfaction literature, in which the
debate over alternative models and methods continues
(Anderson & Sullivan, 1993; Yi, 1991). They argue that the
attitudes and behavior of individuals may be so
situational unique that individual-level studies will be
unable to establish reliable generalizations in this area.
They suggest the solution of aggregations of individuals,
occasions, stimuli, and/or modes of measurement (Epstein,
1980).
From a pragmatic standpoint, they argue that,
marketing managers, product planners, and development
teams focus on the needs and wants of entire markets or
market segments thus making the contribution .of
market-level satisfaction relevant to these professionals.
Aggregate-level surveys to Consumer Reports surveys
provide important indicators of the level of satisfaction
in a firm's customer base. They state, that this
market-level satisfaction is a strong indicator of
aggregate customer retention and future profitability
32
Page 43
(Anderson, Fornell, & Lechmann, 1994) and thus has emerged
as an important yardstick or benchmark for firms seeking
to accelerate business performance as well as for
policymakers interested in tracking consumer well-being.
How is Consumer Satisfaction Measured?
Direct survey methods are the most widely used means
of measuring consumer satisfaction. Their primary
advantage is directness; the purpose is clear, and the
responses straightforward. The major disadvantage is
reactivity. Responses might be influenced by the act of
measurement itself. Other problems such as selection bias,
interviewer bias, and non-response bias, also provide
threats to the validity of the survey data.
Other methods of measuring consumer satisfaction
include collecting data on consumer complaints and repeat
purchases. These indirect methods are important since,
complaint and repeat purchase behaviors are truly relevant
to consumer satisfaction, important to both firms and
consumers, and are relatively unobtrusive, resulting in
reduced reactivity. However, they do have their
disadvantages. For example, the corresponding rules
between the concept and the measures are ambiguous and
imperfect due to confounding factors. Repeat purchase is
33
Page 44
affected not only by consumer satisfaction but also by
other factors, such as promotional activities, and brand
availability. Also, these measures may sample from the
tails of the distribution and fail to capture the typical
consumer's level of satisfaction.
Antecedents of Consumer Satisfaction
Some studies has examined demographic or
socio-psychological characteristics of consumers as
determinants of consumer satisfaction (Pfaff, 1972; Pickle
& Bruce, 1972; Westbrook & Newman, 1978). Consumer
satisfaction has been found to increase with age and
personal competence (Westbrook & Newman, 1978), and to
decrease with education and total family income. There is
also evidence that consumer satisfaction is related to
race (Pfaff, 1972) and marital status. However, other
investigations fail to find such relationships with age or
education. Overall, support for relationships between
consumer satisfaction and these factors seem to be weak
(Westbrook & Newman, 1978).
Other studies have focused on post-purchase
evaluation of product performance by relating it to
cognitive processes such as confirmation'or
disconfirmation of expectation. In these studies,
34
Page 45
expectation (or some other comparison standard) and
confirmation/disconfirmation have consistently been found
to be key variables affecting evaluation of product
performance. To date, this approach has. been more fruitful
than attempts to find demographic factors and appears to
be promising (Yi, 1990).
Objective versus Perceived Performance
In developing research for some of the antecedents of
consumer research there has been a conceptual difference
between perceived product performance and objective
product performance. Objective performance of a product is
the actual level of product performance that is assumed to
be constant across consumers. As a result, only one level
of objective performance exists for a product. However,
perceptions of product performance may vary across
consumers, depending upon their expectations. That is,
several different levels of perceived performance for a
product may exist among consumers. Therefore, there are
two types of disconfirmation, which is defined as the
disparity between expectations and performance, depending
upon the type of performance. The discrepancy between
expectations and objective performance is referred to
"objective disconfirmation," whereas the discrepancy
35
Page 46
between expectations and perceived performance is referred
to as "subjective disconfirmation."
Mixed Findings
Some key variables that have been found to affect
consumer satisfaction include expectation,
disconfirmation, perceived performance, and prior
attitudes. However, there are mixed findings as to the
antecedents of consumer research. Consumer satisfaction
was found to be directly affected by expectations in some
studies (Bearden & Teel, 1983; Churchill & Surprenant,
1982; Oliver, 1980), but not in other studies (Churchill &
Surprenant, 1982; Oliver & Bearden, 1983) . Most studies
found that disconfirmation is a significant predictor of
consumer satisfaction, but Churchill and Surprenent (1982)
showed that neither disconfirmation nor expectation had
any effect on consumer satisfaction, and that only
perceived performance had a significant effect. The effect
of attitudes was found in some studies (Oliver, 1980) but
not in others (Bearden & Teel, 1983; Oliver & Bearden,
1983) .
36
Page 47
Consequences of Consumer Satisfaction
Consumer■Satisfaction and Profitability for a Firm
How does satisfying current customers affect
profitability? Fornell (1992) enumerates several key
benefits of high customer satisfaction for the firm.
Several of these will be discussed.
Increased Loyalty. In general, high customer
satisfaction should indicate increased loyalty fob current
customers. This means more customers will repurchase in
the future. If a firm has strong customer loyalty, it
should be reflected in the firm's economic returns because
it ensures a steady cash flow.
Reduced Price Elasticity. Customer satisfaction
should reduce price elasticity for current customers
(Garvin, 1988) . Satisfied customers are more willing to
pay for the benefits they receive and are more likely to
be tolerant of increases in price. This implies high
margins and customer loyalty. Low customer satisfaction
implies greater turnover of the customer base, higher
replacement costs, and due to the difficulty of attracting
customers who are satisfied doing business with a rival,
higher customer acquisition costs. Decreased price
elasticity lead to increased profits for a firm providing
superior customer satisfaction.
37
Page 48
Lower Transaction Costs. High customer satisfaction
should, lower the costs of transaction in the future. If a
firm has high customer retention, it does not need to
spend as much to acquire new customers each period.
Satisfied customers are likely to buy more frequently and
in greater volume and purchase other goods and services
offered by the firm.
Reduced Failure Costs. Consistently providing goods
and services that satisfy customers should also increase
profitability by reducing failure costs. A firm that
consistently provides high customer satisfaction should
have fewer devoted to handling returns, reworking
defective items and handling and managing complaints.
New Customers. The costs of attracting new customers
should be lower for firms that achieve a high level
customer satisfaction (Fornell, 1992). For example,
satisfied customers are reputedly more likely to engage in
positive word of mouth and less likely to engage in
damaging negative word of mouth for the firm (Anderson,
1994; Howard & Sheth, 1969; Reichheld & asser, 1990; TARP,
1979, 1981). Media sources are also more likely to convey
positive information to prospective buyers. Customer
satisfaction claims may also make advertising more
effective.
38
Page 49
Increased Reputation. An increase in customer
satisfaction should also enhance the overall reputation of
the firm. An enhanced reputation can aid in introducing
new products by providing instant awareness and lowering
the buyer's risk of trial. Reputation can also be
beneficial in establishing and maintaining relationships
with key suppliers, distributors and potential allies
(Anderson & Weitz, 1989; Montgomery, 1975). Reputation can
provide a halo effect for the firm that positively
influences customer evaluations, providing insulation from
short-term shocks in the environment. Customer
satisfaction should play an important role in building
other important assets for the firm, such as brand equity.
Although there are many compelling reasons to
conclude that higher customer satisfaction leads to higher
profitability, it is, nevertheless, not always the case.
At some point, there must be diminishing returns to
increasing consumer satisfaction. Given that increasing
customer satisfaction by design like adding features,
increasing the quality of raw materials, increasing the
level of personal service, providing greater variety by
differentiating the product line to meet needs etc. will
invariably increase costs at an increasing rate thus
reducing the profitability of consumer satisfaction.
39
Page 50
Attribution Theory and Consumer Satisfaction
Expressions of consumer satisfaction/dissatisfaction
with products may be partly due to the individual, and not
to factors under the control of marketers and public
officials (Westbrook & Newman, 1978) given the caveats and
assumptions of causality implicit in consumer
satisfaction/dissatisfaction conceptual models. This view
is consistent with deductions from attribution theory
(Kelly, 1967, 1972) . As Settle and have argued, consumers
may attribute marketers' communications of product
performance to the latter's desire to sell the product,
rather than to the inherent nature of the product itself.
The results of such attributions would be weaker and less
realistic expectations, which are less likely to be
confirmed by actual product outcomes, thereby, reducing
satisfaction with the product.
Attribution theory notions are also relevant to
assessing the effects of consumer
satisfaction/dissatisfaction, once these judgments have
been formed. In principle, product satisfaction may be
attributed to the inherent nature of the product, the
motivations of the seller, the consumer's own abilities to
select or consume the product appropriately or to the
40
Page 51
circumstances surrounding choice or consumption, depending
on the information available (Orvis, Cuningham, & Kelly,
1975). Yet, research has suggested that consumers are more
likely to attribute their product dissatisfaction to the
product and/or seller than to themselves, and that
attributions are linked to subsequent complaining behavior
(Landon & Emery, 1975; Valle & Wallendorf, 1977) .
Consumer Responses to Satisfaction/Dissatisfaction
Many studies have attempted to identify factors that
predict different types of consumer responses to
satisfaction or dissatisfaction (Best & Andreasen, 1977;
Day & Ash, 1979). Substantial focus has been placed on
consumers' complaint strategies in reaction to
dissatisfaction. It has been found that consumers show
several types of responses to dissatisfaction. It has been
found that consumers show several types of responses to
dissatisfaction: 1) taking no action, 2) switching brand
or curtailing patronage, 3) making a complaint to the
seller or third party, and 4) telling others about the
unsatisfactory product [i.e., negative word-of-mouth
communication] (Day, 1980; Krapel, 1985; Richin, 1983).
41
Page 52
Complaining Behavior as a Reaction to Dissatisfaction
Complaining behavior as a reaction to dissatisfaction
in order to seek rectification varies considerably.
Frequently, consumers do not take any actions to alleviate
their marketplace to induce problems. Day and Landon
(1976) discovered that reported cases of extreme
dissatisfaction for which no action of any kind was taken
were 49.6% for non-durable goods, 29.4% for durable
products, and 23.2% for services. Substantial evidence
suggests that complaint behavior is not just a function of
the intensity of dissatisfaction but of several other
factors as well, such as consumer characteristics,
consumers perceptions of the attribution of
dissatisfaction, expectancy of outcomes, economic costs
involved, product type, etc. This can explain empirical
findings that show that a large proportion of dissatisfied
consumers do not complain.
These findings have negative implications for
marketers and consumers alike. First, failure to express
dissatisfaction prevents the consumer from achieving
redress from an unpleasant marketplace experience. Second,
limited action on part of consumers may mask marketplace
problems that the firm could and/or should correct.
42
Page 53
Additionally, complaints are now seen as important free
sources of information that can help firms create more
competitive products. One study of a variety of consumer
products for which the potential loss to the consumer
exceeded US$ 100 estimated that 54 percent of consumers
whose complaints were satisfactorily resolved and
repurchased the product, compared with 9 percent of
unhappy customers who did not bother to complain.
Some studies have also attempted to obtain profiles
of complaining customers. They examined the following
questions: What types of consumers are likely to voice
complaints? What are the differences between consumers who
complain and consumers who give compliments? Robinson and
Berl (1980) found that complainers were typically younger,
had more income, and were less brand-loyal than were
complimenters. The finding that younger, high-income
consumers were more likely to complain suggests'that their
expectations were higher. If this had been the case, their
expectations were highly likely to be disconfirmed.
Consumer Satisfaction as a Mediator of Attitude Change
An important issue is the role of consumer
satisfaction in attitude change. As consumers interact
with a product toward which they have established an
43
Page 54
attitude, they are subject to two sets of forces. On one
hand, new experiences and information produce forces
toward change. An attitude may change with the product
experience, since some consumers learn from experience. An
attitude will therefore be affected by consumer
satisfaction, which can be seen as a summary of the nature
of product experience. On the other hand, the existing
attitude creates forces toward stability (resistance to
change). As a result, an attitude may be affected by the
previous attitude. In sum, the effect of a previous
attitude indicates the temporal stability of an attitude,
whereas the effects of consumer satisfaction reflects the
consequence of consumer learning from the product
experience (Oliver, 1980).
What are Attitudes?
The term "attitude" is widely used in popular
culture. Solomon (2002) said that an attitude is a lasting
general evaluation of people (including oneself), objects,
and advertisements. An attitude is lasting because it
trends to endure over time. It is general because it
applies to more than a momentary event such as hearing a
loud noise, though you might over time develop a negative
attitude towards all loud noises. Consumers have attitudes
44
Page 55
towards a wide range of attitude objects; from very
product-specific behaviors to more general
consumption-related behaviors.
Thurstone (1928) said that attitude is the sum total
of a man's inclinations and feelings, prejudice and bias,
preconceived notions, ideas, fears, threats, and
convictions about any specified topic. Meuller (1986) said
that attitude is the extent of liking or disliking
something.
Attitudes are the stands a person takes about
objects, people, groups, and issues. Attitudes can be
formed by many situations in life, and they are constantly
evolving to accommodate new information. When someone
takes a stand on an issue, it is rendered in terms of his
attitude. When one has an attitude, he is no longer
neutral. He will keep that attitude until he adopts a
different one.
Why do we Have Attitudes?
People form attitudes about many aspects of life and
for many different reasons.
• To-simplify complex subjects
• To protect self esteem
• To help adjusting to the world
• To express fundamental values
45
Page 56
Socialization is a continuous process by where we
change from children into adults. Friends, family, school,
and media all influence how we learn attitudes. Groups
influence many of our attitudes. Hallorah (1967) said that
the socialization process deals with transformation, the
transformation of the child into the adult, a process that
includes the learning of attitudes and values.
There are three main sources of attitudes: 1) Direct
experience with the objects and situations, 2) Explicit or
implicit learning from others, and 3) Personality
development. If we experience disappointment associated
with something, we will develop unfavorable attitudes
about that thing. On the other hand, when we succeed or
hold a powerful position in a situation, we will develop
favorable attitudes.
Attitudes have 3 components: 1) Cognitive
component--the idea which is generally a category used by
humans in thinking, 2) Affective component—the emotion
which charges the idea, and 3) Behavioral component—a
predisposition to action.
Theories of Attitude Change
Formation and change of attitude are not two separate
things. They are interwoven. People are always adopting,
46
Page 57
modifying, and relinquishing attitudes to fit their
ever-changing needs and interests. Attitude cannot be
changed by simple education. Acceptance of new attitudes
depends on who is presenting the knowledge, how it is
presented, how the person is perceived, the credibility of
the communicator, and the conditions by which the
knowledge was received (Hallorah, 1967).
Attitudes change when: 1) A person receives new
information from others or media—Cognitive change,
2) Through direct experience with the attitude object—
Affective change, and 3) Force a person to behave in a way
different than normal—Behavioral change (Traindis, 1971).
Attitude can be changed by a number of sources
including other people, family, media, church, or the
object itself. In 1968, McGuire developed steps of
changing an attitude. The steps are attention,
comprehension, yielding retention, and action. Traindis
(1971) said, "In analyzing the attitude-change, process, we
must consider the effect of who says what, how to whom,
with what effect."
Attitude will be changed based on how a person sees
the communication and the communicator. Less committed
people will change ideas more frequently. Attitude change
also has to do with other personality characteristics such
47
Page 58
as susceptibility to persuasion, intelligence, readiness
to accept change, etc. We are more likely to accept
information if we feel the communicator•has no intent to
change our attitudes and opinions.
48
Page 59
CHAPTER THREE
METHODOLOGY
This paper models the survey research by using
questionnaire as an instrument. This chapter will detail
the methodology used in this research. The population,
sample, independent variables, dependent variable,
sampling, data collection methods, and data transformation
will be explained.
Population
Customers of THAI residing in the Los Angeles who
have previous contacts with the reservation department of
THAI (North America)
Hl: Customer satisfaction is significantly affected by
the demographical data
Dependent Variables: Customer satisfaction with
the reservation staff of
THAI
Independent Variables: The demographical data
H2: Customer attitude toward THAI is affected by their
satisfaction with the reservation staff of THAI
Dependent Variables: Customer attitude towards
THAI
49
Page 60
Independent Variables: Customer satisfaction with
the reservation staff of
THAI
H3: Customer satisfaction is directly correlated to the
communication behavior of THAI's reservation staff
Dependent Variables: Customer satisfaction with
the reservation staff of
THAI
Independent Variables: The communication behavior
of THAI'S reservation staff
Questionnaire Design
To achieve the purpose of the study, the
questionnaire was designed to gather relevant information
to evaluate the relationship between customer attitude and
their satisfaction, customer satisfaction and the behavior
of THAI reservation staff, and the customer satisfaction
and the demographical data.
The questionnaire consisted of yes and no,
open-ended, and check list questions. The questions were
divided into four sections: 1) general demographical
information, 2) customer's experience with the reservation
staff of THAI, 3) customer satisfaction with the
50
Page 61
communication behavior of the reservation staff of THAI,
and 4) customer's attitude toward THAI' reservation.
The questions in the questionnaire' were created and •
gathered from other relevant documents, journals, and
other researches. In section one of the questionnaire, the
respondents were asked to provide background information
about themselves such as age, sex, income, and education.
In section two, the respondents were asked to answer
question about customers' experience with THAI reservation
service. In section three, a five point scale about
customer satisfaction from very satisfied to very
dissatisfied was designed to obtain the respondents' level
of satisfaction of THAI' reservation staff communication
behavior. In the last section, the respondents were asked'
their opinions about service of THAI, in this part, a five
point scale was used from strongly agree to strongly
disagree.
Data Collection Method
Three committee members were consulted to make sure
that the respondents could understand the questionnaire
clearly and easily and would not misinterpret the
questions.
51
Page 62
One hundred fifty questionnaires were handed out to
respondents in three areas in Los Angeles County (Los
Angeles International Airport, THAI main ticketing office
in Los Angeles and Thai Town in Hollywood, California)
during January 20, 2003 to February 2, 2003. These three
sites were selected because of the increased likelihood of
finding a participant in the target group.
The first fifty questionnaires were handed out to
customers at the THAI ticket counter at Los Angles
International Airport (LAX) during January 20 - 26, 2003.
The questionnaires were given to passengers who were
waiting in line to check their baggage.
The next fifty questionnaires were handed out to
customers at the THAI main ticketing office in Los Angeles
on January 27 through January 31, 2003. The questionnaires
were given to customers who came to the THAI office to
pick up tickets, to buy tickets, to refund tickets, or to
seek information regarding tours in Thailand.-, At this
location most of the respondents were not in a rush and
were very cooperative with the surveys.
The last fifty questionnaires were handed out to
respondents at Thai Town (Hollywood, California) during
February 1-2, 2003. The questionnaires were handed out to
52
Page 63
people who were in the shops in the supermarkets at Thai
town.
Data Entry and Analysis
After collecting all returned and competed
questionnaires, one-way ANOVA, and Pearson's Product
Moment Correlation Coefficient were used to analyze the
data. Statistical Package for the Social Sciences for
Windows (SPSS for Windows) program was employed for data
processing.
Samples
The samples were selected from THAI customers. Out of
the one hundred and fifty questionnaires handed out, one
hundred thirty nine questionnaires were returned. Samples
were selected by using purposive sampling. The
questionnaires were given to the respondents in three
areas in Los Angeles County (Los Angeles International
Airport, THAI office in Los Angeles and Thai Town in
Hollywood, California) during the period of January 20,
2003 through February 2, 2003. The first fifty
questionnaires were handed to the customers at the Thai
counter at Los Angeles International Airport (LAX), the
next fifty questionnaires were handed to the customers at
the THAI main ticketing office in Los Angeles, and the
53
Page 64
last fifty questionnaires were handed to the respondents
that were shopping at Thai Town.
Satisfied
Neutral
Unsatisfied
Very unsatisfied
Scoring Criteria
For part 3 of the questionnaire, the answer for each
question will be weighted as follows:
Very Satisfied 5 points
4 points
3 points
2 points
1 point
The average score criteria of the customer attitude
towards the reservation staff is interpreted as follows:
Average Score Description
00 - 1.50 Points Attitude is very negative
51 - 2.50 Points Attitude is negative
51 -3.50 Points Attitude is neutral
51 - 4.50 Points Attitude is positive
51 - 5.00 Points Attitude is very positive
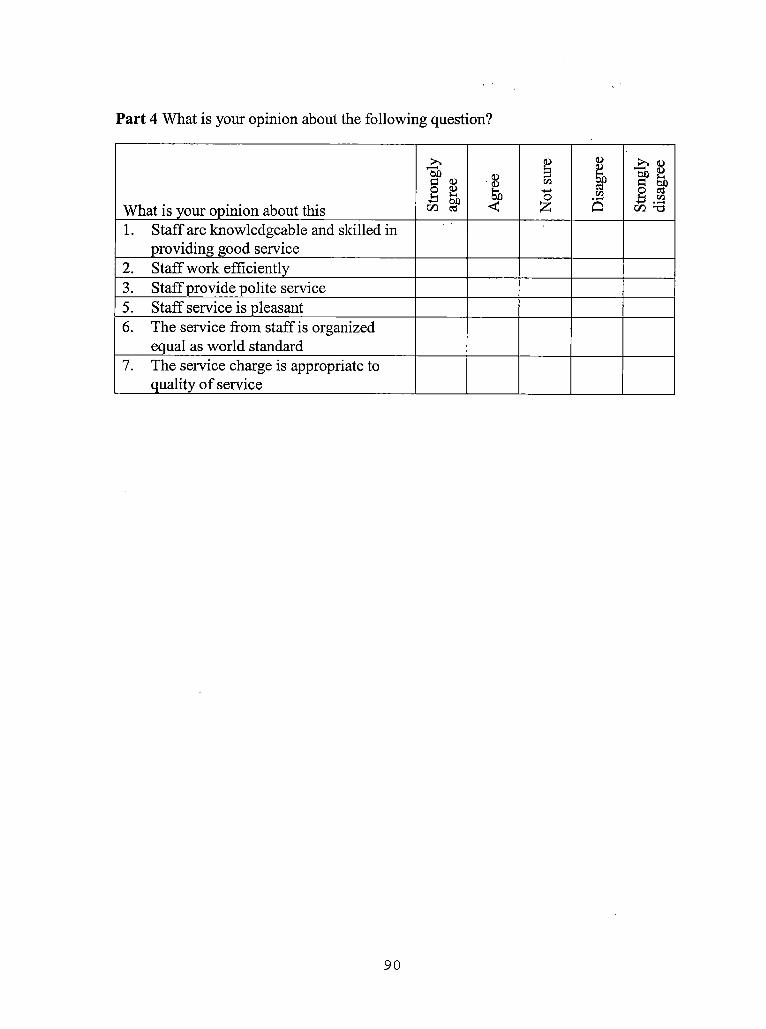
For part 4 of the questionnaire, the answer for each
question will be weighted as follows:
Strongly agree 5 points
Agree 4 points
Not sure 3 points
54
Page 65
Disagree 2 points
Strongly disagree 1 point
The average score criteria of the customer
satisfaction towards the reservationstaff is interpreted
as follows:
Average Score Description
0.00-1.50 points Customer satisfaction is very low
1.51-2.50 points Customer satisfaction is low
2.51-3.50 points Customer satisfaction is moderate
3.51-4.50 points Customer satisfaction is high
4.51-5.00 points Customer satisfaction is very
high
Statistical Analysis
Descriptive statistics were applied to analyze the
data from the questionnaire survey in order to answer the
research questions. The Hypothesis testing (F-test, and
t-test) was used to evaluate the data. The Analysis of
Variances (ANOVA) is used to test the variables. Pearson's
Product Moment Correlation is used for regression
analysis. The program SPSS (Statistical Package for the
Social Sciences for Windows) was used to obtain such above
data with higher accuracy.
55
Page 66
CHAPTER FOUR
RESULTS
This study of Customer Satisfaction with
communicating behavior of THAI'S reservation staff in Los
Angeles was conducted under the principle guidelines of
research methodology. One hundred fifty questionnaires
were distributed to the customers of THAI in the Los
Angeles area, however only 139 or 92.67 percent were
returned. The data was analyzed using a program called
SPSS (Statistical Package for the Social Science for
Windows).
Descriptive Analysis
1) General demographic information such as gender,
age, income, education, and occupation.
2) Customer experience with THAI reservation
service
3) Customer satisfaction toward service of
reservation staff
4) Customer attitude toward THAI
Hypothesis Testing
1) The t-test analysis and the One-way AITOVA
analysis were used to test the correlation of
56
Page 67
independent variables such as gender, age,
education, and income.
2) The Pearson Product Moment Correlation is used
to explain the correlation between THAI'S
customer attitude towards THAI and their
satisfaction towards the quality of service
provided by THAI's reservation staff, and the
correlation between the customer satisfaction
and the behavior in communicating by the
reservation staff.
Descriptive Analysis of Respondents
General Background of Respondents
One hundred fifty questionnaires were handed out to
respondents participating in the survey—50 at THAI'S
ticket counter at LAX International airport, 50 at the Los
Angeles main ticketing office, and 50 in Hollywood's Thai
town. Although one hundred thirty nine questionnaires were
returned, only one hundred twenty one were usable since
only one hundred twenty one respondents have ever
contacted THAI and answered "yes" to question 1 of part 2.
Appendix C, Table 1 of the Respondents Grouped by
Gender shows that, out of 121 respondents, there were 66
57
Page 68
males or 54.55 percent and 55 females, an equivalent of
45.45 percent.
Appendix C, Table 2 of the Respondents Grouped by Age
shows that the age group of 26-35 year olds represented
the most frequency of 48 or 39.67 percent, followed by the
36-45 year olds and 46-55 year olds with 27.27 percent and
15.70 percent respectively. There were 10 respondents or
8.26 percent who were under 25 years of age and 4
respondents or 3.31 percent older than 56 years old. Seven
of the respondents or 5.79 percent chose not. to answer
this question.
Appendix C, Table 3 of the Respondents Grouped by
Education shows that more than half of the respondents or
approximately 54.55 percent had a bachelor •degree or',
equivalent. The total number of graduate education or
higher is 40 or approximately 33.06 percent... Ten
respondents or approximately 8.26 percent had a high
school education or lower while 5 respondents or 4.31
percent chose not to answer this question.
Appendix C, Table 4 of the Respondents Grouped by
Annual Income shows that most of the respondents (40.50
percent) reported an annual income in the range of $15,001
- 30,000 followed by 26 percent of the respondents with an
annual income within the $30,001-$45,000 range, and 16
58
Page 69
percent of the respondents with an annual income of
$15,000 or less. The group with an annual income within
the range of $45,001-60,000 came in fourth with 10
percent. The group with an annual income of $60,000 and
above came last with only 6 percent. Only 2 percent of the
respondents chose not to answer this question.
Appendix C, Table 5 lists Respondents Grouped by
Occupation. Most of the respondents were self-employed
with 28 percent. Approximately 26 percent of the
respondents were students. The number of government
employees and professionals represent about 19 percent of
the respondents. The fewest number of respondents, 6
percent, were Executives. Twenty one percent of the
respondents chose to answer as other occupation. Only 1
percent of the respondents refused to disclose this
information.
Respondents' Information about Service of Reservation
Appendix C, Table 6 shows the percentage of
respondents who ever contacted with reservation staff of
THAI. Out of 139 respondents, there were 121 respondents
who ever contacted with reservation staff of THAI.
From the Appendix C, Table 7, the frequency per month'
of customers contacting THAI, it can be seen that most of
59
Page 70
the respondents (85%) contacted THAI'S reservation staff
less than once per month. Less than 10 percent of the
respondents contacted THAI's reservation staff on the
average of once a month. Around 5 percent of the
respondents contacted THAI'S reservation staff more often
than once a month. All the respondents answered this
question.
Appendix C, Table 8 shows the various purposes of
contacting THAI. Most of the respondents or around 36
percent reported contacting THAI when they wanted to
change their reservations or tickets. The second most
common reason respondents reported contacting THAI was to
inquire about flight schedules and airline information for
26 percent and 20 percent respectively. Only less than 6
percent of the respondents reported calling THAI to check
fare price. About 7 percent of the respondents reported
contacting THAI to purchase their tickets, and only 2
percent of respondents reported contacting THAI with other
reasons such as to inquire information about the airline's
mileage program.
Appendix C, Table 9 shows the time of contact with
the reservation staff, most of the respondents
(approximately 50 percent) contacted the THAI reservation
staff between 9:01 a.m. - 12:00 noon. Approximately 39
60
Page 71
percent of the respondents reported contacting THAI in the
afternoon between 12:01 p.m.-3:00 p.m. and between 3:01
p.m.-5:00 p.m. Only 11 percent of the respondents reported
contacting THAI in the early morning during 7:00 a.m.-9:00
a .m.
From the Appendix C, Table 10, it is seen that more
than half of the respondents (52 percent) experienced long
waiting period before a THAI representative answered their
calls. The answering system picked up the calls and placed
the respondents on hold for a short moment for 34 percent
of the respondents. About 14 percent of the respondents
experienced busy signals, difficulty connecting to a THAI
representative, or were disconnected before their calls
were answered by a THAI representative.
Customer's Satisfaction toward Reservation StaffFrom the Appendix C, Table 11, it can be explained
that the customer satisfaction towards the communication
behavior of the THAI's reservation staff from the 17
questions by the 121 respondents as follows:
1) The staff spoke clearly. The respondents
answered the most with "satisfied" by
approximately 56.2 percent followed by the
"neutral" of 28.9 percent. The group of "very
satisfied," "unsatisfied," "very unsatisfied,"
61
Page 72
and "unanswered" are 8.26, 2.48, 0.83, and 3.31
percent respectively. The average score of
satisfaction is 3.59 considering as highly
satisfied.
2) Staff always greeted, and announced his or her
name when answering the call. The respondents
answered the most with "satisfied" by
approximately 36.4 percent followed by the
"neutral" of 30.6 percent. The group of "very
satisfied," "unsatisfied," "very unsatisfied,"
and "unanswered" are 8.26, 19.8, 1.65, and 3.31
percent respectively. The average score of
satisfaction is 3.20 considering as moderately
satisfied.
3) Staff always sincerely apologized whenever it
was problematic. The respondents answered the
most with "neutral" by approximately 41 percent
followed by the "satisfied" of 33.1 percent. The
group of "very satisfied," "unsatisfied," "very
unsatisfied," and "unanswered" are 7.44, 14.0,
1.65, and 3.31 percent respectively. The average
score of satisfaction is 3.21 considering as
moderately satisfied.
62
Page 73
4) Staff never argued. The respondents answered the
most with "neutral" by approximately 37.2
percent followed by the "satisfied" of 33.1
percent. The group of "very satisfied,"
"unsatisfied," "very unsatisfied," and
"unanswered" are 8.26, 17.4, 0.83, and 3.31
percent respectively. The average score of
satisfaction is 3.21 considering as moderately
satisfied.
5) Staff spoke with proper tone of voice. The
respondents answered the most with "satisfied"
by approximately 38 percent followed by the
"neutral" of 36.4 percent. The group of "very
satisfied," "unsatisfied," "very unsatisfied,"
and "unanswered" are 8.26, 11.6, 1.65, and 4.13
percent respectively. The average score of
satisfaction is 3.27 considering as moderately
satisfied.
6) Staff was not threatening. The respondents
answered the most with "satisfied" by
approximately 37.2 percent followed by the
"neutral" of 33.9 percent. The group of "very
satisfied," "unsatisfied," "very unsatisfied,"
and "unanswered" are 9.09, 14.9, 1.65, and 3.31
63
Page 74
percent respectively. The average score of
satisfaction is 3.27 considering as moderately
satisfied.
7) Staff ended calls courteously. The respondents
answered the most with "satisfied" by
approximately 34.7 percent followed by the
"neutral" of 33.1 percent. The group of "very
satisfied," "unsatisfied," "very unsatisfied,"
and "unanswered" are 7.44, 19.8, 1.65, and 3.31
percent respectively. The average score of
satisfaction is 3.17 considering as moderately
satisfied.
8) Staff can controlled their emotion. The
respondents answered the most with "satisfied"
by approximately 34.7 percent followed by the
"neutral" of 30.6 percent. The group of "very
satisfied," "unsatisfied," "very unsatisfied,"
and "unanswered" are 4.13, 24, 3.31, and 3.31
percent respectively. The average score of
satisfaction is 3.02 considering as moderately
satisfied.
9) Staff was not rude. The respondents answered the
most with "satisfied" by approximately 36.4
percent followed by the "neutral" of 34.7
64
Page 75
percent. The group of "very satisfied,"
"unsatisfied," "very unsatisfied," and
"unanswered" are 6.61, 17.4, 1.65, and 3.31
percent respectively. The average score of
satisfaction is 3.19 considering as moderately
satisfied.
10) Staff always took good care of you. The
respondents answered the most with "neutral" by
approximately 43 percent followed by the
"satisfied" of 33.1 percent. The group of "very
satisfied," "unsatisfied," "very unsatisfied,"
and "unanswered" are 6.61, 12.4, 1.65, and 3.31
percent respectively. The average score of
satisfaction is 3.21 considering as moderately
satisfied.
11) Staff thought that the problems were very
important. The respondents answered the most
with "neutral" by approximately 43.8 percent
followed by the "satisfied" of 24 percent. The
group of "very satisfied," "unsatisfied," "very
unsatisfied," and "unanswered" are 5.79, 21.5,
1.65, and 3.31 percent respectively. The average
score of satisfaction is 3.0 considering as
moderately satisfied.
65
Page 76
12) Staff was enthusiastic in problem solving. The
respondents answered the most with "neutral" by
approximately 40.5 percent followed by the
"satisfied" of 30.6 percent. The group of "very
satisfied," "unsatisfied," "very unsatisfied,"
and "unanswered" are 4.96, 18.2, 2.48, and 3.31
percent respectively. The average score of
satisfaction is 3.07 considering as moderately
satisfied.
13) Staff never refused to help. The respondents
answered the most with "neutral" by
approximately 41.3 percent followed by the
"satisfied" of 33.9 percent. The group of "very
satisfied," "unsatisfied," "very unsatisfied,"
and "unanswered" are 4.96, 14.9, 1.65, and 3.31
percent respectively. The average score of
satisfaction is 3.16 considering as moderately
satisfied.
14) Staff treated you as if you were very important
The respondents answered the most with "neutral
by approximately 43 percent followed by the
"satisfied" of 32.2 percent. The group of "very
satisfied," "unsatisfied," "very unsatisfied,"
and "unanswered" are 4.96, 14.9, 0.83, and 4.13
66
Page 77
percent respectively. The average score of
satisfaction is 3.13 considering as moderately
satisfied.
15) Staff gave good advice. The respondents answered
the most with "neutral" by approximately 38
percent followed by the "satisfied" of 35.5
percent. The group of "very satisfied,"
"unsatisfied," "very unsatisfied," and
"unanswered" are 8.26, 14.0, 0.83, and 3.31
percent respectively. The average score of
satisfaction is 3.26 considering as moderately
satisfied.
16) Staff worked with the same standard. The
respondents answered the most with "neutral" by
approximately 42.1 percent followed by the
"satisfied" of 26.4 percent. The group of "very
satisfied, " "unsatisfied," "very unsatisfied,"
and "unanswered" are 4.96, 19.8, 3.31, and 3.31
percent respectively. The average score of
satisfaction is 3.0 considering as moderately
satisfied.
17) Overall Satisfaction. The respondents answered
the most with "neutral" by approximately 40
percent, followed by the "satisfied" of 38
67
Page 78
percent. The group of "very satisfied,"
"unsatisfied," "very unsatisfied," and
"unanswered" are 4.13, 12.4, 0.83, and 4.96
percent respectively. The average score of
satisfaction is 3.17 considering as moderately
satisfied.
Customer Attitude toward Staff
From the Appendix C, Table 12, we can analyze the
customer attitude towards the reservation staff of THAI by
the 6 statements in the questionnaire of 121 respondents
as follows:
1) Staff is knowledgeable and skilled in providing
good service. The respondent with "agree" group
is the most with 48 percent following by "not
sure" 38.02 percent. The "strongly agree,"
"disagree," "very disagree," and "unanswered"
are 8.26, 1.65, 0.83, and 3.31 percent
respectively. The average score for the comments
is 3.51 considering as highly agreed attitude.
2) Staff worked efficiently. The respondent with
"not sure" group is the most with 43.8 percent
following by the "agree" 42.15 percent. The
"strongly agree," "disagree," "very disagree,"
and "unanswered" are 2.48, 6.61, 0.83, and 4.13
68
Page 79
percent respectively. The average score for the
comments is 3.26 considering as neutral
attitude.
3) Staff was polite. The respondent group with "not
sure" and "agree" are the most with 37.19
percent following by the "disagree" 14.88
percent. The "strongly agree," "very disagree,"
and "unanswered" are 5.8, 0.83, and 4.13 percent
respectively. The average score for the comments
is 3.20 considering as neutral attitude.
4) The service was impressive. The respondent with
"not sure" group is the most with 43.8 percent
following by the "agree" 38.02 percent. The
"strongly agree," "disagree," "very disagree,"
and "unanswered" are 2.48, 10.74, 0.83, and 4.13
percent respectively. The average score for the
comments is 3.18 considering as neutral
attitude.
5) The services by the staff were up to the world
standard. The respondent with "agree" group is
the most with 44.63 percent following by the
"not sure" 39.67 percent. The "strongly agree,"
"disagree," "very disagree," and "unanswered"
are 4.96, 5.79, 0.83, and 4.13 percent
69
Page 80
respectively. The average score for the comments
is 3.35 considering as neutral attitude.
The service charge is relatively reasonable to the
quality of service. The respondent with "not sure" group
is the most with 38.02 percent following by the "disagree"
28.93 percent. The "strongly agree," "agree," "very
disagree," and "unanswered" are 0.83, 23.14, 5.8, and 3.31
percent respectively. The average score for the comments
is 2.74 considering as neutral attitude.
Hypothesis Testing
In this study, there are three hypotheses for the
research in correlation analysis as follows:
Hl: Customer satisfaction with the reservation staff at
THAI is affected by the demographical data.
This hypothesis can be subdivided into another 4
Hypothesis as follows:
Hl.1: Customer satisfaction with the reservation staff
at THAI is affected by gender of the customer.
Hl.2: Customer satisfaction with the reservation staff
at THAI is affected by age of the customer.
Hl.3: Customer satisfaction with the reservation staff
at THAI is affected by educational level of the
customer.
70
Page 81
Hl.4: Customer satisfaction with the reservation staff
at THAI is affected by income level of the
customer
H2: Customer satisfaction toward THAI is affected by
their attitude with the reservation .staff of
THAI .
H3: Customer satisfaction is correlated to the
communication behavior of the reservation staff
of THAI
Testing
Hl: Customer satisfaction with the reservation staff
at THAI is affected by the demographical data.
Hl.1: Customer satisfaction with the reservation staff
at THAI is affected by gender of the customer.
The t-test statistical analysis is used to test the
Hypothesis.
Table 1. T-test Statistical Analysis for Hypothesis 1.1
Gender Frequency Average SD T ProbMale 66 3.36 0.68 1 0.317Female 55 3.30 0.67
From the above table, it can be seen that the
customer satisfaction with the reservation staff at THAI
71
Page 82
is not correlated to the gender of the customer at the
level of significance 0.05
We, then, reject the Hypothesis 1.1
Hl.2: Customer satisfaction with the reservation staff
at THAI is affected by age of the customer.
Table 2. Statistical Analysis for Hypothesis 1.2
Age Frequency Average SD F P
17-25 11 3.11 0.66 0.6543 0.624226-35 50 3.17 0.6436-45 35 3.26 0.6546-55 20 3.13 0.715 6 and above 5 3.27 0.72
From the table, it shows that the customer
satisfaction with the reservation staff at THAI is not
correlated to the age of the customer at the level of
significance 0.05.
We, then, reject the Hypothesis 1.2'.
Hl.3: Customer satisfaction with the reservation staff
at THAI is affected by educational level of the
customer.
72
Page 83
Table 3. Statistical Analysis for Education
Education Frequency Average SD F P
High school or under 10 4.17 - 2.0554 0.7
Undergraduate 72
Graduate 22
Post graduate 17
The above table shows that the customer satisfaction
with the reservation staff at THAI is not correlated to
the educational level of the customer of the level of
significance 0.05
Again, then we reject the Hypothesis 1.3
Hl.4: Customer satisfaction with”the reservation staff
at THAI is affected by income level of the
customer • '
73
Page 84
Table 4. Statistical Analysis for Annual Income
Income Freq. Avg. SD F P$15,000 or
less 20 3.71 0.34 4.271 0.0021
$15,001 - 30,000 50
$30,001 - 45,000 34 2 > 4
$45,001 - 60,000 11
Higher than $60,000 6 •
It can be observed from the above table that the
customer satisfaction with the reservation staff at THAI
is correlated to the income level of customer at the level
of significance 0.05 and when we test the pair
differential with SCHEFFE' Model, it is found that the
customers in the income range of $15,001-30,000 has higher
level of satisfaction than those in the income range of $
45,001-60,000.
Then, we accept the Hypothesis 1.4
H2: Customer satisfaction toward THAI is affected by
their attitude with the reservation staff of
THAI.
The Pearson Product Moment Correlation is used to
explain this correlation between the customer attitude
74
Page 85
towards THAI and their satisfaction towards the THAI'S
reservation staff.
Table 5. Customer's Attitude towards Reservation Staff
Variable R Prob
Customer attitude toward THAI
. 7163 .000
From the above table, it can be seen that the
customer's attitude towards THAI'S reservation staff is
correlated to the customer satisfaction at the level of
significance 0.05. The moderately positive R means that if
the customer attitude towards reservation staff of THAI is
high, the customer satisfaction will be high, too.
We, then, accept the Hypothesis 2
H3: Customer satisfaction towards the service of
THAI'S reservation staff is correlated to the
communication behavior of the reservation staff
of THAI
The Pearson Product Moment Correlation is used to
explain this correlation between the customer satisfaction
and the communication behavior of the reservation staff of
THAI .
75
Page 86
Table 6. Communication Behavior of the Reservation Staff
Variable R Probability
THAI'Sreservationcommunicationbehavior
. 0432 .625
From the above table, it is found out that the
communication behavior of the reservation staff of THAI is
not correlated to the customer satisfaction towards the
service of THAI'S reservation staff at the level of
significance 0.05
Then we reject the Hypothesis 3.
76
Page 87
CHAPTER FIVE
CONCLUSIONS AND RECOMMENDATIONS
FOR FUTURE RESEARCH
This study "Customer Satisfaction in Communicating
with Reservation Staffs of THAI" has the following
research purposes:
1) To examine the correlation between the THAI's
customer satisfaction and the demographical data
2) To investigate the correlation between the
customer satisfaction with the THAI reservation
staff and by the customer attitude.
3) To examine the correlation between customer
satisfaction and the THAI's communication
behavior.
This study was conducted from January 20, 2003
through February 2, 2003. Data was gathered through the
completion of questionnaires by customers of THAI in the
Los Angeles area who were selected through random
sampling. One hundred fifty questionnaires were personally
handed out to respondents. One hundred thirty-nine
questionnaires or 93% were completed. The researcher used
purposive sampling to selecting three locations in Los
Angeles with a high potential of finding THAI's customers:
77
Page 88
THAI'S airport counter at Los Angeles International
Airport, THAI'S main ticketing counter at the North
America main office in Los Angeles, California, and the
Thai Town area in Hollywood, California. Participants were
selected using Systematic Random Sampling.
The questionnaire was divided into 4 parts:
1) General demographic information
2) Customer's past experience with the
reservation staff of THAI.
3) Customer satisf action-with.-communication .
behavior of the reservation staff of THAI
4) Customer's attitude towards the THAI'S
reservation staff.
In analyzing the data, percentage and average means
were used to explain demographical information of the
respondents. Descriptive statistics, the Hypothesis
Testing (F-test, and T-test, ANOVA, and Pearson's Product
Moment Correlation were used in regression analysis for
testing the hypothesis.
Conclusions
Demographical Data of the SamplesFrom the total respondents of 139, only 121 had
contact with THAI. They were comprised of 55 percent male
78
Page 89
and 45 percent female. Most of them are in the age range
of 26-35 followed by the range of 36-45. Most of them had
bachelor degrees or equivalent and followed by the group
with graduate degrees. Most of the respondents were
self-employed or students. In addition, most of them
earned annual salaries and wages in the range of US$
15,001-30,000 and US$ 30,001-45,000. ,
Service
Customers contact THAI primarily to change their
flight schedule, inquire flight information, inquire
information on the Royal Orchid Plus mileage program, and
check fare and availability respectively. Most of the
respondents will contact THAI during 9:01 a.m.-12:00 noon
following by 12:01 p.m.-3:00 p.m. and 3:01 p.m.-5:00 p.m.
The most difficult times to get connected to THAI' s
representative is, between, 9:01 a.m.-12:00 noon followed
by 3:01 p.m.-5:00 p.m. The majority of the respondents
were only connected to the answering .service and . 1
voicemail.
Customer Satisfaction with the Reservation Service
The customer satisfaction with the reservation
service of THAI was concluded to be 'in the moderate
degree. The respondents were most satisfies with the
service in that the staff speak clearly, followed by the
79
Page 90
staff speaking with the proper tone of voice and in a non
threatening manner respectively. The standard of service,
and the importance of problems are the two least
significant factors affected to the customer satisfaction,
Customer Attitude towards the Reservation- Staff
The respondents' attitude towards the reservation
staff of THAI was one of moderate approval. A majority of
the respondents agreed that THAI'S reservation staff is
knowledgeable and skilled in providing good service
quality. Along with that, most of the respondents
disagreed that the service charge is appropriate to the
quality of service.
Recommendation to Improve the Service Quality ofReservation Staff
Most of the respondents agreed that improvement of
the service quality of the reservation staff is very
important and most desired. The staff must be able to
control their emotions and be enthusiastic about problem
solving. Furthermore, the respondents want THAI to
increase its capability with more staff and phone lines to
cope with the higher demand of the customers during peak
times. The staff also should be regularly trained to be
more service-minded.
80
Page 91
Regression analysis data obtained through the SPSS
program revealed the following information
1. There was no correlation between customer
satisfaction and gender, age, and level of
education. Customer satisfaction is not
significantly affected by gender, age, and level
of education.
2. There was a positive correlation between
customer satisfaction and customer's income.
Customer satisfaction is affected by customer's
level of income. This finding correlated with
studies performed by Westbrook and Newman on
demographic characteristic of consumers as
determinants of consumer satisfaction.
3. There was a positive correlation between
customers' attitude and THAI'S reservation
staff. Most of the respondents answered that
they had favorable attitudes towards the
reservation staff. This finding supports
Oliver's findings that consumers' attitudes are
affected by consumer satisfaction.
4. There was no correlation between customer
satisfaction and communication behavior. This
means that the customer satisfaction is not
81
Page 92
significantly affected by the communication
behavior of the THAI reservation staff.
It is important to point out shortcomings in this
study that should be addressed, recommend ways in which it
may be refocused to fill gaps in the literature, and
outline potential areas for future research.
Recommendations for Future Research
1. Enlarging the population of the study to cover
other cities and other states within the United
States. Increasing the sample size is necessary
to better generalize the findings from the
sample population to the entire population of
THAI customers.
2. Future study should include the research on
finding out how customer satisfaction is
positively correlated to level of income to
determine how to increase customer satisfaction
in customers at the lower income range
3. Future study should also include research on
finding ways to promote favorable attitudes
towards THAI reservation staff to improve
customer satisfaction.
82
Page 93
In summary, while there have been improvements in
researching the issue of customer satisfaction there are
still many areas which deserve further study. The study of
customer satisfaction is necessary to find new ways to
increase customer satisfaction in order to win repeat
sales, maintain customer loyalty, and to gain new
customers to improve future profitability.
83
Page 94
APPENDIX A
LETTER TO RESPONDENTS
84
Page 95
Dear Respondents,
The following questionnaire is designed to collect data for a research paper in
customer satisfaction with the communication behavior of reservation staff of Thai
Airways -International Public Company Limited in Los Angeles as a partial ' ■ ‘ :
requirement to fulfill a Master degree in Intergrated Marketing Communication. All
responses are confidential and will be used for study purposes only. .
Your time and responses are greatly appreciated. The results of this study will
be utilized to improve the airline’s service quality as well as for future references.
Your sincerely,
Alina Homsangpradit
Graduate Student
California State University San Bernardino
85
Page 96
APPENDIX B
QUESTIONNAIRE
86
Page 97
Customer Satisfaction of THAI’s Questionnaire: Please read each question below and choose the answer that most clearly correspond to yourself or your evaluation.
Part 1 General Background
1. Sex
a. Male b. Female
2. Age
a. 17-25 b. 26-35
3.
c. 36-45
e. 56 and above
Education
a. High school or under
b. Undergraduate
c. Graduate
d. Post graduate
d. 46-55
4. Annual Income
a. $15,000 or less b. $15,001-30,000
c. $30,001-45,000
e. higher than $60,000
d. $45,000-60,000
5. Occupation
a. Student b. Self-Employed
c. Government Employee d. Professional ' -
e. Executive f. Other (Please specify)
87
Page 98
Part 2 Customer’s experience with THAI reservation service
1. Have you ever contacted with reservation staff of THAI in Los Angeles?
a. Yes (Please go to question 2)
b. No because If no please stop return this questionnaire tosender
1 In one month how often do you contact with the representative staff?
a. Once a week b. 2-3 time per week
c. 4-5 time per week d. Everyday
f. Other (Please specify)
2, The purpose of the contact with the reservation staff:
a. Make reservation
c. Ask about the price
e. Ask about airline information
b. Ask flight schedule inquiry
d. Change the reservation
f. Other please specify
3. What time do you usually contact the representative of THAI in Los Angeles?
a. 7.00a.m. - 9.00 a.m. (PST) b. 9.01 a.m.-noon (PST)
c. 12.01p.m.-3.00 p.m. (PST) d. 3.01 p.m. - 5.00 p.m. (PST)
4. When you make a phone call to make reservation, how are yourcalls answered? (Please choose one)
a. Answering machine then a representative
b. Answering machine and long waiting time before answered by a representative.
c. Other (Please specify)
88
Page 99
Part 3 Satisfaction when you contact the reservation staff of THAI
Ver
y Sa
tisfie
d
Satis
fied
Neu
tral
Uns
atis
fied
Ver
yU
nsat
isfie
d
1. Staff speak clearly
2. Staff greet and states his/her name when answering the phone
3. Staff apologize sincerely when they have problems
4. Staff never argues with you
5. Staff speak with proper tone of voice
6. Staff are not threatening
7. Staff ends call courteously
8. Staff can control their emotions
9. Staff are not rude
10. Staff take good care of you every time
11. Staff think your problem is important to them
12. Staff are enthusiastic in solving your problem
13. Staff never refuses to help you
14. Staff treat you as if you were important
15. Staff give good advice
16. All Staff work according to the same standards
17. Overall satisfaction with customer reservation of THAI
a. Very satisfied b. Satisfied
c. Neutral d. Unsatisfied
e. Very unsatisfied
89
Page 100
Part 4 What is your opinion about the following question?
What is your opinion about this Stro
ngly
agre
e
Agr
ee
Not
sure
Dis
agre
e
Stro
ngly
disa
gree
1. Staff are knowledgeable and skilled in providing good service
2. Staff work efficiently3. Staff provide polite service5. Staff service is pleasant6. The service from staff is organized
equal as world standard7. The service charge is appropriate to
quality of service
90
Page 101
APPENDIX C
TABLES
91
Page 102
Table 1. The percentage of respondents by gender
Gender Frequency Percentage
Male 66 54.55
Female 55 45.45
Total 121 100
Table 2. The percentage of respondents grouped by age
Age Frequency Percentage
17-25 10 8.26
26-35 48 39.67
36-45 33 27.27
46-55 19 15.70
56 and above 4 3.31
Not answer 7 5.79
Total 121 100
Table 3. The percentage of respondents by education
Education Frequency . Percentage
High school or under 10 8.26
Undergraduate 66 54.55
Graduate 23 19.01
Post graduate 17 14.05
Not answer 5 4.13
Total 121 100
92
Page 103
Table 4. The percentage of respondents by annual income
Annual income Frequency Percentage
$15,000 or less 19 15.70
$15,001 - 30,000 49 40.50
$30,001 - 45,000 32 26.45
$45,001 -60,000 12 9.92
Higher than $60,000 7 5.79
Not answer 2 1.65
Total 121 100
Table 5. The percentage of respondents by occupation
Occupation Frequency Percentage
Student 31 25.62 .
Self -Employed 34 28.10
Government employee 13 10.74
Professional 10 8.26 ••
Executive 7 5.79
Other 25 20.66
Not answer 1 0.83
Total 121 100
Table 6 The percentage of respondents who ever contacted with reservation staff of THAI
Frequency Percentage
Yes 121 87.05
No 18 12.95
Total 139 100
93
Page 104
Table 7 The percentage of the frequency of customer contact with reservation staff of THAI in one month
The frequency of contact with reservation staff
Frequency Percentage
Less than once a month 103 85.12
Once a month 12 9.92
Once a week 4 3.31
Other 2 1.65
Total 121 100
Table 8. The percentage of the purpose of the contact with reservation staff
Purpose Frequency Percentage
Make reservation 9 7.44
Flight schedule inquiry 32 26.45
Ask about the ticket price 7 5.79
Change the reservation 44 36.36
Ask about airline information 24 19.83
Other 3 2.48
Not answer 2 1.65
Total 121 100
94
Page 105
Table 9 The percentage of the range of time that customer usually contact the reservation.
Range of time (PST) Frequency Percentage
7.00 a.m. - 9.00 a.m. 13 10.75
9.01 a.m. - noon 61 50.42
12.01 p.m. - 3.00 p.m. 24 19.83
3.01 p.m. - 5.00 p.m. 23 19
Not answer 0 0
Total 121 100
Table 10. The percentage of how the call was answered when customer made a call to THAI
Frequency Percentage
Answering machine then a representative
41 33.88
Answering machine and long waiting time before answered by
representative
63 52.07
Other 17 14.05
Not answer 0 0
Total 121 too
95
Page 106
Table 11. The amount, percentage, and mean of respondents by customers satisfaction of communication behavior of THAI’s reservation staff
Description
Opinion Avg SD Summary
"1
It’•c
K
N
□u-H/I-dCE?u>
%
*3
*•G
N
3U—<
0
% N
"cd3uz
%
It
N
□u—tZJZ33□
%
E?u>
N
T3O
cdcoG
% N
73Oo£co
§cb
%
1. Staff speaks clearly
2. Staff greets and states his/her name whenAnswering the Phone
3. Staff apologizes sincerely when they have problems
4. Staff never agues with you
5. Staff speaks with proper tone of voice
10
10
9
10
10
8.26
8.26
7.44
8.26
8.26
68
44
40
40
46
56.2
36.4
33.1
33.1
38
35
37
49
45
44
28.9
30.6
40.5
37.2
36.4
3
24
17
21
14
2.48
19.8
14
17.4
11.6
1
2
2
1
2
0.83
1.65
1.65
0.83
1.65
4
4
4
4
5
3.306
3.306
3.306
3.306
4.132
3.58678
3.19835
3.20661
3.20661
3.27273
0.67
0.95
0.86
0.89
0.88
High
Moderate
Moderate
Moderate
Moderate
6. Staff is not Threatening
7. Staff ends call Courteously
8. Staff can control their emotions
9. Staff is not rude
10.Staff takes good care of you everytime
11 .Staff thinks your problem is Important to them
11
9
5
8
8
7
9.09
7.44
4.13
6.61
6.61
5.79
45
42
42
44
40
29
37.2
34.7
34.7
36.4
33.1
24
41
40
37
42
52
53
33.9
33.1
30.6
34.7
43
43.8
18
24
29
21
15
26
14.9
19.8
24
17.4
12.4
21.5
2
2
4
2
2
2
1.65
1.65
3.31
1.65
1.65
1.65
4
4
4
4
4
4
3.306
3.306
3.306
3.306
3.306
3.306
3.27273
3.16529
3.02479
3.19008
3.20661
3.00826
0.93
0.93
0.94
0.9
0.84
0.86
Moderate
Moderate
Moderate
Moderate
Moderate
Moderate
96
Page 107
Description
cdGOE?o>
N %
Opinion
cdCO
N %
cd«-■3Oz
N %
e
N %
C3E? M O C> Cl
N %
12.Staff is enthusiastic in solving your problem
13. Staff never refuses to help you
14. Staff treats you as if you wereimportance
15.Staff gives good advice
16. All staff work according to the same standards
17.0verallsatisfaction
4.96
4.96
4.96
10 8.26
4.96
4.13
37
41
39
43
32
46
30.6
33.9
32.2
35.5
26.4
38
49
50
52
46
51
48
40.5
41.3
43
38
42.1
39.7
22
18
18
17
24
15
18.2
14.9
14.9
14
19.8
12.4
2.48
1.65
0.83
0.83
3.31
0.83
N
Una
nsw
ered
s® 0s
Avg SD Summary
3.306 3.07438 0.88 Moderate
3.306 3.15702 0.84 Moderate
4.132 3.13223 0.82 Moderate
3.306 3.26446 0.86 Moderate
3.306 3 0.89 Moderate
4.959 3.17355 0.79 Moderate
97
Page 108
Table 12. Customer’s attitude toward THAI’s Staff
Opinion Avg. SD Summary
rong
lyA
gree
■ Agre
e
)t Su
re <DUencdw
bflCo<DUoncdco
T3a£co
4=CO Z c5 £3
CO Q D
N % N % N % N % N % N %
1. Staff isknowledgea ble and skilled in providing good service
10 8.26 58 47.9 46 38 2 1.65 1 0.83 4 3.306 3.5124 0.68 High
2. Staff works efficiently 3 2.48 51 42.1 53 43.8 8 6.61 1 0.83 ■5 4.132 3.26446 0.69 Neutral
3. Staffprovidespolite 7 5.79 45 37.2 45 37.2 18 14.9 1 0.83 5 4.132 3.19835 0.83 Neutral
service
4. Staff service is Pleasant 3 2.48 46 38 53 43.8 13 10.7 1 0.83 5 4.132 3.18182 0.73 Neutral
5. The servicefrom staff is organized equal as world standard
6 4.96 54 44.6 48 39.7 7 5.79 1 0.83 5 4.132 3.34711 0.68 Neutral
6. The servicecharge is appropriate to quality of service
1 0.83 28 23.1 46 38 35 28.9 7 5.79 4 3.306 2.7438 0.89 Neutral
98
Page 109
REFERENCES
Anderson, & Sullivan. (1993).The antecedents andconsequences of customer satisfaction for firms. Marketing Science, 12, 125-143.
Anderson, Fornell, & Lehmann. (1994), Customersatisfaction, market share and profitability:Findings from Sweden. Journal of Marketing, 58,53-56.
Andreasen, & Best. (1977). Consumers complain-doesbusiness listen? Harvard Business Review, 77, 93-101.
Andrews, & Whitey. (1976). Social indicators of well being. New York: Plenum Press.
Banfe, C. (1991). Airlines management. Englewood Cliffs, NJ: Prentice-Hall, 1991
Batra, & Hoolbrook. (1990). Developing a typology ofaffective responses to advertising. Psychology and Marketing, 7, 11-25.
Bearden, & Teel. (1983). Selected determinants of consumer satisfaction and complaint reports. Journal of Marketing Research, 20, 21-28.
Berio, D. K. (1960). The process of communication: Anintroduction to theory and pratice. San Francisco: Holt, Rinechart and Winston, Inc.
Bradburn. (1969). The structure of psychological well-being. Chicago: Aldine.
Cadotte, Woodruff, & Jenkins. (1987). Expectations andnorms in models of consumer satisfaction. Journal of Marketing Research, 24,305-314.
Cantril. (1965). The pattern of human concerns. New Brunswick, NJ: Rutgers University Press.
Churchill, & Suprenant. (1982). An investigation'into thedeterminants of customer satisfaction. Journal of Marketing Research, 19, 491-504.
99
Page 110
Cohen, & Areni. (1991). Affect and consumer behavior. In T. S. Robertson, & Kasarjian (Eds.), Handbook of Consumer Theory and Research (pp. 188-240). Englewood Cliffs, NJ: Prentice-Hall.
Cooley, C. (1909). Social organization. New York
Cushman, D. P. (1985) . Communication in interpersonal1'relationships. New York: State University of New York Press.
Czeipiel, Rosenberg, & Akerele. (1974). Perspectives on consumer satisfaction. Chicago: American Marketing Association.
Day & Landon. (1976). Collecting comprehensive consumercomplaint data by survey research. In B. B. Anderson (Ed.), Advances in consumer research (Vol.3). Atlanta: Association for Consumer Research.
Engel, Kollat, & Blackwell. (1973). Consumer behavior, (2nd ed.). New York: Holt, Rinehart, & Winston.
Fornell. (1992). A national customer satisfaction barometer: The Swedish experience. Journal of Marketing, 55, 1-21.
Halloran, J. D. (1967). Attitude formation and change. Great Britain: Leicester University Press.
Harrell, G. D. (2002). Marketing: Connecting with customer. Englewood, NJ: Prentice-Hall.
Herzberg, M., & Synederman, B. B. (1959). The motivation to work, (2nd ed.). New York: John Wiley & Sons, Inc.
Horley, & Little. (1985). Affective and cognitivecomponents of global subjective well-being measures. Social Indicators Research, 17, 189-197.
Hunt, G. T. (1980). Communication skill in theorganization. Englewood Cliffs, NJ: Prentice Hall, Inc.
100
Page 111
Hunt, H. K. (1977). Consumer satisfaction/dissatisfaction: overview & research directions. In H. Hunt (Ed.), Conceptualization and measurement of consumersatisfaction and dissatisfaction. Cambridge, MA: Marketing Science Institute.
Isen, Clark, Shalker, & Karp. (1978). Affect,accessibility of material in memory, and behavior: A cognitive loop. Journal of Personality and Social Psychology, 36, 1-12.
Izard. (1977). Human emotions. New York: Plenum.
Johnson, Anderson, & Fornell. (1995). Rational andadaptive performance expectations in a customer satisfaction framework. Journal of Consumer Research, 21, 695-707.
Kelley. (1967). Attribution theory in social psychology.In D. Levine (Ed.), Nebraska symposium on motivation. Lincoln, NB: University of Nebraska Press.
Kolter, P., & Armstrong, G. (1999). Principles of marketing. Englewood, NJ: Prentice Hall.
Lamb, C. W., Jr., Hair, J. F., Jr., & McDaniel, C. (2002). Marketing. South-Western Publishing.
LaTour, & Peat. (1979). Determinants of consumersatisfaction: A field experiment. Paper presented at the Annual Convention of the American Psychological Association, New York, NY.
Lundstrom, & Lamont. (1976). The development of a scale to measure consumer discontent. Journal of Marketing Research, 13, 373-381.
Mueller, D. J. (1986). Measuring social attitude: Ahandbook for researchers and practitioners. New York: Teachers College Press.
Oliver, & Swan. (1989). Equity and disconfirmationperceptions as influences on merchant and product satisfaction. Journal of Consumer Research, 16, 372-383 .
Oliver, R. L. (1996). Satisfaction: A behavioralperspective on the consumer. New York: Me Craw-Hill.
101
Page 112
Oliver. (1980). A cognitive model of the antecedents and consequences of satisfaction decisions. Journal of Marketing Research, 17, 460-469.
Oliver. (1981). Measurement and evaluation of satisfaction process in retail settings. Journal of Retailing, 57, 25-48, 138-139.
Oliver. (1989). Processing of the satisfaction response in consumption: A suggested framework and research propositions. Journal of Consumer Satisfaction, Dissatisfaction and Complaining Behavior, 2, 1-16.
Oliver. (1993) . Cognitive, affective, and attribute bases of the satisfaction response. Journal of Consumer Research, 20, 418-432.
Olshavsky, & Spreng. (1989). A desires as standard' model of consumer satisfaction. Journal of Consumer Satisfaction, Dissatisfaction and ComplainingBehavior, 2, 49-54.
Pfaff. (1973). An index of consumer satisfaction;Proceedings (pp. 713-737). Iowa City: Association for Consumer Research.
Plutchik. (1980). Emotion: A psychoevolutionary synthesis. New York: Harper & Row.
Russel. (1979). Affective space is bipolar. Journal of Personality and Social Psychology, 37, 345-356.
Scherer, & Tannenbaum. (1986). Emotional experiences in everyday life: A survey approach. Motivation and Emotion, 10, 295-314.
Schiffman, L. G., & Kanuk, L. L. (1978). Consumer behavior. Englewood, NJ: Pretice Hall, Inc.
Schramm, W., & Porter, W. E. (1982). Men, women, message, and media: Understanding human communication. NewYork: Happer & Row, Publisher.
Solomon, M. R. (2002). Consumer behavior. Englewood, NJ: Prentice-Hall, Inc.
102
Page 113
Spreng, Mackenzie, & Olshavsky. (1996). A reexamination of the determinants of consumer satisfaction. Journal of Marketing, 60, 15-32.
Swan, & Combs. (1976). Product performance and consumer satisfaction: A new concept. Journal of Marketing,40, 25-33.
Thurstone, L. L. (1931). The measurement of social attitudes J. abnorm.soc. Psychol.
Tiger. (1979). Optimism, The biology of hope. New York: Simon and Schuster.
Triandis, H. C. (1971). Attitude and attitude change. New York: John Wiley & Sons, Inc
Warneryd. (1988). Economic psychology as a field of study. In W. F. Van Raaij, G. M. Van Veldhoven, & K.Warneryd (Eds.), Handbook of economic psychology (pp. 2-41).
Wesmann, Sc Ricks. (1966) . Mood and personality. New York: Holt, Rinehart, & Winston, Inc.
Westbrook, & Newman. (1978). An analysis of shopper dissatisfaction for major household appliances. Journal of Marketing Research, 15, 456-466.
Westbrook, & Reilly. (1983). Value-percept disparity: Of consumer satisfaction. In R. P. Bagozzi, Sc A. M. Tybout (Eds.), Advances in consumer research, Vol.10 (pp. 256-261). Ann Arbor, MI: Association for Consumer Research.
Westbrook. (1980). Intrapersonal affective influences upon consumer satisfaction with products. Journal of Consumer Research, 7, 49-54.
Westbrook. (1987). Product/consumption-based affective responses and postpurchase processes. Journal of Marketing Research, 24, 258-270.
Woodring, C., & Huck, G. H. (1991). Reservation and ticketing. Poughkeepsie, NY: Apllo Books.
103
Page 114
Woodruff, Cadotte, & Jenkins. (1983). Modeling consumersatisfaction processes using experience-based norms. Journal of Marketing Research, 20, 296-304.
Yi. (1991). A critical review of customer satisfaction. In V. A. Zeithaml (Ed.), Review of marketing 1990 (pp. 68-123) Chicago: American Marketing Association.
104