55
©TNS 2012 Customer Satisfaction Surveys Raymond Gee, Research Director, TNS

©TNS 2012
Customer Satisfaction Surveys Raymond Gee, Research Director, TNS
©TNS 2012
Building a customer-centric research program
Stakeholder Management
2

©TNS 2012
What are organizations focus on today?
3
Smile chart
Stakeholder Management

©TNS 2012
Customer retention: gaining more customers than you lose
4
Stakeholder Management
Gain
Loss

©TNS 2012
Customer loyalty: customers spending more with you
5
Stakeholder Management

©TNS 2012
Customer advocacy: customers attracting new customers
6
Stakeholder Management

©TNS 2012 7
Today’s business
Three ways loyal customers are essential for growth
Loyalty & new spend New customers
Stakeholder Management

©TNS 2012
Excellent customer experiences are vital for sustainable growth
“If there’s one reason we have done better than our peers in the Internet space over the last six years, it is because we have focused like a laser on customer experience, and that really does matter, I think, in any business.”
Jeff Bezos, CEO Amazon.com
8
Stakeholder Management

©TNS 2012
But keeping loyal customers is increasingly difficult and costly
9
Gain
Loss
Stakeholder Management

©TNS 2012
Keeping loyal customers is increasingly difficult and costly
10
Stakeholder Management

©TNS 2012
Keeping loyal customers is increasingly difficult and costly
11
*! @# !?
Stakeholder Management

©TNS 2012
To grow you need to create and map a customer-centric strategy to your organisation
12
Stakeholder Management

©TNS 2012 13
Building a customer-centric strategy
Stakeholder Management
The customer is the ultimate judge of whether the quality of your goods and services is satisfactory and acceptable. This is why the customer must be at the centre of any quality improvement program. The customer experience is a permanent function that should permeates all aspects of an organization. It falls in the same class as terms like cost, expenses, assets and budget.
©TNS 2012
Designing Effective Research:
Approaches and Questions
14

©TNS 2012 15
The Evolution of Customer Satisfaction Research
Stakeholder Management
Customer Satisfaction
Customer Loyalty
Customer Engagement
Stakeholder Engagement Management
Balanced Scorecard

©TNS 2012 16
The Research Challenge
1) What are the research and business
objectives that you are trying to
accomplish?
2) How do you solicit honest and
accurate feedback that is reflective
of someone’s thoughts and
feelings?
3) How do you create a set of sample
data is representative of the entire
universe?

©TNS 2012
Structuring A Research Program
17
Our clients business issues
Steps To Take Into Account
Identify research questions
Sampling Engaging
the stakeholder Asking the
right questions
Analysis
Action the data Travellors
Tenants
Media & other
Influencer
Employees
©TNS 2012
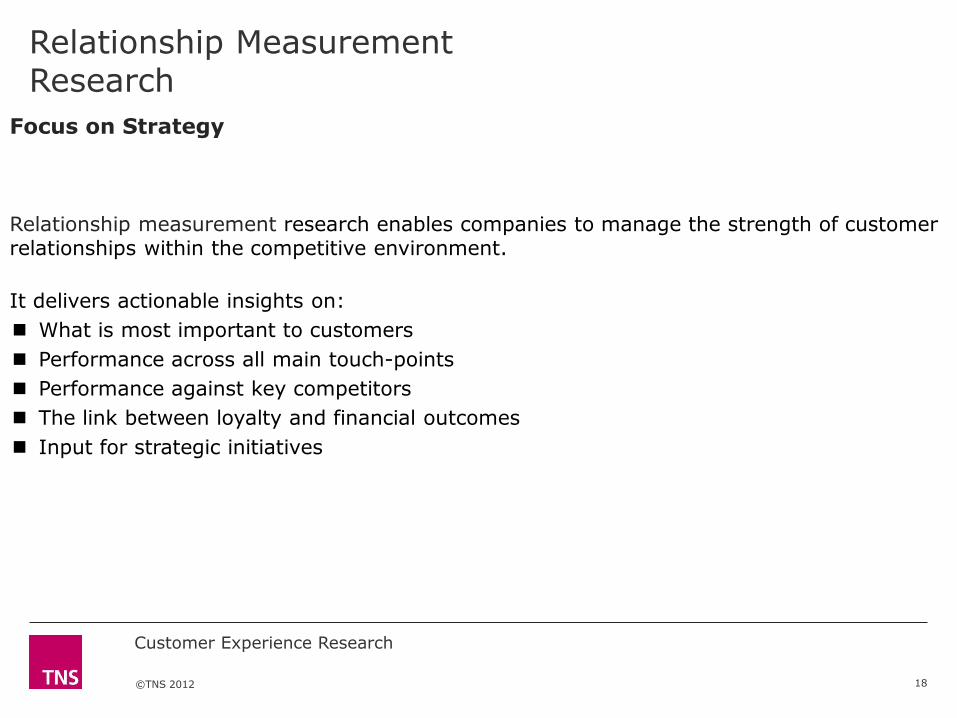
Relationship Measurement Research
18
Relationship measurement research enables companies to manage the strength of customer relationships within the competitive environment.
It delivers actionable insights on:
What is most important to customers
Performance across all main touch-points
Performance against key competitors
The link between loyalty and financial outcomes
Input for strategic initiatives
Focus on Strategy
Customer Experience Research

©TNS 2012
Transactional Research
19
Transactional research enables companies to manage the service delivered across all its transaction points to improve operational performance and ensure the customer has a positive experience.
It delivers actionable insights on:
Whether the service is satisfying customers
How well minimum service standards are met
Where are strengths and weaknesses in service
Who are the unhappy customers
What operational improvements need to be made
Transactional research can also be used to identify unhappy customers for remedial action in real time – reducing the risk of their defection and negative word of mouth.
Manage Customer Satisfaction
at the Point of Interaction
Customer Experience Research
©TNS 2012
Focus Groups
20
Focus groups are discussion sessions with 8 to 12 participants, led by a moderator, that allow companies to learn more about what customers think or feel in a less structured process. Focus groups are mainly used in two contexts in stakeholder management research:
Prior to a survey, assist in identifying the most important issues and expectations that need to be measured or incorporated in a survey.
After a survey, to dive deeper into issues and concerns that were raised by stakeholders.
For deeper understanding of the customers
Customer Experience Research
©TNS 2012
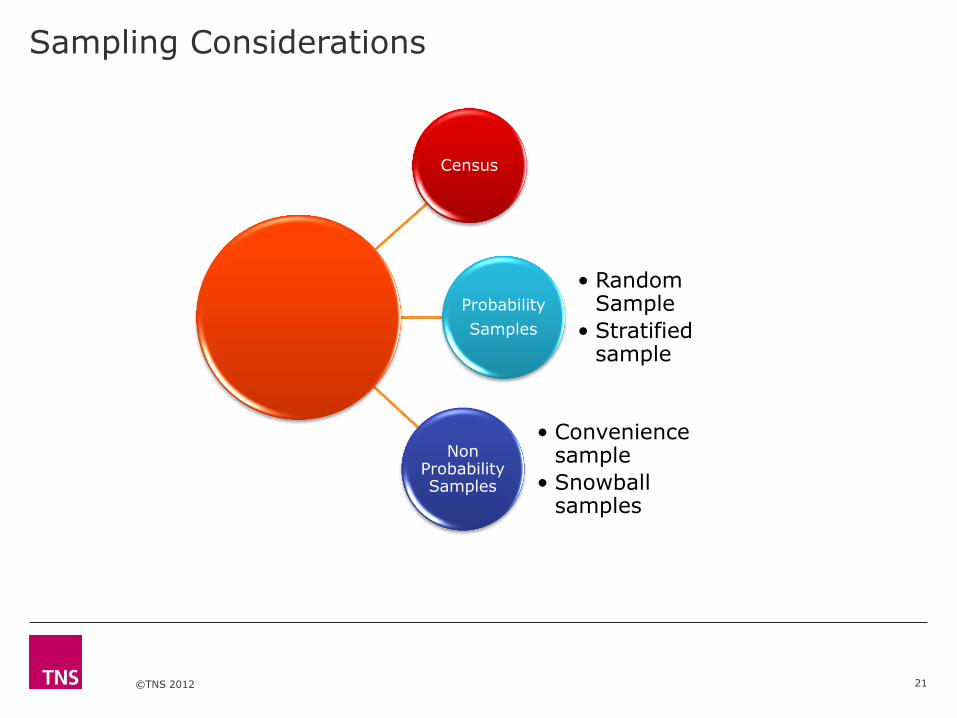
Sampling Considerations
21
Census
Probability
Samples
• Random Sample
• Stratified sample
Non Probability Samples
• Convenience sample
• Snowball samples

©TNS 2012
Engaging Stakeholders
22
Telephone
• Panels, Email, Pop-ups
Online
Mail back
Interactive Voice Response
Intercepts

©TNS 2012
Questionnaire and Analysis
23
The Questionnaire
What do you rate?
Direct versus indirect lines of questioning
Answer scales
Length of interview
Revealing survey sponsor
The Analysis
Topline results
Bi-variate results
Verbatims
Advanced multivariate statistics

©TNS 2012
Completing the loop from measurement to change
Stakeholder Management
24
Ensuring results have impact
Advanced process analysis
Action planning workshops
KPIs in bonus plans
Linking results to financial and stakeholder relationship measures

©TNS 2012
TRI*M Customer Experience
25
Workshop
Getting Into The Details

©TNS 2012 26
The two most important components to a satisfaction/loyalty/engagement survey
Stakeholder Management
1) A metric/index that measures the state of your stakeholders (aka KPI) 2) A roadmap (AKA Key driver analysis) that identifies how to improve your KPIs

©TNS 2012 27
Constructing a Metric/Index
Stakeholder Management
Weighted average of
attributes most influential to
business results
Holistic, 3000-feet above the
ground measure of the
relationship
Option 1 Option 2

©TNS 2012 28
Constructing a Metric/Index - Examples
Stakeholder Management
Location X15%
Parking X10%
Clarity of signage X25%
Interior décor X20%
Emergency readiness X5%
Available of stores and restaurants X20%
Cleanliness X5%
Overall satisfaction
Likelihood to speak positively about
Comparison to other airports
Meeting expectations
Recommend
Trust
Delight
Option 1 Option 2
©TNS 2012 29
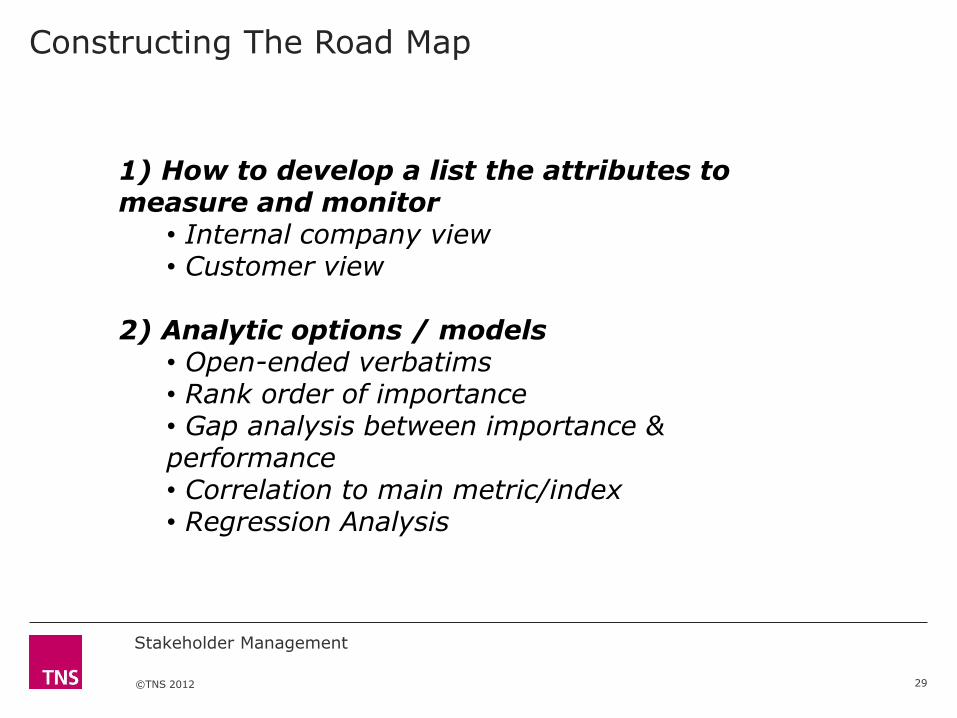
Constructing The Road Map
Stakeholder Management
1) How to develop a list the attributes to measure and monitor
• Internal company view • Customer view
2) Analytic options / models
• Open-ended verbatims • Rank order of importance • Gap analysis between importance & performance • Correlation to main metric/index • Regression Analysis

©TNS 2012 30
Do’s and Don’ts of engaging stakeholders
Stakeholder Management
Do Don’t
• Use a neutral third party interviewers • Provide as much information to interviewers as possible •Notify respondents in advance about the survey • Provide a contact name or number for respondents to reach out to, if they have questions •Be prepared to field questions about the survey • Thank the respondent • Optional: provide a respondent incentive
• Give interviewers freedom to deviate from interviewer script • Deviate from agreed methods of data collection • Invite new (or sometimes substitute) respondents that were not selected for survey participation • Mislead respondents about length of questionnaire • Persistently harass respondents to participate • Press for answers when respondents aren’t sure

©TNS 2012
TRI*M Customer Experience
31
Case studies
Victoria Airport Authority

©TNS 2012
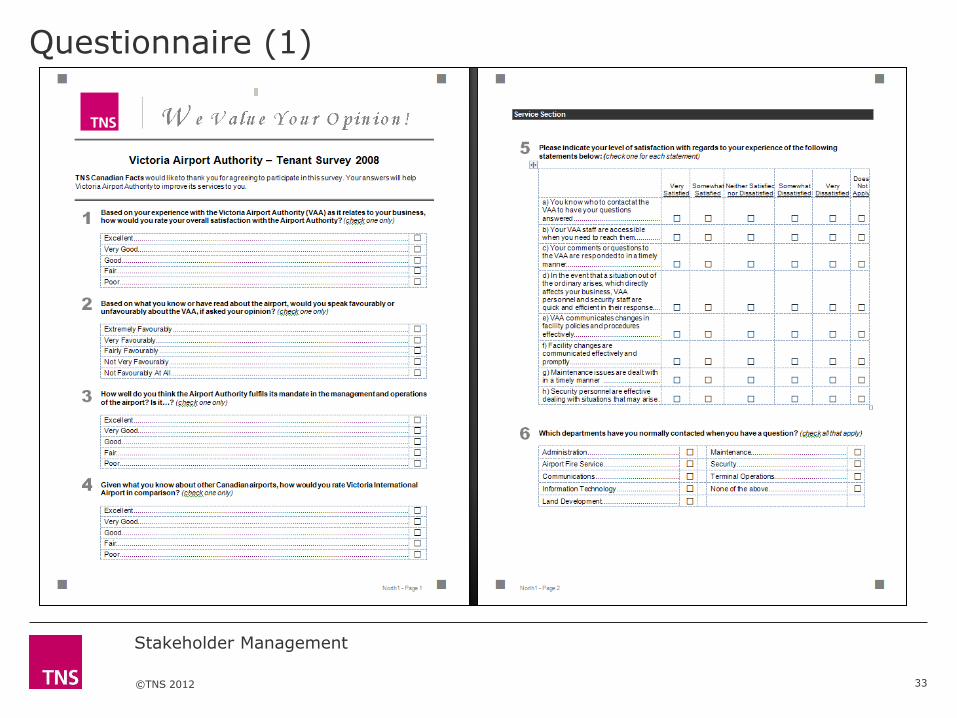
Engaging VAA Tenants
Study 1 Questionnaires were mailed to businesses operating either in the terminal
building or on airport grounds
Completed surveys returned by business post
A prize draw, offering the chance to win a gift voucher ($250) was offered as an incentive
Telephone calls were also placed to non-responders during the field period in order to boost response rates
VAA contact was made available to field inquiries
Stakeholder Management
32
©TNS 2012
Questionnaire (1)
33
Stakeholder Management

©TNS 2012
Questionnaire (2)
34
Stakeholder Management

©TNS 2012
Questionnaire (3)
35
Stakeholder Management

©TNS 2012
ExcellentVery Good
GoodFair
Poor
43% 43%
7%
3%
3%
30% 50%
10% 7%
0%
Overall Satisfaction VAA Compared to Other Cdn Airports
VAA Tenant’s have higher satisfaction ratings whilst competitors
Stakeholder Management
36

©TNS 2012
Customer satisfaction will have a strong impact on the relationship (1)
Stakeholder Management
37
35%
43%
43%
30%
10%
40%
16%
18%
14%
21%
50%
33%
30%
42%
35%
28%
7%
20%
57%
25%
37%
Availability of parking
Cost of parking
Ground transportation to/from city
Quality & service of retail vendors
General cleanliness in terminals
Quality & service of the food vendors
service provided by cleaning staff
Does not apply 1. Very dissatisfied
2. Somewhat dissatisfied 3. Neither satisfied or dissatisfied
4. Somewhat satisfied 5. Very satisfied
Dissatisfied Satisfied
0.8
0.7
0.6
0.5
0.5
0.3
0.2
Importance
Most important
to relationship
Satisfaction

©TNS 2012
18%
8%
32%
32%
25%
24%
45%
63%
32%
Signage inside terminal building
Signage leading to the terminal
Signage to direct public to businesses outside terminal
Does not apply 1. Very dissatisfied
2. Somewhat dissatisfied 3. Neither satisfied or dissatisfied
4. Somewhat satisfied 5. Very satisfied
Customer satisfaction will have a strong impact on the relationship (2)
Stakeholder Management
38
Dissatisfied Satisfied
0.5
0.4
0.4
Importance Satisfaction

©TNS 2012
Suggestions to Improve Facilities
39
“Better permanent lighting in the staff overflow parking lot.”
“More signage inside the terminal...”
“…Access to a pager system.”
“Signage for easy camp tenants…”
“You need people with a helpful attitude, not negative.”
“Our staff levels have increased and we need to increase lease space for a lunchroom. More space.”
“Better parking facilities, or parking shuttle service.”
“Free wi-fi for travellers…”
“… more healthy food item choices…”
“…have red-coats help passengers all over the terminal (like in Kelowna airport).”
“A room for taxi drivers by the bullpen so that they do not gather inside the terminal.”
“Improve the access from pat bay highway.”
Stakeholder Management
©TNS 2012
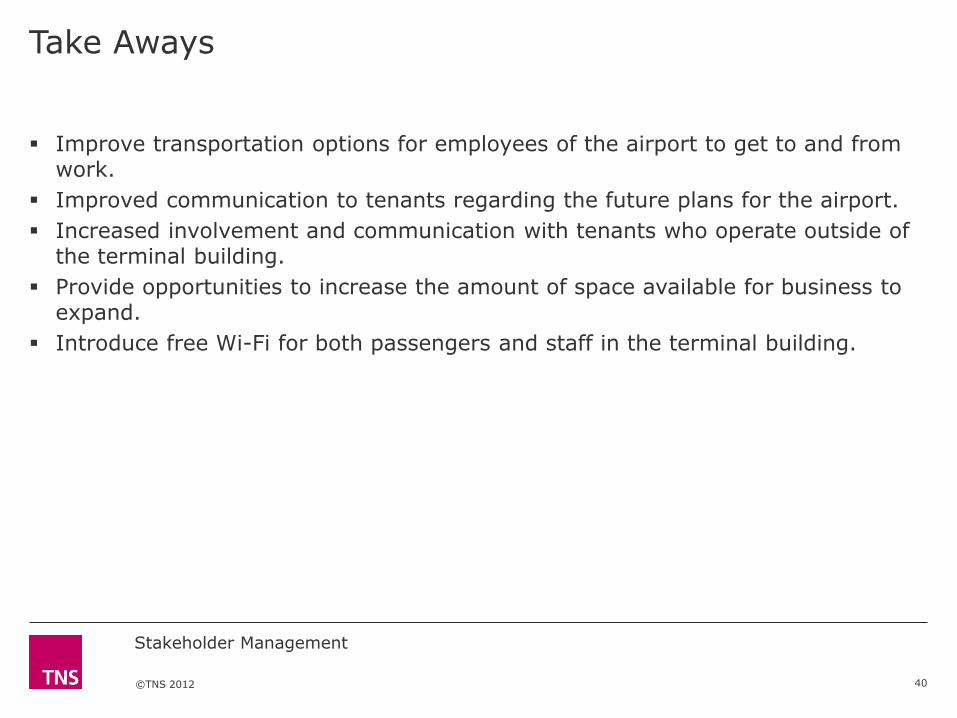
Take Aways
Improve transportation options for employees of the airport to get to and from work.
Improved communication to tenants regarding the future plans for the airport.
Increased involvement and communication with tenants who operate outside of the terminal building.
Provide opportunities to increase the amount of space available for business to expand.
Introduce free Wi-Fi for both passengers and staff in the terminal building.
Stakeholder Management
40

©TNS 2012
Engaging Local Media
Study 2 A journalist database was compiled by the VAA
List was augmented by TNS through access to our own media database
Telephone interviews
Stakeholder Management
41

©TNS 2012
Questionnaire
Stakeholder Management
42
X.) How satisfied are you with the Victoria Airport communications with the Media? Are you…?
Very Satisfied
Somewhat satisfied
Neither satisfied nor dissatisfied
Somewhat dissatisfied
Very dissatisfied
X.) How would you rate the experience compared to dealing with other organizations of a similar size to the Victoria Airport Authority?
Better
Same
Worse
X.) How would you rate the Victoria Airport Authority on the following? Please rate the topics from 1 to 10 where 10 would be excellent and 1 would be poor.
10 Excel-lent
9 8 7 6 5 4 3 2 1 Poor
Getting in contact with the appropriate person to answer your inquiries.
Providing you with the information you need in a timely manner.
Providing you with honest and transparent answers to any questions you have.
Providing you with satisfactory answers or information to any inquiries you might
have.
X.) What else could the Victoria Airport Authority do to improve communications with the media?

©TNS 2012
27%
14%
55%
0%
0%
5%
Very Satisfied
Somewhat
Satisfied
Neither
Somewhat
Dissatisfied
Very
Dissatisfied
Don't Know
Satisfaction with VAA Communications (n=22)
20%
80%
0%
0%
Better
Same
Worse
Don't Know
Compared to Other Organizations (n=10)
Majority of journalists say they are satisfied with the VAA’s media communications…their VAA experience is the “Same” as their dealings with other organizations
Stakeholder Management
43

©TNS 2012
VAA provides honest, transparent and satisfactory answers in a timely manner
44
Stakeholder Management
10% 10%
10%
10%
10%
40%
60%
50%
50%
40%
20%
30%
30%
10%
10%
10%
0% 20% 40% 60% 80% 100%
% of journalists who have had contact with the VAA in past two years
(n=10)
1 2 3 4 5 6 7 8 9 10
Providing you with satisfactory answers
Providing you honest and transparent answers
Providing you with the information you need in a
timely manner
Getting in contact with the right person

©TNS 2012
Suggestion Box For Improving Communications
45
Stakeholder Management
“Send out information about features ideas and to notify the media
about pubic meetings.”
“Send me e-mails with contact names.”
“To have better person outreach. The airport should try harder to be
more active in touching base and be aware of current issues and be
more aggressive.”
“Put us on your e-mail list.”
“Supply a contact list at the VAA to be contacted if needed.”
“To start by communicating with the media personnel.”
“Send out a list of their core contact people 24\24.”
“Send out a contact list by e-mail (never seen anything from
them).”
“Send out press releases about what is going on.”
“1. More regular updates. 2. Being more pro-active in getting in
touch with us.”
“More immediate information from routine matters like weather
delays.”
“Have regular updates.”
“To send press releases to our editor related to our magazine
subjects which is food and wine travel magazine.”
“Send out traffic updates compared to preceding months or years.”

©TNS 2012
TRI*M Customer Experience
46
Group Activity
©TNS 2012
Group Exercise – IPad2
Stakeholder Management
47
What questions would you ask an IPad2 owner?

©TNS 2012
Questionnaire 1) Please rate your overall satisfaction with your iPad2.
Stakeholder Management
48
Very Dis-
satisfied
1
2
3
4
Very Satisfied
5
Overall Satisfaction
2) Please rate your satisfaction with the following
attributes of your iPad2.
Satisfaction with Attribute
Very Dis-
satisfied
1
2
3
4
Very Sat-
isfied
5
Quality
Customer Service when buying
Customer Support after purchase
Value for the money
Delivery
Ease of set up
Design
Portability
3) Please rate the importance of the following attributes when buying iPad2. Importance of
Attribute
Not at all
Important
1
2
3
4
Very Important
5
Quality
Customer Service when buying
Customer Support after purchase
Value for the money
Delivery
Ease of set up
Design
Portability
4) Do you have any comments and suggestions regarding your iPad2?
©TNS 2012
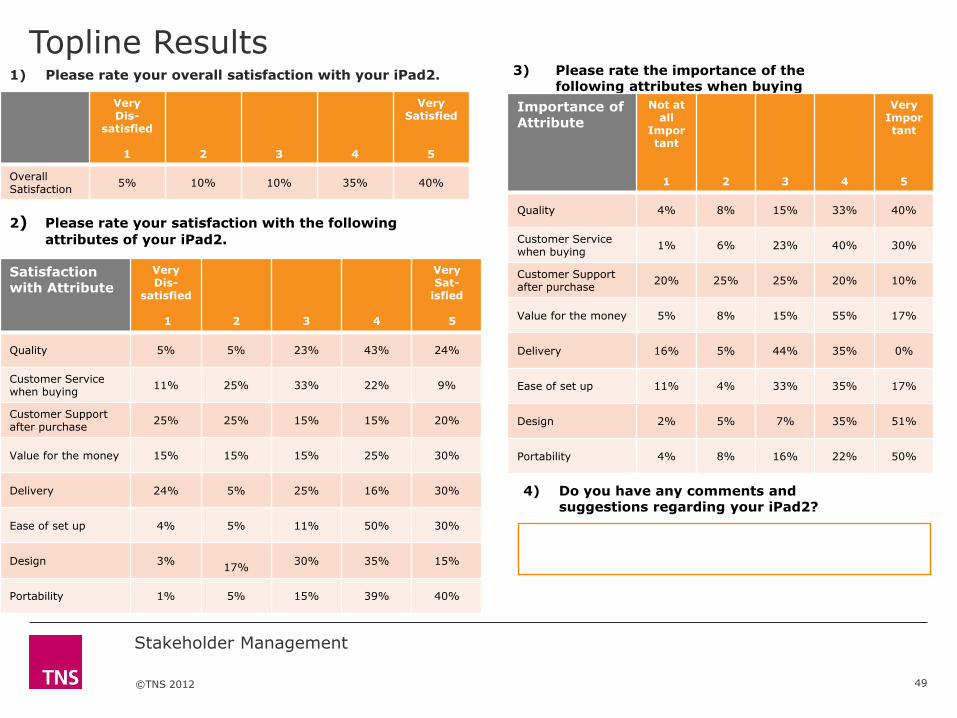
Topline Results 1) Please rate your overall satisfaction with your iPad2.
Stakeholder Management
49
Very Dis-
satisfied
1
2
3
4
Very Satisfied
5
Overall Satisfaction
5% 10% 10% 35% 40%
2) Please rate your satisfaction with the following
attributes of your iPad2.
Satisfaction with Attribute
Very Dis-
satisfied
1
2
3
4
Very Sat-
isfied
5
Quality 5% 5% 23% 43% 24%
Customer Service when buying
11% 25% 33% 22% 9%
Customer Support after purchase
25% 25% 15% 15% 20%
Value for the money 15% 15% 15% 25% 30%
Delivery 24% 5% 25% 16% 30%
Ease of set up 4% 5% 11% 50% 30%
Design 3%
17% 30% 35% 15%
Portability 1% 5% 15% 39% 40%
3) Please rate the importance of the following attributes when buying iPad2. Importance of
Attribute
Not at all
Important
1
2
3
4
Very Important
5
Quality 4% 8% 15% 33% 40%
Customer Service when buying
1% 6% 23% 40% 30%
Customer Support after purchase
20% 25% 25% 20% 10%
Value for the money 5% 8% 15% 55% 17%
Delivery 16% 5% 44% 35% 0%
Ease of set up 11% 4% 33% 35% 17%
Design 2% 5% 7% 35% 51%
Portability 4% 8% 16% 22% 50%
4) Do you have any comments and suggestions regarding your iPad2?

©TNS 2012
Benchmark Study
Stakeholder Management
50
iPad2
Percentage(%) Very Dis-
satisfied
1
2
3
4
Very Satisfied
5
Overall Satisfaction
5% 10% 10% 35% 40%
Percentage(%) Very Dis-
satisfied
1
2
3
4
Very Satisfied
5
Overall Satisfaction
10 % 25% 15% 20% 30%
Blackberry Playbook
Dell Streak 7
Percentage(%) Very Dis-
satisfied
1
2
3
4
Very Satisfied
5
Overall Satisfaction
30 % 25% 20% 15% 10%

©TNS 2012
Group Exercise – IPad2
Stakeholder Management
51
How is the IPad2 doing?
Strengths?
Weaknesses?
Recommendations?
©TNS 2012
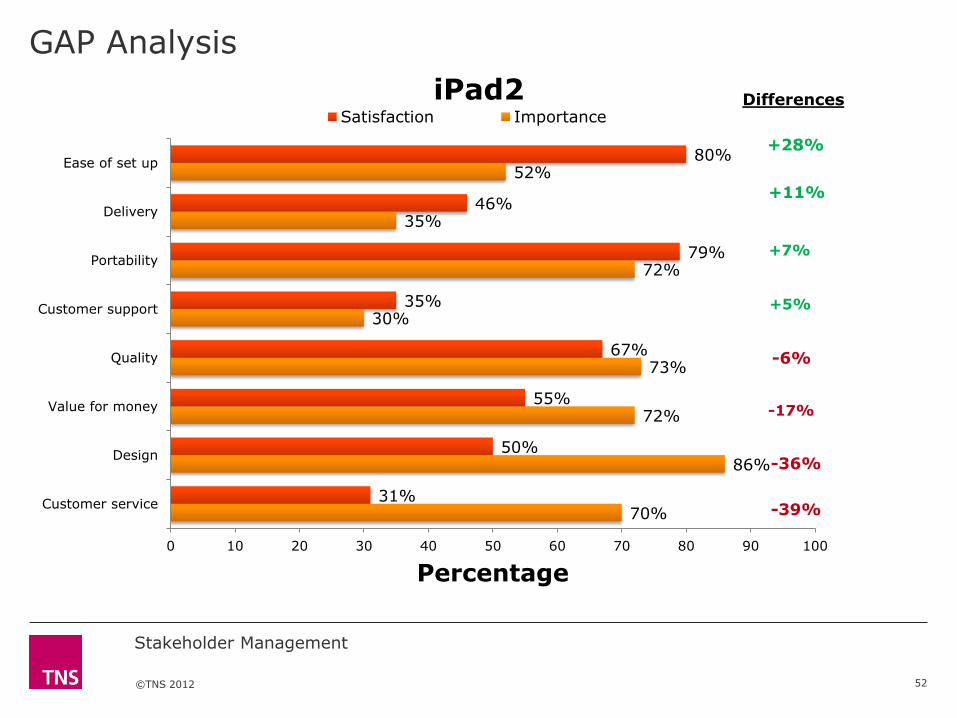
70%
86%
72%
73%
30%
72%
35%
52%
31%
50%
55%
67%
35%
79%
46%
80%
0 10 20 30 40 50 60 70 80 90 100
Customer service
Design
Value for money
Quality
Customer support
Portability
Delivery
Ease of set up
Percentage
iPad2 Satisfaction Importance
+28%
+11%
+7%
+5%
-6%
-17%
-36%
-39%
Differences
GAP Analysis
Stakeholder Management
52

©TNS 2012
Quadrant Analysis
Stakeholder Management
53
Customer service
Design
Value for money
Quality
Customer support
Portability
Delivery
Ease of set up
20
30
40
50
60
70
80
90
100
20 30 40 50 60 70 80 90 100
% I
mp
ort
an
t o
r V
ery
Im
po
rtan
t
% Satisfied or Very Satisfied
Quadrant Analysis for iPad2

©TNS 2012
Regression-Top 4 attributes leading to overall satisfaction
Stakeholder Management
54
Overall Satisfaction
b=45% Quality(67%)
b=30% Customer Service (31%)
b=15% Ease of Set Up (80%)
b=10% Value for
Money(55%)
b = Beta score
©TNS 2012
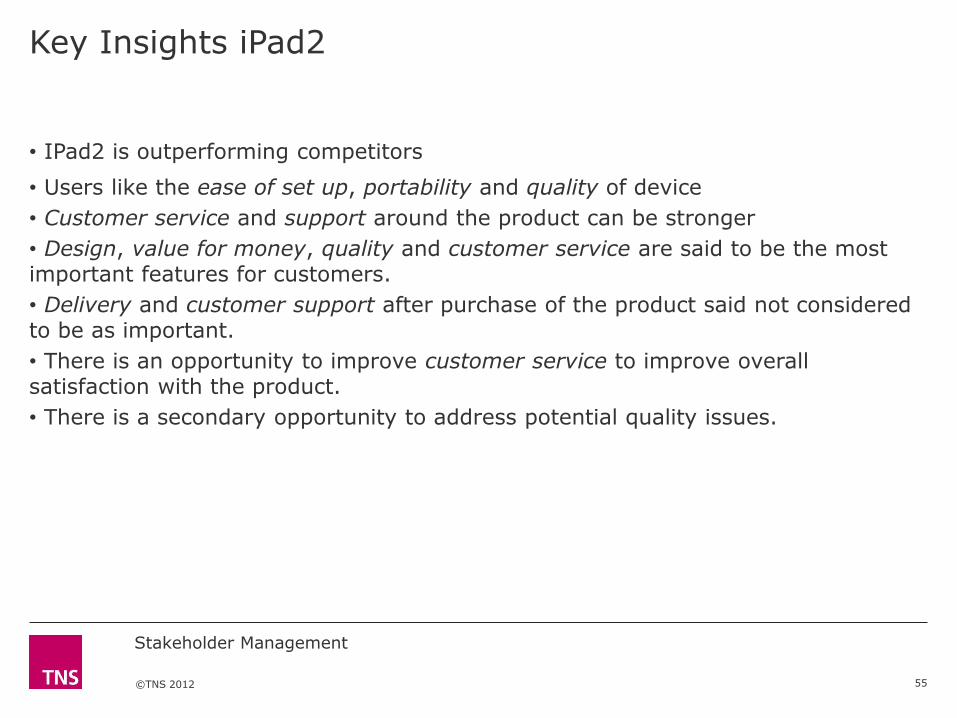
Key Insights iPad2
• IPad2 is outperforming competitors
• Users like the ease of set up, portability and quality of device
• Customer service and support around the product can be stronger
• Design, value for money, quality and customer service are said to be the most important features for customers.
• Delivery and customer support after purchase of the product said not considered to be as important.
• There is an opportunity to improve customer service to improve overall satisfaction with the product.
• There is a secondary opportunity to address potential quality issues.
Stakeholder Management
55


