65
Customer satisfaction with energy supplier complaints handling 2018 Research Report Prepared for Ofgem June 2018
Customer satisfaction with energy supplier complaints handling 2018
Research Report
Prepared for Ofgem
June 2018
Customer satisfaction with energy supplier complaints handling 2018
1 © Quadrangle 2018
Contents
1 Executive summary .................................................................................................... 2
2 Introduction ................................................................................................................. 9
3 Complainant profiles ................................................................................................ 12
4 Satisfaction with complaints handling ................................................................... 19
5 The complaint journey .............................................................................................. 22
6 Impact of complaint handling .................................................................................. 50
7 Key drivers of satisfaction/dissatisfaction with complaints handling ................ 53
8 Conclusions and recommendations ....................................................................... 61

Customer satisfaction with energy supplier complaints handling 2018
© Quadrangle 2018 2
1 Executive summary
1.1 Context and approach
Research background
Ofgem is the independent gas and electricity markets regulator for Great Britain. Its principle
objective is to protect the interests of existing and future electricity and gas customers. In
2008, Ofgem set the Complaints Handling Standards1 (CHS) for all suppliers providing
energy to domestic (private households) and/or micro-business customers (defined as a
business with up to 9 employees with a turnover no greater than £2 million annually2). The
CHS are a set of regulations that suppliers must follow when responding to and dealing with
customer complaints; a complaint is defined as any expression of dissatisfaction with the
service received.
Ofgem has carried out research since the CHS were introduced to assess how well
suppliers have been meeting the standards. Research in 2016 found that satisfaction with
the way complaints had been handled had decreased and Ofgem asked suppliers to review
their processes and improve their services to generate positive change for complainants.
This research was commissioned to monitor any changes in complainants’ experiences.
Research aims and approach
The primary aim of this research is to measure domestic and micro-business complainants’
satisfaction with the way their complaints had been handled by their supplier. This includes
establishing the extent to which satisfaction levels have changed since 2016, identifying the
key drivers of satisfaction and dissatisfaction, and identifying evidence of good practice and
areas in need of improvement.
The research was carried out in February through to April 2018, with 3,080 domestic and
703 micro-business complainants who had lodged complaints with their supplier in late
20173. Interviews were carried out using a structured questionnaire, conducted by telephone
and lasted on average 18-21 minutes. Data were weighted to reflect the share of complaints
in the market. It is important to stress that research findings reflect the complainants’
experience of the complaints handling process.
Who are the complainants
Research participants were complainants of the following:
▪ The six largest domestic and micro-business suppliers: British Gas, SSE, EDF, E.ON,
ScottishPower and npower; and
1 https://www.ofgem.gov.uk/sites/default/files/docs/2008/07/complaint-handling-standards-decision-july-2008.pdf 2 Ofgem defines a non-domestic customer as a micro business if they meet one of the following criteria: 1) they
employ fewer than 10 employees and have an annual turnover or balance sheet no greater than €2 million, or 2) use no more than100,000 kWh of electricity per year or no more than 293,000 kWh of gas per year. For the purposes of this research, energy usage was not factored into the definition. 3 Note on Domestic complainants: Complainants to OVO raised complaints between 25 January and 2 March 2018
rather than in late 2017. Full details are available in the Technical Report.
Customer satisfaction with energy supplier complaints handling 2018
© Quadrangle 2018 3
▪ The largest of the medium-sized suppliers: First Utility, Utility Warehouse, OVO, Utilita
and Co-op Energy (domestic complainants only), as well as Opus (micro-business
complainants only).
The most common cause for complaint among both domestic and micro-business
complainants was billing, and the vast majority of complaints were made by telephone. Just
over half of all complainants stated that their complaint was resolved at the time of interview
(min. of 8 weeks after the complaint had been raised).
1.2 Key research findings
Overall levels of satisfaction and dissatisfaction
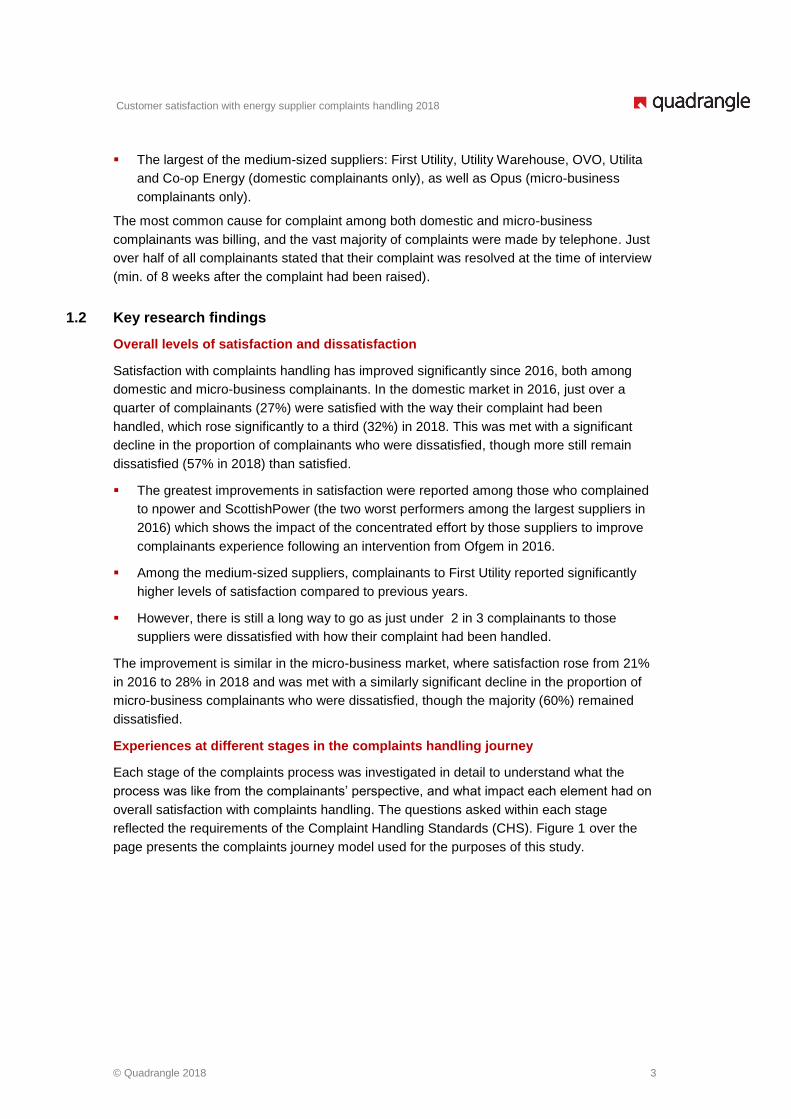
Satisfaction with complaints handling has improved significantly since 2016, both among
domestic and micro-business complainants. In the domestic market in 2016, just over a
quarter of complainants (27%) were satisfied with the way their complaint had been
handled, which rose significantly to a third (32%) in 2018. This was met with a significant
decline in the proportion of complainants who were dissatisfied, though more still remain
dissatisfied (57% in 2018) than satisfied.
▪ The greatest improvements in satisfaction were reported among those who complained
to npower and ScottishPower (the two worst performers among the largest suppliers in
2016) which shows the impact of the concentrated effort by those suppliers to improve
complainants experience following an intervention from Ofgem in 2016.
▪ Among the medium-sized suppliers, complainants to First Utility reported significantly
higher levels of satisfaction compared to previous years.
▪ However, there is still a long way to go as just under 2 in 3 complainants to those
suppliers were dissatisfied with how their complaint had been handled.
The improvement is similar in the micro-business market, where satisfaction rose from 21%
in 2016 to 28% in 2018 and was met with a similarly significant decline in the proportion of
micro-business complainants who were dissatisfied, though the majority (60%) remained
dissatisfied.
Experiences at different stages in the complaints handling journey
Each stage of the complaints process was investigated in detail to understand what the
process was like from the complainants’ perspective, and what impact each element had on
overall satisfaction with complaints handling. The questions asked within each stage
reflected the requirements of the Complaint Handling Standards (CHS). Figure 1 over the
page presents the complaints journey model used for the purposes of this study.
Customer satisfaction with energy supplier complaints handling 2018
© Quadrangle 2018 4
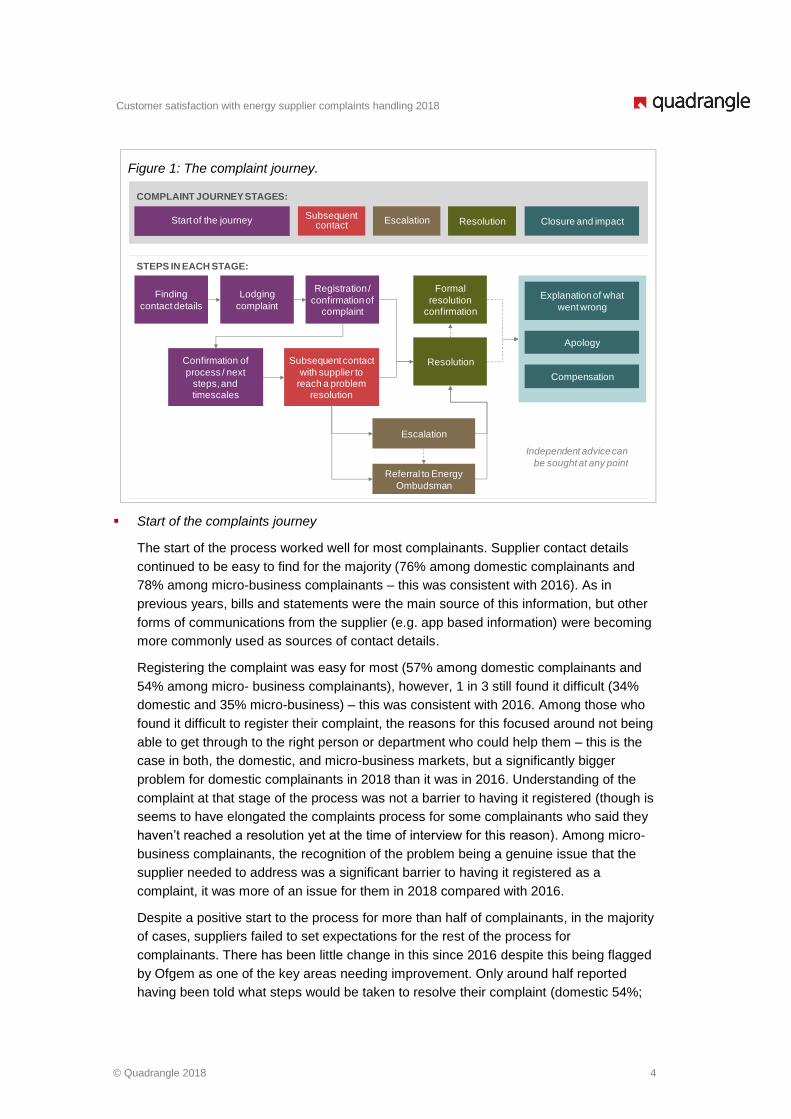
Figure 1: The complaint journey.
▪ Start of the complaints journey
The start of the process worked well for most complainants. Supplier contact details
continued to be easy to find for the majority (76% among domestic complainants and
78% among micro-business complainants – this was consistent with 2016). As in
previous years, bills and statements were the main source of this information, but other
forms of communications from the supplier (e.g. app based information) were becoming
more commonly used as sources of contact details.
Registering the complaint was easy for most (57% among domestic complainants and
54% among micro- business complainants), however, 1 in 3 still found it difficult (34%
domestic and 35% micro-business) – this was consistent with 2016. Among those who
found it difficult to register their complaint, the reasons for this focused around not being
able to get through to the right person or department who could help them – this is the
case in both, the domestic, and micro-business markets, but a significantly bigger
problem for domestic complainants in 2018 than it was in 2016. Understanding of the
complaint at that stage of the process was not a barrier to having it registered (though is
seems to have elongated the complaints process for some complainants who said they
haven’t reached a resolution yet at the time of interview for this reason). Among micro-
business complainants, the recognition of the problem being a genuine issue that the
supplier needed to address was a significant barrier to having it registered as a
complaint, it was more of an issue for them in 2018 compared with 2016.
Despite a positive start to the process for more than half of complainants, in the majority
of cases, suppliers failed to set expectations for the rest of the process for
complainants. There has been little change in this since 2016 despite this being flagged
by Ofgem as one of the key areas needing improvement. Only around half reported
having been told what steps would be taken to resolve their complaint (domestic 54%;
Independent advice can
be sought at any point
Finding
contact details
Lodging
complaint
Registration /
confirmation of complaint
Subsequent contact
with supplier to reach a problem
resolution
Referral to Energy
Ombudsman
Confirmation of
process / next steps, and timescales
Escalation
Formal
resolution confirmation
Resolution
Explanation of what
went wrong
Apology
Compensation
Start of the journeySubsequent
contactEscalation Resolution Closure and impact
COMPLAINT JOURNEY STAGES:
STEPS IN EACH STAGE:
Customer satisfaction with energy supplier complaints handling 2018
© Quadrangle 2018 5
micro-business 51%), and fewer, around a third, said they have been given a resolution
date (domestic 33%; micro-business 31%). absence of this information leaves
complainants to set their own expectation for what the process will look like and how
long it will take, which doesn’t always match the reality, and can lead to significant
disappointment among complainants when those expectations aren’t met.
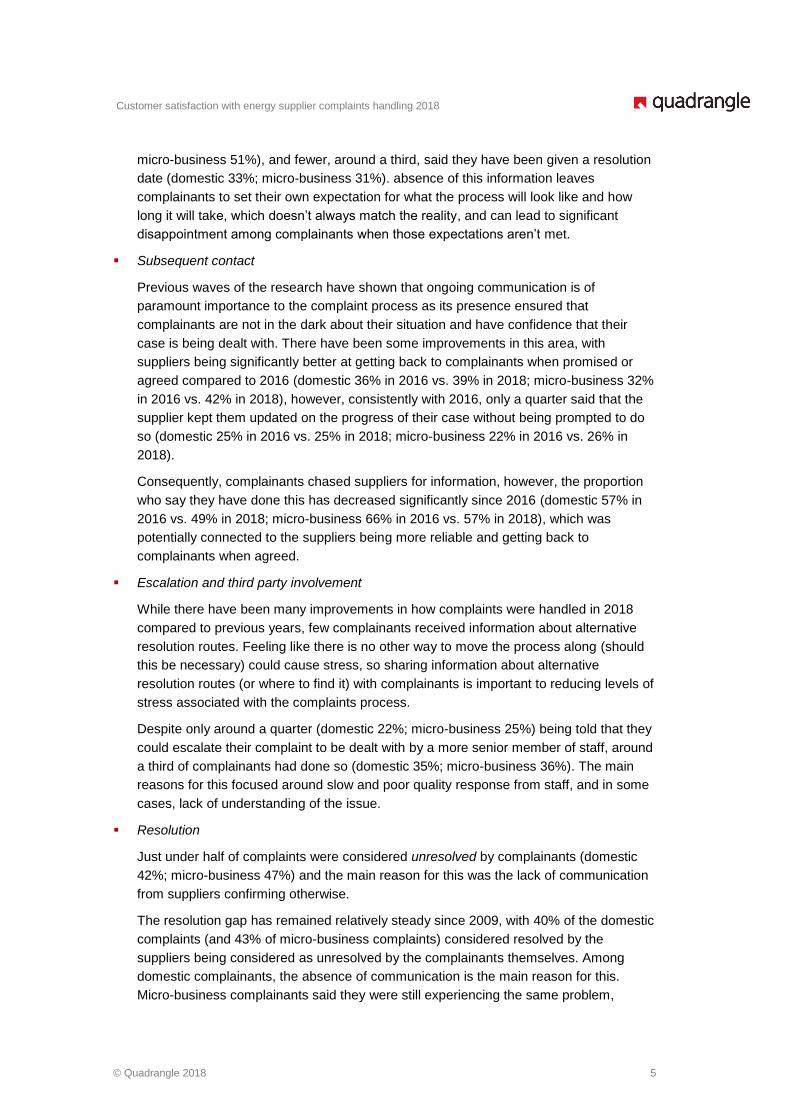
▪ Subsequent contact
Previous waves of the research have shown that ongoing communication is of
paramount importance to the complaint process as its presence ensured that
complainants are not in the dark about their situation and have confidence that their
case is being dealt with. There have been some improvements in this area, with
suppliers being significantly better at getting back to complainants when promised or
agreed compared to 2016 (domestic 36% in 2016 vs. 39% in 2018; micro-business 32%
in 2016 vs. 42% in 2018), however, consistently with 2016, only a quarter said that the
supplier kept them updated on the progress of their case without being prompted to do
so (domestic 25% in 2016 vs. 25% in 2018; micro-business 22% in 2016 vs. 26% in
2018).
Consequently, complainants chased suppliers for information, however, the proportion
who say they have done this has decreased significantly since 2016 (domestic 57% in
2016 vs. 49% in 2018; micro-business 66% in 2016 vs. 57% in 2018), which was
potentially connected to the suppliers being more reliable and getting back to
complainants when agreed.
▪ Escalation and third party involvement
While there have been many improvements in how complaints were handled in 2018
compared to previous years, few complainants received information about alternative
resolution routes. Feeling like there is no other way to move the process along (should
this be necessary) could cause stress, so sharing information about alternative
resolution routes (or where to find it) with complainants is important to reducing levels of
stress associated with the complaints process.
Despite only around a quarter (domestic 22%; micro-business 25%) being told that they
could escalate their complaint to be dealt with by a more senior member of staff, around
a third of complainants had done so (domestic 35%; micro-business 36%). The main
reasons for this focused around slow and poor quality response from staff, and in some
cases, lack of understanding of the issue.
▪ Resolution
Just under half of complaints were considered unresolved by complainants (domestic
42%; micro-business 47%) and the main reason for this was the lack of communication
from suppliers confirming otherwise.
The resolution gap has remained relatively steady since 2009, with 40% of the domestic
complaints (and 43% of micro-business complaints) considered resolved by the
suppliers being considered as unresolved by the complainants themselves. Among
domestic complainants, the absence of communication is the main reason for this.
Micro-business complainants said they were still experiencing the same problem,

Customer satisfaction with energy supplier complaints handling 2018
© Quadrangle 2018 6
meaning that from their perspective, the issue hadn’t been fully addressed and dealt
with despite the supplier marking their case as resolved on their system.
▪ Closure and impact of the complaints process
Just over half of complainants said their complaints had been resolved (domestic 58%;
micro-business 53%) and reported resolution times have shortened compared to 2016.
However, fewer than 1 in 5 complainants (domestic 18%; micro-business 16%) reported
receiving resolutions timings at the start of the process which matched how long the
complaints ultimately took to resolve.
Expectations of what complainants would receive were largely met, with most
complainants with resolved cases saying they received at least a rectification of the
problem. However, fewer (around 1 in 3) received an explanation of the problem, which
was something most expected to receive. In fact, those who received an explanation of
the problem were more satisfied with the entire process than those who hadn’t received
it (consistently with drivers analysis which shows that not receiving an explanation
drives satisfaction with the process down), thus becoming an important step for the
suppliers to fulfil to ensure the complainants expectations and needs are met.
Experiences of vulnerable complainants (domestic market only)
Vulnerable complainants’ experience was comparable to that of other complainants,
however, they were significantly more satisfied with how their complaint had been handled
compared to the domestic market average (36% vs. 32% average). They were also
significantly less likely to be dissatisfied with their experience than the market average (52%
vs. 57% average). Nevertheless, it is important to point out that similarly to the market
average, vulnerable complainants were more likely to be dissatisfied than satisfied with how
their complaint had been handled.
Consistently with the market, they found the contact details to raise their complaint easily in
most cases (though they were more likely to use bills and account statements as the source
of that information than the rest of the market), and most found their complaint easy to
register with their supplier. Similarly to the other complainants, their expectations weren’t
correctly set at the start of the process, with around half being told what steps would be
taken to resolve their complaint (51%) and around a third (30%) being given a resolution
date.
Ongoing communication, and being kept updated on the progress of their case, are in need
of significant improvement, consistently with the market average. However, marginally fewer
vulnerable complainants compared to the market average (32% vs. 35% average) escalated
their complaint to a more senior member of staff. Reasons for escalation mirrored the
market average (taking too long, poor quality response).
The proportions of vulnerable complainants who report their complaint as resolved and
unresolved was consistent with the market average. Among those with unresolved cases,
lack of communication from suppliers to say otherwise was the main reason why (with 53%
of vulnerable complainants with unresolved cases having said this, vs. 45% average). For
those who said their complaint has been resolved, fewer than 1 in 5 reported having
received accurate resolution timescales, consistently with the market average.
Customer satisfaction with energy supplier complaints handling 2018
© Quadrangle 2018 7
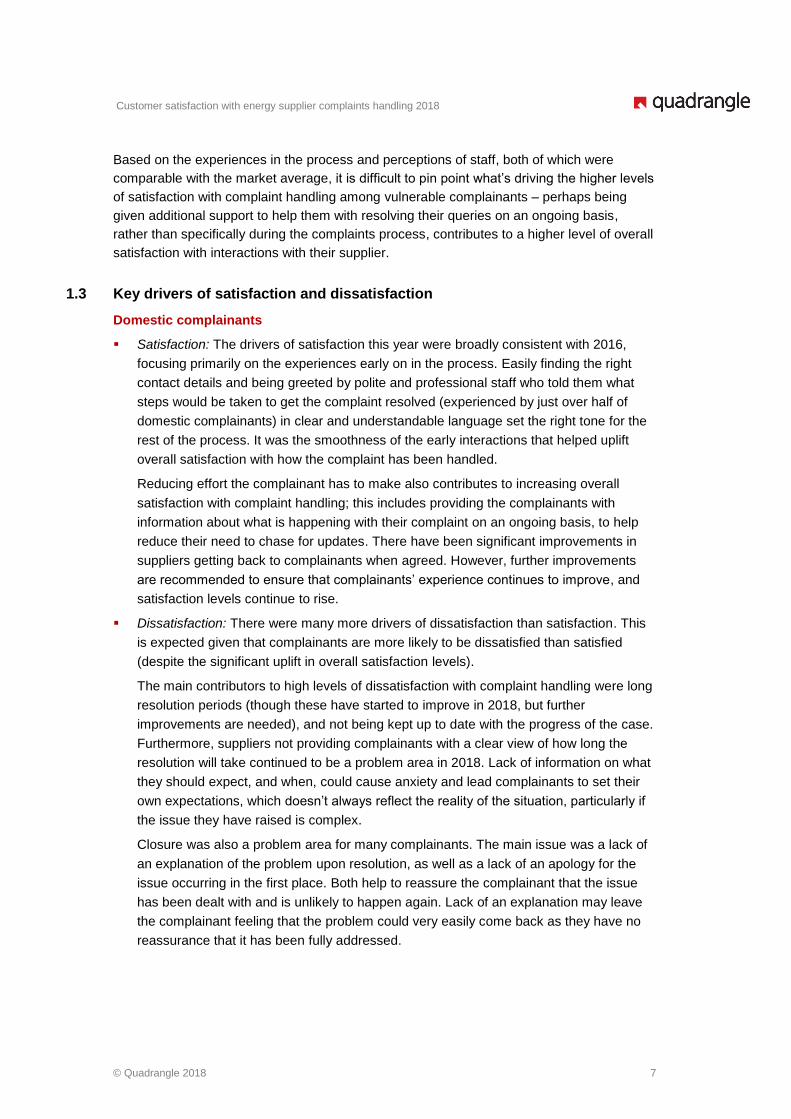
Based on the experiences in the process and perceptions of staff, both of which were
comparable with the market average, it is difficult to pin point what’s driving the higher levels
of satisfaction with complaint handling among vulnerable complainants – perhaps being
given additional support to help them with resolving their queries on an ongoing basis,
rather than specifically during the complaints process, contributes to a higher level of overall
satisfaction with interactions with their supplier.
1.3 Key drivers of satisfaction and dissatisfaction
Domestic complainants
▪ Satisfaction: The drivers of satisfaction this year were broadly consistent with 2016,
focusing primarily on the experiences early on in the process. Easily finding the right
contact details and being greeted by polite and professional staff who told them what
steps would be taken to get the complaint resolved (experienced by just over half of
domestic complainants) in clear and understandable language set the right tone for the
rest of the process. It was the smoothness of the early interactions that helped uplift
overall satisfaction with how the complaint has been handled.
Reducing effort the complainant has to make also contributes to increasing overall
satisfaction with complaint handling; this includes providing the complainants with
information about what is happening with their complaint on an ongoing basis, to help
reduce their need to chase for updates. There have been significant improvements in
suppliers getting back to complainants when agreed. However, further improvements
are recommended to ensure that complainants’ experience continues to improve, and
satisfaction levels continue to rise.
▪ Dissatisfaction: There were many more drivers of dissatisfaction than satisfaction. This
is expected given that complainants are more likely to be dissatisfied than satisfied
(despite the significant uplift in overall satisfaction levels).
The main contributors to high levels of dissatisfaction with complaint handling were long
resolution periods (though these have started to improve in 2018, but further
improvements are needed), and not being kept up to date with the progress of the case.
Furthermore, suppliers not providing complainants with a clear view of how long the
resolution will take continued to be a problem area in 2018. Lack of information on what
they should expect, and when, could cause anxiety and lead complainants to set their
own expectations, which doesn’t always reflect the reality of the situation, particularly if
the issue they have raised is complex.
Closure was also a problem area for many complainants. The main issue was a lack of
an explanation of the problem upon resolution, as well as a lack of an apology for the
issue occurring in the first place. Both help to reassure the complainant that the issue
has been dealt with and is unlikely to happen again. Lack of an explanation may leave
the complainant feeling that the problem could very easily come back as they have no
reassurance that it has been fully addressed.
Customer satisfaction with energy supplier complaints handling 2018
© Quadrangle 2018 8
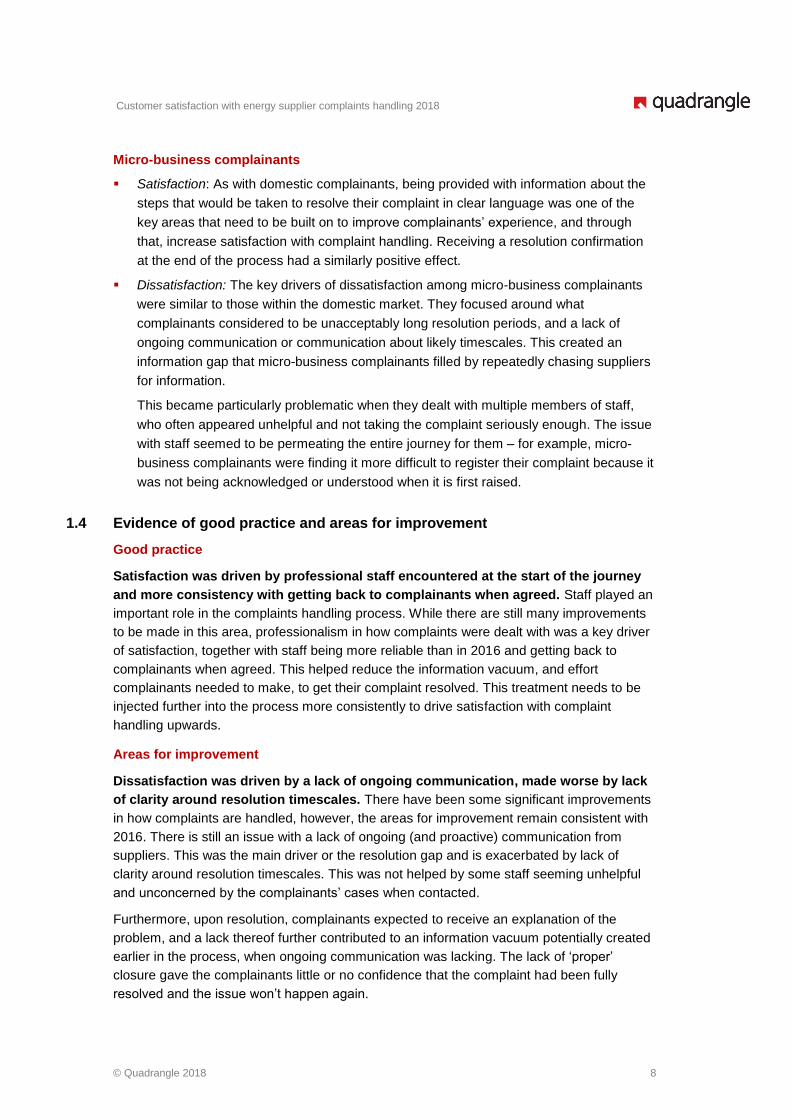
Micro-business complainants
▪ Satisfaction: As with domestic complainants, being provided with information about the
steps that would be taken to resolve their complaint in clear language was one of the
key areas that need to be built on to improve complainants’ experience, and through
that, increase satisfaction with complaint handling. Receiving a resolution confirmation
at the end of the process had a similarly positive effect.
▪ Dissatisfaction: The key drivers of dissatisfaction among micro-business complainants
were similar to those within the domestic market. They focused around what
complainants considered to be unacceptably long resolution periods, and a lack of
ongoing communication or communication about likely timescales. This created an
information gap that micro-business complainants filled by repeatedly chasing suppliers
for information.
This became particularly problematic when they dealt with multiple members of staff,
who often appeared unhelpful and not taking the complaint seriously enough. The issue
with staff seemed to be permeating the entire journey for them – for example, micro-
business complainants were finding it more difficult to register their complaint because it
was not being acknowledged or understood when it is first raised.
1.4 Evidence of good practice and areas for improvement
Good practice
Satisfaction was driven by professional staff encountered at the start of the journey
and more consistency with getting back to complainants when agreed. Staff played an
important role in the complaints handling process. While there are still many improvements
to be made in this area, professionalism in how complaints were dealt with was a key driver
of satisfaction, together with staff being more reliable than in 2016 and getting back to
complainants when agreed. This helped reduce the information vacuum, and effort
complainants needed to make, to get their complaint resolved. This treatment needs to be
injected further into the process more consistently to drive satisfaction with complaint
handling upwards.
Areas for improvement
Dissatisfaction was driven by a lack of ongoing communication, made worse by lack
of clarity around resolution timescales. There have been some significant improvements
in how complaints are handled, however, the areas for improvement remain consistent with
2016. There is still an issue with a lack of ongoing (and proactive) communication from
suppliers. This was the main driver or the resolution gap and is exacerbated by lack of
clarity around resolution timescales. This was not helped by some staff seeming unhelpful
and unconcerned by the complainants’ cases when contacted.
Furthermore, upon resolution, complainants expected to receive an explanation of the
problem, and a lack thereof further contributed to an information vacuum potentially created
earlier in the process, when ongoing communication was lacking. The lack of ‘proper’
closure gave the complainants little or no confidence that the complaint had been fully
resolved and the issue won’t happen again.
Customer satisfaction with energy supplier complaints handling 2018
© Quadrangle 2018 9
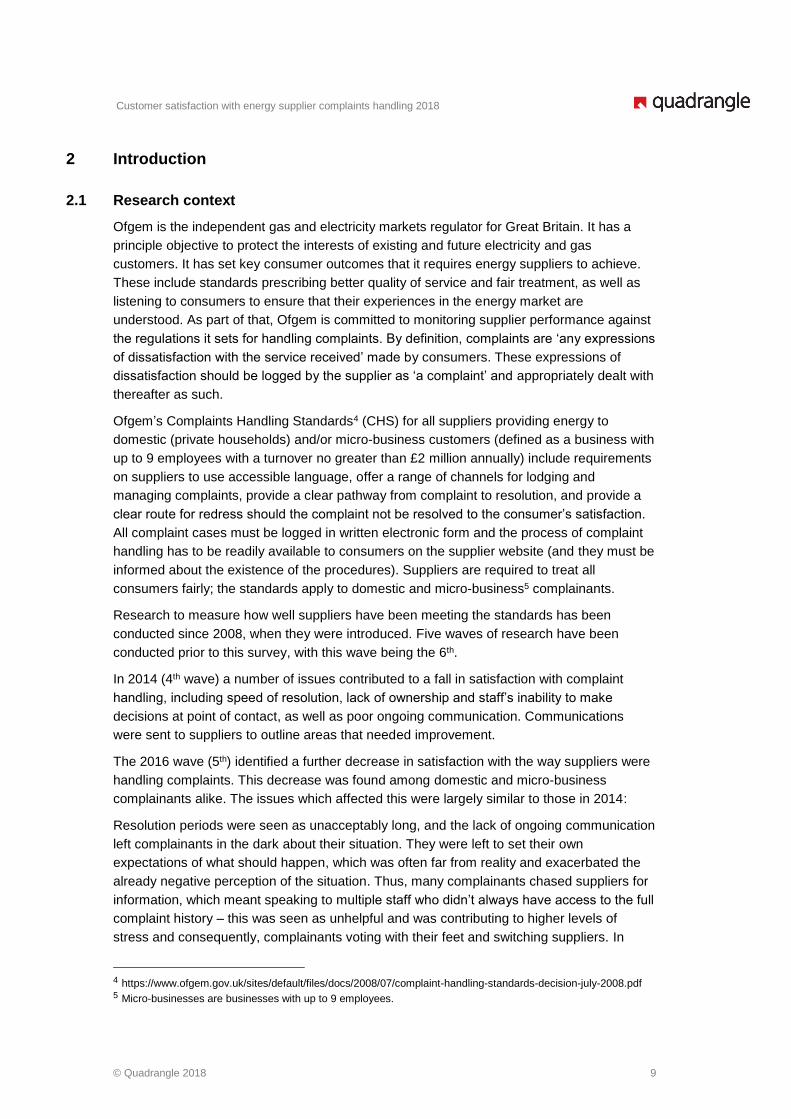
2 Introduction
2.1 Research context
Ofgem is the independent gas and electricity markets regulator for Great Britain. It has a
principle objective to protect the interests of existing and future electricity and gas
customers. It has set key consumer outcomes that it requires energy suppliers to achieve.
These include standards prescribing better quality of service and fair treatment, as well as
listening to consumers to ensure that their experiences in the energy market are
understood. As part of that, Ofgem is committed to monitoring supplier performance against
the regulations it sets for handling complaints. By definition, complaints are ‘any expressions
of dissatisfaction with the service received’ made by consumers. These expressions of
dissatisfaction should be logged by the supplier as ‘a complaint’ and appropriately dealt with
thereafter as such.
Ofgem’s Complaints Handling Standards4 (CHS) for all suppliers providing energy to
domestic (private households) and/or micro-business customers (defined as a business with
up to 9 employees with a turnover no greater than £2 million annually) include requirements
on suppliers to use accessible language, offer a range of channels for lodging and
managing complaints, provide a clear pathway from complaint to resolution, and provide a
clear route for redress should the complaint not be resolved to the consumer’s satisfaction.
All complaint cases must be logged in written electronic form and the process of complaint
handling has to be readily available to consumers on the supplier website (and they must be
informed about the existence of the procedures). Suppliers are required to treat all
consumers fairly; the standards apply to domestic and micro-business5 complainants.
Research to measure how well suppliers have been meeting the standards has been
conducted since 2008, when they were introduced. Five waves of research have been
conducted prior to this survey, with this wave being the 6th.
In 2014 (4th wave) a number of issues contributed to a fall in satisfaction with complaint
handling, including speed of resolution, lack of ownership and staff’s inability to make
decisions at point of contact, as well as poor ongoing communication. Communications
were sent to suppliers to outline areas that needed improvement.
The 2016 wave (5th) identified a further decrease in satisfaction with the way suppliers were
handling complaints. This decrease was found among domestic and micro-business
complainants alike. The issues which affected this were largely similar to those in 2014:
Resolution periods were seen as unacceptably long, and the lack of ongoing communication
left complainants in the dark about their situation. They were left to set their own
expectations of what should happen, which was often far from reality and exacerbated the
already negative perception of the situation. Thus, many complainants chased suppliers for
information, which meant speaking to multiple staff who didn’t always have access to the full
complaint history – this was seen as unhelpful and was contributing to higher levels of
stress and consequently, complainants voting with their feet and switching suppliers. In
4 https://www.ofgem.gov.uk/sites/default/files/docs/2008/07/complaint-handling-standards-decision-july-2008.pdf 5 Micro-businesses are businesses with up to 9 employees.
Customer satisfaction with energy supplier complaints handling 2018
© Quadrangle 2018 10
response, Ofgem took a number of direct and indirect actions against suppliers to help
improve the situation for complainants and issued further guidance to suppliers to
encourage them to more effectively address the areas in need of improvement.
This wave of research was commissioned to assess how well suppliers responded to the
call for improvements, and to monitor any changes in complainants’ experiences.
2.2 Research aims and objectives
The primary aim of this research was to measure domestic and micro-business
complainants’ satisfaction with the way their complaints have been handled by their
energy supplier. Specifically, the research set out to:
1. Gauge complainants’ satisfaction with suppliers’ complaints handling at market (and
supplier) level, and understand the key drivers of satisfaction and dissatisfaction;
2. Identify areas of good practice in the application of the Complaints Handling Standards;
3. Identify areas of weakness in suppliers’ complaints handling process, and determine
priority areas that require action; and
4. Assess the extent to which suppliers’ handling of complaints and complainants’
satisfaction with this has changed since 2016, revealing areas where improvements
have been made or areas where they have remained steady or declined.
2.3 Research methodology
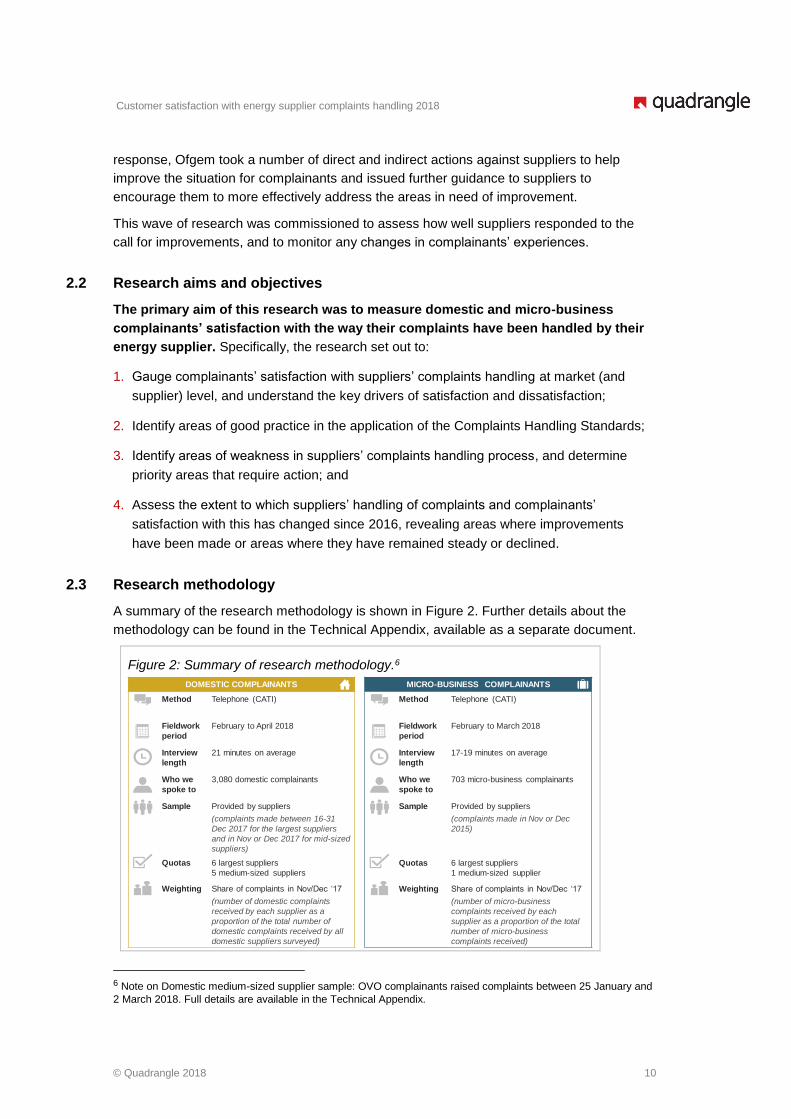
A summary of the research methodology is shown in Figure 2. Further details about the
methodology can be found in the Technical Appendix, available as a separate document.
Figure 2: Summary of research methodology.6
6 Note on Domestic medium-sized supplier sample: OVO complainants raised complaints between 25 January and
2 March 2018. Full details are available in the Technical Appendix.
MICRO-BUSINESS COMPLAINANTS
Method Telephone (CATI)
Fieldwork
period
February to March 2018
Interview
length
17-19 minutes on average
Who we
spoke to
703 micro-business complainants
Sample Provided by suppliers
(complaints made in Nov or Dec
2015)
Quotas 6 largest suppliers
1 medium-sized supplier
Weighting Share of complaints in Nov/Dec ‘17
(number of micro-business
complaints received by each
supplier as a proportion of the total
number of micro-business
complaints received)
DOMESTIC COMPLAINANTS
Method Telephone (CATI)
Fieldwork
period
February to April 2018
Interview
length
21 minutes on average
Who we
spoke to
3,080 domestic complainants
Sample Provided by suppliers
(complaints made between 16-31
Dec 2017 for the largest suppliers
and in Nov or Dec 2017 for mid-sized
suppliers)
Quotas 6 largest suppliers
5 medium-sized suppliers
Weighting Share of complaints in Nov/Dec ‘17
(number of domestic complaints
received by each supplier as a
proportion of the total number of
domestic complaints received by all
domestic suppliers surveyed)
Customer satisfaction with energy supplier complaints handling 2018
© Quadrangle 2018 11
2.4 Reporting conventions
When interpreting the data presented in this report, please note that:
• Results may not sum to 100% due to rounding and/or due to participants being able to
select more than one answer to a question.
• Data presented in this report is from a sample of complainants rather than the total
population. This means the results are subject to sampling error. Differences between
suppliers or other sub-groups, and between different waves of the research, are only
commented on if they are statistically significant at the 95 per cent confidence level.
This means there is no more than a 5 per cent chance that any reported differences are
not real but a consequence of chance/ sampling error.7
• Statistically significant differences are indicated on each figure with arrows, as
detailed below, and commented on where appropriate. Typically, the larger the base
size (the number of respondents answering the question), the more likely it is that any
differences observed are statistically significant. Results in each section of this report
are presented for the current wave of the survey in the first instance. Comparisons are
made with 2016 (and in some cases earlier years) to establish what has/ has not
changed over time.
• Results represent the experience from the complainants’ perspective; it is their
perception and recall of their experience that is reported.
7 Strictly speaking, calculations of statistical significance apply only to samples that have been selected using a
probability sampling design. However, in practice, it is reasonable to assume that these calculations provide a good indication of significant differences for quota sampling (as used for this research).
Significantly higher / lower
in 2018 vs. 2016
This indicates significant difference (at 95% level
of significance) between results reported in 2016 and 2018 (the most recent wave)

Customer satisfaction with energy supplier complaints handling 2018
© Quadrangle 2018 12
3 Complainant profiles
3.1 Demographic and firmographic profiles of complainants
The complainants are a representative sample of all consumers who had contacted their
supplier to ‘express dissatisfaction’ in late 2017.8 The profiles of the domestic and micro-
business complainants who participated in the survey are shown in Figures 3 and 4 below.
Figure 3: Domestic complainant profile.
Base: Domestic complainants (3,080).
Figure 4: Micro-business complainant profile (up to 9 employees).
Bases: Micro-business complainants (703).
8 To reiterate, complaints are ‘any expressions of dissatisfaction with the service received’ made by consumers
and for this research, the complaints were made between 16-31 December 2018 for the largest domestic suppliers and in November-December 2018 for all medium-sized suppliers (except for complainants to OVO who raised complaints between 25 January and 2 March 2018) and all micro-business suppliers.
No. of employees
35%16%
Sole Trader
1-4
5-9
Energy
management & procurement responsibility
Full
responsibility64%
Joint / some
responsibility27%
No responsibility 9%
6%
11%
52%
Refused /DK
Other
QuarterlyDD
On receiptof bill
Monthly DD
Gas 11%
Electricity 77%
Dual fuel 13%
Fuel type
Payment type
Sector
Annual turnover
10%
2%
7%
7%
8%
10%
11%
12%
14%
20%
Other
Public services& Government
Construction &Manufacturing
Not for profit
Farming
Leisure
Professional
Catering
Property
Retail
Role in the business
Owner / Partner / CEO 45%
Financial Director /
Director26%
Manager level employee 11%
Office manager 5%
Other employee 13%
(including garages)
28%
13%
34%
15%
11%
£0k-£25k
£25k-50k
£50k-250k
£250k-500k
£500k+
49%
19%
12%
3%
5%
3%
5%
9%
16%
59%
Refused /DK
Other
Paymentcard
QuarterlyDD
On receiptof bill
PPM
MonthlyDD
18-24 3%
25-34 12%
35-44 15%
45-54 18%
55-64 19%
65-74 19%
75+ 10%
Refused 3%
Gas 17%
Electricity 32%
Dual fuel 51%
Age
AB 21%
C1 24%
C2 15%
DE 28%
Refused 12%
SEG
Frequency of internet use
Ethnicity
White/White
British85%
Black/African/
Caribbean/ Black British
4%
Asian/Asian
British4%
Mixed 1%
Other 2%
Refused 4%
Fuel type
Payment type
Vulnerable groups
57% 21%5% 3% 11% 3%
Severaltimes a
day
Roughlyeveryday
At leastonce aweek
Once amonth or
less
Never Refused
Has a long term
disability25%
65 years old or older 28%
Has PPM or other
short-term or pre-payment scheme
19%
Socio-economic
group E20%
No access to internet 7%
English not spoken at
home4%
PSR * 30%
* The Priority Services Register
is available for consumers in
vulnerable situations. Being on
the register entitles consumers
to additional support services
such as quarterly meter reads,
accessible bills and priority in
case of a power cut
Customer satisfaction with energy supplier complaints handling 2018
© Quadrangle 2018 13
3.1.1 Complainants in vulnerable situations
Ofgem’s responsibility to protect the interests of energy consumers includes those who are
in vulnerable circumstances (this relates to domestic consumers only). Vulnerable
circumstances arise when a consumer’s personal circumstances and characteristics,
combined with aspects of the market, create situations where they are either:
▪ Significantly less able, than a typical consumer, to protect or represent their interests in
the energy market, and/ or
▪ Significantly more likely, than a typical consumer, to suffer detriment or that detriment is
likely to be more substantial.
More specifically, this would apply to some consumers of pensionable age, those who have
a disability, are chronically ill, have a mental health condition which impacts their ability to
e.g. understand their bill, if they live in rural areas, are on low incomes or in any other
vulnerable situation which means that they need additional support (on an ongoing basis or
for a limited time). Vulnerability can be transient as personal circumstances change.
Furthermore, a vulnerable consumer is not vulnerable because of who they are, but
because of the circumstances they are in, which is what may prevent them from being able
to fully protect or represent their interests in the energy market.9
Energy suppliers have the responsibility to ‘seek to identify’ each domestic customer in a
vulnerable situation, to be able to address their needs appropriately.10 This means
identifying where individual circumstances create barriers to accessing services in the
energy market and having a strategy to help consumers overcome those barriers.
Vulnerable customers are often included in the Priority Services Register (PSR) – it is a free
service provided by suppliers and network operators to customers in need. If eligible, and
the customer agrees to be registered, a customer will qualify for supplementary services
such as suppliers providing support to help the customer identify someone acting on behalf
of their supplier, e.g. a password or showing an agreed identification card if visiting the
customer’s home, among a number of other services.11 This level of support is particularly
important in relation to raising a complaint, which can have a financial and/ or emotional
impact on the complainants.
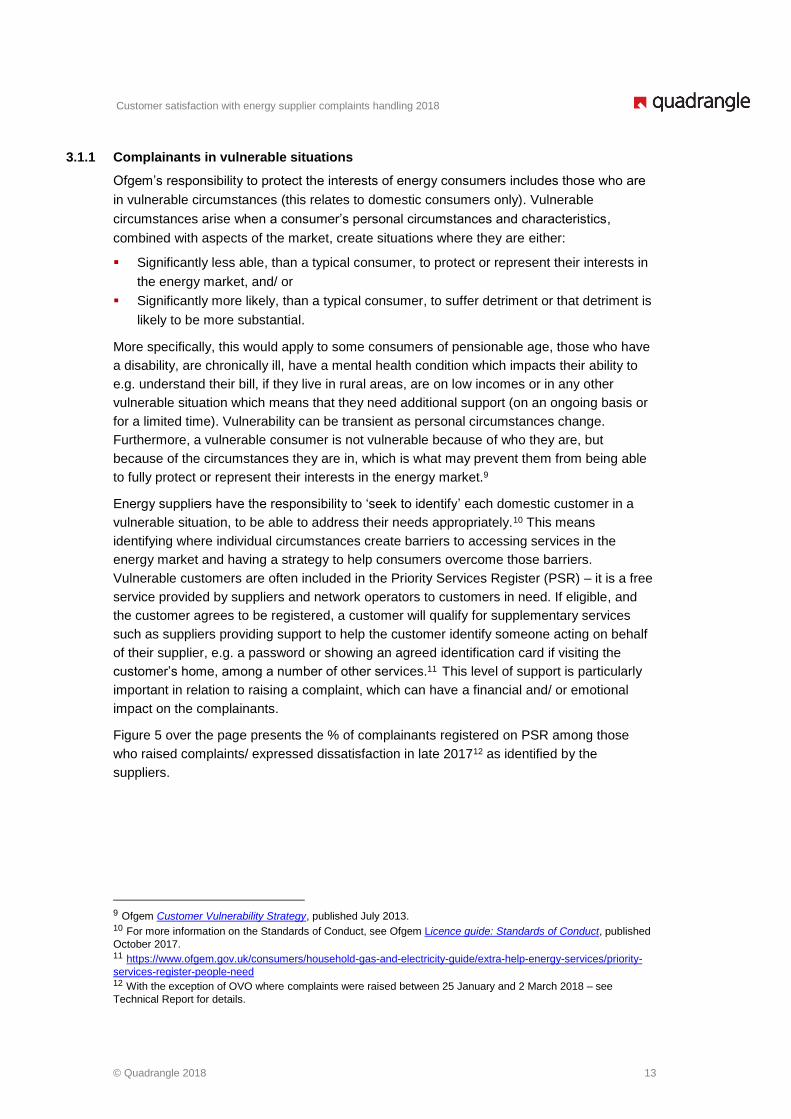
Figure 5 over the page presents the % of complainants registered on PSR among those
who raised complaints/ expressed dissatisfaction in late 201712 as identified by the
suppliers.
9 Ofgem Customer Vulnerability Strategy, published July 2013. 10 For more information on the Standards of Conduct, see Ofgem Licence guide: Standards of Conduct, published
October 2017. 11 https://www.ofgem.gov.uk/consumers/household-gas-and-electricity-guide/extra-help-energy-services/priority-
services-register-people-need 12 With the exception of OVO where complaints were raised between 25 January and 2 March 2018 – see
Technical Report for details.
Customer satisfaction with energy supplier complaints handling 2018
© Quadrangle 2018 14
Figure 5: Vulnerable (PSR) complainants by supplier – complaints made in late 201713 to
domestic suppliers only.
Data provided by suppliers in response to Ofgem RFI on complaints made in late 2017.
Base: Domestic complainants (All: 3,080; Largest: 2,077, Medium: 1,003; BG: 334; SSE: 356; EDF: 325 E.ON: 421; ScottishPower: 356; npower: 285; Utilita: 245; Co-op: 142; OVO: 106; Utility Warehouse:130; First Utility: 380).
In the 2018 wave of the research, suppliers were asked to provide this information to help
assess whether PSR complainants are receiving an adequate level of service. This
information was not available in 2016, thus direct comparison is not possible. Therefore,
throughout this report, the experience of complainants registered on the PSR is evaluated in
relation to the 2018 market average. They are referred to as vulnerable complainants
throughout the report.
3.2 Profile of domestic and micro-business complaints
Participants were complainants to the six largest suppliers (domestic and micro-
business) and six medium-sized suppliers (five domestic only; one micro-business
only).
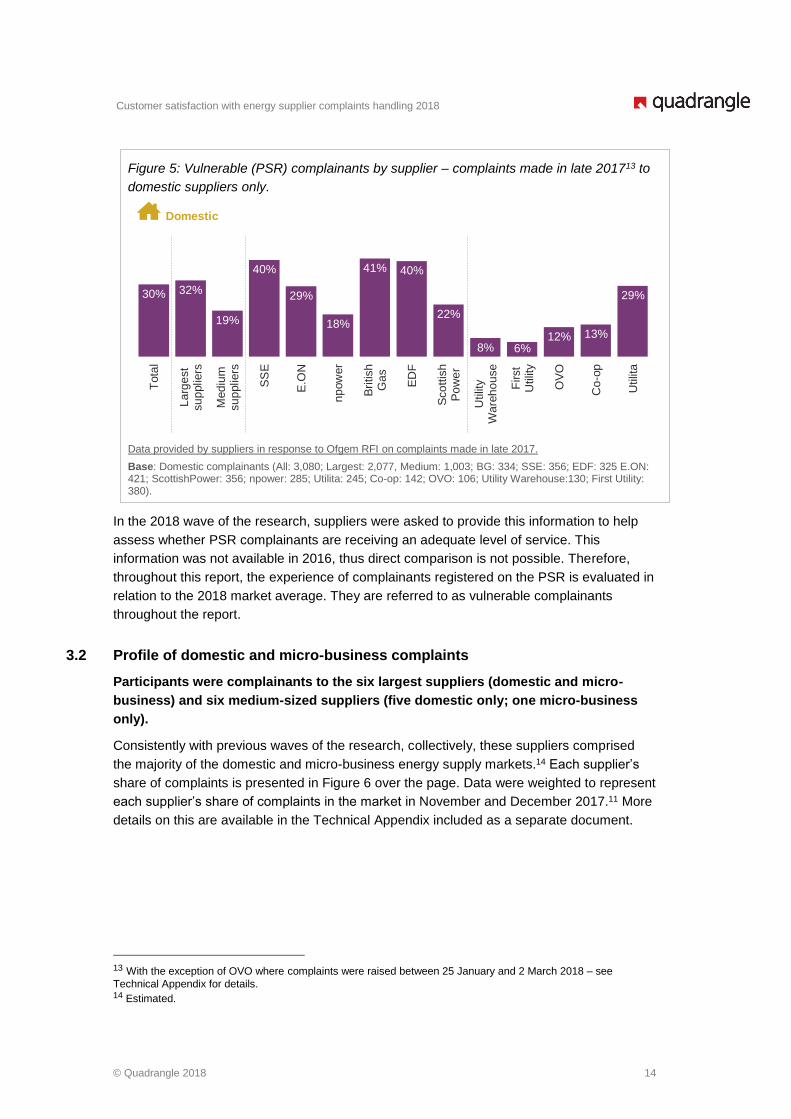
Consistently with previous waves of the research, collectively, these suppliers comprised
the majority of the domestic and micro-business energy supply markets.14 Each supplier’s
share of complaints is presented in Figure 6 over the page. Data were weighted to represent
each supplier’s share of complaints in the market in November and December 2017.11 More
details on this are available in the Technical Appendix included as a separate document.
13 With the exception of OVO where complaints were raised between 25 January and 2 March 2018 – see
Technical Appendix for details. 14 Estimated.
29%
13%12%6%8%
22%
40%41%
18%
29%
40%
19%
32%30%
Utilit
a
Co
-op
OV
O
First
Utilit
y
Utilit
yW
are
ho
use
Sco
ttis
hP
ow
er
ED
F
Bri
tish
Ga
s
np
ow
er
E.O
N
SS
E
Med
ium
su
pplie
rs
La
rge
st
su
pplie
rs
Tota
l
Domestic
Customer satisfaction with energy supplier complaints handling 2018
© Quadrangle 2018 15
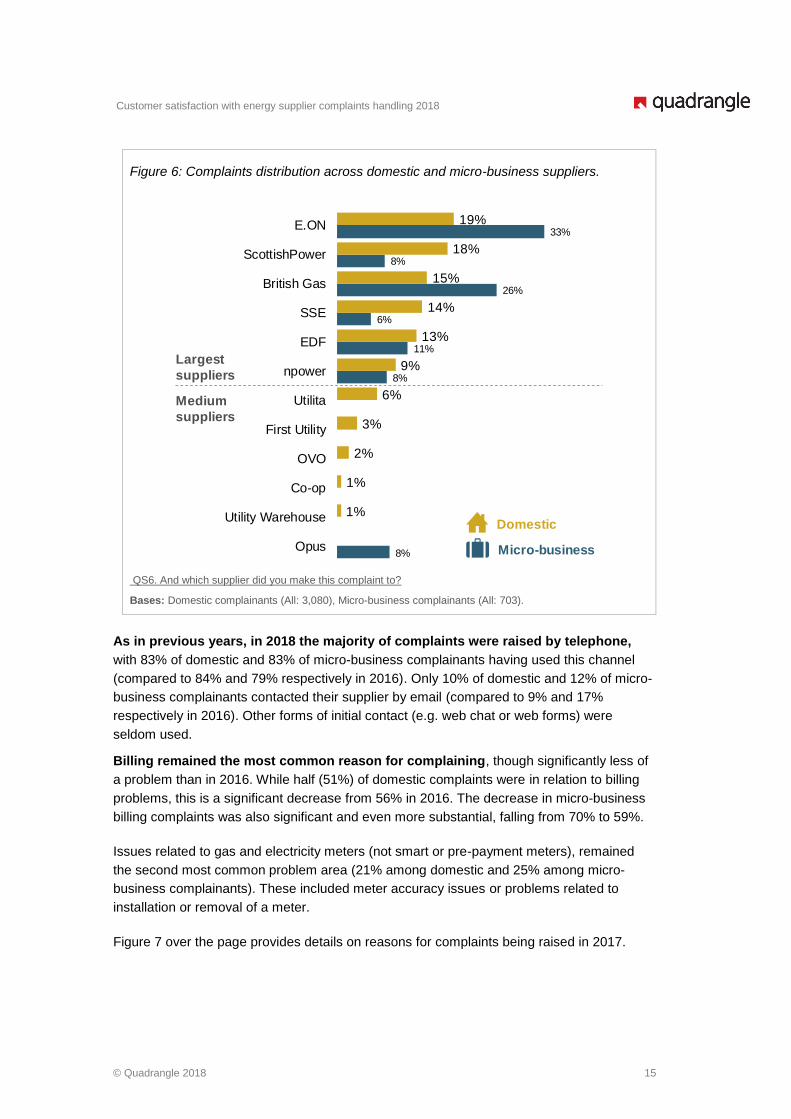
Figure 6: Complaints distribution across domestic and micro-business suppliers.
QS6. And which supplier did you make this complaint to?
Bases: Domestic complainants (All: 3,080), Micro-business complainants (All: 703).
As in previous years, in 2018 the majority of complaints were raised by telephone,
with 83% of domestic and 83% of micro-business complainants having used this channel
(compared to 84% and 79% respectively in 2016). Only 10% of domestic and 12% of micro-
business complainants contacted their supplier by email (compared to 9% and 17%
respectively in 2016). Other forms of initial contact (e.g. web chat or web forms) were
seldom used.
Billing remained the most common reason for complaining, though significantly less of
a problem than in 2016. While half (51%) of domestic complaints were in relation to billing
problems, this is a significant decrease from 56% in 2016. The decrease in micro-business
billing complaints was also significant and even more substantial, falling from 70% to 59%.
Issues related to gas and electricity meters (not smart or pre-payment meters), remained
the second most common problem area (21% among domestic and 25% among micro-
business complainants). These included meter accuracy issues or problems related to
installation or removal of a meter.
Figure 7 over the page provides details on reasons for complaints being raised in 2017.
Domestic
Micro-business8%
8%
11%
6%
26%
8%
33%
1%
1%
2%
3%
6%
9%
13%
14%
15%
18%
19%
Opus
Utility Warehouse
Co-op
OVO
First Utility
Utilita
npower
EDF
SSE
British Gas
ScottishPower
E.ON
Largest
suppliers
Medium
suppliers
Customer satisfaction with energy supplier complaints handling 2018
© Quadrangle 2018 16
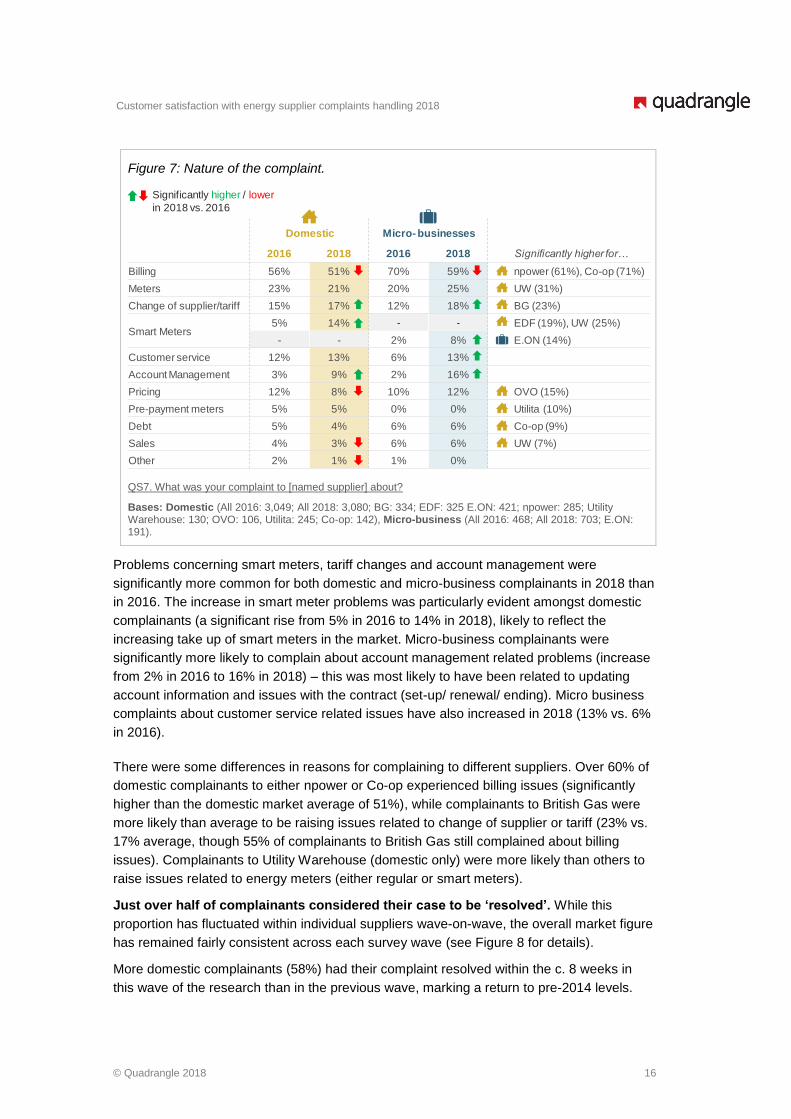
Figure 7: Nature of the complaint.
QS7. What was your complaint to [named supplier] about?
Bases: Domestic (All 2016: 3,049; All 2018: 3,080; BG: 334; EDF: 325 E.ON: 421; npower: 285; Utility Warehouse: 130; OVO: 106, Utilita: 245; Co-op: 142), Micro-business (All 2016: 468; All 2018: 703; E.ON: 191).
Problems concerning smart meters, tariff changes and account management were
significantly more common for both domestic and micro-business complainants in 2018 than
in 2016. The increase in smart meter problems was particularly evident amongst domestic
complainants (a significant rise from 5% in 2016 to 14% in 2018), likely to reflect the
increasing take up of smart meters in the market. Micro-business complainants were
significantly more likely to complain about account management related problems (increase
from 2% in 2016 to 16% in 2018) – this was most likely to have been related to updating
account information and issues with the contract (set-up/ renewal/ ending). Micro business
complaints about customer service related issues have also increased in 2018 (13% vs. 6%
in 2016).
There were some differences in reasons for complaining to different suppliers. Over 60% of
domestic complainants to either npower or Co-op experienced billing issues (significantly
higher than the domestic market average of 51%), while complainants to British Gas were
more likely than average to be raising issues related to change of supplier or tariff (23% vs.
17% average, though 55% of complainants to British Gas still complained about billing
issues). Complainants to Utility Warehouse (domestic only) were more likely than others to
raise issues related to energy meters (either regular or smart meters).
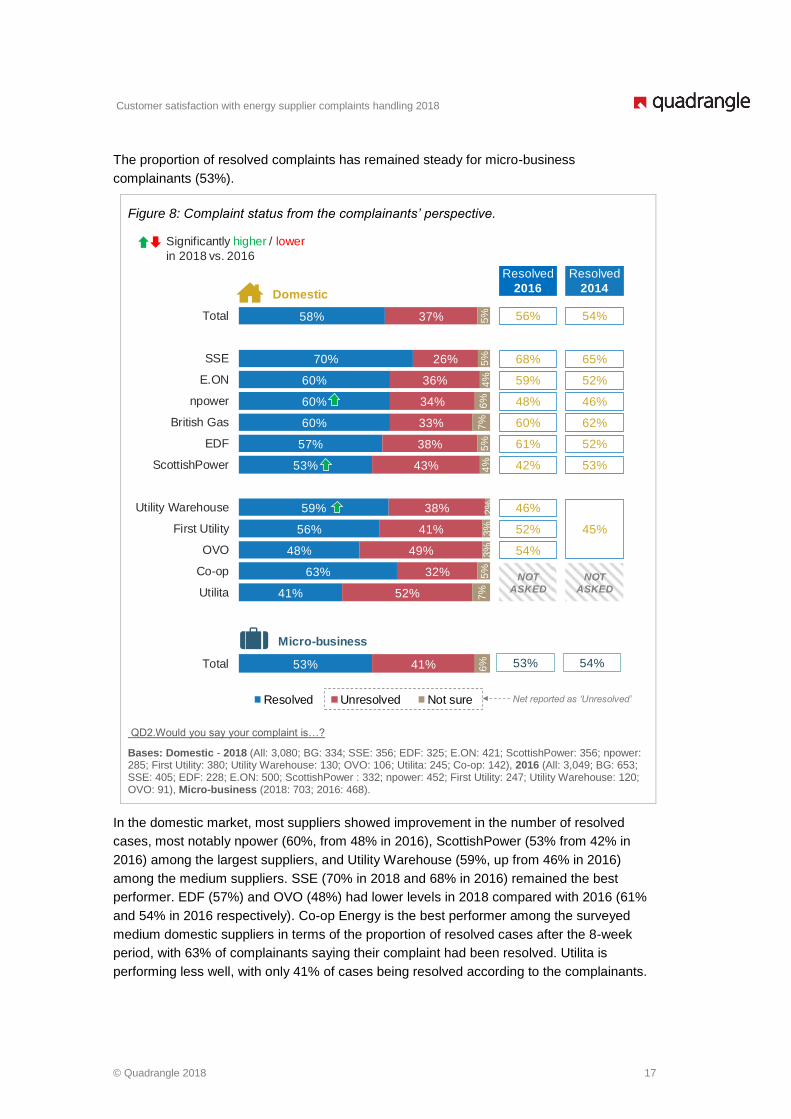
Just over half of complainants considered their case to be ‘resolved’. While this
proportion has fluctuated within individual suppliers wave-on-wave, the overall market figure
has remained fairly consistent across each survey wave (see Figure 8 for details).
More domestic complainants (58%) had their complaint resolved within the c. 8 weeks in
this wave of the research than in the previous wave, marking a return to pre-2014 levels.
2016 2018 2016 2018 Significantly higher for…
Billing 56% 51% 70% 59% npower (61%), Co-op (71%)
Meters 23% 21% 20% 25% UW (31%)
Change of supplier/tariff 15% 17% 12% 18% BG (23%)
Smart Meters5% 14% - - EDF (19%), UW (25%)
- - 2% 8% E.ON (14%)
Customer service 12% 13% 6% 13%
Account Management 3% 9% 2% 16%
Pricing 12% 8% 10% 12% OVO (15%)
Pre-payment meters 5% 5% 0% 0% Utilita (10%)
Debt 5% 4% 6% 6% Co-op (9%)
Sales 4% 3% 6% 6% UW (7%)
Other 2% 1% 1% 0%
Domestic Micro- businesses
Significantly higher / lower
in 2018 vs. 2016
Customer satisfaction with energy supplier complaints handling 2018
© Quadrangle 2018 17
The proportion of resolved complaints has remained steady for micro-business
complainants (53%).
Figure 8: Complaint status from the complainants’ perspective.
QD2.Would you say your complaint is…?
Bases: Domestic - 2018 (All: 3,080; BG: 334; SSE: 356; EDF: 325; E.ON: 421; ScottishPower: 356; npower: 285; First Utility: 380; Utility Warehouse: 130; OVO: 106; Utilita: 245; Co-op: 142), 2016 (All: 3,049; BG: 653; SSE: 405; EDF: 228; E.ON: 500; ScottishPower : 332; npower: 452; First Utility: 247; Utility Warehouse: 120; OVO: 91), Micro-business (2018: 703; 2016: 468).
In the domestic market, most suppliers showed improvement in the number of resolved
cases, most notably npower (60%, from 48% in 2016), ScottishPower (53% from 42% in
2016) among the largest suppliers, and Utility Warehouse (59%, up from 46% in 2016)
among the medium suppliers. SSE (70% in 2018 and 68% in 2016) remained the best
performer. EDF (57%) and OVO (48%) had lower levels in 2018 compared with 2016 (61%
and 54% in 2016 respectively). Co-op Energy is the best performer among the surveyed
medium domestic suppliers in terms of the proportion of resolved cases after the 8-week
period, with 63% of complainants saying their complaint had been resolved. Utilita is
performing less well, with only 41% of cases being resolved according to the complainants.
41%
63%
48%
56%
59%
53%
57%
60%
60%
60%
70%
58%
52%
32%
49%
41%
38%
43%
38%
33%
34%
36%
26%
37%
7%
5%
3%
3%
2%
4%
5%
7%
6%
4%
5%
5%
Utilita
Co-op
OVO
First Utility
Utility Warehouse
ScottishPower
EDF
British Gas
npower
E.ON
SSE
Total
53% 41% 6%Total
Resolved
2016Domestic
Micro-business
53%
Resolved Unresolved Not sure
54%
65%
52%
46%
62%
52%
53%
45%
Resolved
2014
54%
56%
68%
59%
48%
60%
61%
42%
46%
52%
54%
NOT
ASKED
NOT
ASKED
Significantly higher / lower
in 2018 vs. 2016
Net reported as ‘Unresolved’
Customer satisfaction with energy supplier complaints handling 2018
© Quadrangle 2018 18
In the micro-business market, Opus, the only medium supplier included in the research, had
the highest number of resolved cases at the time of interview (around two-thirds of
complaints had been resolved at the time of interview). Most of the other micro-business
suppliers had lower numbers of resolved cases than in 2016, with a minor improvement for
EDF.
Note on unresolved cases: within this report, any reference to ‘unresolved’ cases refer to the
net figure of cases identified by complainants as unresolved plus those who were not sure if
their case had been resolved or not. This was consistent with the 2016 wave of the
research. Thus 42% of cases in the domestic market, and 47% of cases in the micro-
business market, were deemed unresolved.
Customer satisfaction with energy supplier complaints handling 2018
© Quadrangle 2018 19
4 Satisfaction with complaints handling
4.1 Market level satisfaction
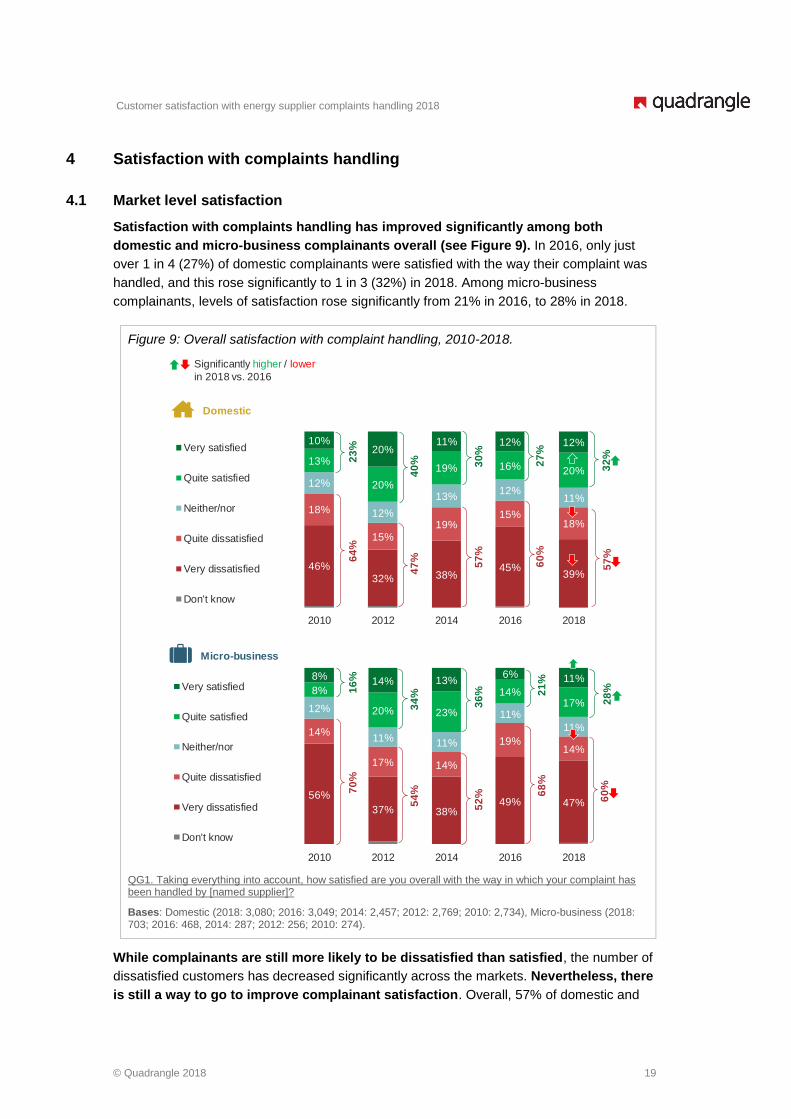
Satisfaction with complaints handling has improved significantly among both
domestic and micro-business complainants overall (see Figure 9). In 2016, only just
over 1 in 4 (27%) of domestic complainants were satisfied with the way their complaint was
handled, and this rose significantly to 1 in 3 (32%) in 2018. Among micro-business
complainants, levels of satisfaction rose significantly from 21% in 2016, to 28% in 2018.
Figure 9: Overall satisfaction with complaint handling, 2010-2018.
QG1. Taking everything into account, how satisfied are you overall with the way in which your complaint has been handled by [named supplier]?
Bases: Domestic (2018: 3,080; 2016: 3,049; 2014: 2,457; 2012: 2,769; 2010: 2,734), Micro-business (2018: 703; 2016: 468, 2014: 287; 2012: 256; 2010: 274).
While complainants are still more likely to be dissatisfied than satisfied, the number of
dissatisfied customers has decreased significantly across the markets. Nevertheless, there
is still a way to go to improve complainant satisfaction. Overall, 57% of domestic and
46%32% 38%
45%39%
18%
15%19%
15%18%
12%
12%
13%12%
11%
13%
20%
19% 16% 20%
10%20%
11% 12% 12%
2010 2012 2014 2016 2018
Very satisfied
Quite satisfied
Neither/nor
Quite dissatisfied
Very dissatisfied
Don't know
60
%2
7%
57
%3
0%
47
%4
0%
64
%2
3%
56%
37% 38%49% 47%
14%
17% 14%
19%14%
12%
11% 11%
11%
11%
8%
20% 23%
14%17%
8%14% 13%
6% 11%
2010 2012 2014 2016 2018
Very satisfied
Quite satisfied
Neither/nor
Quite dissatisfied
Very dissatisfied
Don't know
68
%2
1%
52
%3
6%
54
%3
4%
70
%1
6%
Domestic
Micro-business
57
%3
2%
60
%2
8%
Significantly higher / lower
in 2018 vs. 2016

Customer satisfaction with energy supplier complaints handling 2018
© Quadrangle 2018 20
60% of micro-business complainants were dissatisfied with their complaint handling
experience. Furthermore, the strength of complainants’ feelings of dissatisfaction is evident
given the high level of ‘very’ dissatisfied complainants: 39% domestic and 47% micro-
business.
4.2 Supplier level satisfaction
There were significant differences in levels of satisfaction and dissatisfaction with
how complaints were handled across suppliers in the domestic market since 2016.
Encouragingly, the worst domestic performers from 2016, npower and ScottishPower, have
shown significant uplifts in overall satisfaction, owing in part to the improvements in the
number of resolved cases. Clearly, their efforts to implement improvements after the
deterioration in satisfaction over the 2014-2016 period, have had a positive impact on the
experiences of their domestic complainants, though there is still a long way to go as the
majority, close to 2 in 3, were dissatisfied with how their complaint had been handled. Figure
10a below shows satisfaction levels among the largest suppliers in the domestic market.
Figure 10a: Overall satisfaction with complaint handling – largest domestic suppliers.
QG1. Taking everything into account, how satisfied are you overall with the way in which your complaint has been handled by [named supplier]?
Bases: 2016 – Domestic Total (3,049), Largest suppliers Total (2,570), Medium suppliers Total (479), British Gas (653), SSE (405), EDF (228), E.ON (500), ScottishPower (332), npower (452). 2018 – Domestic Total (3,080), Largest suppliers Total (2,077), Medium suppliers Total (1,003), British Gas (334), SSE (356), EDF (325), E.ON (421), ScottishPower (356), npower (285).
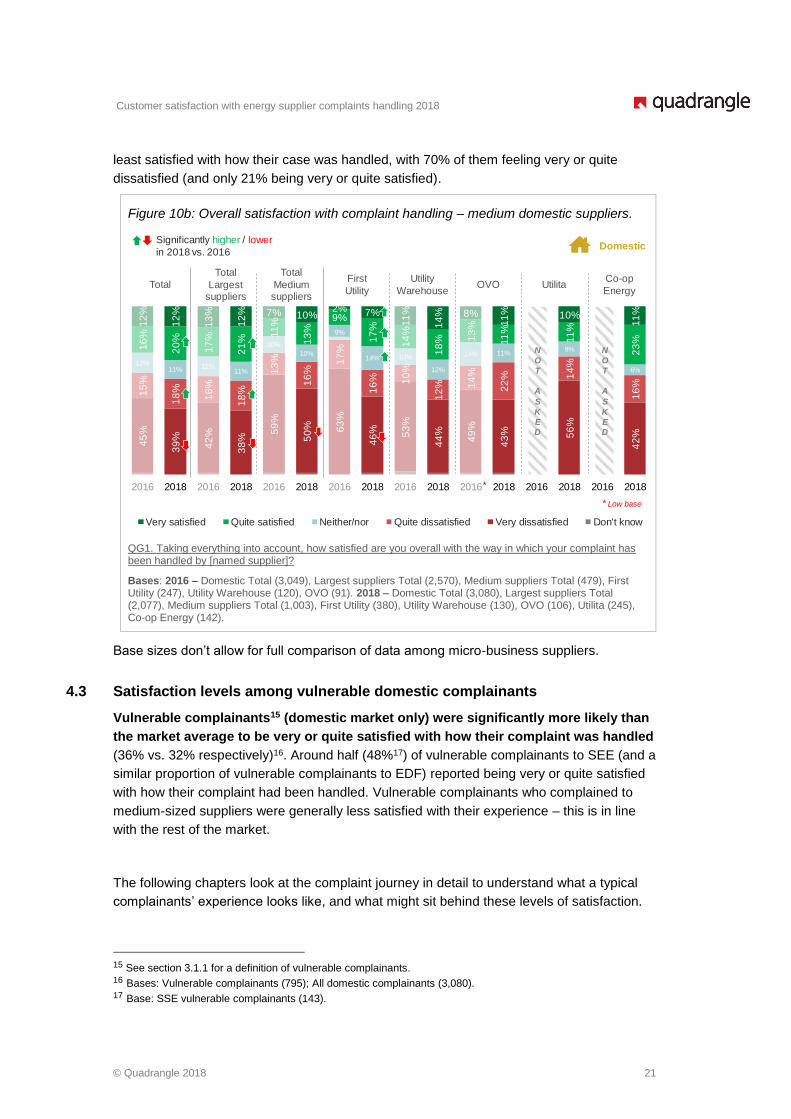
Among domestic medium suppliers (see Figure 10b below), First Utility has seen a
significant uplift in satisfaction with complaints handling, and others have seen marginal
improvements. It is also encouraging to see a decrease in levels of complainants who were
very dissatisfied with their experience (where comparisons with 2016 can be made). Co-op
is the top performer (34% satisfied, 58% dissatisfied), while complainants to Utilita were
45
%
39
%
42
%
38
%
59
%
50
%
26
%
27
%
34
%
35
%
35
%
30
% 41
%
45
%
67
%
41
%
64
%
47
%
15
%
18
%
16
%
18
%
13
%
16
%
14
%
16
% 16
%
19
%
16
%
22
% 17
%
17
%
16
%
21
%
13
%
16
%12%
11% 12%11%
10%
10%
16% 12%
14% 10% 15% 12%
12% 10%
6%
11%
9%
11%
16
%
20
%
17
%
21
%
11
%
13
%
23
%
26
% 19
%
21
%
15
%
22
% 18
%
19
%
8%2
0%
9%
19
%
12
%
12
%
13
%
12
% 7% 10%
20
%
18
%
16
%
15
%
17
%
14
%
11
% 10%3% 8% 4% 6%
2016 2018 2016 2018 2016 2018 2016 2018 2016 2018 2016 2018 2016 2018 2016 2018 2016 2018
Domestic
Total
Total
Largest suppliers
Total
Medium suppliers
SSE E.ON EDFBritish
Gasnpower
Scottish
Power
Very satisfied Quite satisfied Neither/nor Quite dissatisfied Very dissatisfied Don't know
Significantly higher / lower
in 2018 vs. 2016
Customer satisfaction with energy supplier complaints handling 2018
© Quadrangle 2018 21
least satisfied with how their case was handled, with 70% of them feeling very or quite
dissatisfied (and only 21% being very or quite satisfied).
Figure 10b: Overall satisfaction with complaint handling – medium domestic suppliers.
QG1. Taking everything into account, how satisfied are you overall with the way in which your complaint has been handled by [named supplier]?
Bases: 2016 – Domestic Total (3,049), Largest suppliers Total (2,570), Medium suppliers Total (479), First Utility (247), Utility Warehouse (120), OVO (91). 2018 – Domestic Total (3,080), Largest suppliers Total (2,077), Medium suppliers Total (1,003), First Utility (380), Utility Warehouse (130), OVO (106), Utilita (245), Co-op Energy (142).
Base sizes don’t allow for full comparison of data among micro-business suppliers.
4.3 Satisfaction levels among vulnerable domestic complainants
Vulnerable complainants15 (domestic market only) were significantly more likely than
the market average to be very or quite satisfied with how their complaint was handled
(36% vs. 32% respectively)16. Around half (48%17) of vulnerable complainants to SEE (and a
similar proportion of vulnerable complainants to EDF) reported being very or quite satisfied
with how their complaint had been handled. Vulnerable complainants who complained to
medium-sized suppliers were generally less satisfied with their experience – this is in line
with the rest of the market.
The following chapters look at the complaint journey in detail to understand what a typical
complainants’ experience looks like, and what might sit behind these levels of satisfaction.
15 See section 3.1.1 for a definition of vulnerable complainants. 16 Bases: Vulnerable complainants (795); All domestic complainants (3,080). 17 Base: SSE vulnerable complainants (143).
DomesticSignificantly higher / lower
in 2018 vs. 2016
*
45
%
39
%
42
%
38
%
59
%
50
% 63
%
46
% 53
%
44
%
49
%
43
%
0%
56
%
0
42
%
15
%
18
%
16
%
18
%
13
%
16
%
17
%
16
% 10
%
12
% 14
%
22
%
0%
14
%
0
16
%
12%11% 12%
11%
10%
10%
9%
14% 10%
12%
14% 11%
0%
9%
0
6%
16
%
20
%
17
%
21
%
11
%
13
%
9%
17
%
14
%
18
% 13
%
11
%
0%
11
%
0
23
%
12
%
12
%
13
%
12
% 7% 10%2% 7%
11
%
14
% 8%
11
%
0%
10%
0
11
%
2016 2018 2016 2018 2016 2018 2016 2018 2016 2018 2016 2018 2016 2018 2016 2018
Total
Total
Largest suppliers
Total
Medium suppliers
First
Utility
Utility
WarehouseOVO Utilita
Co-op
Energy
N
O
T
A
S
K
E
D
N
O
T
A
S
K
E
D
* Low base
Very satisfied Quite satisfied Neither/nor Quite dissatisfied Very dissatisfied Don't know

Customer satisfaction with energy supplier complaints handling 2018
© Quadrangle 2018 22
5 The complaint journey
5.1 Introducing the journey
The complaint ‘journey’ was explored by identifying the core stages in the complaints
process, also shown in Figure 11 below:
1. Start of the journey ▪ Finding contact details
▪ Registration and confirmation/ acknowledgement
▪ Next steps and timescales
2. Subsequent contact ▪ Communication following initial contact to reach problem
resolution
3. Escalation and third
party involvement
▪ Potential escalation to a more senior member of staff
and/or referral to the Energy Ombudsman
4. Resolution ▪ Including receiving confirmation/ acknowledgement of
resolution
5. Closure ▪ Receiving an explanation of what went wrong or an
apology
▪ Receiving compensation, if applicable
Each stage was investigated in detail to understand what the process was like from the
complainants’ perspective, and what impact each element had on overall satisfaction with
complaints handling. The questions asked about each stage of the complaint journey
reflected the requirements of Ofgem’s Complaint Handling Standards (CHS) which suppliers
must adhere to.
Figure 11: The complaint journey.
Independent advice can
be sought at any point
Finding
contact details
Lodging
complaint
Registration /
confirmation of complaint
Subsequent contact
with supplier to reach a problem
resolution
Referral to Energy
Ombudsman
Confirmation of
process / next steps, and timescales
Escalation
Formal
resolution confirmation
Resolution
Explanation of what
went wrong
Apology
Compensation
Start of the journeySubsequent
contactEscalation Resolution Closure and impact
COMPLAINT JOURNEY STAGES:
STEPS IN EACH STAGE:
Customer satisfaction with energy supplier complaints handling 2018
© Quadrangle 2018 23
The remaining sections in this chapter address each of the core steps in the complaint
journey in detail, starting with the ease of finding the correct contact details to be able to
lodge the complaint or express dissatisfaction with the service received.
5.2 Start of the journey
5.2.1 Raising the complaint
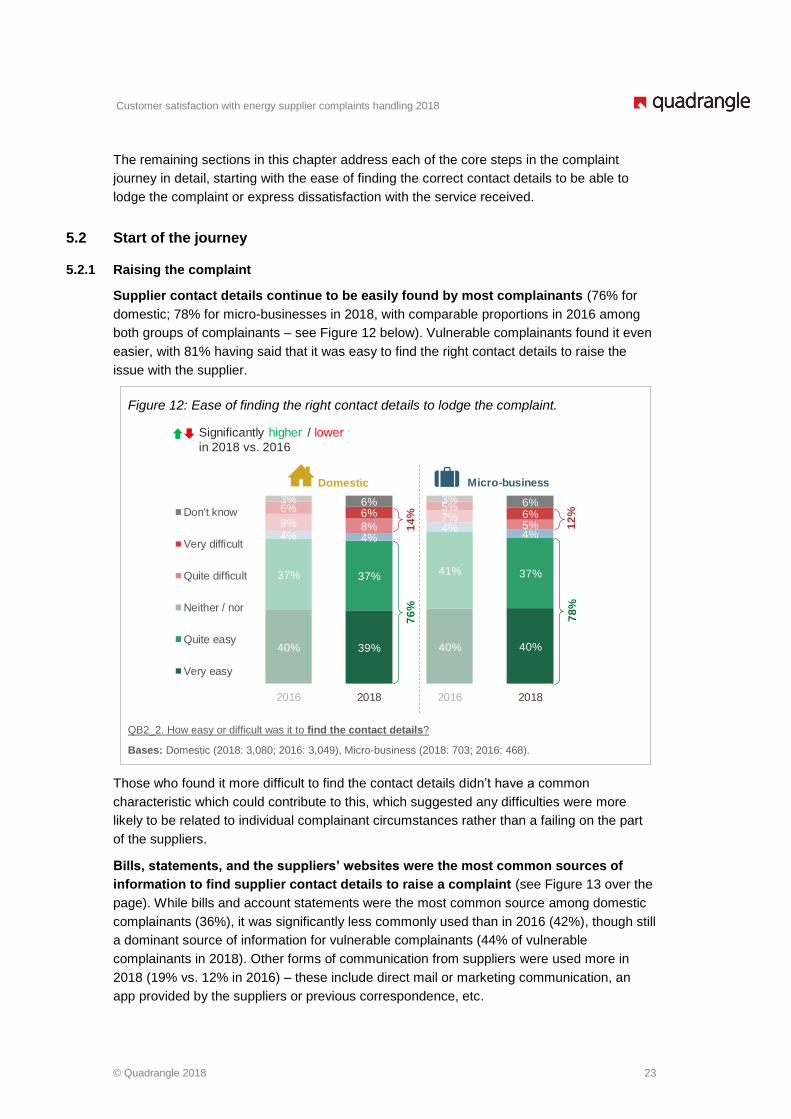
Supplier contact details continue to be easily found by most complainants (76% for
domestic; 78% for micro-businesses in 2018, with comparable proportions in 2016 among
both groups of complainants – see Figure 12 below). Vulnerable complainants found it even
easier, with 81% having said that it was easy to find the right contact details to raise the
issue with the supplier.
Figure 12: Ease of finding the right contact details to lodge the complaint.
QB2_2. How easy or difficult was it to find the contact details?
Bases: Domestic (2018: 3,080; 2016: 3,049), Micro-business (2018: 703; 2016: 468).
Those who found it more difficult to find the contact details didn’t have a common
characteristic which could contribute to this, which suggested any difficulties were more
likely to be related to individual complainant circumstances rather than a failing on the part
of the suppliers.
Bills, statements, and the suppliers’ websites were the most common sources of
information to find supplier contact details to raise a complaint (see Figure 13 over the
page). While bills and account statements were the most common source among domestic
complainants (36%), it was significantly less commonly used than in 2016 (42%), though still
a dominant source of information for vulnerable complainants (44% of vulnerable
complainants in 2018). Other forms of communication from suppliers were used more in
2018 (19% vs. 12% in 2016) – these include direct mail or marketing communication, an
app provided by the suppliers or previous correspondence, etc.
Domestic Micro-business
40% 39% 40% 40%
37% 37%41% 37%
4% 4%4%
4%9% 8%
7%5%
6% 6%5%
6%
3% 6% 3% 6%
2016 2018 2016 2018
Don't know
Very difficult
Quite difficult
Neither / nor
Quite easy
Very easy
14
%7
6%
12
%7
8%
Significantly higher / lower
in 2018 vs. 2016

Customer satisfaction with energy supplier complaints handling 2018
© Quadrangle 2018 24
Figure 13: Source of contact details.
QB1. Thinking about when you contacted [named supplier] in [Complaint month], where did you find the contact information you needed to make the complaint?
Bases: Domestic (2018: 3,080; 2016: 3,049), Micro-business (2018: 703; 2016: 468).
Micro-business complainants typically found the supplier’s contact details on their bills or
account statements (55% in 2018) – this is fairly consistent with 2016, when other sources
of information were used comparatively little.
While registering the complaint was easy for most, 1 in 3 still experienced difficulties
– this hasn’t changed since 2016 (see Figure 14). The experience of registering a
complaint among vulnerable complainants is comparable to the market average.
Figure 14: Ease of registering the complaint.
QB2_2. How easy or difficult was it to register your complaint with [named supplier]?
Bases: Domestic (2018: 3,080; 2016: 3,049), Micro-business (2018: 703; 2016: 468).
Domestic Micro-business
27% 27% 25% 26%
29% 30% 33% 28%
5% 5% 5%7%
15% 16% 14% 15%
21% 18% 19% 20%
3% 4% 3% 4%
2016 2018 2016 2018
Don't know
Very difficult
Quite difficult
Neither / nor
Quite easy
Very easy
34
%5
7%
35
%5
4%
Significantly higher / lower
in 2018 vs. 2016
Domestic Micro-business
Significantly higher / lower
in 2018 vs. 2016
62%
18%
14%
3%
0%
3%
2%
55%
15%
16%
6%
4%
2%
5%
2016
2018
42%
33%
12%
7%
1%
5%
2%
36%
33%
19%
8%
2%
3%
4%
Bill or account statement
Supplier website
Other form of communication with supplier
Other website
Referred from other department
Other
Can't remember2016
2018
Customer satisfaction with energy supplier complaints handling 2018
© Quadrangle 2018 25
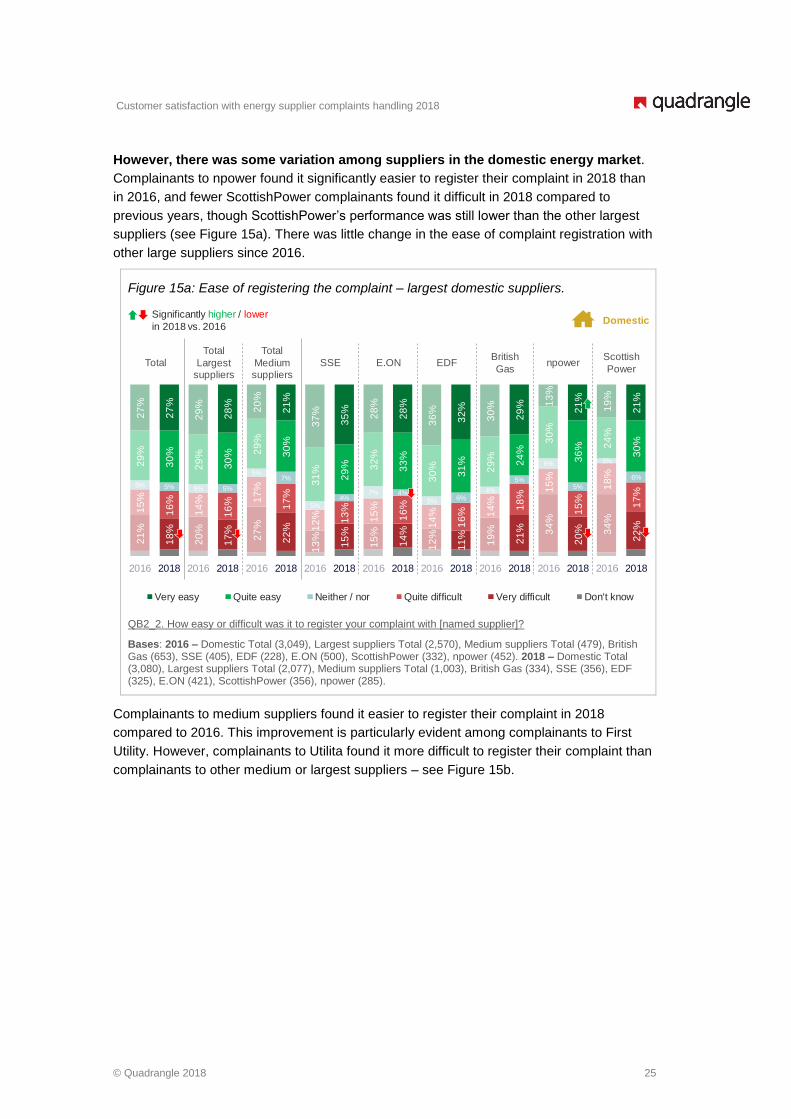
However, there was some variation among suppliers in the domestic energy market.
Complainants to npower found it significantly easier to register their complaint in 2018 than
in 2016, and fewer ScottishPower complainants found it difficult in 2018 compared to
previous years, though ScottishPower’s performance was still lower than the other largest
suppliers (see Figure 15a). There was little change in the ease of complaint registration with
other large suppliers since 2016.
Figure 15a: Ease of registering the complaint – largest domestic suppliers.
QB2_2. How easy or difficult was it to register your complaint with [named supplier]?
Bases: 2016 – Domestic Total (3,049), Largest suppliers Total (2,570), Medium suppliers Total (479), British Gas (653), SSE (405), EDF (228), E.ON (500), ScottishPower (332), npower (452). 2018 – Domestic Total (3,080), Largest suppliers Total (2,077), Medium suppliers Total (1,003), British Gas (334), SSE (356), EDF (325), E.ON (421), ScottishPower (356), npower (285).
Complainants to medium suppliers found it easier to register their complaint in 2018
compared to 2016. This improvement is particularly evident among complainants to First
Utility. However, complainants to Utilita found it more difficult to register their complaint than
complainants to other medium or largest suppliers – see Figure 15b.
21
%
18
%
20
%
17
%
27
%
22
%
13
%
15
%
15
%
14
%
12
%
11
%
19
%
21
% 34
%
20
% 34
%
22
%
15
%
16
%
14
%
16
% 17
%
17
%
12
% 13
%
15
%
16
%
14
%
16
% 14
%
18
%
15
%
15
%
18
%
17
%
5% 5% 5% 5%
5%7%
5%4%
7% 4%
5% 6%4%
5%
6%
5%
3%
6%
29
%
30
%
29
%
30
% 29
%
30
%
31
%
29
% 32
%
33
%
30
%
31
%
29
%
24
%
30
%
36
% 24
%
30
%
27
%
27
%
29
%
28
%
20
%
21
%
37
%
35
%
28
%
28
%
36
%
32
%
30
%
29
% 13
%
21
%
19
%
21
%
2016 2018 2016 2018 2016 2018 2016 2018 2016 2018 2016 2018 2016 2018 2016 2018 2016 2018
Domestic
Total
Total
Largest suppliers
Total
Medium suppliers
SSE E.ON EDFBritish
Gasnpower
Scottish
Power
Very easy Quite easy Neither / nor Quite difficult Very difficult Don't know
Significantly higher / lower
in 2018 vs. 2016
Customer satisfaction with energy supplier complaints handling 2018
© Quadrangle 2018 26
Figure 15b: Ease of registering the complaint – medium domestic suppliers.
QB2_2. How easy or difficult was it to register your complaint with [named supplier]?
Bases: 2016 – Domestic Total (3,049), Largest suppliers Total (2,570), Medium suppliers Total (479), First Utility (247), Utility Warehouse (120), OVO (91). 2018 – Domestic Total (3,080), Largest suppliers Total (2,077), Medium suppliers Total (1,003), First Utility (380), Utility Warehouse (130), OVO (106), Utilita (245), Co-op Energy (142).
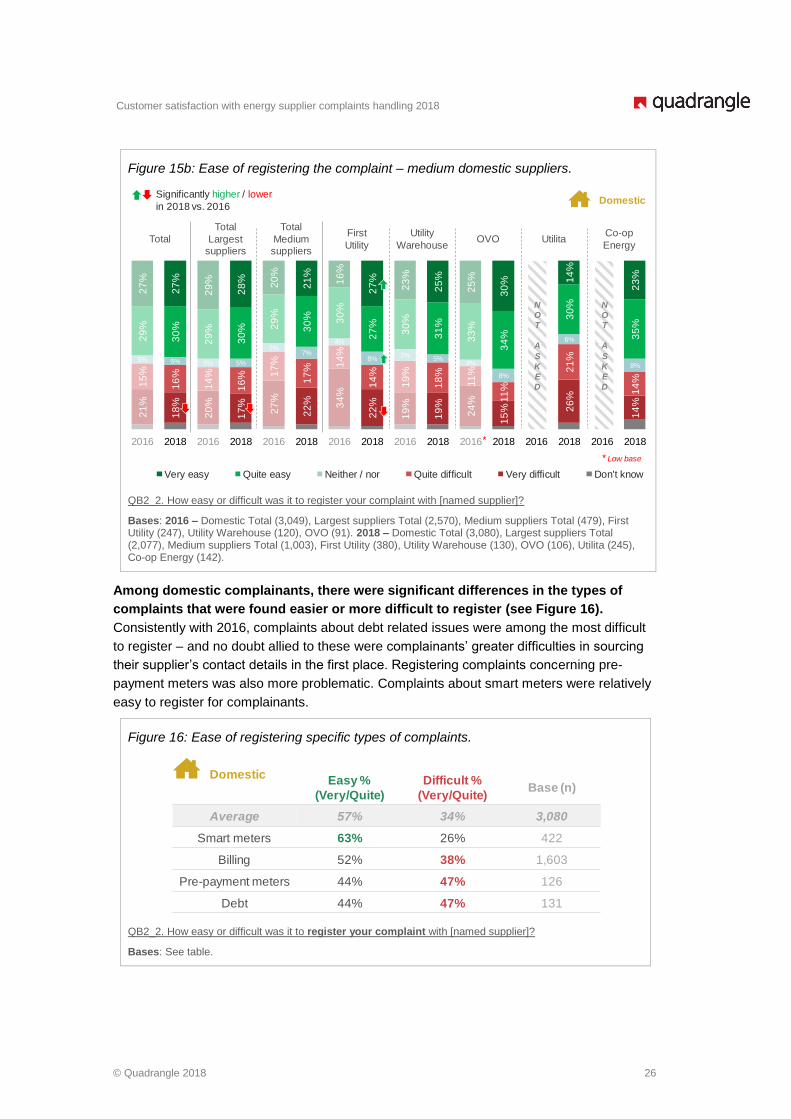
Among domestic complainants, there were significant differences in the types of
complaints that were found easier or more difficult to register (see Figure 16).
Consistently with 2016, complaints about debt related issues were among the most difficult
to register – and no doubt allied to these were complainants’ greater difficulties in sourcing
their supplier’s contact details in the first place. Registering complaints concerning pre-
payment meters was also more problematic. Complaints about smart meters were relatively
easy to register for complainants.
Figure 16: Ease of registering specific types of complaints.
QB2_2. How easy or difficult was it to register your complaint with [named supplier]?
Bases: See table.
DomesticEasy %
(Very/Quite)
Difficult %
(Very/Quite)Base (n)
Average 57% 34% 3,080
Smart meters 63% 26% 422
Billing 52% 38% 1,603
Pre-payment meters 44% 47% 126
Debt 44% 47% 131
Domestic
Very easy Quite easy Neither / nor Quite difficult Very difficult Don't know
Significantly higher / lower
in 2018 vs. 2016
*
21
%
18
%
20
%
17
%
27
%
22
% 34
%
22
%
19
%
19
%
24
%
15
%
0%
26
%
0%
14
%
15
%
16
%
14
%
16
% 17
%
17
% 14
%
14
%
19
%
18
%
11
%
11
%
0%
21
%
0%
14
%
5% 5% 5% 5%
5%7%
4%
8%7%
5%4%
8%
0%
6%
0%
8%
29
%
30
%
29
%
30
% 29
%
30
% 30
%
27
%
30
%
31
%
33
%
34
%
0%
30
%
0%
35
%
27
%
27
%
29
%
28
%
20
%
21
%
16
%
27
%
23
%
25
%
25
%
30
%
0%
14
%
0%
23
%
2016 2018 2016 2018 2016 2018 2016 2018 2016 2018 2016 2018 2016 2018 2016 2018
Total
Total
Largest suppliers
Total
Medium suppliers
First
Utility
Utility
WarehouseOVO Utilita
Co-op
Energy
N
O
T
A
S
K
E
D
N
O
T
A
S
K
E
D
* Low base

Customer satisfaction with energy supplier complaints handling 2018
© Quadrangle 2018 27
Among the c. third of complainants who found it difficult to have their complaint
registered, the most common reasons involved not being able to get through to the
right person or department and being passed around (see Figures 17a). Comparison
against 2016 showed this is a growing problem for domestic complainants (57% in 2016 vs.
66% in 2018). Problems related to the complaint not being properly acknowledged or
understood were less common in 2018 than in 2016. This suggests that once complainants
do get through, the level of service they receive is improving. However, domestic suppliers
need to address this emerging issue of complainants having difficulties accessing the right
staff to address their case. The experience of vulnerable complainants is consistent with
this.
Figure 17a: Main reasons it was difficult to register the complaint – domestic complaints.
QB3. What would you say was the MAIN reason why you found it difficult to have your complaint registered?
Bases: Domestic complainants who found it difficult to register their complaint (2018: 1,046; 2016: 1,131).
Micro-businesses were more likely to struggle in 2018 with having their complaint
acknowledged as a problem than in 2016 (33% in 2018 vs. 17% in 2016). In particular, they
found that the supplier claimed the complaint they were raising was not actually an issue
(see Figure 17b). From a complainant point of view this can be quite frustrating as it sets a
negative tone for the rest of the process.
33%
33%
15%
15%
9%
8%
3%
12%
5%
7%
43%
36%
12%
12%
6%
6%
1%
14%
3%
3%
I could not get through to the right person / department
I was passed around
I was put through to the wrong person / department
Supplier claimed there was no problem
Refused to put me through to complaints department
My written complaint was not acknowledged
Supplier never got back to me after I initially raised theissue
The phone was always engaged
No understanding of problem
Rude staff
2016
2018
NOT ABLE TO
GET THROUGH TOTHE RIGHT PERSON
LACK
OF RECOGNITION
GETTING THROUGH
STAFF RELATED
ISSUES
Domestic
2016 57%
2018 66%
2016 30%
2018 23%
Significantly higher / lower
in 2018 vs. 2016
2016 11%
2018 6%

Customer satisfaction with energy supplier complaints handling 2018
© Quadrangle 2018 28
Figure 17b: Main reasons it was difficult to register the complaint – micro-business complaints.
QB3. What would you say was the MAIN reason why you found it difficult to have your complaint registered?
Bases: Micro-business complainants who found it difficult to register their complaint (2018: 255; 2016: 163).
5.2.2 Confirmation of process and next steps
Around 6 in 10 complainants received a formal acknowledgement of their complaint,
consistently with 2016. Encouragingly, the proportion of complainants stating they have
not received a formal confirmation has decreased significantly among domestic
complainants – this may be a result of a higher number of complaints being resolved on the
same day (18% in 2018 vs.14% in 2016 among resolved cases, see Figure 34 in section
5.2.2), meaning that there is not a need to send out those types of communications.
Figure 18: Formal confirmation/ acknowledgment of the complaint.
QB4. I will now read out a few statements related to what might or might not have happened when you first contacted [named supplier] about your complaint. As I read each statement out, please say YES or NO to indicate whether or not it happened to you.
Bases: Domestic (2018: 3.080; 2016: 3,049), Micro-business (2018: 703; 2016: 468).
47%
42%
28%
9%
4%
4%
1%
2%
9%
2%
42%
38%
15%
23%
6%
7%
1%
5%
4%
3%
I could not get through to the right person / department
I was passed around
I was put through to the wrong person / department
Supplier claimed there was no problem
Refused to put me through to complaints department
My written complaint was not acknowledged
Supplier never got back to me after I initially raised theissue
The phone was always engaged
No understanding of problem
Rude staff
2016
2018
NOT ABLE TO
GET THROUGH TOTHE RIGHT PERSON
LACK
OF RECOGNITION
GETTING THROUGH
STAFF RELATED
ISSUES
Micro-business
Significantly higher / lower
in 2018 vs. 2016
2016 74%
2018 64%
2016 17%
2018 33%
2016 11%
2018 7%
67% 30%I received a formal acknowledgement of my
complaint via email, post of phone57% 40%2016
Micro-businessDomestic
Yes No Don't know or N/A
67% 29%I received a formal acknowledgement of my
complaint via email, post of phone59% 36%2018
Significantly higher / lower
in 2018 vs. 2016
I received a formal
acknowledgement
of my complaint
via email, post or
phone
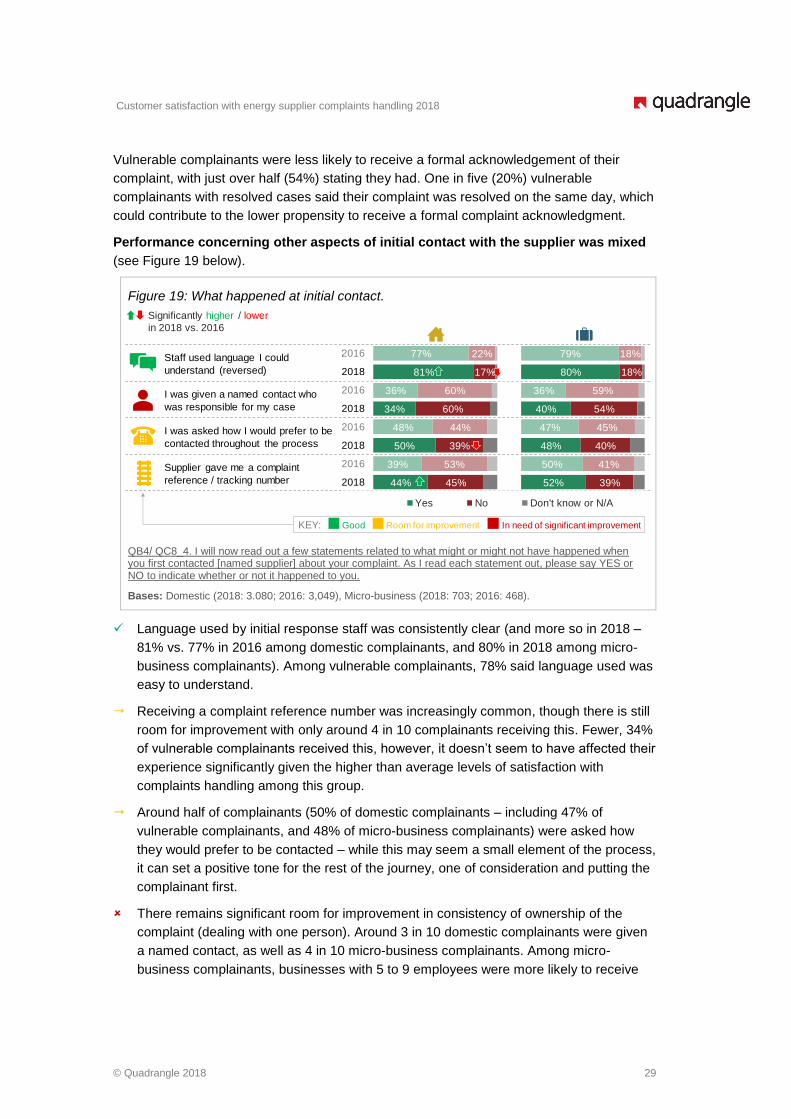
Customer satisfaction with energy supplier complaints handling 2018
© Quadrangle 2018 29
Vulnerable complainants were less likely to receive a formal acknowledgement of their
complaint, with just over half (54%) stating they had. One in five (20%) vulnerable
complainants with resolved cases said their complaint was resolved on the same day, which
could contribute to the lower propensity to receive a formal complaint acknowledgment.
Performance concerning other aspects of initial contact with the supplier was mixed
(see Figure 19 below).
Figure 19: What happened at initial contact.
QB4/ QC8_4. I will now read out a few statements related to what might or might not have happened when you first contacted [named supplier] about your complaint. As I read each statement out, please say YES or NO to indicate whether or not it happened to you.
Bases: Domestic (2018: 3.080; 2016: 3,049), Micro-business (2018: 703; 2016: 468).
✓ Language used by initial response staff was consistently clear (and more so in 2018 –
81% vs. 77% in 2016 among domestic complainants, and 80% in 2018 among micro-
business complainants). Among vulnerable complainants, 78% said language used was
easy to understand.
Receiving a complaint reference number was increasingly common, though there is still
room for improvement with only around 4 in 10 complainants receiving this. Fewer, 34%
of vulnerable complainants received this, however, it doesn’t seem to have affected their
experience significantly given the higher than average levels of satisfaction with
complaints handling among this group.
Around half of complainants (50% of domestic complainants – including 47% of
vulnerable complainants, and 48% of micro-business complainants) were asked how
they would prefer to be contacted – while this may seem a small element of the process,
it can set a positive tone for the rest of the journey, one of consideration and putting the
complainant first.
There remains significant room for improvement in consistency of ownership of the
complaint (dealing with one person). Around 3 in 10 domestic complainants were given
a named contact, as well as 4 in 10 micro-business complainants. Among micro-
business complainants, businesses with 5 to 9 employees were more likely to receive
Staff used language I could
understand (reversed)
I was given a named contact who
was responsible for my case
I was asked how I would prefer to be
contacted throughout the process
Supplier gave me a complaint
reference / tracking number
79%
80%
36%
40%
47%
48%
50%
52%
18%
18%
59%
54%
45%
40%
41%
39%
2016
2018
2016
2018
2016
2018
2016
2018
77%
81%
36%
34%
48%
50%
39%
44%
22%
17%
60%
60%
44%
39%
53%
45%
2016
2018
2016
2018
2016
2018
2016
2018
Yes No Don't know or N/A
Significantly higher / lower
in 2018 vs. 2016
KEY: Good Room for improvement In need of significant improvement
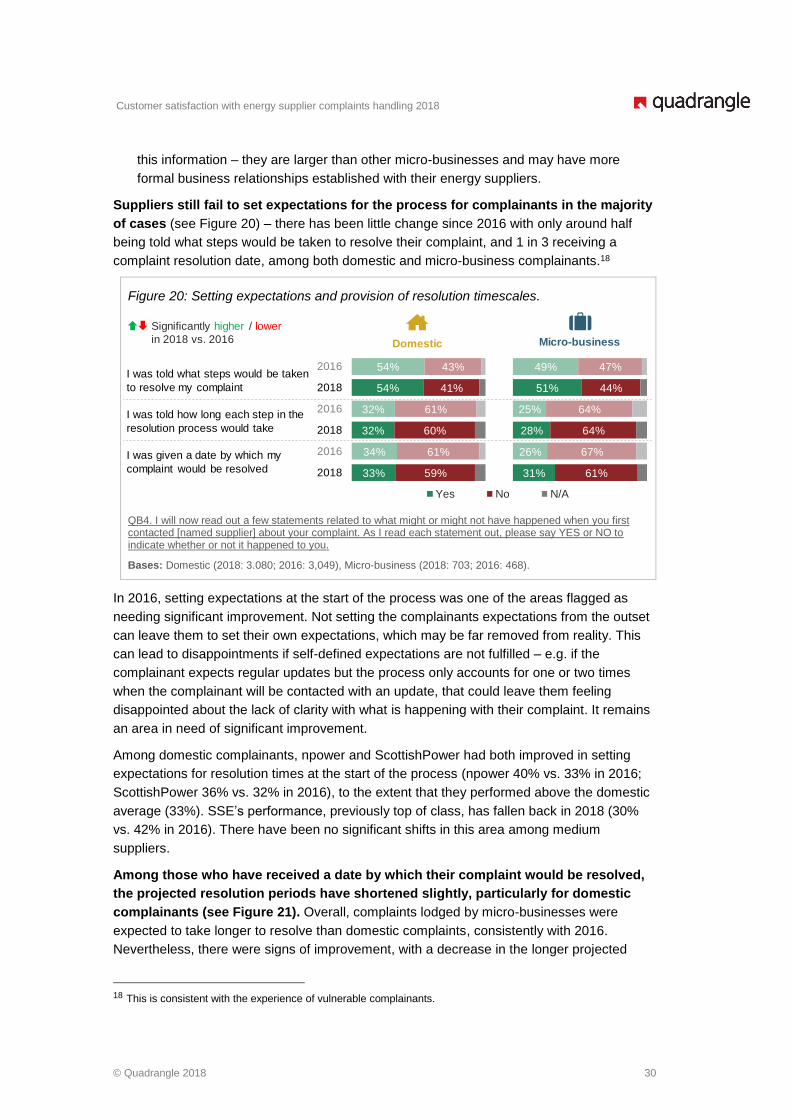
Customer satisfaction with energy supplier complaints handling 2018
© Quadrangle 2018 30
this information – they are larger than other micro-businesses and may have more
formal business relationships established with their energy suppliers.
Suppliers still fail to set expectations for the process for complainants in the majority
of cases (see Figure 20) – there has been little change since 2016 with only around half
being told what steps would be taken to resolve their complaint, and 1 in 3 receiving a
complaint resolution date, among both domestic and micro-business complainants.18
Figure 20: Setting expectations and provision of resolution timescales.
QB4. I will now read out a few statements related to what might or might not have happened when you first contacted [named supplier] about your complaint. As I read each statement out, please say YES or NO to indicate whether or not it happened to you.
Bases: Domestic (2018: 3.080; 2016: 3,049), Micro-business (2018: 703; 2016: 468).
In 2016, setting expectations at the start of the process was one of the areas flagged as
needing significant improvement. Not setting the complainants expectations from the outset
can leave them to set their own expectations, which may be far removed from reality. This
can lead to disappointments if self-defined expectations are not fulfilled – e.g. if the
complainant expects regular updates but the process only accounts for one or two times
when the complainant will be contacted with an update, that could leave them feeling
disappointed about the lack of clarity with what is happening with their complaint. It remains
an area in need of significant improvement.
Among domestic complainants, npower and ScottishPower had both improved in setting
expectations for resolution times at the start of the process (npower 40% vs. 33% in 2016;
ScottishPower 36% vs. 32% in 2016), to the extent that they performed above the domestic
average (33%). SSE’s performance, previously top of class, has fallen back in 2018 (30%
vs. 42% in 2016). There have been no significant shifts in this area among medium
suppliers.
Among those who have received a date by which their complaint would be resolved,
the projected resolution periods have shortened slightly, particularly for domestic
complainants (see Figure 21). Overall, complaints lodged by micro-businesses were
expected to take longer to resolve than domestic complaints, consistently with 2016.
Nevertheless, there were signs of improvement, with a decrease in the longer projected
18 This is consistent with the experience of vulnerable complainants.
Yes No N/A
49%
51%
25%
28%
26%
31%
47%
44%
64%
64%
67%
61%
2016
2018
2016
2018
2016
2018
54%
54%
32%
32%
34%
33%
43%
41%
61%
60%
61%
59%
2016
2018
2016
2018
2016
2018
I was told what steps would be taken
to resolve my complaint
I was told how long each step in the
resolution process would take
I was given a date by which my
complaint would be resolved
Significantly higher / lower
in 2018 vs. 2016 Micro-businessDomestic
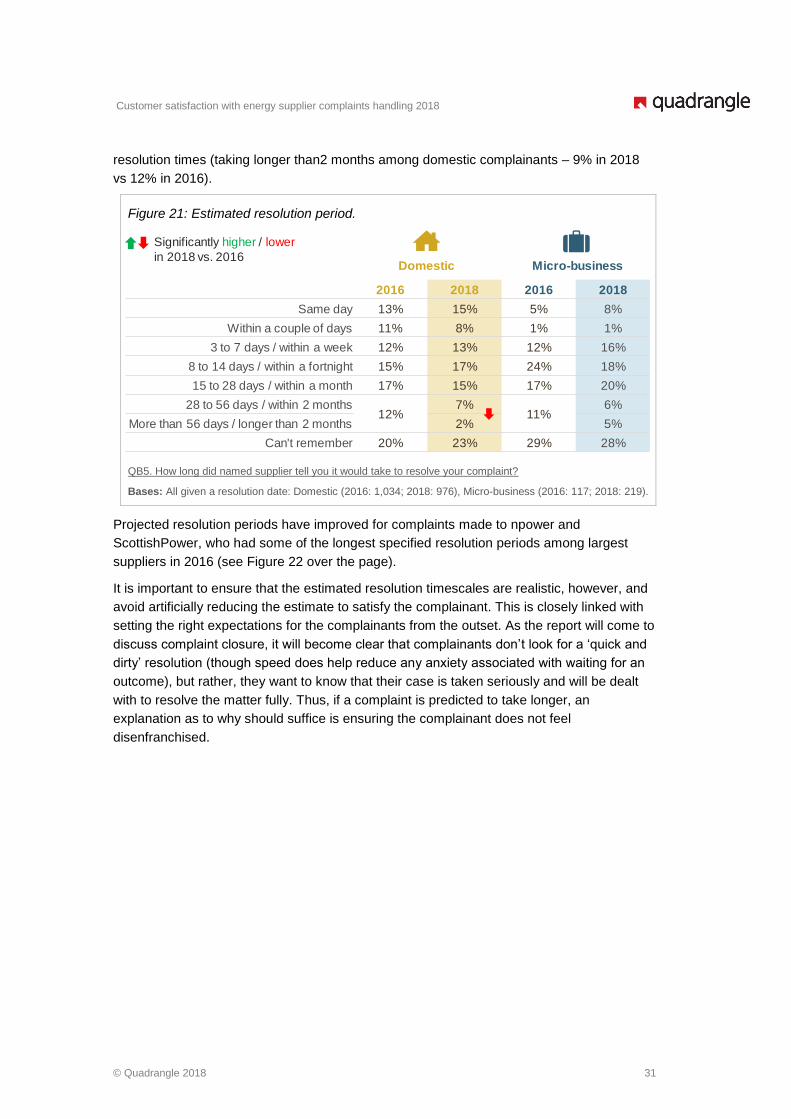
Customer satisfaction with energy supplier complaints handling 2018
© Quadrangle 2018 31
resolution times (taking longer than2 months among domestic complainants – 9% in 2018
vs 12% in 2016).
Figure 21: Estimated resolution period.
QB5. How long did named supplier tell you it would take to resolve your complaint?
Bases: All given a resolution date: Domestic (2016: 1,034; 2018: 976), Micro-business (2016: 117; 2018: 219).
Projected resolution periods have improved for complaints made to npower and
ScottishPower, who had some of the longest specified resolution periods among largest
suppliers in 2016 (see Figure 22 over the page).
It is important to ensure that the estimated resolution timescales are realistic, however, and
avoid artificially reducing the estimate to satisfy the complainant. This is closely linked with
setting the right expectations for the complainants from the outset. As the report will come to
discuss complaint closure, it will become clear that complainants don’t look for a ‘quick and
dirty’ resolution (though speed does help reduce any anxiety associated with waiting for an
outcome), but rather, they want to know that their case is taken seriously and will be dealt
with to resolve the matter fully. Thus, if a complaint is predicted to take longer, an
explanation as to why should suffice is ensuring the complainant does not feel
disenfranchised.
2016 2018 2016 2018
Same day 13% 15% 5% 8%
Within a couple of days 11% 8% 1% 1%
3 to 7 days / within a week 12% 13% 12% 16%
8 to 14 days / within a fortnight 15% 17% 24% 18%
15 to 28 days / within a month 17% 15% 17% 20%
28 to 56 days / within 2 months12%
7%11%
6%
More than 56 days / longer than 2 months 2% 5%
Can't remember 20% 23% 29% 28%
Significantly higher / lower
in 2018 vs. 2016Micro-businessDomestic
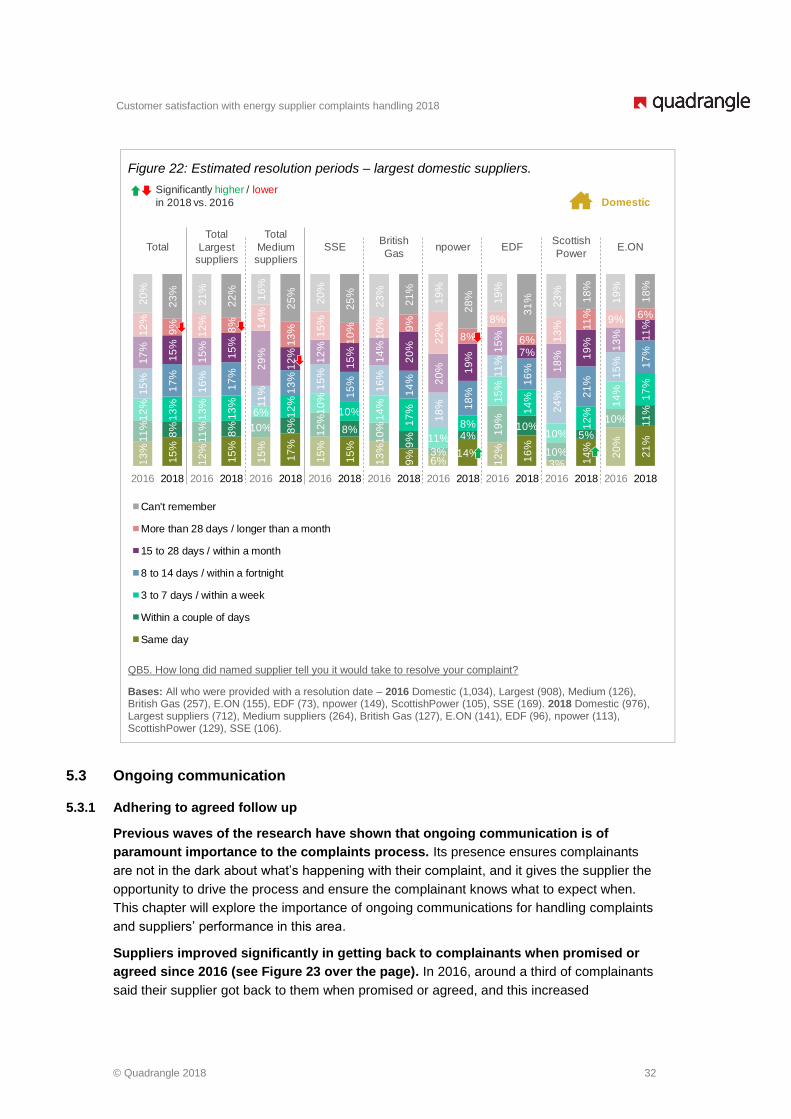
Customer satisfaction with energy supplier complaints handling 2018
© Quadrangle 2018 32
Figure 22: Estimated resolution periods – largest domestic suppliers.
QB5. How long did named supplier tell you it would take to resolve your complaint?
Bases: All who were provided with a resolution date – 2016 Domestic (1,034), Largest (908), Medium (126), British Gas (257), E.ON (155), EDF (73), npower (149), ScottishPower (105), SSE (169). 2018 Domestic (976), Largest suppliers (712), Medium suppliers (264), British Gas (127), E.ON (141), EDF (96), npower (113), ScottishPower (129), SSE (106).
5.3 Ongoing communication
5.3.1 Adhering to agreed follow up
Previous waves of the research have shown that ongoing communication is of
paramount importance to the complaints process. Its presence ensures complainants
are not in the dark about what’s happening with their complaint, and it gives the supplier the
opportunity to drive the process and ensure the complainant knows what to expect when.
This chapter will explore the importance of ongoing communications for handling complaints
and suppliers’ performance in this area.
Suppliers improved significantly in getting back to complainants when promised or
agreed since 2016 (see Figure 23 over the page). In 2016, around a third of complainants
said their supplier got back to them when promised or agreed, and this increased
0%
20%
40%
60%
80%
100%Can't remember
More than 28 days / longer than a month
15 to 28 days / within a month
8 to 14 days / within a fortnight
3 to 7 days / within a week
Within a couple of days
Same day
13
%
15
%
12
%
15
%
15
%
17
%
15
%
15
%
13
%
9%
6%14%
12
%
16
%
3% 14
%
20
%
21
%11
%
8%
11
%
8% 10% 8%
12
%
8%
10
%
9%
3%
4% 19
%
10%
10%
5%
10% 11
%
12
%
13
%
13
%
13
%
6% 12
%
10
%
10%
14
%
17
%
11%
8%
15
%
14
%
10%
12
%
14
%
17
%
15
%
17
%
16
%
17
%
11
% 13
%
15
%
15
%
16
%
14
%
18
% 18
%
11
%
16
%
24
% 21
%
15
% 17
%
17
%
15
%
15
%
15
%
29
%
12
%
12
%
15
%
14
%
20
%
20
% 19
%
15
%
7%
18
% 19
% 13
% 11
%
12
%
9%
12
%
8% 14
%
13
% 15
%
10
%
10
% 9%
22
%
8%
8%
6% 13
% 11
% 9% 6%
20
%
23
%
21
%
22
%
16
%
25
%
20
%
25
%
23
%
21
%
19
%
28
% 19
%
31
% 23
%
18
%
19
%
18
%
2016 2018 2016 2018 2016 2018 2016 2018 2016 2018 2016 2018 2016 2018 2016 2018 2016 2018
Total SSEBritish
Gasnpower EDF
Scottish
PowerE.ON
Total
Largest suppliers
Total
Medium suppliers
Significantly higher / lower
in 2018 vs. 2016 Domestic
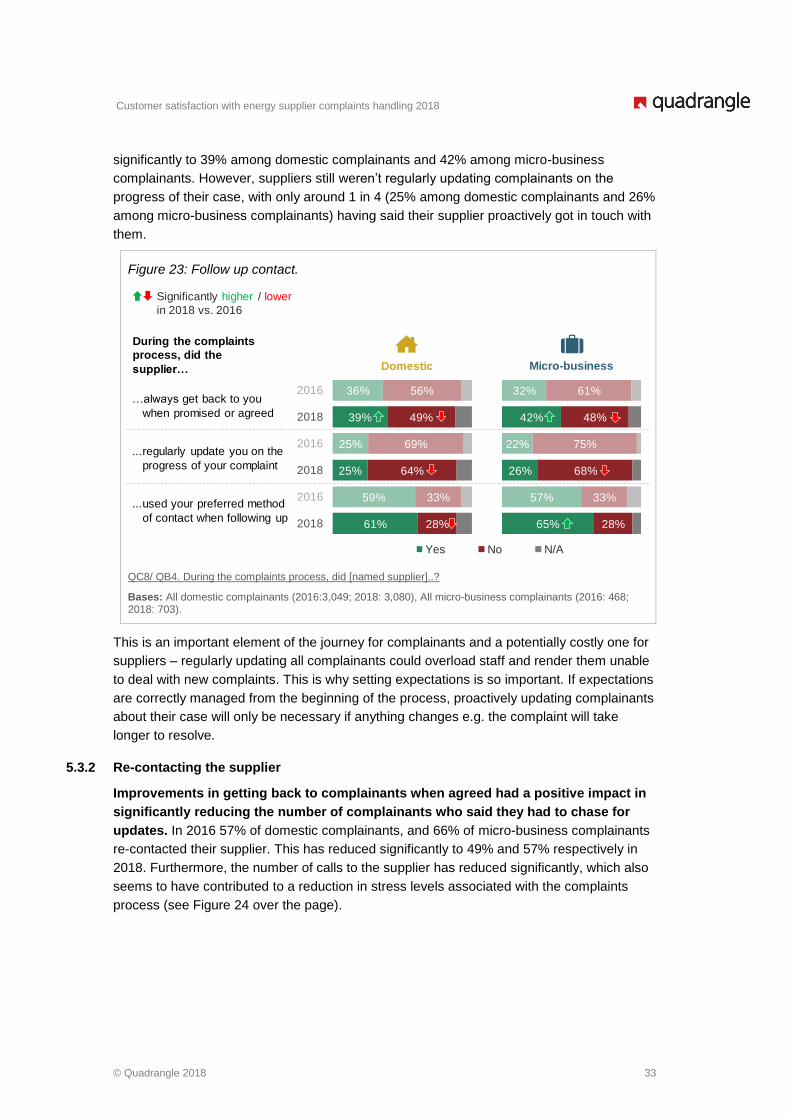
Customer satisfaction with energy supplier complaints handling 2018
© Quadrangle 2018 33
significantly to 39% among domestic complainants and 42% among micro-business
complainants. However, suppliers still weren’t regularly updating complainants on the
progress of their case, with only around 1 in 4 (25% among domestic complainants and 26%
among micro-business complainants) having said their supplier proactively got in touch with
them.
Figure 23: Follow up contact.
QC8/ QB4. During the complaints process, did [named supplier]..?
Bases: All domestic complainants (2016:3,049; 2018: 3,080), All micro-business complainants (2016: 468; 2018: 703).
This is an important element of the journey for complainants and a potentially costly one for
suppliers – regularly updating all complainants could overload staff and render them unable
to deal with new complaints. This is why setting expectations is so important. If expectations
are correctly managed from the beginning of the process, proactively updating complainants
about their case will only be necessary if anything changes e.g. the complaint will take
longer to resolve.
5.3.2 Re-contacting the supplier
Improvements in getting back to complainants when agreed had a positive impact in
significantly reducing the number of complainants who said they had to chase for
updates. In 2016 57% of domestic complainants, and 66% of micro-business complainants
re-contacted their supplier. This has reduced significantly to 49% and 57% respectively in
2018. Furthermore, the number of calls to the supplier has reduced significantly, which also
seems to have contributed to a reduction in stress levels associated with the complaints
process (see Figure 24 over the page).
Yes No N/A
Significantly higher / lower
in 2018 vs. 2016
Micro-businessDomestic
32%
42%
22%
26%
57%
65%
61%
48%
75%
68%
33%
28%
36%
39%
25%
25%
59%
61%
56%
49%
69%
64%
33%
28%
2016
2018
2016
2018
2016
2018
…always get back to you
when promised or agreed
...regularly update you on the
progress of your complaint
...used your preferred method
of contact when following up
During the complaints
process, did the
supplier…
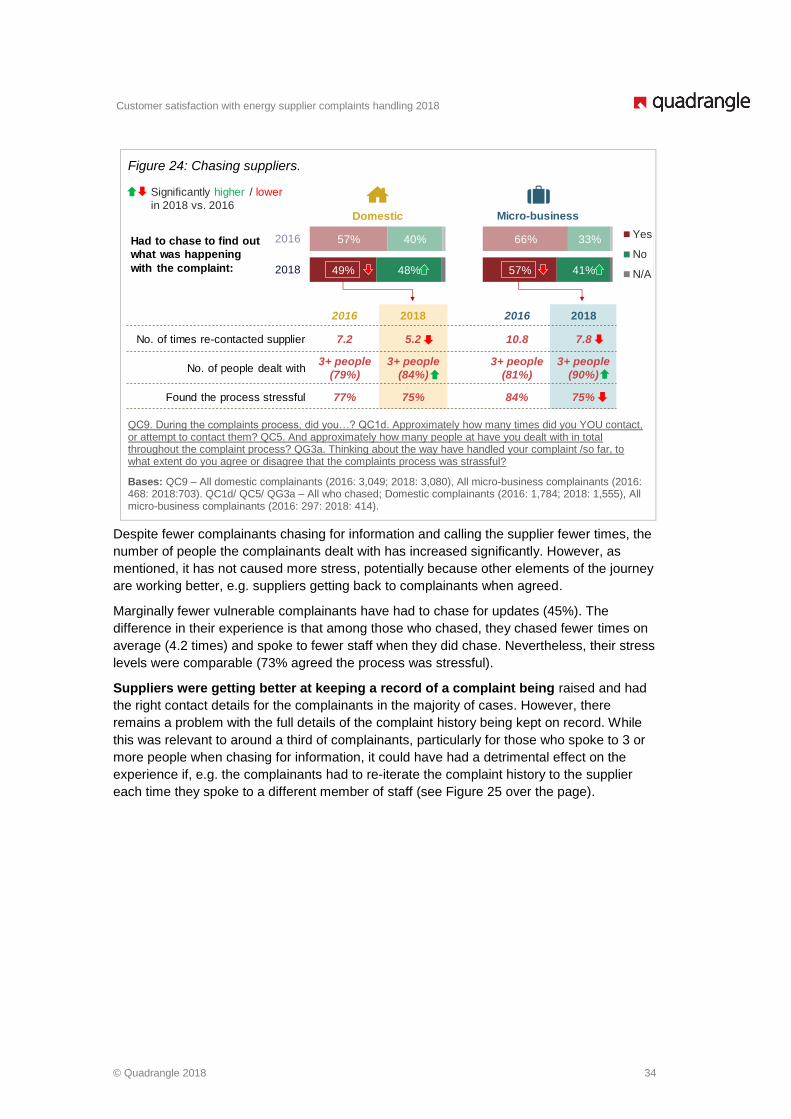
Customer satisfaction with energy supplier complaints handling 2018
© Quadrangle 2018 34
Figure 24: Chasing suppliers.
QC9. During the complaints process, did you…? QC1d. Approximately how many times did you YOU contact, or attempt to contact them? QC5. And approximately how many people at have you dealt with in total throughout the complaint process? QG3a. Thinking about the way have handled your complaint /so far, to what extent do you agree or disagree that the complaints process was strassful?
Bases: QC9 – All domestic complainants (2016: 3,049; 2018: 3,080), All micro-business complainants (2016: 468: 2018:703). QC1d/ QC5/ QG3a – All who chased; Domestic complainants (2016: 1,784; 2018: 1,555), All micro-business complainants (2016: 297: 2018: 414).
Despite fewer complainants chasing for information and calling the supplier fewer times, the
number of people the complainants dealt with has increased significantly. However, as
mentioned, it has not caused more stress, potentially because other elements of the journey
are working better, e.g. suppliers getting back to complainants when agreed.
Marginally fewer vulnerable complainants have had to chase for updates (45%). The
difference in their experience is that among those who chased, they chased fewer times on
average (4.2 times) and spoke to fewer staff when they did chase. Nevertheless, their stress
levels were comparable (73% agreed the process was stressful).
Suppliers were getting better at keeping a record of a complaint being raised and had
the right contact details for the complainants in the majority of cases. However, there
remains a problem with the full details of the complaint history being kept on record. While
this was relevant to around a third of complainants, particularly for those who spoke to 3 or
more people when chasing for information, it could have had a detrimental effect on the
experience if, e.g. the complainants had to re-iterate the complaint history to the supplier
each time they spoke to a different member of staff (see Figure 25 over the page).
66%
57%
33%
41%
2015
2017
57%
49%
40%
48%
2016
2018
2016 2018 2016 2018
No. of times re-contacted supplier 7.2 5.2 10.8 7.8
No. of people dealt with3+ people
(79%)
3+ people
(84%)
3+ people
(81%)
3+ people
(90%)
Found the process stressful 77% 75% 84% 75%
Had to chase to find out
what was happening
with the complaint:
Yes
No
N/A
Significantly higher / lower
in 2018 vs. 2016Micro-businessDomestic
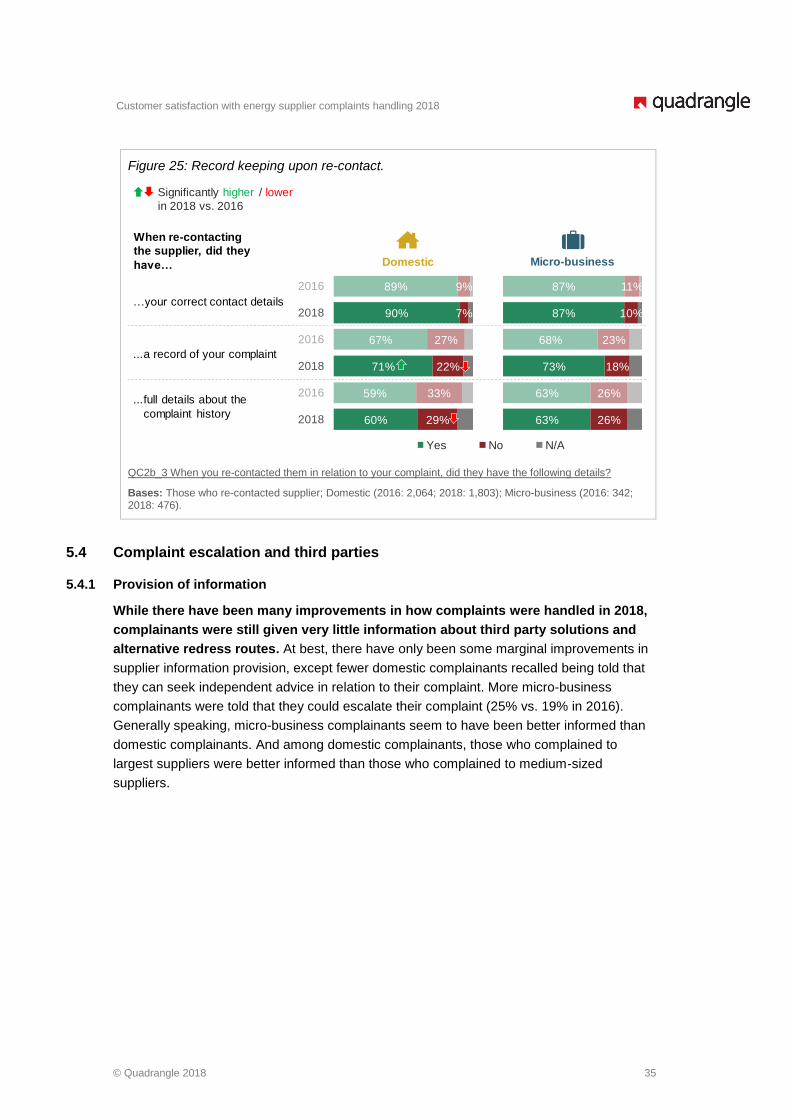
Customer satisfaction with energy supplier complaints handling 2018
© Quadrangle 2018 35
Figure 25: Record keeping upon re-contact.
QC2b_3 When you re-contacted them in relation to your complaint, did they have the following details?
Bases: Those who re-contacted supplier; Domestic (2016: 2,064; 2018: 1,803); Micro-business (2016: 342; 2018: 476).
5.4 Complaint escalation and third parties
5.4.1 Provision of information
While there have been many improvements in how complaints were handled in 2018,
complainants were still given very little information about third party solutions and
alternative redress routes. At best, there have only been some marginal improvements in
supplier information provision, except fewer domestic complainants recalled being told that
they can seek independent advice in relation to their complaint. More micro-business
complainants were told that they could escalate their complaint (25% vs. 19% in 2016).
Generally speaking, micro-business complainants seem to have been better informed than
domestic complainants. And among domestic complainants, those who complained to
largest suppliers were better informed than those who complained to medium-sized
suppliers.
Yes No N/A
Significantly higher / lower
in 2018 vs. 2016
Micro-businessDomestic
87%
87%
68%
73%
63%
63%
11%
10%
23%
18%
26%
26%
89%
90%
67%
71%
59%
60%
9%
7%
27%
22%
33%
29%
2016
2018
2016
2018
2016
2018
…your correct contact details
...a record of your complaint
...full details about the
complaint history
When re-contacting
the supplier, did they
have…
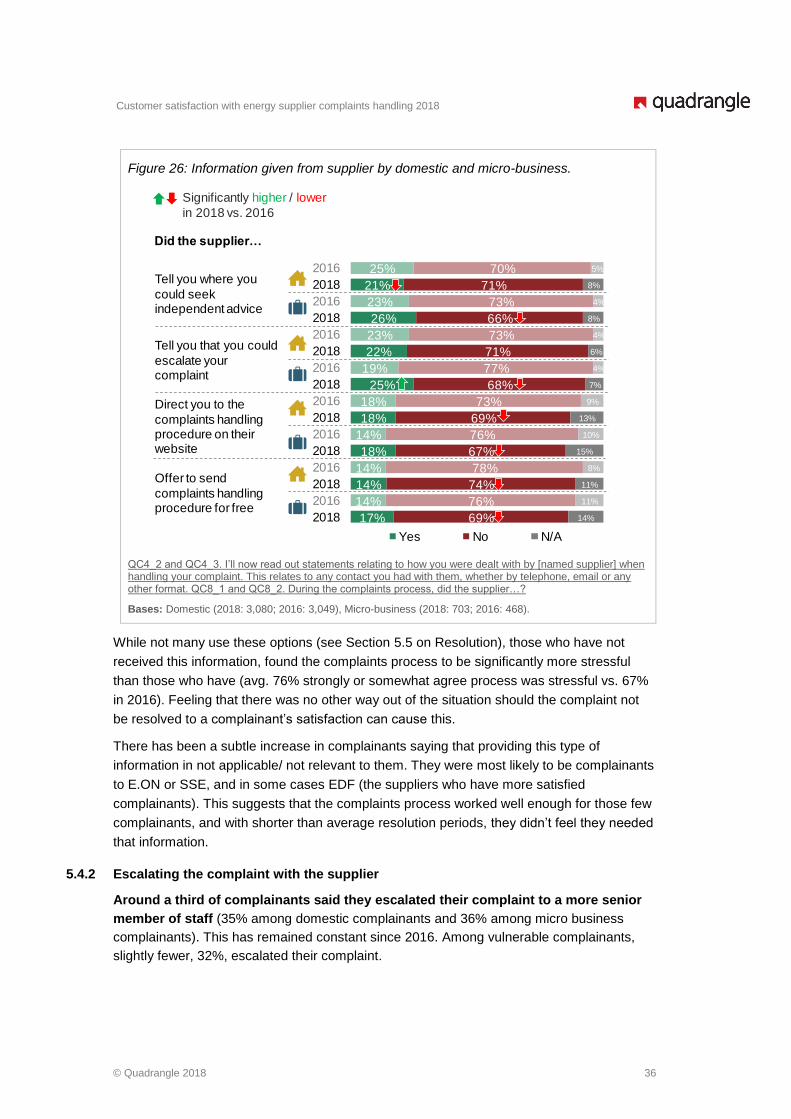
Customer satisfaction with energy supplier complaints handling 2018
© Quadrangle 2018 36
Figure 26: Information given from supplier by domestic and micro-business.
QC4_2 and QC4_3. I’ll now read out statements relating to how you were dealt with by [named supplier] when handling your complaint. This relates to any contact you had with them, whether by telephone, email or any other format. QC8_1 and QC8_2. During the complaints process, did the supplier…?
Bases: Domestic (2018: 3,080; 2016: 3,049), Micro-business (2018: 703; 2016: 468).
While not many use these options (see Section 5.5 on Resolution), those who have not
received this information, found the complaints process to be significantly more stressful
than those who have (avg. 76% strongly or somewhat agree process was stressful vs. 67%
in 2016). Feeling that there was no other way out of the situation should the complaint not
be resolved to a complainant’s satisfaction can cause this.
There has been a subtle increase in complainants saying that providing this type of
information in not applicable/ not relevant to them. They were most likely to be complainants
to E.ON or SSE, and in some cases EDF (the suppliers who have more satisfied
complainants). This suggests that the complaints process worked well enough for those few
complainants, and with shorter than average resolution periods, they didn’t feel they needed
that information.
5.4.2 Escalating the complaint with the supplier
Around a third of complainants said they escalated their complaint to a more senior
member of staff (35% among domestic complainants and 36% among micro business
complainants). This has remained constant since 2016. Among vulnerable complainants,
slightly fewer, 32%, escalated their complaint.
Did the supplier…
Tell you where you
could seek independent advice
Tell you that you could
escalate your complaint
Direct you to the
complaints handling procedure on their website
Offer to send
complaints handling procedure for free
25%
21%
23%
26%
23%
22%
19%
25%
18%
18%
14%
18%
14%
14%
14%
17%
70%
71%
73%
66%
73%
71%
77%
68%
73%
69%
76%
67%
78%
74%
76%
69%
5%
8%
4%
8%
4%
6%
4%
7%
9%
13%
10%
15%
8%
11%
11%
14%
2016
2018
2016
2018
2016
2018
2016
2018
2016
2018
2016
2018
2016
2018
2016
2018
Yes No N/A
Significantly higher / lower
in 2018 vs. 2016
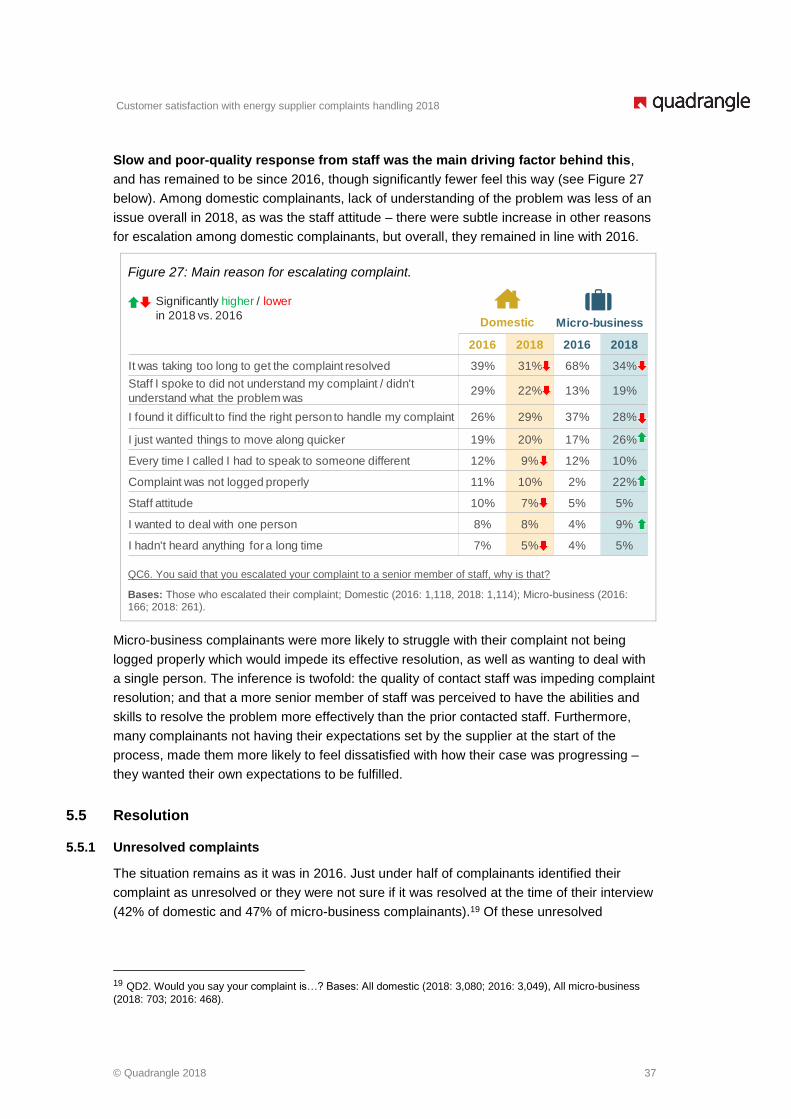
Customer satisfaction with energy supplier complaints handling 2018
© Quadrangle 2018 37
Slow and poor-quality response from staff was the main driving factor behind this,
and has remained to be since 2016, though significantly fewer feel this way (see Figure 27
below). Among domestic complainants, lack of understanding of the problem was less of an
issue overall in 2018, as was the staff attitude – there were subtle increase in other reasons
for escalation among domestic complainants, but overall, they remained in line with 2016.
Figure 27: Main reason for escalating complaint.
QC6. You said that you escalated your complaint to a senior member of staff, why is that?
Bases: Those who escalated their complaint; Domestic (2016: 1,118, 2018: 1,114); Micro-business (2016: 166; 2018: 261).
Micro-business complainants were more likely to struggle with their complaint not being
logged properly which would impede its effective resolution, as well as wanting to deal with
a single person. The inference is twofold: the quality of contact staff was impeding complaint
resolution; and that a more senior member of staff was perceived to have the abilities and
skills to resolve the problem more effectively than the prior contacted staff. Furthermore,
many complainants not having their expectations set by the supplier at the start of the
process, made them more likely to feel dissatisfied with how their case was progressing –
they wanted their own expectations to be fulfilled.
5.5 Resolution
5.5.1 Unresolved complaints
The situation remains as it was in 2016. Just under half of complainants identified their
complaint as unresolved or they were not sure if it was resolved at the time of their interview
(42% of domestic and 47% of micro-business complainants).19 Of these unresolved
19 QD2. Would you say your complaint is…? Bases: All domestic (2018: 3,080; 2016: 3,049), All micro-business
(2018: 703; 2016: 468).
Micro-businessDomestic
2016 2018 2016 2018
It was taking too long to get the complaint resolved 39% 31% 68% 34%
Staff I spoke to did not understand my complaint / didn't
understand what the problem was29% 22% 13% 19%
I found it difficult to find the right person to handle my complaint 26% 29% 37% 28%
I just wanted things to move along quicker 19% 20% 17% 26%
Every time I called I had to speak to someone different 12% 9% 12% 10%
Complaint was not logged properly 11% 10% 2% 22%
Staff attitude 10% 7% 5% 5%
I wanted to deal with one person 8% 8% 4% 9%
I hadn't heard anything for a long time 7% 5% 4% 5%
Significantly higher / lower
in 2018 vs. 2016
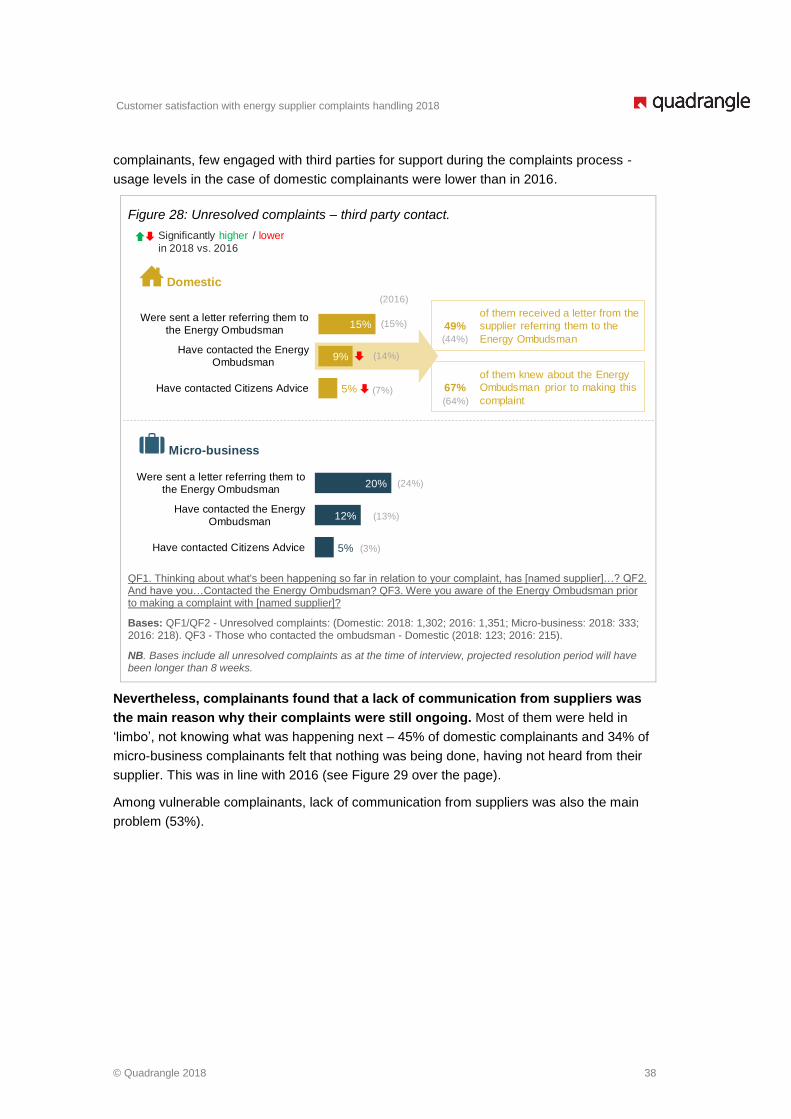
Customer satisfaction with energy supplier complaints handling 2018
© Quadrangle 2018 38
complainants, few engaged with third parties for support during the complaints process -
usage levels in the case of domestic complainants were lower than in 2016.
Figure 28: Unresolved complaints – third party contact.
QF1. Thinking about what's been happening so far in relation to your complaint, has [named supplier]…? QF2. And have you…Contacted the Energy Ombudsman? QF3. Were you aware of the Energy Ombudsman prior to making a complaint with [named supplier]?
Bases: QF1/QF2 - Unresolved complaints: (Domestic: 2018: 1,302; 2016: 1,351; Micro-business: 2018: 333; 2016: 218). QF3 - Those who contacted the ombudsman - Domestic (2018: 123; 2016: 215).
NB. Bases include all unresolved complaints as at the time of interview, projected resolution period will have been longer than 8 weeks.
Nevertheless, complainants found that a lack of communication from suppliers was
the main reason why their complaints were still ongoing. Most of them were held in
‘limbo’, not knowing what was happening next – 45% of domestic complainants and 34% of
micro-business complainants felt that nothing was being done, having not heard from their
supplier. This was in line with 2016 (see Figure 29 over the page).
Among vulnerable complainants, lack of communication from suppliers was also the main
problem (53%).
of them received a letter from the
supplier referring them to the
Energy Ombudsman
of them knew about the Energy
Ombudsman prior to making this
complaint5%
9%
15%
Have contacted Citizens Advice
Have contacted the EnergyOmbudsman
Were sent a letter referring them tothe Energy Ombudsman 49%
67%
5%
12%
20%
Have contacted Citizens Advice
Have contacted the EnergyOmbudsman
Were sent a letter referring them tothe Energy Ombudsman
Domestic
Micro-business
(44%)
(64%)
(2016)
(15%)
(14%)
(7%)
(24%)
(13%)
(3%)
Significantly higher / lower
in 2018 vs. 2016
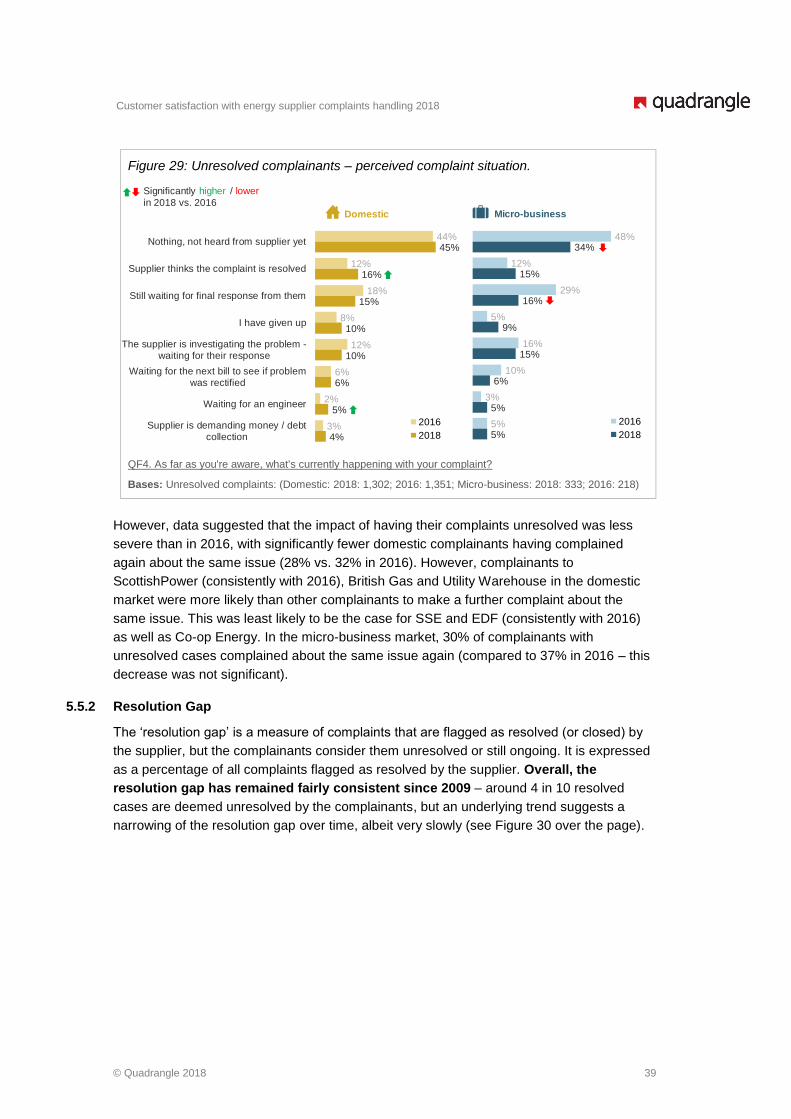
Customer satisfaction with energy supplier complaints handling 2018
© Quadrangle 2018 39
Figure 29: Unresolved complainants – perceived complaint situation.
QF4. As far as you're aware, what's currently happening with your complaint?
Bases: Unresolved complaints: (Domestic: 2018: 1,302; 2016: 1,351; Micro-business: 2018: 333; 2016: 218)
However, data suggested that the impact of having their complaints unresolved was less
severe than in 2016, with significantly fewer domestic complainants having complained
again about the same issue (28% vs. 32% in 2016). However, complainants to
ScottishPower (consistently with 2016), British Gas and Utility Warehouse in the domestic
market were more likely than other complainants to make a further complaint about the
same issue. This was least likely to be the case for SSE and EDF (consistently with 2016)
as well as Co-op Energy. In the micro-business market, 30% of complainants with
unresolved cases complained about the same issue again (compared to 37% in 2016 – this
decrease was not significant).
5.5.2 Resolution Gap
The ‘resolution gap’ is a measure of complaints that are flagged as resolved (or closed) by
the supplier, but the complainants consider them unresolved or still ongoing. It is expressed
as a percentage of all complaints flagged as resolved by the supplier. Overall, the
resolution gap has remained fairly consistent since 2009 – around 4 in 10 resolved
cases are deemed unresolved by the complainants, but an underlying trend suggests a
narrowing of the resolution gap over time, albeit very slowly (see Figure 30 over the page).
Domestic Micro-business
Significantly higher / lower
in 2018 vs. 2016
48%
12%
29%
5%
16%
10%
3%
5%
34%
15%
16%
9%
15%
6%
5%
5%
2016
2018
44%
12%
18%
8%
12%
6%
2%
3%
45%
16%
15%
10%
10%
6%
5%
4%
Nothing, not heard from supplier yet
Supplier thinks the complaint is resolved
Still waiting for final response from them
I have given up
The supplier is investigating the problem -waiting for their response
Waiting for the next bill to see if problemwas rectified
Waiting for an engineer
Supplier is demanding money / debtcollection
2016
2018
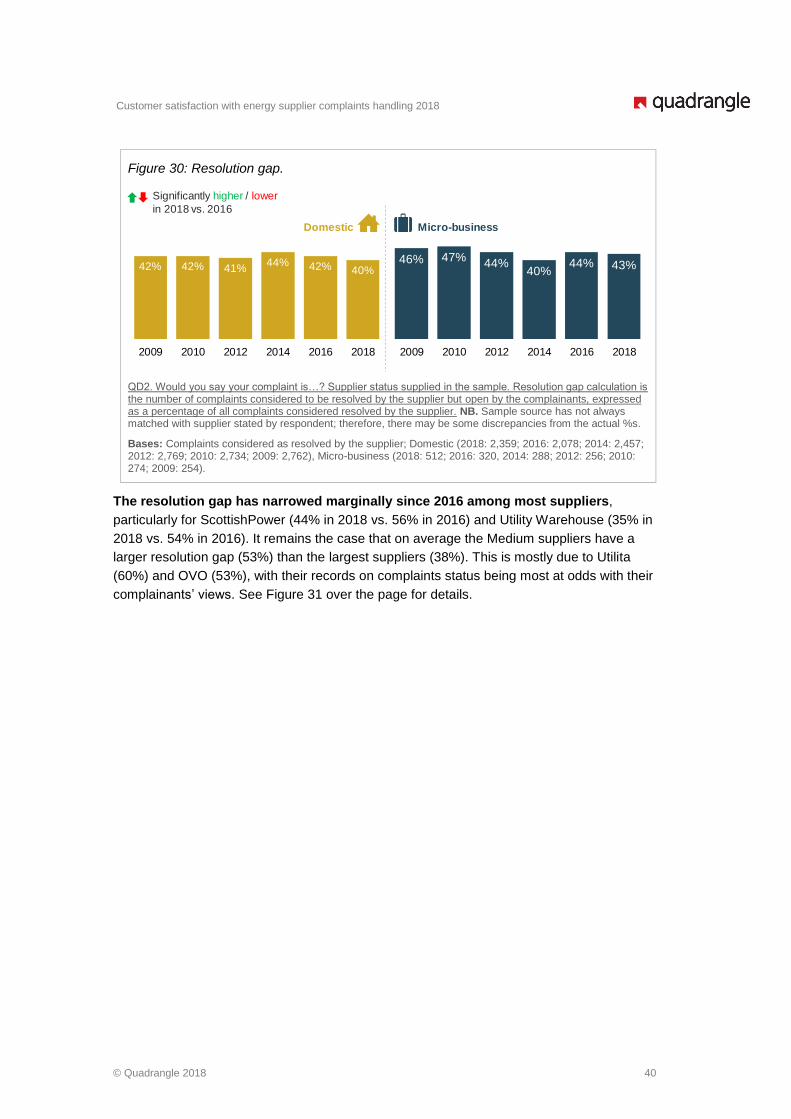
Customer satisfaction with energy supplier complaints handling 2018
© Quadrangle 2018 40
Figure 30: Resolution gap.
QD2. Would you say your complaint is…? Supplier status supplied in the sample. Resolution gap calculation is the number of complaints considered to be resolved by the supplier but open by the complainants, expressed as a percentage of all complaints considered resolved by the supplier. NB. Sample source has not always matched with supplier stated by respondent; therefore, there may be some discrepancies from the actual %s.
Bases: Complaints considered as resolved by the supplier; Domestic (2018: 2,359; 2016: 2,078; 2014: 2,457; 2012: 2,769; 2010: 2,734; 2009: 2,762), Micro-business (2018: 512; 2016: 320, 2014: 288; 2012: 256; 2010: 274; 2009: 254).
The resolution gap has narrowed marginally since 2016 among most suppliers,
particularly for ScottishPower (44% in 2018 vs. 56% in 2016) and Utility Warehouse (35% in
2018 vs. 54% in 2016). It remains the case that on average the Medium suppliers have a
larger resolution gap (53%) than the largest suppliers (38%). This is mostly due to Utilita
(60%) and OVO (53%), with their records on complaints status being most at odds with their
complainants’ views. See Figure 31 over the page for details.
Domestic Micro-business
42% 42% 41%44% 42% 40%
2009 2010 2012 2014 2016 2018
46% 47%44%
40%44% 43%
2009 2010 2012 2014 2016 2018
Significantly higher / lower
in 2018 vs. 2016
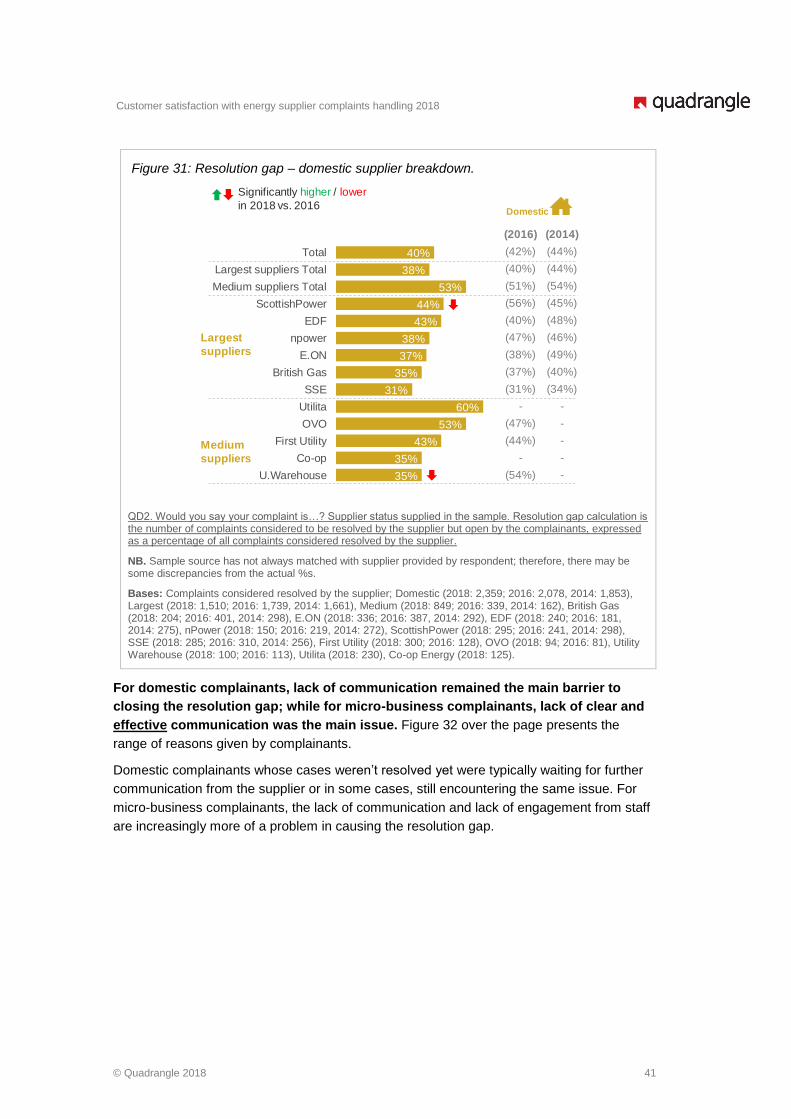
Customer satisfaction with energy supplier complaints handling 2018
© Quadrangle 2018 41
Figure 31: Resolution gap – domestic supplier breakdown.
QD2. Would you say your complaint is…? Supplier status supplied in the sample. Resolution gap calculation is the number of complaints considered to be resolved by the supplier but open by the complainants, expressed as a percentage of all complaints considered resolved by the supplier.
NB. Sample source has not always matched with supplier provided by respondent; therefore, there may be some discrepancies from the actual %s.
Bases: Complaints considered resolved by the supplier; Domestic (2018: 2,359; 2016: 2,078, 2014: 1,853), Largest (2018: 1,510; 2016: 1,739, 2014: 1,661), Medium (2018: 849; 2016: 339, 2014: 162), British Gas (2018: 204; 2016: 401, 2014: 298), E.ON (2018: 336; 2016: 387, 2014: 292), EDF (2018: 240; 2016: 181, 2014: 275), nPower (2018: 150; 2016: 219, 2014: 272), ScottishPower (2018: 295; 2016: 241, 2014: 298), SSE (2018: 285; 2016: 310, 2014: 256), First Utility (2018: 300; 2016: 128), OVO (2018: 94; 2016: 81), Utility Warehouse (2018: 100; 2016: 113), Utilita (2018: 230), Co-op Energy (2018: 125).
For domestic complainants, lack of communication remained the main barrier to
closing the resolution gap; while for micro-business complainants, lack of clear and
effective communication was the main issue. Figure 32 over the page presents the
range of reasons given by complainants.
Domestic complainants whose cases weren’t resolved yet were typically waiting for further
communication from the supplier or in some cases, still encountering the same issue. For
micro-business complainants, the lack of communication and lack of engagement from staff
are increasingly more of a problem in causing the resolution gap.
35%
35%
43%
53%
60%
31%
35%
37%
38%
43%
44%
53%
38%
40%
U.Warehouse
Co-op
First Utility
OVO
Utilita
SSE
British Gas
E.ON
npower
EDF
ScottishPower
Medium suppliers Total
Largest suppliers Total
Total
Medium
suppliers
Largest
suppliers
(2016) (2014)
(42%) (44%)
(40%) (44%)
(51%) (54%)
(56%) (45%)
(40%) (48%)
(47%) (46%)
(38%) (49%)
(37%) (40%)
(31%) (34%)
- -
(47%) -
(44%) -
- -
(54%) -
Domestic
Significantly higher / lower
in 2018 vs. 2016
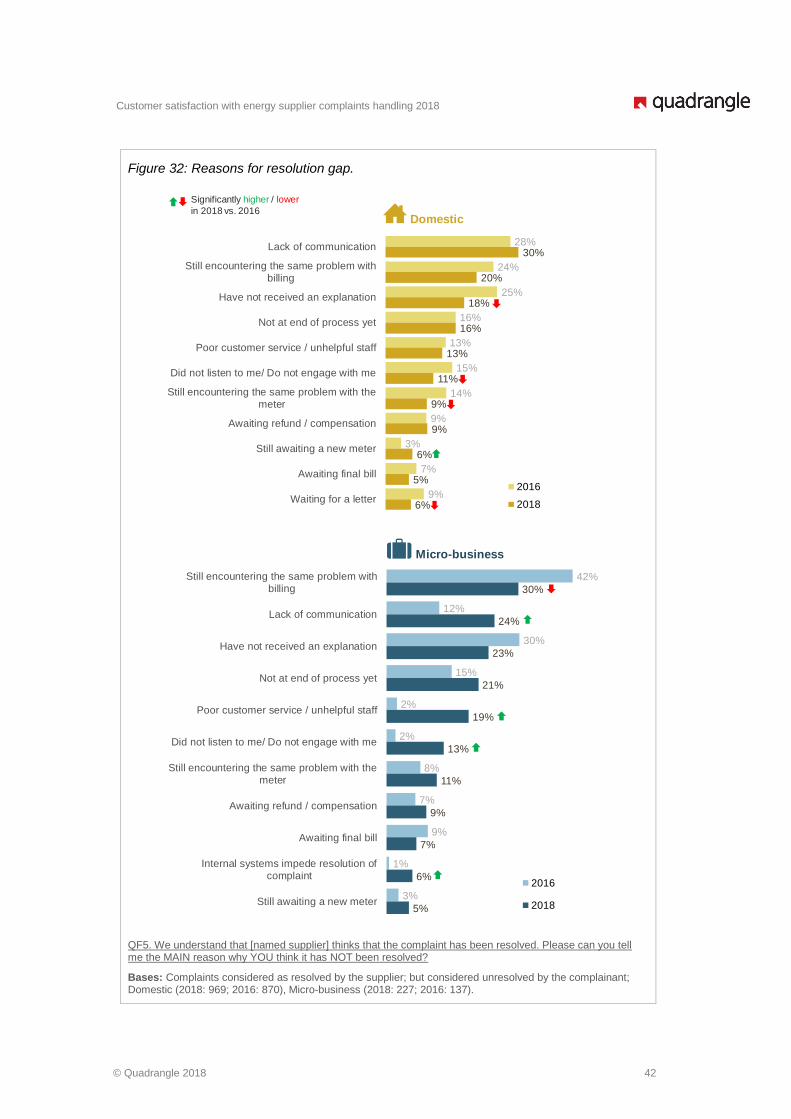
Customer satisfaction with energy supplier complaints handling 2018
© Quadrangle 2018 42
Figure 32: Reasons for resolution gap.
QF5. We understand that [named supplier] thinks that the complaint has been resolved. Please can you tell me the MAIN reason why YOU think it has NOT been resolved?
Bases: Complaints considered as resolved by the supplier; but considered unresolved by the complainant; Domestic (2018: 969; 2016: 870), Micro-business (2018: 227; 2016: 137).
Domestic
Micro-business
28%
24%
25%
16%
13%
15%
14%
9%
3%
7%
9%
30%
20%
18%
16%
13%
11%
9%
9%
6%
5%
6%
Lack of communication
Still encountering the same problem withbilling
Have not received an explanation
Not at end of process yet
Poor customer service / unhelpful staff
Did not listen to me/ Do not engage with me
Still encountering the same problem with themeter
Awaiting refund / compensation
Still awaiting a new meter
Awaiting final bill
Waiting for a letter
2016
2018
Significantly higher / lower
in 2018 vs. 2016
42%
12%
30%
15%
2%
2%
8%
7%
9%
1%
3%
30%
24%
23%
21%
19%
13%
11%
9%
7%
6%
5%
Still encountering the same problem withbilling
Lack of communication
Have not received an explanation
Not at end of process yet
Poor customer service / unhelpful staff
Did not listen to me/ Do not engage with me
Still encountering the same problem with themeter
Awaiting refund / compensation
Awaiting final bill
Internal systems impede resolution ofcomplaint
Still awaiting a new meter
2016
2018
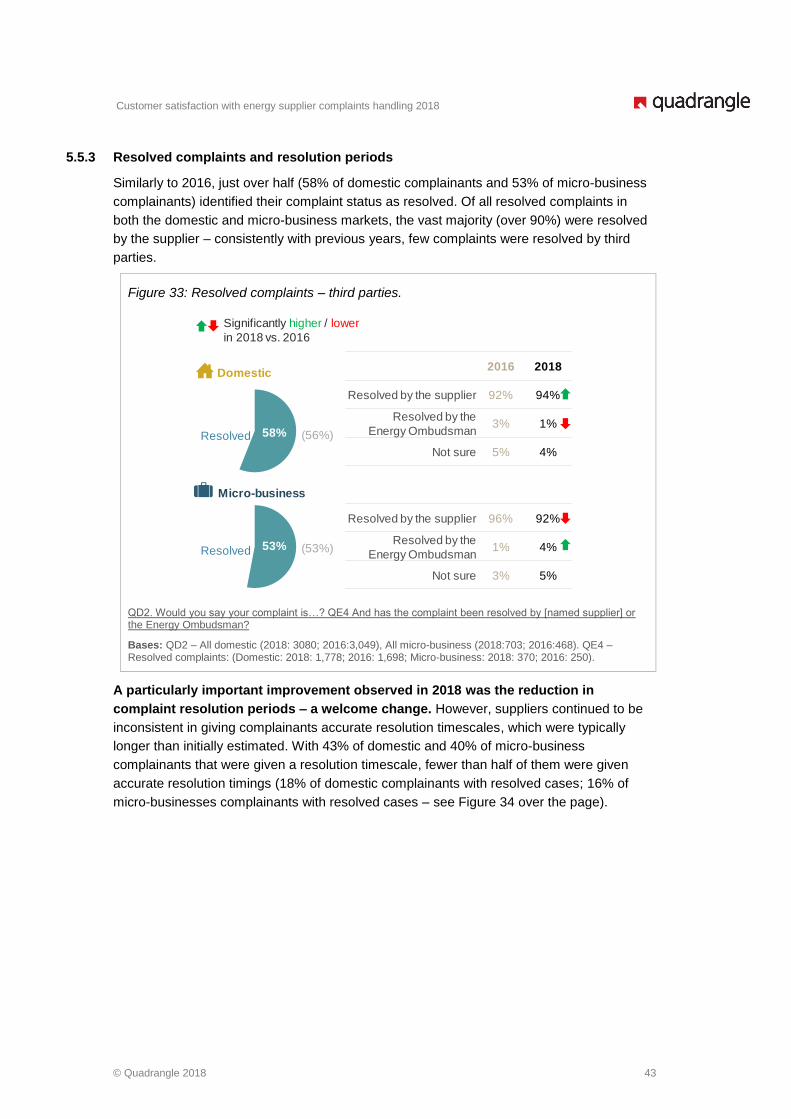
Customer satisfaction with energy supplier complaints handling 2018
© Quadrangle 2018 43
5.5.3 Resolved complaints and resolution periods
Similarly to 2016, just over half (58% of domestic complainants and 53% of micro-business
complainants) identified their complaint status as resolved. Of all resolved complaints in
both the domestic and micro-business markets, the vast majority (over 90%) were resolved
by the supplier – consistently with previous years, few complaints were resolved by third
parties.
Figure 33: Resolved complaints – third parties.
QD2. Would you say your complaint is…? QE4 And has the complaint been resolved by [named supplier] or the Energy Ombudsman?
Bases: QD2 – All domestic (2018: 3080; 2016:3,049), All micro-business (2018:703; 2016:468). QE4 – Resolved complaints: (Domestic: 2018: 1,778; 2016: 1,698; Micro-business: 2018: 370; 2016: 250).
A particularly important improvement observed in 2018 was the reduction in
complaint resolution periods – a welcome change. However, suppliers continued to be
inconsistent in giving complainants accurate resolution timescales, which were typically
longer than initially estimated. With 43% of domestic and 40% of micro-business
complainants that were given a resolution timescale, fewer than half of them were given
accurate resolution timings (18% of domestic complainants with resolved cases; 16% of
micro-businesses complainants with resolved cases – see Figure 34 over the page).
Resolved
53%
2016 2018
Resolved by the supplier 92% 94%
Resolved by the
Energy Ombudsman3% 1%
Not sure 5% 4%
Resolved by the supplier 96% 92%
Resolved by the
Energy Ombudsman1% 4%
Not sure 3% 5%
Domestic
Micro-business
58%
Resolved
(56%)
(53%)
Significantly higher / lower
in 2018 vs. 2016
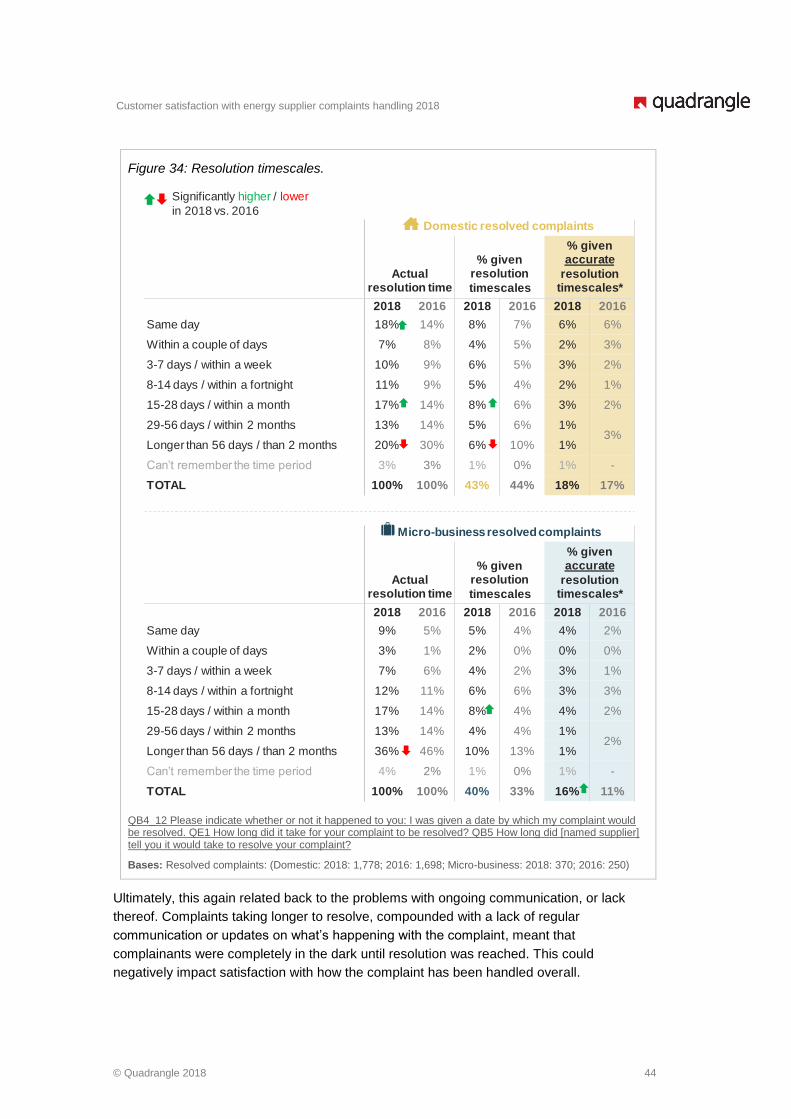
Customer satisfaction with energy supplier complaints handling 2018
© Quadrangle 2018 44
Figure 34: Resolution timescales.
QB4_12 Please indicate whether or not it happened to you: I was given a date by which my complaint would be resolved. QE1 How long did it take for your complaint to be resolved? QB5 How long did [named supplier] tell you it would take to resolve your complaint?
Bases: Resolved complaints: (Domestic: 2018: 1,778; 2016: 1,698; Micro-business: 2018: 370; 2016: 250)
Ultimately, this again related back to the problems with ongoing communication, or lack
thereof. Complaints taking longer to resolve, compounded with a lack of regular
communication or updates on what’s happening with the complaint, meant that
complainants were completely in the dark until resolution was reached. This could
negatively impact satisfaction with how the complaint has been handled overall.
Domestic resolved complaints
Actual resolution time
% given resolution
timescales
% given accurate
resolution timescales*
2018 2016 2018 2016 2018 2016
Same day 18% 14% 8% 7% 6% 6%
Within a couple of days 7% 8% 4% 5% 2% 3%
3-7 days / within a week 10% 9% 6% 5% 3% 2%
8-14 days / within a fortnight 11% 9% 5% 4% 2% 1%
15-28 days / within a month 17% 14% 8% 6% 3% 2%
29-56 days / within 2 months 13% 14% 5% 6% 1%3%
Longer than 56 days / than 2 months 20% 30% 6% 10% 1%
Can’t remember the time period 3% 3% 1% 0% 1% -
TOTAL 100% 100% 43% 44% 18% 17%
Significantly higher / lower
in 2018 vs. 2016
Micro-business resolved complaints
Actual resolution time
% given resolution
timescales
% given accurate
resolution timescales*
2018 2016 2018 2016 2018 2016
Same day 9% 5% 5% 4% 4% 2%
Within a couple of days 3% 1% 2% 0% 0% 0%
3-7 days / within a week 7% 6% 4% 2% 3% 1%
8-14 days / within a fortnight 12% 11% 6% 6% 3% 3%
15-28 days / within a month 17% 14% 8% 4% 4% 2%
29-56 days / within 2 months 13% 14% 4% 4% 1%2%
Longer than 56 days / than 2 months 36% 46% 10% 13% 1%
Can’t remember the time period 4% 2% 1% 0% 1% -
TOTAL 100% 100% 40% 33% 16% 11%
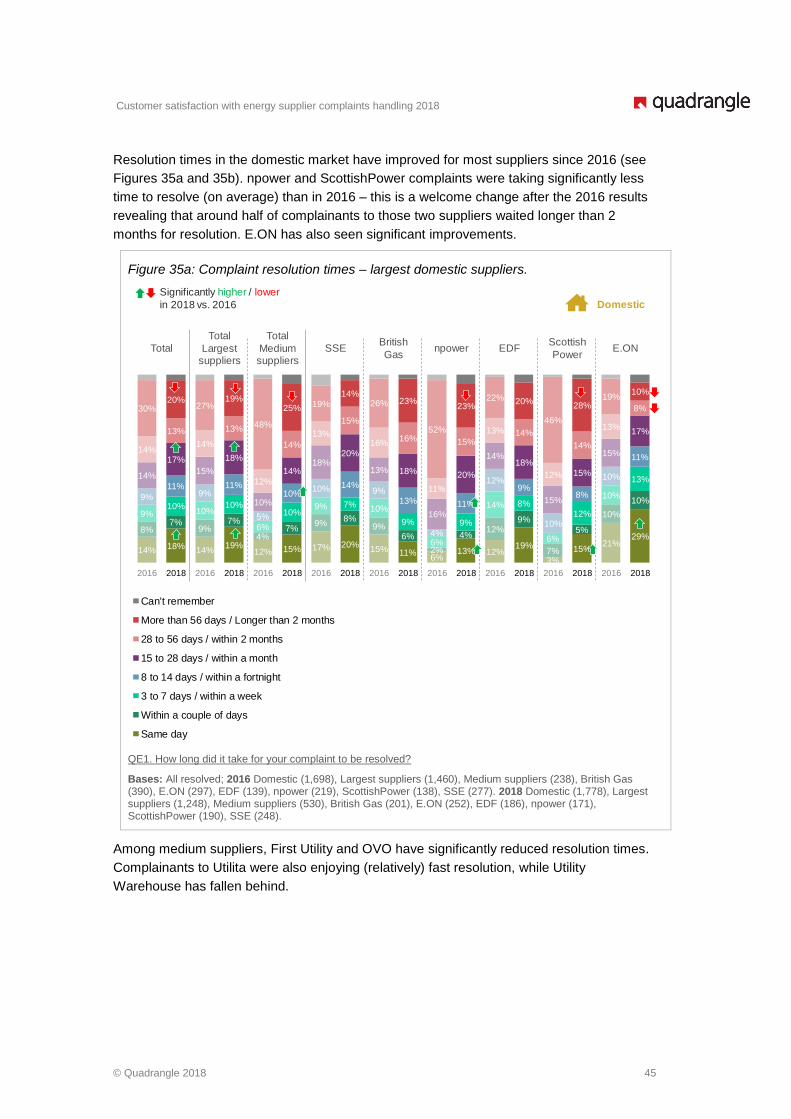
Customer satisfaction with energy supplier complaints handling 2018
© Quadrangle 2018 45
Resolution times in the domestic market have improved for most suppliers since 2016 (see
Figures 35a and 35b). npower and ScottishPower complaints were taking significantly less
time to resolve (on average) than in 2016 – this is a welcome change after the 2016 results
revealing that around half of complainants to those two suppliers waited longer than 2
months for resolution. E.ON has also seen significant improvements.
Figure 35a: Complaint resolution times – largest domestic suppliers.
QE1. How long did it take for your complaint to be resolved?
Bases: All resolved; 2016 Domestic (1,698), Largest suppliers (1,460), Medium suppliers (238), British Gas (390), E.ON (297), EDF (139), npower (219), ScottishPower (138), SSE (277). 2018 Domestic (1,778), Largest suppliers (1,248), Medium suppliers (530), British Gas (201), E.ON (252), EDF (186), npower (171), ScottishPower (190), SSE (248).
Among medium suppliers, First Utility and OVO have significantly reduced resolution times.
Complainants to Utilita were also enjoying (relatively) fast resolution, while Utility
Warehouse has fallen behind.
0%
20%
40%
60%
80%
100%Can't remember
More than 56 days / Longer than 2 months
28 to 56 days / within 2 months
15 to 28 days / within a month
8 to 14 days / within a fortnight
3 to 7 days / within a week
Within a couple of days
Same day
14% 18% 14%19%
12% 15% 17% 20%15% 11%
6%13% 12%
19%
3%
15%21%
29%8%
7%9%
7%
4%7%
9%8%
9%6%
2%
4%12%
9%
7%
5%
10%
10%
9%10%
10%10%
6%
10%9% 7% 10%
9%
6%
9%
14% 8%
6%
12%
10%
13%
9%
11%9%
11%
5%
10%10% 14%
9%13%
4%
11%
12%9%
10%
8%
10%
11%
14%
17%
15%
18%
10%
14%18%
20%
13% 18%
16%
20%
14%18%
15%
15%
15%
17%
14%
13%
14%
13%
12%
14%
13%
15%
16%16%
11%
15%
13% 14%
12%
14%
13%
8%30%20%
27%19%
48%
25% 19%14%
26% 23%
52%
23%22% 20%
46%
28%19%
10%
2016 2018 2016 2018 2016 2018 2016 2018 2016 2018 2016 2018 2016 2018 2016 2018 2016 2018
Total SSEBritish
Gasnpower EDF
Scottish
PowerE.ON
Total
Largest suppliers
Total
Medium suppliers
Significantly higher / lower
in 2018 vs. 2016 Domestic
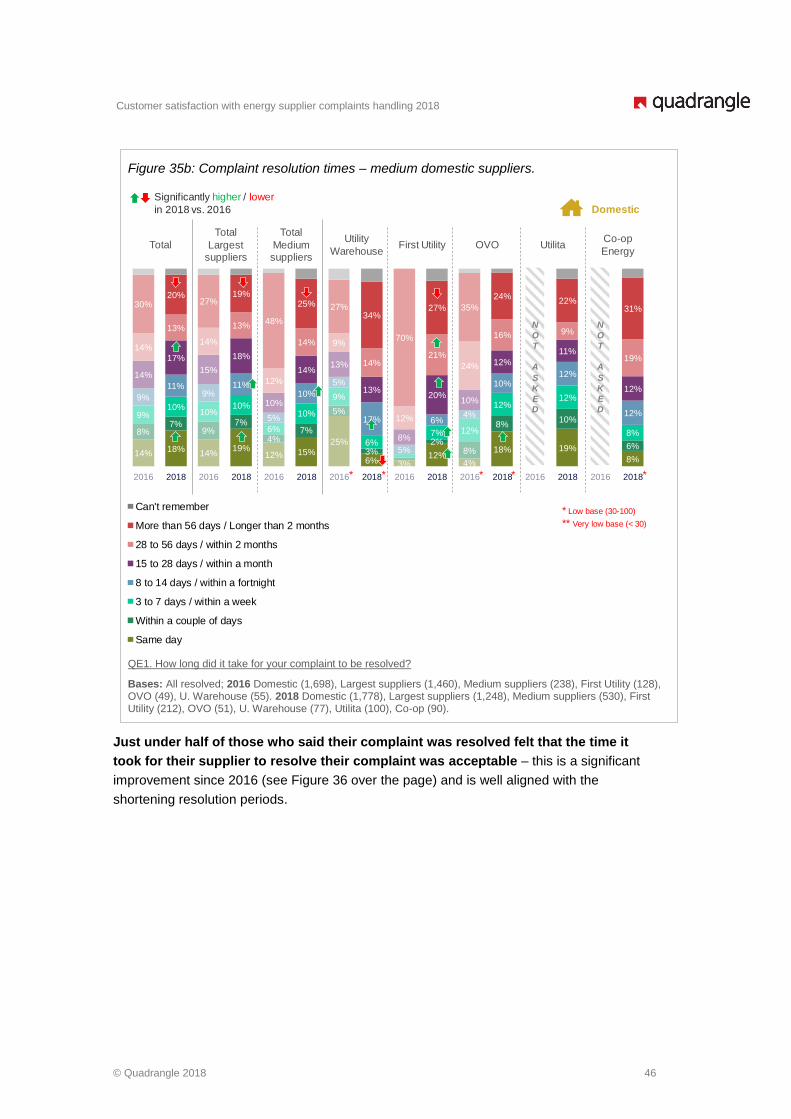
Customer satisfaction with energy supplier complaints handling 2018
© Quadrangle 2018 46
Figure 35b: Complaint resolution times – medium domestic suppliers.
QE1. How long did it take for your complaint to be resolved?
Bases: All resolved; 2016 Domestic (1,698), Largest suppliers (1,460), Medium suppliers (238), First Utility (128), OVO (49), U. Warehouse (55). 2018 Domestic (1,778), Largest suppliers (1,248), Medium suppliers (530), First Utility (212), OVO (51), U. Warehouse (77), Utilita (100), Co-op (90).
Just under half of those who said their complaint was resolved felt that the time it
took for their supplier to resolve their complaint was acceptable – this is a significant
improvement since 2016 (see Figure 36 over the page) and is well aligned with the
shortening resolution periods.
0%
20%
40%
60%
80%
100%Can't remember
More than 56 days / Longer than 2 months
28 to 56 days / within 2 months
15 to 28 days / within a month
8 to 14 days / within a fortnight
3 to 7 days / within a week
Within a couple of days
Same day
Significantly higher / lower
in 2018 vs. 2016 Domestic
14%18%
14%19%
12% 15%25%
6% 3%12%
4%
18% 19%
8%
8%7%
9%7%
4%7%
5%
3%2%
8%
8%10%
6%
9%10%
10%10%
6%
10%
9%
6%7% 12%
12%12%
8%
9%
11%9%
11%
5%
10%
5%
17%
5%
6%4%
10%12%
12%
14%
17%
15%
18%
10%
14%13%
13%
8%
20%10%
12%
11%
12%
14%
13%
14%
13%
12%
14% 9%
14%
12%
21%
24%
16% 9%
19%
30%20%
27%19%
48%
25% 27%34%
70%
27% 35%
24%22%
31%
2016 2018 2016 2018 2016 2018 2016 2018 2016 2018 2016 2018 2016 2018 2016 2018
TotalUtility
WarehouseFirst Utility OVO Utilita
Co-op
Energy
Total
Largest suppliers
Total
Medium suppliers
N
O
T
A
S
K
E
D
N
O
T
A
S
K
E
D
* Low base (30-100)
** Very low base (< 30)
* * ***

Customer satisfaction with energy supplier complaints handling 2018
© Quadrangle 2018 47
Figure 36: Acceptability of complaint resolution time.
QE2 To what extent do you agree or disagree that the time it took to resolve your complaint was acceptable?
Bases: Resolved complaints – Domestic (2018: 1,778; 2016: 1,698); Micro-business (2018: 370; 2016: 250).
Acceptability of the time it took to resolve the complaint was correlated with overall
satisfaction with complaints handling. This reinforced the need to address timescales to
ensure they more closely match customer expectations. For domestic complainants there
was a 6pp20 increase in acceptability (42% in 2016; 48% in 2018). For micro-businesses the
increase was even greater at 8pp (34% in 2016; 42% in 2018). This is a positive step
towards driving overall complaint handling satisfaction upwards by tangibly reducing
resolution times.
5.6 Impact of resolution status on overall satisfaction with handling
Overall satisfaction with complaint handling was significantly lower among those with
unresolved rather than resolved complaints. This is an important result as it shows that
placing focus on ensuring complaints are resolved (to the complainants’ satisfaction) can
increase overall satisfaction with handling. However, as discussed in section 5.2.2
(Confirmation of the process and next steps) it is important not to artificially reduce
resolution times but ensure that the complaint is dealt with fully. Simply confirming resolution
with the complainant before formally flagging it as resolved can positively influence their
perception of the overall experience.
5.7 Closure and meeting expectations
5.7.1 Expectations following complaint resolution
Most complainants expected to receive ‘something’ from their supplier following the
complaint resolution (94% of domestic complainants with resolved cases and 95% of micro-
business complainants). They were increasingly looking to have the issue rectified (85% of
domestic complainants with resolved cases in 2018 vs. 79% in 2016; 86% among micro-
20 Percentage point – denoting the arithmetic difference between two percentage figures.
42% 34%53%
42%
9%10%
5%
8%
5%
4%
7%
7%
17%21%
14%16%
25% 28%19%
26%
2016 2018 2016 2018
Strongly agree
Somewhat agree
Neither / nor
Somewhat disagree
Strongly disagree
Don't know
51
%
58
%3
4%
42
%
Domestic Micro-business
45
%
50
%4
2%
48
%
Significantly higher / lower
in 2018 vs. 2016
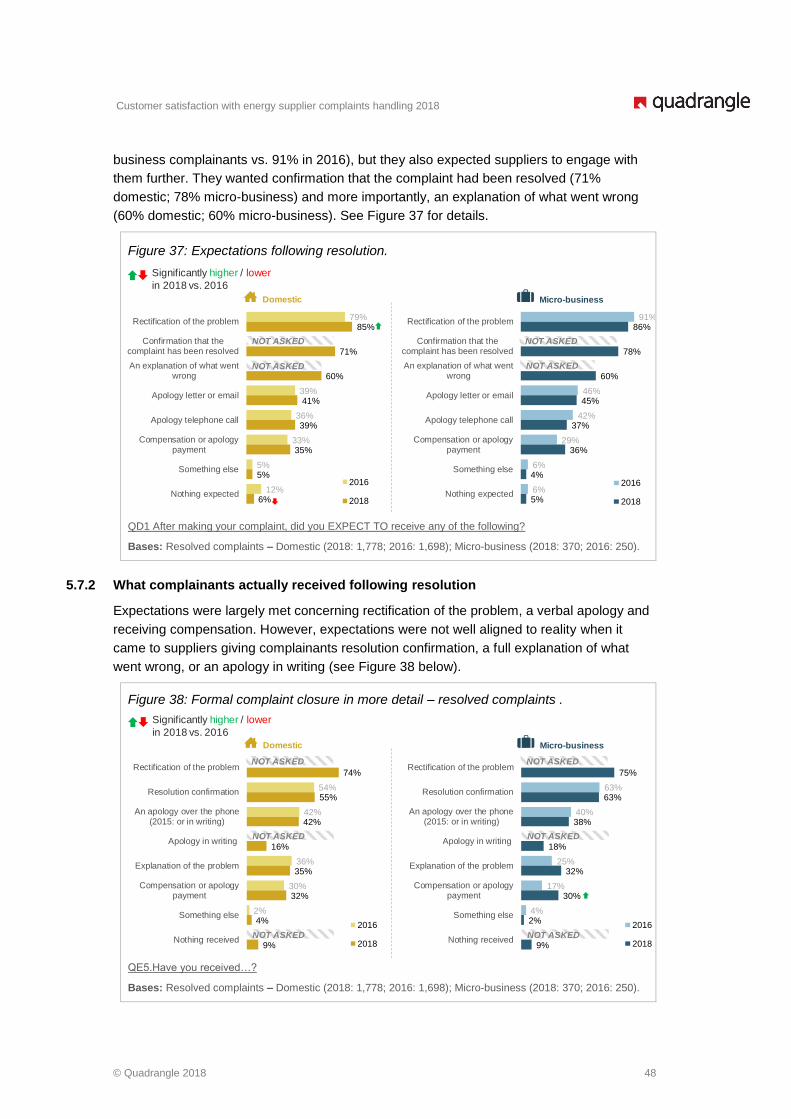
Customer satisfaction with energy supplier complaints handling 2018
© Quadrangle 2018 48
business complainants vs. 91% in 2016), but they also expected suppliers to engage with
them further. They wanted confirmation that the complaint had been resolved (71%
domestic; 78% micro-business) and more importantly, an explanation of what went wrong
(60% domestic; 60% micro-business). See Figure 37 for details.
Figure 37: Expectations following resolution.
QD1 After making your complaint, did you EXPECT TO receive any of the following?
Bases: Resolved complaints – Domestic (2018: 1,778; 2016: 1,698); Micro-business (2018: 370; 2016: 250).
5.7.2 What complainants actually received following resolution
Expectations were largely met concerning rectification of the problem, a verbal apology and
receiving compensation. However, expectations were not well aligned to reality when it
came to suppliers giving complainants resolution confirmation, a full explanation of what
went wrong, or an apology in writing (see Figure 38 below).
Figure 38: Formal complaint closure in more detail – resolved complaints .
QE5.Have you received…?
Bases: Resolved complaints – Domestic (2018: 1,778; 2016: 1,698); Micro-business (2018: 370; 2016: 250).
54%
42%
36%
30%
2%
74%
55%
42%
16%
35%
32%
4%
9%
Rectification of the problem
Resolution confirmation
An apology over the phone(2015: or in writing)
Apology in writing
Explanation of the problem
Compensation or apologypayment
Something else
Nothing received
2016
2018
63%
40%
25%
17%
4%
75%
63%
38%
18%
32%
30%
2%
9%
Rectification of the problem
Resolution confirmation
An apology over the phone(2015: or in writing)
Apology in writing
Explanation of the problem
Compensation or apologypayment
Something else
Nothing received
2016
2018
Domestic Micro-business
NOT ASKED
NOT ASKED
NOT ASKED
NOT ASKED
NOT ASKED NOT ASKED
Significantly higher / lower
in 2018 vs. 2016
79%
39%
36%
33%
5%
12%
85%
71%
60%
41%
39%
35%
5%
6%
Rectification of the problem
Confirmation that thecomplaint has been resolved
An explanation of what wentwrong
Apology letter or email
Apology telephone call
Compensation or apologypayment
Something else
Nothing expected
2016
2018
91%
46%
42%
29%
6%
6%
86%
78%
60%
45%
37%
36%
4%
5%
Rectification of the problem
Confirmation that thecomplaint has been resolved
An explanation of what wentwrong
Apology letter or email
Apology telephone call
Compensation or apologypayment
Something else
Nothing expected
2016
2018
Domestic Micro-business
NOT ASKED
NOT ASKED
NOT ASKED
NOT ASKED
Significantly higher / lower
in 2018 vs. 2016
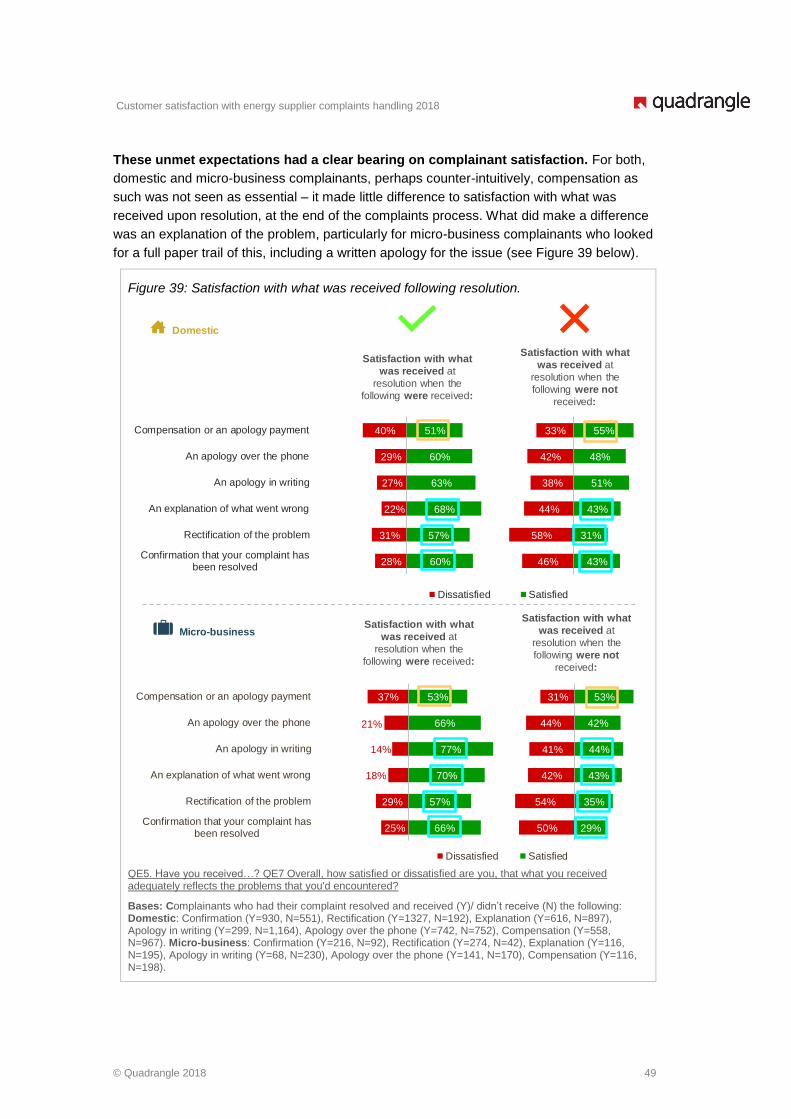
Customer satisfaction with energy supplier complaints handling 2018
© Quadrangle 2018 49
These unmet expectations had a clear bearing on complainant satisfaction. For both,
domestic and micro-business complainants, perhaps counter-intuitively, compensation as
such was not seen as essential – it made little difference to satisfaction with what was
received upon resolution, at the end of the complaints process. What did make a difference
was an explanation of the problem, particularly for micro-business complainants who looked
for a full paper trail of this, including a written apology for the issue (see Figure 39 below).
Figure 39: Satisfaction with what was received following resolution.
QE5. Have you received…? QE7 Overall, how satisfied or dissatisfied are you, that what you received adequately reflects the problems that you'd encountered?
Bases: Complainants who had their complaint resolved and received (Y)/ didn’t receive (N) the following: Domestic: Confirmation (Y=930, N=551), Rectification (Y=1327, N=192), Explanation (Y=616, N=897), Apology in writing (Y=299, N=1,164), Apology over the phone (Y=742, N=752), Compensation (Y=558, N=967). Micro-business: Confirmation (Y=216, N=92), Rectification (Y=274, N=42), Explanation (Y=116, N=195), Apology in writing (Y=68, N=230), Apology over the phone (Y=141, N=170), Compensation (Y=116, N=198).
46%
58%
44%
38%
42%
33%
43%
31%
43%
51%
48%
55%
Confirmation that your complaint hasbeen resolved
Rectification of the problem
An explanation of what went wrong
An apology in writing
An apology over the phone
Compensation or an apology payment
28%
31%
22%
27%
29%
40%
60%
57%
68%
63%
60%
51%
Confirmation that your complaint hasbeen resolved
Rectification of the problem
An explanation of what went wrong
An apology in writing
An apology over the phone
Compensation or an apology payment
Satisfaction with what
was received at
resolution when the
following were received:
Satisfaction with what
was received at
resolution when the
following were not
received:
Dissatisfied Satisfied
Domestic
50%
54%
42%
41%
44%
31%
29%
35%
43%
44%
42%
53%
Confirmation that your complaint hasbeen resolved
Rectification of the problem
An explanation of what went wrong
An apology in writing
An apology over the phone
Compensation or an apology payment
25%
29%
18%
14%
21%
37%
66%
57%
70%
77%
66%
53%
Confirmation that your complaint hasbeen resolved
Rectification of the problem
An explanation of what went wrong
An apology in writing
An apology over the phone
Compensation or an apology payment
Satisfaction with what
was received at
resolution when the
following were received:
Satisfaction with what
was received at
resolution when the
following were not
received:
Dissatisfied Satisfied
Micro-business
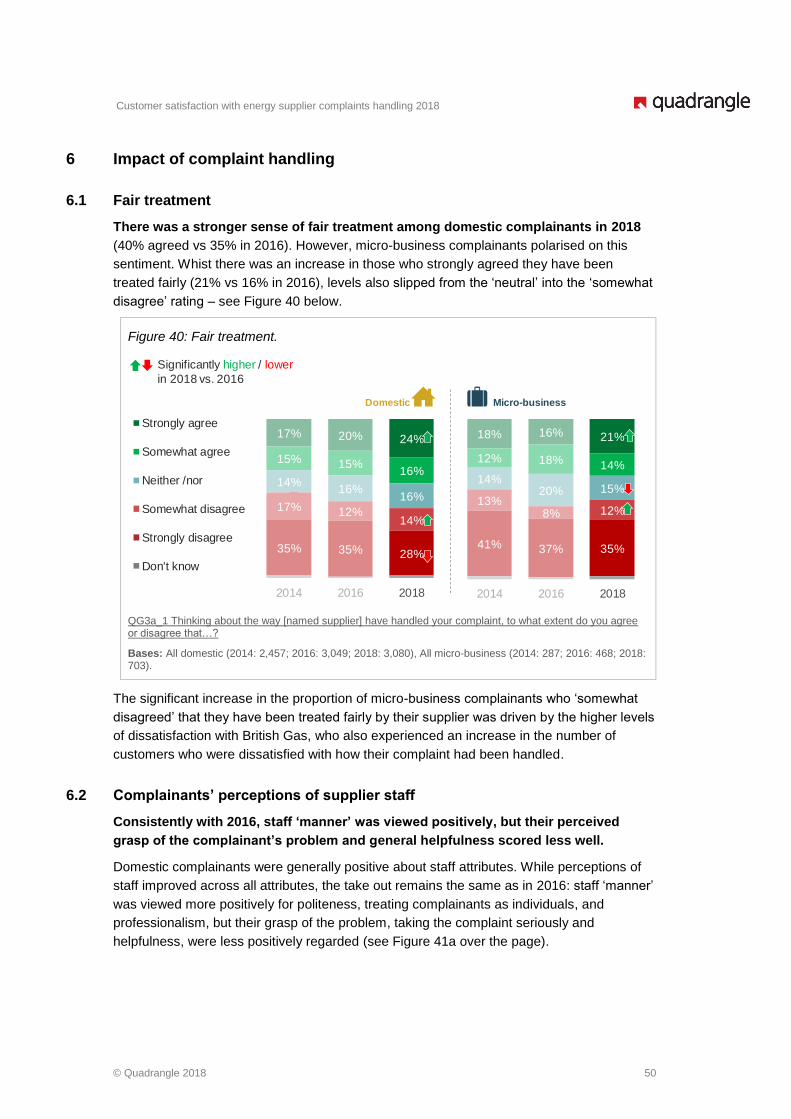
Customer satisfaction with energy supplier complaints handling 2018
© Quadrangle 2018 50
6 Impact of complaint handling
6.1 Fair treatment
There was a stronger sense of fair treatment among domestic complainants in 2018
(40% agreed vs 35% in 2016). However, micro-business complainants polarised on this
sentiment. Whist there was an increase in those who strongly agreed they have been
treated fairly (21% vs 16% in 2016), levels also slipped from the ‘neutral’ into the ‘somewhat
disagree’ rating – see Figure 40 below.
Figure 40: Fair treatment.
QG3a_1 Thinking about the way [named supplier] have handled your complaint, to what extent do you agree or disagree that…?
Bases: All domestic (2014: 2,457; 2016: 3,049; 2018: 3,080), All micro-business (2014: 287; 2016: 468; 2018: 703).
The significant increase in the proportion of micro-business complainants who ‘somewhat
disagreed’ that they have been treated fairly by their supplier was driven by the higher levels
of dissatisfaction with British Gas, who also experienced an increase in the number of
customers who were dissatisfied with how their complaint had been handled.
6.2 Complainants’ perceptions of supplier staff
Consistently with 2016, staff ‘manner’ was viewed positively, but their perceived
grasp of the complainant’s problem and general helpfulness scored less well.
Domestic complainants were generally positive about staff attributes. While perceptions of
staff improved across all attributes, the take out remains the same as in 2016: staff ‘manner’
was viewed more positively for politeness, treating complainants as individuals, and
professionalism, but their grasp of the problem, taking the complaint seriously and
helpfulness, were less positively regarded (see Figure 41a over the page).
Significantly higher / lower
in 2018 vs. 2016
17% 20% 24%
15% 15%16%
14%16%
16%17% 12%
14%
35% 35% 28%
2014 2016 2018
18% 16% 21%
12% 18% 14%
14%20% 15%
13%8% 12%
41% 37% 35%
2014 2016 2018
Domestic Micro-business
Strongly agree
Somewhat agree
Neither /nor
Somewhat disagree
Strongly disagree
Don't know
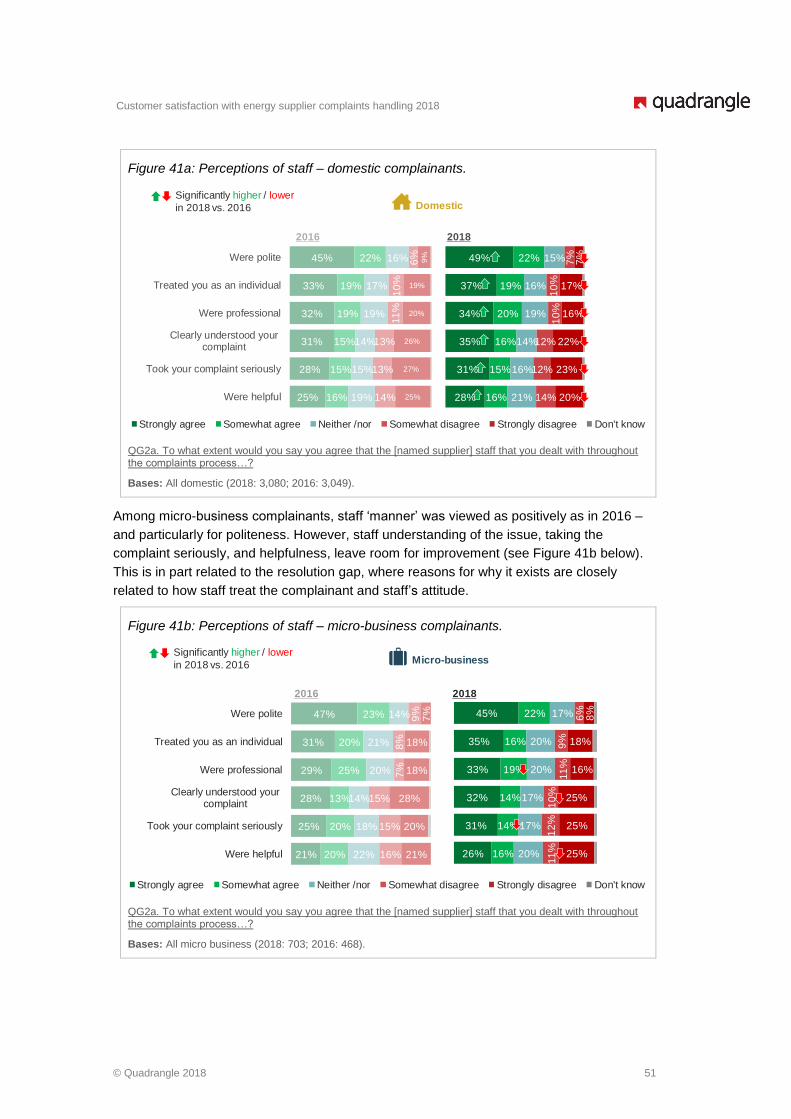
Customer satisfaction with energy supplier complaints handling 2018
© Quadrangle 2018 51
Figure 41a: Perceptions of staff – domestic complainants.
QG2a. To what extent would you say you agree that the [named supplier] staff that you dealt with throughout the complaints process…?
Bases: All domestic (2018: 3,080; 2016: 3,049).
Among micro-business complainants, staff ‘manner’ was viewed as positively as in 2016 –
and particularly for politeness. However, staff understanding of the issue, taking the
complaint seriously, and helpfulness, leave room for improvement (see Figure 41b below).
This is in part related to the resolution gap, where reasons for why it exists are closely
related to how staff treat the complainant and staff’s attitude.
Figure 41b: Perceptions of staff – micro-business complainants.
QG2a. To what extent would you say you agree that the [named supplier] staff that you dealt with throughout the complaints process…?
Bases: All micro business (2018: 703; 2016: 468).
49%
37%
34%
35%
31%
28%
22%
19%
20%
16%
15%
16%
15%
16%
19%
14%
16%
21%
7%
10
%1
0%
12%
12%
14%
7%
17%
16%
22%
23%
20%
Were polite
Treated you as an individual
Were professional
Clearly understood your complaint
Took your complaint seriously
Were helpful
45%
33%
32%
31%
28%
25%
22%
19%
19%
15%
15%
16%
16%
17%
19%
14%
15%
19%
6%
10
%11
%
13%
13%
14%
9%
19%
20%
26%
27%
25%
Were polite
Treated you as an individual
Were professional
Clearly understood yourcomplaint
Took your complaint seriously
Were helpful
Domestic
2016 2018
Strongly agree Somewhat agree Neither /nor Somewhat disagree Strongly disagree Don't know
Significantly higher / lower
in 2018 vs. 2016
45%
35%
33%
32%
31%
26%
22%
16%
19%
14%
14%
16%
17%
20%
20%
17%
17%
20%
6%
9%
11
%1
0%
12
%11
%
8%
18%
16%
25%
25%
25%
47%
31%
29%
28%
25%
21%
23%
20%
25%
13%
20%
20%
14%
21%
20%
14%
18%
22%
9%
8%
7%
15%
15%
16%
7%
18%
18%
28%
20%
21%
Were polite
Treated you as an individual
Were professional
Clearly understood yourcomplaint
Took your complaint seriously
Were helpful
Micro-business
2016 2018
Strongly agree Somewhat agree Neither /nor Somewhat disagree Strongly disagree Don't know
Significantly higher / lower
in 2018 vs. 2016
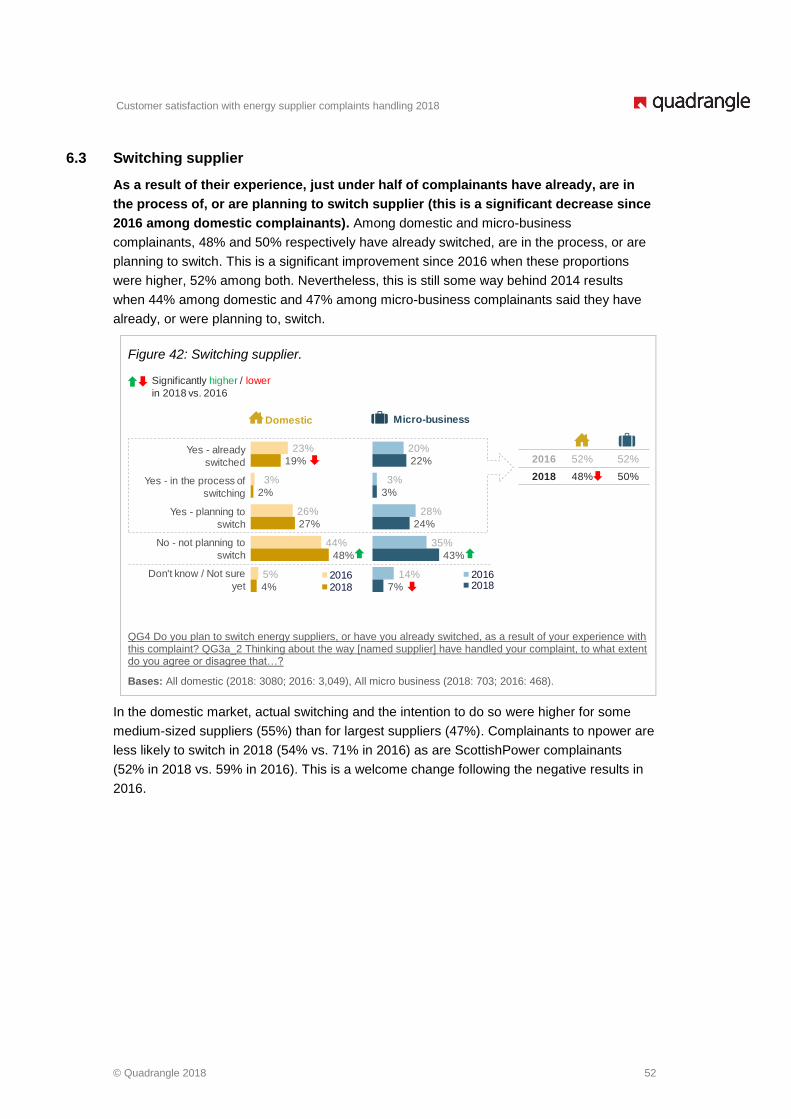
Customer satisfaction with energy supplier complaints handling 2018
© Quadrangle 2018 52
6.3 Switching supplier
As a result of their experience, just under half of complainants have already, are in
the process of, or are planning to switch supplier (this is a significant decrease since
2016 among domestic complainants). Among domestic and micro-business
complainants, 48% and 50% respectively have already switched, are in the process, or are
planning to switch. This is a significant improvement since 2016 when these proportions
were higher, 52% among both. Nevertheless, this is still some way behind 2014 results
when 44% among domestic and 47% among micro-business complainants said they have
already, or were planning to, switch.
Figure 42: Switching supplier.
QG4 Do you plan to switch energy suppliers, or have you already switched, as a result of your experience with this complaint? QG3a_2 Thinking about the way [named supplier] have handled your complaint, to what extent do you agree or disagree that…?
Bases: All domestic (2018: 3080; 2016: 3,049), All micro business (2018: 703; 2016: 468).
In the domestic market, actual switching and the intention to do so were higher for some
medium-sized suppliers (55%) than for largest suppliers (47%). Complainants to npower are
less likely to switch in 2018 (54% vs. 71% in 2016) as are ScottishPower complainants
(52% in 2018 vs. 59% in 2016). This is a welcome change following the negative results in
2016.
Yes - already
switched
Yes - in the process of
switching
Yes - planning to
switch
No - not planning to
switch
Don't know / Not sure
yet
23%
3%
26%
44%
5%
19%
2%
27%
48%
4%20162018
Domestic Micro-business
20%
3%
28%
35%
14%
22%
3%
24%
43%
7%
20162018
D M
2016 52% 52%
2018 48% 50%
Significantly higher / lower
in 2018 vs. 2016
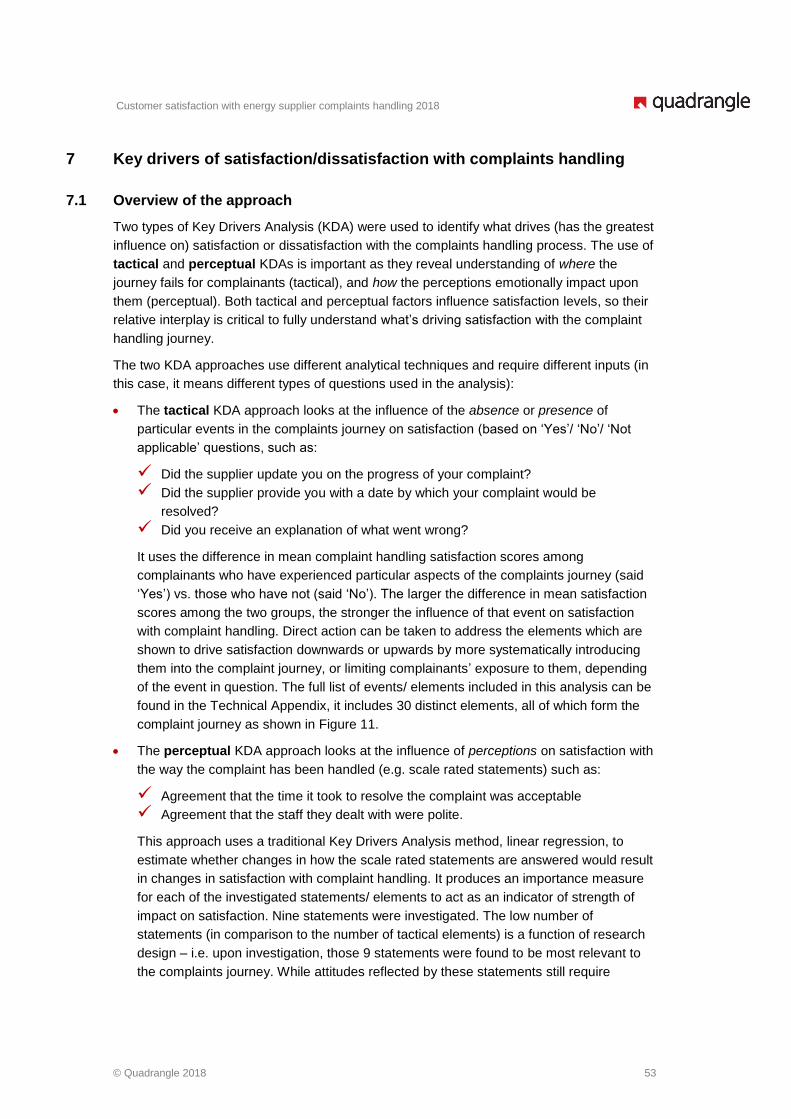
Customer satisfaction with energy supplier complaints handling 2018
© Quadrangle 2018 53
7 Key drivers of satisfaction/dissatisfaction with complaints handling
7.1 Overview of the approach
Two types of Key Drivers Analysis (KDA) were used to identify what drives (has the greatest
influence on) satisfaction or dissatisfaction with the complaints handling process. The use of
tactical and perceptual KDAs is important as they reveal understanding of where the
journey fails for complainants (tactical), and how the perceptions emotionally impact upon
them (perceptual). Both tactical and perceptual factors influence satisfaction levels, so their
relative interplay is critical to fully understand what’s driving satisfaction with the complaint
handling journey.
The two KDA approaches use different analytical techniques and require different inputs (in
this case, it means different types of questions used in the analysis):
• The tactical KDA approach looks at the influence of the absence or presence of
particular events in the complaints journey on satisfaction (based on ‘Yes’/ ‘No’/ ‘Not
applicable’ questions, such as:
✓ Did the supplier update you on the progress of your complaint?
✓ Did the supplier provide you with a date by which your complaint would be
resolved?
✓ Did you receive an explanation of what went wrong?
It uses the difference in mean complaint handling satisfaction scores among
complainants who have experienced particular aspects of the complaints journey (said
‘Yes’) vs. those who have not (said ‘No’). The larger the difference in mean satisfaction
scores among the two groups, the stronger the influence of that event on satisfaction
with complaint handling. Direct action can be taken to address the elements which are
shown to drive satisfaction downwards or upwards by more systematically introducing
them into the complaint journey, or limiting complainants’ exposure to them, depending
of the event in question. The full list of events/ elements included in this analysis can be
found in the Technical Appendix, it includes 30 distinct elements, all of which form the
complaint journey as shown in Figure 11.
• The perceptual KDA approach looks at the influence of perceptions on satisfaction with
the way the complaint has been handled (e.g. scale rated statements) such as:
✓ Agreement that the time it took to resolve the complaint was acceptable
✓ Agreement that the staff they dealt with were polite.
This approach uses a traditional Key Drivers Analysis method, linear regression, to
estimate whether changes in how the scale rated statements are answered would result
in changes in satisfaction with complaint handling. It produces an importance measure
for each of the investigated statements/ elements to act as an indicator of strength of
impact on satisfaction. Nine statements were investigated. The low number of
statements (in comparison to the number of tactical elements) is a function of research
design – i.e. upon investigation, those 9 statements were found to be most relevant to
the complaints journey. While attitudes reflected by these statements still require
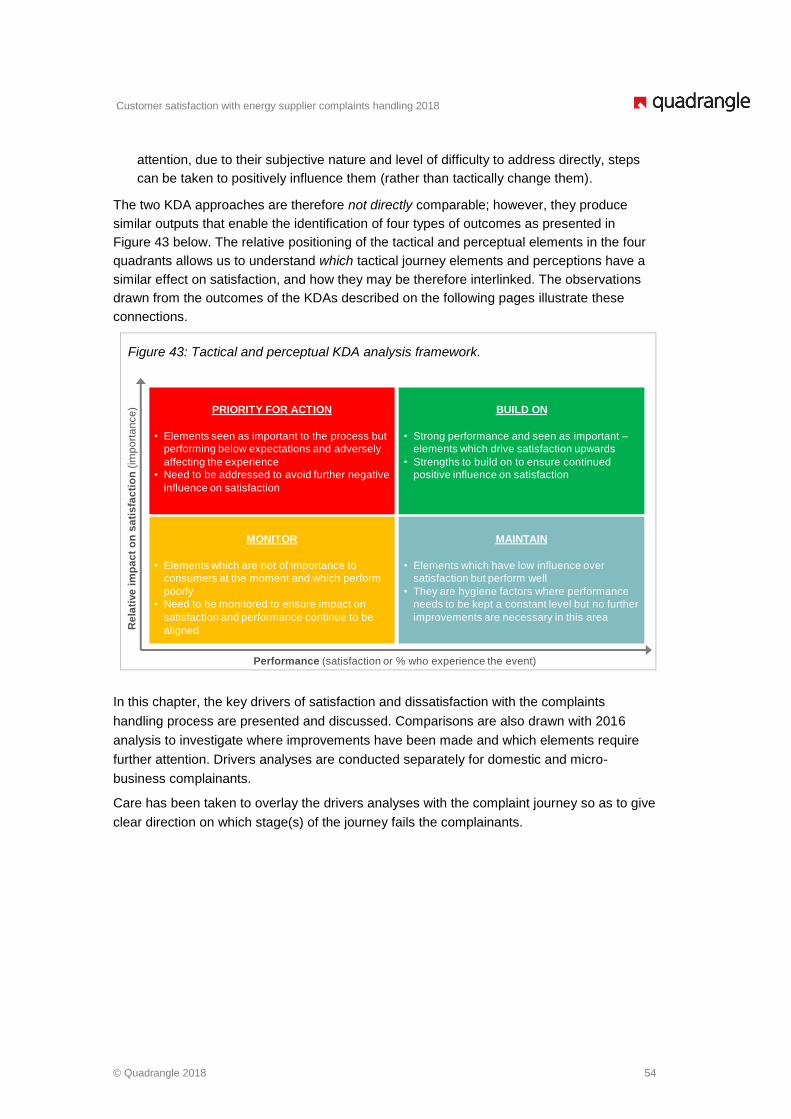
Customer satisfaction with energy supplier complaints handling 2018
© Quadrangle 2018 54
attention, due to their subjective nature and level of difficulty to address directly, steps
can be taken to positively influence them (rather than tactically change them).
The two KDA approaches are therefore not directly comparable; however, they produce
similar outputs that enable the identification of four types of outcomes as presented in
Figure 43 below. The relative positioning of the tactical and perceptual elements in the four
quadrants allows us to understand which tactical journey elements and perceptions have a
similar effect on satisfaction, and how they may be therefore interlinked. The observations
drawn from the outcomes of the KDAs described on the following pages illustrate these
connections.
Figure 43: Tactical and perceptual KDA analysis framework.
In this chapter, the key drivers of satisfaction and dissatisfaction with the complaints
handling process are presented and discussed. Comparisons are also drawn with 2016
analysis to investigate where improvements have been made and which elements require
further attention. Drivers analyses are conducted separately for domestic and micro-
business complainants.
Care has been taken to overlay the drivers analyses with the complaint journey so as to give
clear direction on which stage(s) of the journey fails the complainants.
PRIORITY FOR ACTION
• Elements seen as important to the process but
performing below expectations and adversely
affecting the experience
• Need to be addressed to avoid further negative
influence on satisfaction
BUILD ON
• Strong performance and seen as important –
elements which drive satisfaction upwards
• Strengths to build on to ensure continued
positive influence on satisfaction
MONITOR
• Elements which are not of importance to
consumers at the moment and which perform
poorly
• Need to be monitored to ensure impact on
satisfaction and performance continue to be
aligned
MAINTAIN
• Elements which have low influence over
satisfaction but perform well
• They are hygiene factors where performance
needs to be kept a constant level but no further
improvements are necessary in this area
Performance (satisfaction or % who experience the event)
Re
lati
ve
im
pa
ct
on
sa
tis
fac
tio
n (
imp
ort
an
ce
)
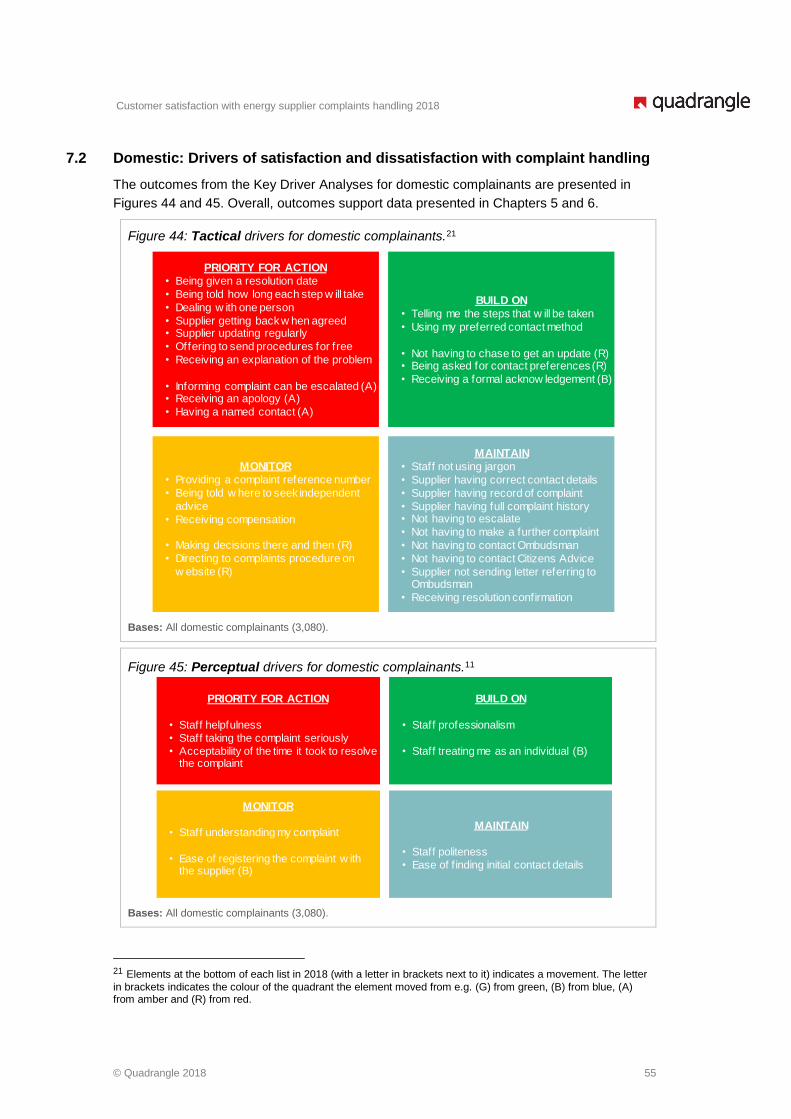
Customer satisfaction with energy supplier complaints handling 2018
© Quadrangle 2018 55
7.2 Domestic: Drivers of satisfaction and dissatisfaction with complaint handling
The outcomes from the Key Driver Analyses for domestic complainants are presented in
Figures 44 and 45. Overall, outcomes support data presented in Chapters 5 and 6.
Figure 44: Tactical drivers for domestic complainants.21
Bases: All domestic complainants (3,080).
Figure 45: Perceptual drivers for domestic complainants.11
Bases: All domestic complainants (3,080).
21 Elements at the bottom of each list in 2018 (with a letter in brackets next to it) indicates a movement. The letter
in brackets indicates the colour of the quadrant the element moved from e.g. (G) from green, (B) from blue, (A) from amber and (R) from red.
MONITOR
• Providing a complaint reference number
• Being told w here to seek independent
advice
• Receiving compensation
• Making decisions there and then (R)
• Directing to complaints procedure on
w ebsite (R)
BUILD ON
• Telling me the steps that w ill be taken
• Using my preferred contact method
• Not having to chase to get an update (R)• Being asked for contact preferences (R)
• Receiving a formal acknow ledgement (B)
PRIORITY FOR ACTION
• Being given a resolution date
• Being told how long each step w ill take
• Dealing w ith one person
• Supplier getting back w hen agreed• Supplier updating regularly
• Offering to send procedures for free
• Receiving an explanation of the problem
• Informing complaint can be escalated (A)• Receiving an apology (A)
• Having a named contact (A)
MAINTAIN
• Staff not using jargon
• Supplier having correct contact details
• Supplier having record of complaint
• Supplier having full complaint history• Not having to escalate
• Not having to make a further complaint
• Not having to contact Ombudsman
• Not having to contact Citizens Advice
• Supplier not sending letter referring to Ombudsman
• Receiving resolution confirmation
MONITOR
• Staff understanding my complaint
• Ease of registering the complaint w ith the supplier (B)
BUILD ON
• Staff professionalism
• Staff treating me as an individual (B)
PRIORITY FOR ACTION
• Staff helpfulness
• Staff taking the complaint seriously
• Acceptability of the time it took to resolve the complaint
MAINTAIN
• Staff politeness
• Ease of f inding initial contact details

Customer satisfaction with energy supplier complaints handling 2018
© Quadrangle 2018 56
7.2.1 Domestic: Drivers of satisfaction – summary observations
The drivers of satisfaction are broadly consistent with 2016, focusing primarily on the
experiences early on in the process. Being able to easily find the right contact details, being
greeted by polite and professional staff who told them what steps would be taken to get the
complaint resolved (experienced consistently by just over half of domestic complainants) in
a clear and understandable language, set the right tone for the rest of the process for most
complainants. It is the smoothness of the early interactions that helped uplift overall
satisfaction with how the complaint has been handled.
Formal complaint acknowledgement by the supplier helps complainants understand where
they are in the journey and that their case is being looked at. Lack thereof can signal to the
complainant a lack of acceptance that the issue exists and automatically set a negative tone
for the rest of the journey, setting other negative elements in motion, e.g. chasing for an
update/ confirmation, thus its presence is a soothing step forward. The same applies to
receiving a confirmation of the resolution. While seemingly simple, formally agreeing with
the complainant that the complaint has been resolved serves as a form of closure and an
acknowledgement that the issue existed and that it has been fixed to the complainants’
satisfaction. Without that, both, the issue being fixed, and to the complainants’ satisfaction,
can be questioned by the complainant.
Similarly, acknowledging complainants’ preferences for contact and adhering to them when
re-contacting them demonstrate the appreciation of the individual and the willingness to
make their experience more agreeable. It is a fairly simple element of the process but can
go a long way as it shows that the supplier is putting some effort in to satisfy the customer.
Reducing effort the complainant has to make also contributes to increasing overall
satisfaction with complaint handling. This partly relates to not having to escalate the
complaint further (e.g. to a more senior member of staff or externally – some of which can
be avoided by providing the complainant with a resolution confirmation). Reduction of effort
also means providing the complainants with enough information about what is happening
with their complaint to reduce their need to chase for updates, and this appears to have
been the case, to an extent, in 2018.
Other factors, such as the supplier having the correct information about the complainant and
the complaint itself upon recontact are hygiene factors – they appear unimportant when
present, but their absence could gradually drive satisfaction down.
7.2.2 Domestic: Drivers of dissatisfaction – summary observations
There are many more drivers of dissatisfaction than there are drivers of satisfaction, owing
to more complainants being quite or very dissatisfied with the handling process despite the
significant uplift in overall satisfaction.
The main themes contributing to high levels of dissatisfaction with complaint handling
concentrated around resolution periods and being informed of the resolution progress on an
ongoing basis. Complainants felt that the time it took to resolve their complaint was
unacceptably long (though less so than in 2016), despite a reduction in overall resolution
periods, which was exacerbated by the aforementioned lack of ongoing (unprompted)
communication from the supplier.
Customer satisfaction with energy supplier complaints handling 2018
© Quadrangle 2018 57
A problem still exists with providing complainants with a clear view of how long the process
will take. A lack of knowledge can cause anxiety and leads complainants to start setting
their own expectations, which can often be unrealistic and far from reality.
This is not helped by the fact that most don’t receive information about alternative resolution
routes or what the complaint resolution process looks like (that they could refer to later down
the line), leaving them uncertain about what should be happening and when (though the
need for this has decreased in importance in 2018).
While fewer complainants had to chase for updates (and not having to chase is a driver of
satisfaction in 2018), many still felt that the supplier did not update them on the progress of
their case enough for the complainant to know what was happening. And while there have
been significant improvements in suppliers getting back to complainants when agreed, still
fewer than half experienced this. Thus, there is considerable room for improvement in
keeping complainants in the loop about the progress of their case. This may be in part
exacerbated by not having a named contact they can refer to when they have a question
about the progress of their complaint – the effort of having to speak to someone new every
time makes the process more onerous. This is felt more strongly when there is a perception
that some staff are not taking the complaint seriously enough and are therefore not helpful
in getting it resolved – this may be related to some staff not understanding the problem fully
as there seems to be no issues with politeness and treating the complainants as an
individual.
Closure is also a problem area for many complainants. The main issue was not receiving an
explanation of the problem as well as an apology for the issue occurring in the first place.
Both help to reassure the complainant that the issue has been dealt with and is unlikely to
happen again. Lack of an explanation may leave the complainant feeling that the problem
could very easily come back as they have no reassurance that it has been fixed.
7.2.3 Domestic: How the results compare to 2016 outcomes
Improvements and maintained performance
Professional and polite staff who at the start of the journey continues to be a strength
among domestic suppliers and drives satisfaction upwards. There have been significant
improvements in fewer complainants having to chase for updates, which helped uplift overall
satisfaction levels – this was one of the key areas for improvement highlighted in 2016.
Staff making decisions there and then was one of the key areas in need for improvement in
2016 – while there has been little movement in this, this particular element of the journey
has decreased in importance for complainants suggesting that they’d rather have their
complaint resolved effectively and definitively than rush it, and potentially have the problem
re-surface later down the line.
Areas requiring further attention
Staff taking ownership of the complaint and taking a proactive approach to resolve it were
the key areas for improvement since 2014, and at an overall level, this has not changed
since then. Taking the complainant seriously remains to be one of the key areas for

Customer satisfaction with energy supplier complaints handling 2018
© Quadrangle 2018 58
improvement, as does taking a proactive approach to resolving the complaint (staff
helpfulness).
Being informed that the complaint can be escalated is a new area in need of attention in
2018 – in line with the improvements seen this year, complainants want to be reassured that
the complaint will be resolved adequately by someone who understands the complaint.
Among those who escalated their complaint, there was some concern about staff being able
to understand the issues raised.
In line with previous years, being provided with resolution timescales, and suppliers
regularly updating the complainants about the progress of their case remain as key areas in
need of improvement.

Customer satisfaction with energy supplier complaints handling 2018
© Quadrangle 2018 59
7.3 Micro-business: Drivers of satisfaction and dissatisfaction with complaint handling
Figures 46 and 47 provide the drivers outcomes for micro-business complainants. The key
drivers of satisfaction and dissatisfaction align closely to the findings in the domestic market.
Figure 46: Tactical drivers for micro-business complainants.22
Bases: All micro-business complainants (703).
Figure 47: Perceptual drivers for micro-business complainants.17
Bases: All micro-business complainants (703).
22 Elements at the bottom of each list in 2018 (with a letter in brackets next to it) indicates a movement. The letter
in brackets indicates the colour of the quadrant the element moved from e.g. (G) from green, (B) from blue, (A) from amber and (R) from red.
MONITOR
• Making decisions there and then
• Receiving compensation
• Having a named contact (R)• Being told w here to seek independent
advice (R)
BUILD ON
• Staff not using jargon
• Telling me the steps that w ill be taken
• Using my preferred contact method
• Supplier having record of complaint• Receiving a resolution confirmation
PRIORITY FOR ACTION
• Being given a resolution date
• Being told how long each step w ill take
• Dealing w ith one person
• Supplier getting back w hen agreed• Not having to chase for updates
• Supplier updating regularly
• Receiving an explanation
• Being asked contact preferences (B)
• Directing to complaints procedures (A)• Offering to send procedures for free (A)
• Informing complaint can be escalated (A)
• Receiving an apology (A)
MAINTAIN
• Receiving a formal acknow ledgement of
complaint
• Providing a complaint reference number
• Supplier having correct contact details• Supplier having full complaint history
• Not having to escalate
• Not having to make a further complaint
• Not having to contact Ombudsman
• Not having to contact Citizens Advice• Supplier not sending letter referring to
Ombudsman
MONITOR
• Staff understanding my complaint
• Ease of registering the complaint (B)
BUILD ON
• Staff professionalism
• Staff treating me as an individual (B)
PRIORITY FOR ACTION
• Staff helpfulness
• Acceptability of the time it took to
resolve the complaint
• Staff taking my complaint seriously (G)
MAINTAIN
• Staff politeness
• Ease of f inding contact details
Customer satisfaction with energy supplier complaints handling 2018
© Quadrangle 2018 60
7.3.1 Micro-business: Drivers of satisfaction – summary observations
As with domestic complainants, being provided with information on the steps that will be
taken to resolve their complaint in clear language is one of the key areas that need to be
built on to increase satisfaction. Receiving a resolution confirmation at the end of the
process has a similarly positive effect. There has been no change in this since 2016.
Micro-business complainants are also positive about follow up contact with the supplier. If
their preferred channel of communication is used (typically telephone), and staff have
access to their complaint information, that provides a structure to the process – this is
underpinned by staff professionalism and drives satisfaction upwards.
7.3.2 Micro-business: Drivers of dissatisfaction – summary observations
The key drivers of dissatisfaction among micro-business complainants are similar to those
within the domestic market. They focus around what complainants consider to be
unacceptably long resolution periods and a lack of ongoing communication or
communication about likely timescales. This creates an information gap that micro-business
complainants fill by repeatedly chasing the supplier for information (though significantly
fewer micro-business complainants did this in 2018 than in previous years, the impact of
having to do it at all is still strong and drives dissatisfaction with the complaint handling
process).
This becomes particularly problematic when they are dealing with multiple members of staff,
who often appear unhelpful and to not take the complaint seriously enough. The issue with
staff seems to be permeating the entire journey as increasingly, micro-business
complainants are finding it more difficult to register their complaint because it is not being
acknowledged or understood when it is first raised.
7.3.3 Micro-business: How the results compare to 2016 outcomes
Improvements and maintained performance
Perceptions of staff treating the complainants as individuals has improved since 2016 and is
a strong driver of satisfaction. This suggests that the complainants appreciate their
willingness to engage with them but clearly see a gap in their ability to actually resolve the
issue (based on perceptions of lack of understanding). In line with 2016, this suggests that
micro-business complainants are more concerned with effectiveness of resolution than they
are with the emotional impact of how they are dealt with.
Areas requiring further attention
In 2018, the key change from 2016 focuses on staff. While initial response staff seem polite,
there is a clear issue with micro-business complainants finding it more difficult to register
their complaint and finding that staff are not taking their complaint seriously enough. It was
previously an area of strength and has since become an area that needs urgent attention.
Providing complainants with information about the complaints process that they can refer to,
and informing them that their complaint can be escalated, are also of greater importance to
complainants in 2018 highlighting the need to have the formal process locked down and
followed, particularly when it comes to micro-business complainants who seem to seek
better organisation and formality of the process.
Customer satisfaction with energy supplier complaints handling 2018
© Quadrangle 2018 61
8 Conclusions and recommendations
8.1 Summary of findings – domestic and micro-business markets
▪ Overall satisfaction with complaint handling has improved significantly among domestic
and micro-business complainants alike. Encouragingly, worst performers from 2016
have shown significant uplifts in overall satisfaction, though there remains significant
room for improvement.
▪ The start of the journey works well for most complainants, with significant improvements
reported in 2018 in setting expectations at the start of the process (e.g. providing
complainants with a resolution date). However, at an overall level, customer
expectations are still not well managed as only around a third receive this information.
This can negatively impact how the rest of the complaints journey is experienced.
▪ Micro-business complainants are experiencing some issues, particularly early on in the
process, with staff seemingly unable to fully grasp the issue and thus deal with it
appropriately. This is one of the key areas for improvement among micro-business
suppliers.
▪ Suppliers are becoming more reliable and getting back to complainants when agreed
(though there is still room for improvement), which means fewer have to chase for
information. For those that do re-contact the supplier, the experience is fairly smooth,
with some improvements needed around the full complaint history being kept on record.
This is needed particularly in the absence of a single point of contact.
▪ Suppliers still don’t provide enough information about alternative resolution routes. Lack
of awareness of alternatives makes the process feel more stressful (if closure is not
reached relatively quickly). Some escalate the complaint to more senior staff as they
feel that quality of response from staff they were dealing with was inadequate, which in
some cases was driven by the lack of understating of the issue by initial response staff.
▪ A minority of unresolved complaints are referred to third parties and the resolution gap
has narrowed marginally, however, the lack of ongoing communication (and thus
complainants being in the dark about their situation) continues to prevent formal
complaint closure.
▪ Resolution times have shortened overall, which has had a positive impact on the overall
experience, however, there is still a disconnect between initial timescales provided to
complainants (if at all) and the actual resolution period. This is particularly an issue for
complaints that take longer to resolve, where cases may be more complex. It is those
cases that a more structured management system would be beneficial to reassure the
complainant that the supplier is dealing with the issue.
▪ Closure is important, and complainants look for an explanation of what went wrong –
compensation is less important.
▪ Complainants face a polite but often unhelpful response from staff who don’t seem to be
taking their complaint seriously enough (particularly among micro-businesses). This can
cause stress and may lead complainants to switch, though significantly fewer have done
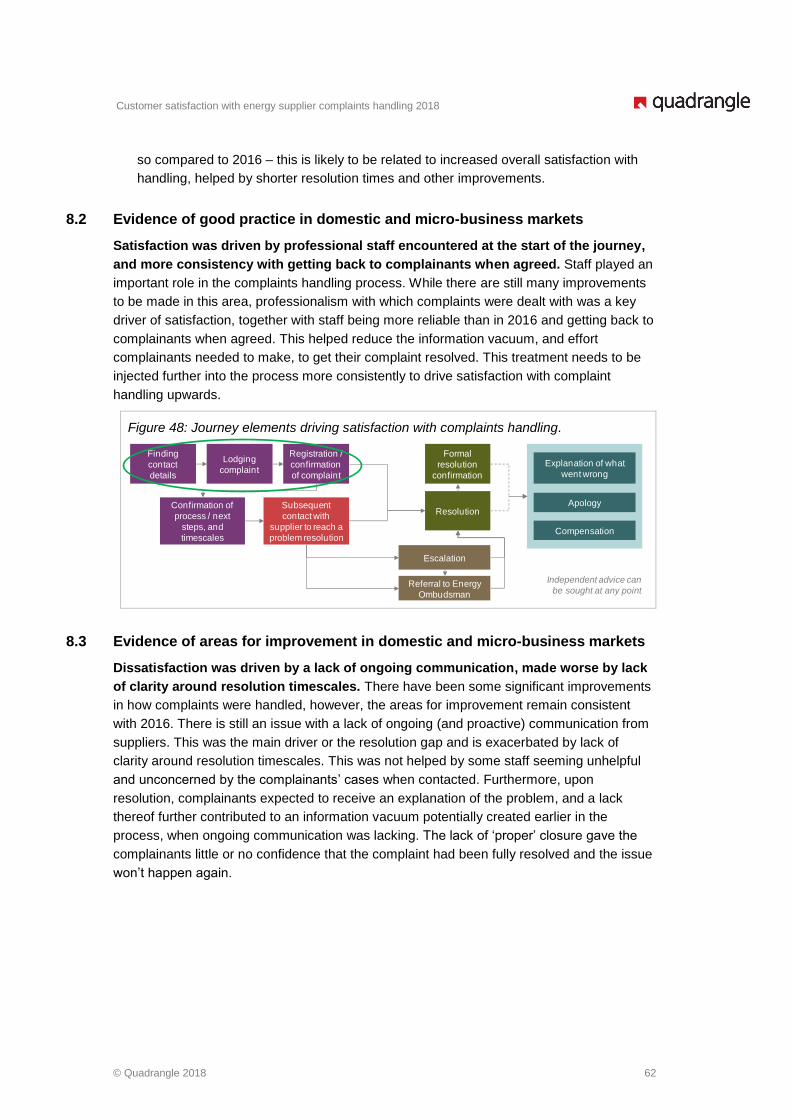
Customer satisfaction with energy supplier complaints handling 2018
© Quadrangle 2018 62
so compared to 2016 – this is likely to be related to increased overall satisfaction with
handling, helped by shorter resolution times and other improvements.
8.2 Evidence of good practice in domestic and micro-business markets
Satisfaction was driven by professional staff encountered at the start of the journey,
and more consistency with getting back to complainants when agreed. Staff played an
important role in the complaints handling process. While there are still many improvements
to be made in this area, professionalism with which complaints were dealt with was a key
driver of satisfaction, together with staff being more reliable than in 2016 and getting back to
complainants when agreed. This helped reduce the information vacuum, and effort
complainants needed to make, to get their complaint resolved. This treatment needs to be
injected further into the process more consistently to drive satisfaction with complaint
handling upwards.
Figure 48: Journey elements driving satisfaction with complaints handling.
8.3 Evidence of areas for improvement in domestic and micro-business markets
Dissatisfaction was driven by a lack of ongoing communication, made worse by lack
of clarity around resolution timescales. There have been some significant improvements
in how complaints were handled, however, the areas for improvement remain consistent
with 2016. There is still an issue with a lack of ongoing (and proactive) communication from
suppliers. This was the main driver or the resolution gap and is exacerbated by lack of
clarity around resolution timescales. This was not helped by some staff seeming unhelpful
and unconcerned by the complainants’ cases when contacted. Furthermore, upon
resolution, complainants expected to receive an explanation of the problem, and a lack
thereof further contributed to an information vacuum potentially created earlier in the
process, when ongoing communication was lacking. The lack of ‘proper’ closure gave the
complainants little or no confidence that the complaint had been fully resolved and the issue
won’t happen again.
Independent advice can
be sought at any point
Finding
contact
details
Lodging
complaint
Registration /
confirmation
of complaint
Subsequent
contact with
supplier to reach a
problem resolution
Referral to Energy
Ombudsman
Confirmation of
process / next
steps, and
timescales
Escalation
Formal
resolution
confirmation
Resolution
Explanation of what
went wrong
Apology
Compensation

Customer satisfaction with energy supplier complaints handling 2018
© Quadrangle 2018 63
Figure 49: Journey elements driving dissatisfaction with complaints handling.
8.4 Some recommendations
▪ Automating provision of complaint handling procedure information/ making it
more accessible.
If asked, the complainant may refuse the Complaint Handling Procedures as they don’t
necessarily know what information they contain. Having the Procedures would increase
the likelihood that complainants are clear(er) on what to expect and feel a sense of
transparency about the process (this booklet/ webpage could also include information
about third party advisers and redress schemes). Suppliers should inform complaints, at
the start of the process, that Complaint Handling Procedures are available, where they
are, and what information they contain. Thus, if needed, the complainant might refer to
them. Automating that process, rather than having initial contact staff send it out, could
make this process smoother.
▪ A more structured approach to keeping complainants updated.
Either an online system, an update in writing or via SMS, or a scheduled call, depending
on contact preferences, would ensure the complainant does not feel ‘in the dark’ about
the progress of their complaint and feels reassured it is being dealt with. Even if there is
no update, proactive (i.e. scheduled) communications from the supplier can ease the
frustration with the process by reducing the number of times complainants have to
chase for information. This would also decrease suppliers’ handling costs per complaint.
▪ Formalising complaint closure by logging it only if the complainant gives their
explicit permission to do so.
This could help reduce the resolution gap, however, it could mean that resolution
periods increase further as complainants may feel that their problem has not been
adequately addressed. Here, closer and more rigorous adherence to CHS would help,
and ensuring the supplier seeks to resolve the issue fully the first time. This will in turn
avoid future complaints about the same problem and increase efficiency on the
suppliers’ side.
Independent advice can
be sought at any point
Finding
contact
details
Lodging
complaint
Registration /
confirmation
of complaint
Subsequent
contact with
supplier to reach a
problem resolution
Referral to Energy
Ombudsman
Confirmation of
process / next
steps, and
timescales
Escalation
Formal
resolution
confirmation
Resolution
Explanation of what
went wrong
Apology
Compensation
Customer satisfaction with energy supplier complaints handling 2018
© Quadrangle 2018 64
Quadrangle Research Group
The Butlers Wharf Building
36 Shad Thames
London SE1 2YE
+44 (0)20 7357 9919
www.quadrangle.com


