+ All Categories
Home > Documents > Customer value of smart metering: Explorative evidence ... value of smart... · Customer value of...

Customer value of smart metering: Explorative evidence ... value of smart... · Customer value of...

Date post: 07-Nov-2019
Category:
Upload: others
View: 9 times
Download: 0 times
Share this document with a friend
29
Customer value of smart metering: Explorative evidence from a choice-based conjoint study in Switzerland Simon Kaufmann, Karoline Künzel, Moritz Loock* Simon Kaufmann Repower AG Talstrasse 10 7250 Klosters Switzerland [email protected] Karoline Künzel Good Energies Chair for Management of Renewable Energies Institute for Economy and the Environment (IWÖ-HSG) University of St.Gallen CH-9000 St. Gallen Switzerland [email protected] Moritz Loock* Good Energies Chair for Management of Renewable Energies Institute for Economy and the Environment (IWÖ-HSG) University of St.Gallen Tigerbergstr. 2 CH-9000 St. Gallen Switzerland http://goodenergies.iwoe.unisg.ch E-mail: [email protected] Tel.: +41 71 224 25 86 fax: +41 71 224 27 22 *corresponding author
Transcript

Customer value of smart metering: Explorative evidence from a choice-based conjoint study in

Switzerland

Simon Kaufmann, Karoline Künzel, Moritz Loock*

Simon Kaufmann Repower AG Talstrasse 10 7250 Klosters Switzerland [email protected] Karoline Künzel Good Energies Chair for Management of Renewable Energies Institute for Economy and the Environment (IWÖ-HSG) University of St.Gallen CH-9000 St. Gallen Switzerland [email protected] Moritz Loock* Good Energies Chair for Management of Renewable Energies Institute for Economy and the Environment (IWÖ-HSG) University of St.Gallen Tigerbergstr. 2 CH-9000 St. Gallen Switzerland http://goodenergies.iwoe.unisg.ch E-mail: [email protected] Tel.: +41 71 224 25 86 fax: +41 71 224 27 22 *corresponding author

2

ABSTRACT Implementing smart metering is an important field for energy policy to successfully

meet energy efficiency targets. From an integrated social acceptance and customer-

perceived value theory perspective we model the importance of customer value of

smart metering in this regard. We further shape the model on a choice-based

conjoint experiment with Swiss private electricity customers. The study finds that

overall customers perceive a positive value from smart metering and are willing to

pay for it. Further, based on a cluster analysis of customers’ value perceptions, we

identify four customer segments, each with a distinct value perception profile for

smart metering. We find that energy policy and management should integrate a solid

understanding of customer value for smart metering in their initiatives and consider

different smart metering market segments within their measures.

Key words: smart metering, customer value, conjoint analysis, cluster analysis, energy policy

3

1. INTRODUCTION In a new proposal for an energy efficiency directive from June 2011, the EU renews

the goal of reducing energy consumption by 20% by 2020 (COM/2011/0370, 2011).

This has already been a key element of the Directive 2006/32/EC (Directive

2006/32/EC, 2006). In 2011 the EU points again to the importance of rolling-out

smart meters but also states that failing to help end-users to save energy might be a

major obstacle to mass-market diffusion (European Commission, 2011). This points

to the importance of considering a customer value perspective when implementing

smart metering. The importance of a customer value perspective is also evident in a

statement of the European Smart Metering Alliances, which names customer

acceptance as one of the main issues for smart metering: “Energy savings from

smart metering and information feedback depends on acceptance and understanding

by consumers of the basic premise. (...) Consumers should receive appropriate

benefits from any cost reductions achieved by the Energy supply industry resulting

from smart metering although this should not negate the financial drivers for the

utilities“ (ESMA, 2012). Despite being crucial for smart metering, research mostly

focuses on engineering aspects of smart metering, and only a few studies point to

customer needs (Forsa, 2010; Kranz et al., 2010; Giordano and Fulli, 2012).

Furthermore, research from a customer perspective focuses mainly on the potential

of reducing energy (and related costs) and on the effect of different energy tariffs

(Faruqui et al., 2009; Stromback et al., 2011). However, smart metering offers all

kinds of different services to customers and utilities alike. For example, a connected

advanced metering infrastructure (AMI) allows for remote meter reading, accurate

monthly billing, and enables demand response and load management (Leeds, 2009;

Ryberg, 2010; Appelrath et al., 2012). Furthermore, if the smart meter is connected

to the home area network, consumers can be provided with energy consumption

feedback systems, with remote programming and steering services for appliances,

with security services as well as with the possibility to manage decentralized energy

feed-in from e.g., renewables or intelligent charging of plug-in electrical vehicles. For

an overview about existing smart metering and smart grid technologies, providers of

those technologies and resulting smart metering services we refer to the relevant

literature (European Commission, 2005; European Commission, 2006; ESMA, 2008;

SFOE, 2009; 2012; Leeds, 2009; Forsa, 2010; Ryberg 2010; Appelrath et al., 2012).

4

Although a mandatory rollout of smart metering would foster the nationwide

implementation of smart metering, it is unlikely to play a significant part in achieving a

20% reduction in energy consumption when it fails to incorporate the issue of

consumer acceptance. First, an undifferentiated mandatory smart meter rollout might

lead energy providers to either choose the cheapest smart metering solution or to

implement smart metering services that provide value to the energy providers but not

to the customer. Other services, which could provide value to the customer but are

not perceived as highly profitable to the industry, might thus be disregarded (Marvin

et al., 1999; Neenan and Hemphill, 2008; Darby, 2010). This could lead to suboptimal

results because the lack of customer value prevents consumer acceptance of smart

metering technologies. Customer value and consumer acceptance are crucial

because only when customers perceive a value, they become interested in the

technology and start using it (Davis, 1989; Kim et al., 2007) in their daily life, which –

in the case of smart metering – might ultimately result in a reduction of energy

consumption (Marvin et al., 1999; Neenan and Hemphill, 2008; Honebein et al.,

2009; Darby, 2010; Clastres, 2011; Giordano and Fulli, 2012). Second, even if policy

makers oblige the industry to include certain services of value to customers into a

mandatory smart metering solution, the results might still remain suboptimal with

regard to the goal of reducing energy consumption by 20%. It is likely that

consumers’ value perceptions of smart metering services – like for many other

services – differ among various customer segments (DeSarbo et al., 2001; Ruiz et

al., 2007; Wiedmann et al., 2009). Thus, even if this mandatory smart metering

solution attracts some customers, it might fail to attract others (Darby, 2010). By

ignoring the heterogeneous customer needs in the market, broad consumer

acceptance of smart metering might not be achieved. Therefore, effective energy

policy requires a sound understanding of different value perceptions of smart

metering to design effective measures for smart meter implementation.

The study at hand intends to reveal the preferences of Swiss private energy

consumers for smart metering services. The work is guided by the question, what is

the perceived value of smart metering services for customers.

From an integrated social acceptance and customer value perspective we first model

the importance of customer value of smart metering. We then test the model on a

choice-based conjoint experiment with Swiss private electricity customers. The study

finds that overall customers value smart metering and are willing to pay for it. Further,

5

based on a cluster analysis of customer preferences, four segments were identified,

each of which with distinct value perceptions of smart metering. We find that energy

policy and management should integrate a solid understanding of customer-

perceived value for smart metering in their initiatives and consider the different

market segments within their measures.

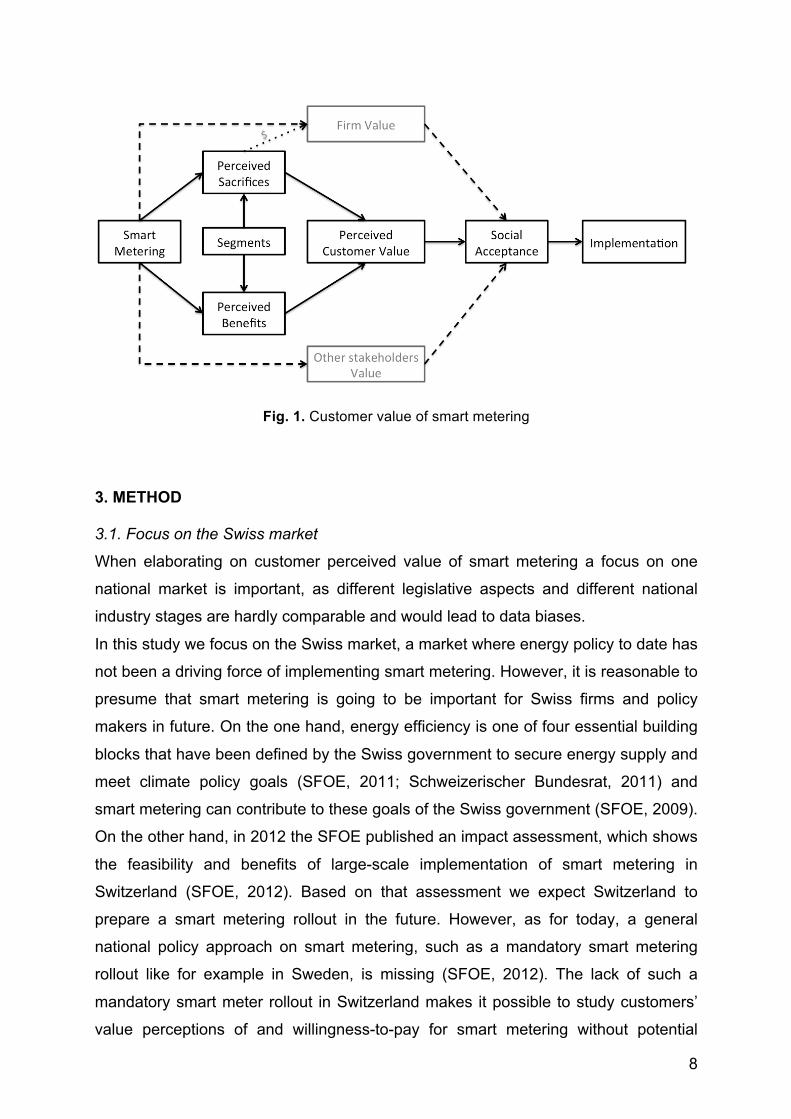
2. THE ROLE OF CUSTOMER VALUE AND OF VALUE-BASED SEGMENTATION FOR IMPLEMENTING SMART METERING Our basic model (Figure 1) states that customer value is crucial for implementing

smart metering. The model is derived from an integrated social acceptance and

customer value perspective. The basic premise is that – as for all innovative energy

technologies – social acceptance among various stakeholders is a precondition for

the successful implementation and diffusion of smart meter technology and related

services (Wüstenhagen et al., 2007; Wolsink, 2012). Among the most important

stakeholders are customers (those who buy and/or use smart metering) and firms

(those who develop and/or provide smart metering). A successful diffusion would

require balancing the interest of those stakeholders in a pareto-efficient manner, so

that all stakeholders maximize their value.

Whereas the company perspective is less critical, as firms usually are good in

realizing their model, the customer value perspective is more crucial and has been

approached by different research (Zeithaml, 1988; Sheth et al., 1991; Parasuraman,

1997; Slater, 1997; Woodruff, 1997; Holbrook, 1999; Belz and Bieger, 2006).

According to Zeithaml (1988) and Sheth et al. (1991) consumers purchase a product

or service if they perceive some kind of positive value. Zeithaml (1988) defines

perceived value of a product or service as an overall assessment by the customer of

what is given (drawbacks) and what is received (benefits). It is important to note that

according to this definition value is not objective or simply given, but rather it is based

on an individual perception. Regarding smart metering this means that the customer-

perceived benefits of smart metering must exceed the perceived drawbacks. Only

then will the customer accept, be willing to pay for and use smart metering services.

Meaning, only then will there be a market acceptance of smart metering by

consumers, which is a part of social acceptance (Wüstenhagen et al., 2007; Wolsink,

2012). In order to ensure market acceptance of smart metering by firms – another

part of overall social acceptance (Wüstenhagen et al., 2007; Wolsink, 2012) – firms

must receive some kind of revenue in exchange for developing and providing smart

6

metering services, e.g., via the price the customers pay for these services. From the

company perspective the price is important to notify and satisfy the firm’s value on

smart metering. From the customer perspective, however, the price consists of a

drawback and thus reduces the overall customer-perceived value (Zeithaml, 1988).

The spotted arrow with the dollar sign in Figure 1 demonstrates this relationship.

When deciding on which smart metering services to offer and how to price them, two

things are of critical importance. First, one should have a thorough understanding of

which smart metering services provide benefits to the customers. Only those services

would be able to compensate for the perceived drawback of the prices because they

offer enough benefit in exchange and thus elicit a willingness-to-pay (Zeithaml,

1988). Second, price setting for a service should be based on an assessment of

customers’ willingness-to-pay instead of a cost plus approach to ensure that the

overall customer-perceived value (now also including the price) of the respective

service is positive and thus leads to customer acceptance and purchase.

Following the concept of customer value and social acceptance, the customer-

perceived benefits of smart metering should exceed the perceived drawbacks in

order to ensure market acceptance and diffusion of smart metering. Previous

research claims that customer-perceived benefits indeed exceed the perceived

drawbacks (Forsa, 2010; Curtius et al., 2012). Thus, we assume:

Assumption 1a: Customers are willing to pay for smart metering.

Assumption 1b: The positive customer-perceived value of smart metering will

in turn result in purchase and in market acceptance of smart metering by

consumers - a part of social acceptance.

Furthermore, as smart metering can provide a variety of services, which offer

different benefits, one can assume that customers’ willingness-to-pay differs for

different services and service combinations.

Assumption 2: Different smart metering services result in different perceived

benefits and thus the customers’ willingness-to-pay differs for different smart

metering services and bundles of services.

7

Literature on customer value also suggests that different customers have different

needs and therefore a market segmentation based on the heterogeneity of value

perceptions in a market is needed (Kotler, 1997; DeSarbo et al., 2001; Dibb et al.,

2002; Morris et al., 2005; Ruiz et al., 2007; Wiedmann et al., 2009). DeSarbo et al.

(2001) state that “there are indeed heterogeneous interpretations of customer-

perceived value, and multiple customer segments may assign differential importance

weights to the value drivers” (p. 846). Thus, an assessment of customer value on an

aggregate level might be misleading (DeSarbo et al., 2001; Ruiz et al., 2007;

Wiedmann et al., 2009). This presumably will hold in the case of smart metering,

which may not be valued by all customers in the same manner. For instance,

technology-oriented value propositions like coupling smart metering with mobile

devices like iPhones might be very valuable for customers who favor smart phones.

However, other customers with less technological exposure may not be attracted by

such value propositions (Darby, 2010). Interestingly, we find that up to now

discussions on smart metering have been dominated by an engineering or

technological perspective. These discussions are less open to other (maybe even

larger) segments, which need to be attracted in a different way. Thus, a value-based

segmentation of the market for smart metering is crucial to better account for the

heterogeneity of value perceptions in that market.

Assumption 3: Different customer segments value smart metering differently.

Figure 1 displays the simplified model derived from the aforementioned theoretical

background and sets the concept of customer value for smart metering in context.

8

Fig. 1. Customer value of smart metering

3. METHOD 3.1. Focus on the Swiss market

When elaborating on customer perceived value of smart metering a focus on one

national market is important, as different legislative aspects and different national

industry stages are hardly comparable and would lead to data biases.

In this study we focus on the Swiss market, a market where energy policy to date has

not been a driving force of implementing smart metering. However, it is reasonable to

presume that smart metering is going to be important for Swiss firms and policy

makers in future. On the one hand, energy efficiency is one of four essential building

blocks that have been defined by the Swiss government to secure energy supply and

meet climate policy goals (SFOE, 2011; Schweizerischer Bundesrat, 2011) and

smart metering can contribute to these goals of the Swiss government (SFOE, 2009).

On the other hand, in 2012 the SFOE published an impact assessment, which shows

the feasibility and benefits of large-scale implementation of smart metering in

Switzerland (SFOE, 2012). Based on that assessment we expect Switzerland to

prepare a smart metering rollout in the future. However, as for today, a general

national policy approach on smart metering, such as a mandatory smart metering

rollout like for example in Sweden, is missing (SFOE, 2012). The lack of such a

mandatory smart meter rollout in Switzerland makes it possible to study customers’

value perceptions of and willingness-to-pay for smart metering without potential

9

biases that result from energy policy measures aimed at the diffusion of smart

metering. For example, customers might be more likely to thoroughly examine the

value of smart metering when they decide voluntary on the installation of a smart

meter in their home instead of being forced to do so by legislation. Thus, – besides

being ideal from a point of view of conducting economic research – we consider

Switzerland as an ideal country for our study.

3.2. Survey and sample

We decided to focus on one of the potential pilot projects for smart metering; in this

case it was a project by the electricity utility in Davos (EWD). The customers of EWD

were not yet equipped with smart meters and our study was aimed at providing EWD

with insights on which smart metering services to include in their pilot. Therefore, we

needed to ensure the same level of knowledge about smart metering among the

participants. Thus, we provided basic information about smart metering and also

clarified that different tariffs could impact customers’ energy costs both positively and

negatively in the survey introduction. The survey was first pretested with 10 people

not necessarily familiar with smart metering and one expert from the EWD and then

was available online from August 5-30, 2010. The sample was generated as a

convenience sample among private customers of the EWD (Weiers, 2005; Orme,

2006). The invitation to the survey was distributed via different channels. The EWD

provided a link on their homepage and distributed flyers at their point of sales.

Further, all employees with direct customer contact were advised to inform the

customers about the survey. Additionally, the invitation was send to different

associations and a residential building cooperative. Within three weeks 144

responses could be collected. Twenty three responses had to be discarded, as they

were neither from customers of the EWD nor from decision-makers within their

household. Additionally, 34 responses were not complete, so that a total of 87 valid

responses remained for the analysis. With that the minimum number for conjoint

analysis with approximately 30 is fulfilled (Schaich, 1990; Schira, 2005). As agreed

with the EWD the survey did not collect socio-demographic data.

3.3. Choice-based conjoint experiment and analysis

To investigate customers’ value perceptions of smart metering we conducted a

choice-based conjoint experiment. Choice-based conjoint analysis is a well-

10

established method in marketing research to measure customer preferences. It is

beyond the scope of the paper to discuss the fundamentals of the method in detail,

so we refer to relevant literature here (Louviere et al., 2003; Train, 2003; Gustafsson

et al., 2007; Orme, 2010). Furthermore, research has utilized conjoint analysis in the

discourse on clean energy, energy-efficiency and energy policy (Sammer and

Wüstenhagen, 2006; Burkhalter et al., 2009; Loock, 2012). The conjoint approach

builds on the basic premise that customer preferences sum up part worth (Backhaus

et al., 2008). In accordance, customer value of smart metering would not come from

a single attribute but a conjoint evaluation of different attributes. The conjoint analysis

decomposes attribute packages and calculates the single value of product and

service attributes, which are shown as part-worth utilities (Backhaus et al., 2008). To

design the choice experiment, collect and analyze the data we used Sawtooth

Software1.

In order to conduct a conjoint analysis, it is essential to derive a list of relevant

attributes and levels that capture smart metering from a customer’s point of view. We

derived the list based on preliminary research (semi-structured interviews with

experts and desk research). Table 1 shows the attributes and levels for our study. Table 1 Attributes and levels for choice-based conjoint experiment

Attribute Levels Tariff (low/high) 11 / 17 Rp. per kWh

8 / 30 Rp. per kWh 6 / 50 Rp. per kWh

Base fee per month CHF 23.00 CHF 23.00 + CHF 2.00 CHF 23.00 + CHF 4.00

Remote meter reading with accurate monthly billing Yes, included in the package No, not included in the package

Real-time consumption feedback Yes, via in-home display Yes, via online web portal Yes, via mobile device No, not included in the package

Programming and steering services Yes, included in the package No, not included in the package

Home security and surveillance services with alert functions

Yes, included in the package No, not included in the package

The first attribute is the tariff model. We chose a critical peak price (CPP) model over

a time of use (TOU) model. We are aware of differences of the impact of CPP and

TOU (see e.g., Faruqui and Sergici, 2010) and suggest that future work considers

11

differences of fit between both models and different customer segments. For our

study we chose the CPP because CPP has been proven to have a higher impact on

peak demand reduction (Faruqui et al., 2001; Faruqui and Mauldin, 2002; Herter,

2007; Faruqui et al., 2010; Faruqui and Sergici, 2010) and thus might have a higher

value to customers by enabling a significant reduction of their electricity bills.

Furthermore, CPP better accounts for the specifics within our sample region and is

better related to the pricing structure of the EWD. Our basic model relates to the

EWD tariff “EWD Doppel” and the “consumption category H4”. This category equals

the average Swiss household with an average annual consumption of approximately

4500 kW h (Elcom, 2010). For the average EWD customer approximately one third of

the energy costs are fixed costs and are paid in a monthly fee. The Swiss national

average costs are 21.3 Rp./kW h. Without fix costs this results in the tariff which we

incorporate as our basic level with 11 Rp./kW h as a low tariff and 17 Rp./kW h as a

high tariff of the actual tariff structure (EWD, 2010). Within the expert interviews of

our preliminary research we learned that a factor of 1.5 as a span between low and

high price tariff is too low to attract customers to consume energy more flexible and

to shift loads. This is even more problematic as energy costs only account for a small

portion of household expenditure in Switzerland (Braunwalder, 2007). So the

following models have a greater price span and thus higher saving potentials as well

as a higher risk exposure to high tariffs. The second attribute is the base fee, which is

the price attribute in our experiment. Here again the first level is the real base fee for

EWD customers, which was 23.70 CHF per month in 2010 when the survey was

carried out (EWD, 2010). The following two levels have a step-wise higher base fee

(+2 CHF and +4 CHF). We used this step-wise higher base fee for research purpose

because this allows us to measure the willingness-to-pay for smart metering and to

assign a monetary value to the single attributes and their levels within the further

conjoint analysis. The third attribute covers remote meter reading with accurate

monthly billing. Either it is included in the package or not. The fourth attribute

consists of the possibility of real-time consumption feedback, which is either not

included in the package or included and transmitted on different devices, such as on

an in-home display, online web portal or mobile phone. The fifth attribute proposes

programming and steering services of single devices and the last attribute consists of

home security and surveillance services with alert functions. For both attributes the

services are either included in the package or not.

12

4. RESULTS AND ANALYSIS 4.1. Sensitivity analyses and market share

To reveal which attributes and levels are of which value to customers, we calculate

the part-worth utilities2 by Hierarchical Bayes as provided in the Sawtooth software

package (see appendix). Hierarchical Bayes produces statistically accurate results

because the calculation of part-worth utilities is based on the preferences of

individual respondents (Sawtooth Software, 2009). To interpret the part-worth utilities

we conducted a sensitivity analysis based on share of preferences. This analysis

allows us to estimate the value of each service level by its influence on change of the

market share. This is done by changing one attribute level of one of two products

whereas all other levels remain the same for both products. Thus, an increase or

decrease in value is a result of changing a level of an attribute to another. The results

of the sensitivity analysis are reported in Figure 2.

Fig. 2. Sensitivity analysis based on share of preferences

The analysis reveals that, for example, a visualization of the energy consumption by

an in-home display has the highest customer-perceived value compared to the other

levels of this attribute. If the market consists of only two products, each providing the

same level of services (highlighted by the bold numbers of 50.00 in Figure 2),

13

providing the service of visualization of the energy consumption by an in-home

display in one of the two offerings results in a change of market preferences of

30.03% for the respective offering (80.03-50.00).

Based on the results in figure 2, one can assume that the ideal market offering would

consist of an offering with service levels resulting in the highest market share.

However, this conclusion does not account for the heterogeneity in the market and

thus might fail to capture the whole market potential (DeSarbo et al., 2001).

4.2. Willingness-to-pay

By calculating the willingness-to-pay it becomes possible to quantify the values of the

conjoint analysis in terms of monetary value (Green and Srinivasan, 1990; Sammer

and Wüstenhagen, 2006; Orme, 2010)3. The willingness-to-pay can be determined

as follows:

Ni is the part-worth value of an attribute i, ∆price is the difference between the

highest and lowest level of the price attribute base fee (CHF 23 + CHF 4 – CHF 23 =

CHF 4.00). MaxNPrice equals the maximum value of the attribute price

(0.91+0.72=1.63) (Green and Srinivasan, 1990; Sammer and Wüstenhagen, 2006;

Orme, 2010). Figure 3 displays the values. A value higher than zero indicates the

willingness-to-pay a premium, whereas a negative value would require a discount on

a given price.

14

Fig. 3. Willingness-to-pay

Within the experiment customers would be willing to pay a premium of up to 9 CHF to

get their most desired smart metering product (3.04+1.55+1.30+2.38+0.93).

However, customers would also demand a discount of the same value if their smart

metering product did not fit their needs. The results of our willingness-to-pay

calculation for the different tariffs indicate that consumers are willing to pay more

(3.04 CHF for a tariff of 11/17 Rp./kW h) to get the tariff model with the lowest risk or

they would expect a discount of 3.56 CHF when forced to accept the highest offered

tariff model. A possible interpretation is that they are willing to pay to avoid the risk

related to high tariffs (Chapman et al., 2001; Faruqui and Mauldin, 2002; Herter,

2007; Faruqui et al., 2010). The related chance of falling into the lowest tariff seems

either to be unsuitable to balance this risk or seems not to have been realized by

respondents.

To compare the costs of smart metering with the willingness-to-pay we could

calculate how long it takes for the costs to be amortized. In the recent published

impact assessment of smart metering in Switzerland (SFOE, 2012) five scenarios for

smart meter implementation and related costs were reported. The scenarios range

from “status quo”, which does not foresee the implementation of smart meters and

which uses the existing infrastructure, to the scenario “nationwide implementation +”,

which consists of an implementation of smart meters at 97% of the metering points

15

until 2035, a smart meter enabling infrastructure, dynamic tariffs, data collection in a

15 min. interval as well as load management for various appliances. The scenario

“nationwide implementation +” allows for all of our services to be offered. Whereas

the total accumulated costs between 2015 and 2035 of the scenario “status quo”

would amount to 4319 million CHF, those of the scenario “nationwide implementation

+” would amount to 5236 million CHF (SFOE, 2012). The costs include investment,

operating, communication costs and costs for business processes (SFOE, 2012). For

a detailed overview of the costs and related parameters we refer here to the impact

assessment (SFOE, 2012). If we subtract the total accumulated costs of the scenario

“status quo” from those of the scenario “nationwide implementation +” we arrive at

the added costs due to the implementation of smart metering, which amount to 917

million CHF.

Today 4.9 million meters are installed in Switzerland (SFOE, 2012). If each of the

households and companies who are equipped with these meters would pay 9 CHF

per month for their ideal smart metering offering, this would amount to a revenue of

529.2 million CHF per year. Bringing this into relation with the additional costs for

smart metering of the “nationwide implementation +” scenario, 917 million CHF, this

would mean that these costs could, for example, be amortized in approximately 2-3

years4.

4.3. Cluster segments for smart metering

To understand whether and how customer preferences for smart metering differ

within different customer segments, we run an agglomerative hierarchical cluster

analysis (Backhaus et al., 2008; Berekoven et al., 2009) based on the individual part-

worth utilities with SPSS. The distance was measured as in most studies by squared

Euclidean distance, which indicates how similar or non-similar the objects are

considering the attributes (Brosius, 2008). We used the Ward method as algorithms.

For validation we compared the results with different other algorithms and considered

three further criteria (Backhaus et al., 2008): First, the Elbow-criterion, which over a

long time showed a low failure and only strongly increased within the last steps (see

appendix). Our interpretation is that this suggests a lower number of clusters to be

appropriate. Second, we tested the significance of the distinctiveness among the

clusters as proposed by Backhaus et al. (2008), based on the following model:

F(AG) = variance of attribute A in group G / variance of attributes A within the whole

16

sample. Thereby a cluster is homogenous if F(A,G)<1 for all A (Backhaus et al.,

2008) (see appendix). The determination of four as the final number of clusters was

based on these two criteria. We thereby needed to exclude one non-fitting object to

ensure homogeneity for cluster three, which however is feasible as reported by Punj

& Stewart (1983). Finally, as a third criterion, we assessed the clusters from a

qualitative perspective to determine whether they appear consistent from a content

perspective to derive implications for energy policy, management and research.

Figure 4 illustrates the resulting clusters by highlighting the biggest differences in the

respective part-worth utilities among the clusters (see appendix for all part-worth

utilities). The dotted line represents the total part-worth utilities for the whole sample

to illustrate how the value perceptions of each cluster differ from those of an

aggregate assessment of customer value.

Fig. 4. Customer segments for smart metering

17

The first cluster (39% of the customers) can be named “risk-averse”. The strong

preference for the lowest tariff model with low risk is the dominating characteristic.

Apparently, customers of the first cluster do not see the benefit of potentially lower

electricity bills due to dynamic pricing programs such as CPP (Faruqui et al., 2010).

One explanation could be that they have difficulties in estimating their ability to react

to the prices through energy efficiency measures and thus are more worried about

the risk of an increase in their bills rather than focusing on the potential savings

(Faruqui and Mauldin, 2002; Faruqui et al., 2010). Thus, this group might not be the

ideal target group for dynamic pricing programs unless these provide a risk hedging

possibility (Chapman et al. 2001; Faruqui and Mauldin, 2002). Also customers within

this segment do not seem to be willing to pay5 a higher base fee reflected by their

stronger preference for the lowest base fee compared to other clusters and the total

sample. Furthermore, it appears that services related to programming and steering

and home security do not provide as much value to customers within this segment as

to customers of other segments. As for energy consumption feedback and remote

meter reading this segment’s value perception is approximately as high as the

aggregated value perception of the total sample. Overall, this segment might be

attracted by basic, low risk smart metering services, including energy consumption

visualization and remote meter reading. The price for those additional services needs

to be clearly attributed to the added services and separated from base fee.

The second cluster (29% of the customers) can be named “technology minded”. It is

dominated by high preferences for steering and programming services. Additionally,

customers within this segment perceive a higher value from visualization via mobile

devices (0.9) and remote meter reading with accurate monthly billing (1.44)

compared to the total sample and other segments. Furthermore, the perceived value

of the lowest tariff model is below that of the total sample and customers within this

segment do not seem to perceive such a high risk with a higher tariff model

compared to cluster one and four. This indicates that customers within this segment

might be more inclined to participate in dynamic pricing programs and demand

response. Finally, customers of this segment again prefer the lowest base fee. Thus,

the ideal offering of smart metering for this segment should consist of a standard

base fee and additional services such as programming and steering with a high

customer-perceived benefit should be priced separately to capture the higher

willingness-to-pay for such services within this segment.

18

The third cluster (20% of the customers) can be named “price sensitive”. The most

visible characteristic is the high value customers assign to the tariff model providing

the lowest tariff (6/50 Rp./kW h). Although this tariff is also associated with a

comparably high risk, customers within this segment seem to value the option to

save on the low price tariff. Thus, this segment seems to be the ideal target group for

dynamic pricing programs such as CPP. Going along with the preference for the

highest tariff model is that the detailed monthly invoice is perceived as valuable by

this segment. Furthermore, customers within this segment do not seem to attribute

such a high value to a low base fee as the previous clusters, indicating that the base

fee for this cluster is less important and could thus be augmented. Overall, customers

within this segment seem to be ready to actively manage and control their energy

behavior to leverage low-price tariffs. Thus, a smart meter offering enabling them to

do so, e.g., dynamic pricing and services to enable demand response, might be

ideal.

The fourth cluster (17% of the customers) can be named “safety-oriented”. An

important characteristic is the strong preference for home security services compared

to other clusters and the total sample. Additionally, customers within this segment

attribute the highest value to energy consumption visualization via in-home display.

Interestingly, at the same time, customers within this segment do not attribute a

higher value to high tariff models. This might be an indicator that being able to react

to dynamic prices with the help of energy consumption visualization might not be the

only value of visualization tools. For example, it might be possible that energy

consumption visualization provides value to customers by ensuring security at home

(e.g., detecting malfunctioning devises with the help of visualization tools). Of further

notice is that this is the only segment, which attributes a higher value to a higher

base fee. Additionally, customers of this segment do not seem to be that much

interested in programming and steering services and attribute a fairly small value to

remote meter reading with accurate billing. Thus, an ideal smart metering offering for

this segment would focus on value associated with home security services, including

in-home displays with detailed consumption feedback for single devices. If remote

meter reading needs to be included in the offering for allowing energy consumption

feedback, it should not be priced due to the relatively small customer-perceived

value. Instead the costs could be amortized through the possibility of a higher base

fee in this segment.

19

5. CONCLUSION AND IMPLICATIONS FOR ENERGY POLICY The study reveals preferences of Swiss private energy consumers for smart metering

services. From an integrated social acceptance and costumer value perspective we

first model the importance of customer value of smart metering. We then further

verify the model with a choice-based conjoint experiment with Swiss private

electricity customers. The study finds that, overall, customers value smart metering

and are even willing to pay for it and thus there is potential for amortizing the costs of

a smart meter implementation. Furthermore, we found that different customer

segments exist (“risk-averse”, “technology minded”, “price sensitive”, “safety-

oriented”) and that the value perceptions differ substantially among those segments.

Thus, a standard smart metering offering for the whole market might lead to

suboptimal results as it fails to address the heterogeneity in value perceptions and

thus potential differences in willingness-to-pay.

Based on a value-based segmentation done by a cluster analysis of customer

preferences we conclude that there are four different service bundles, which

correspond in an optimal manner to the individual customer segments’ value

perceptions. These bundles are displayed in table 2.

Table 2 Service bundles for different segments

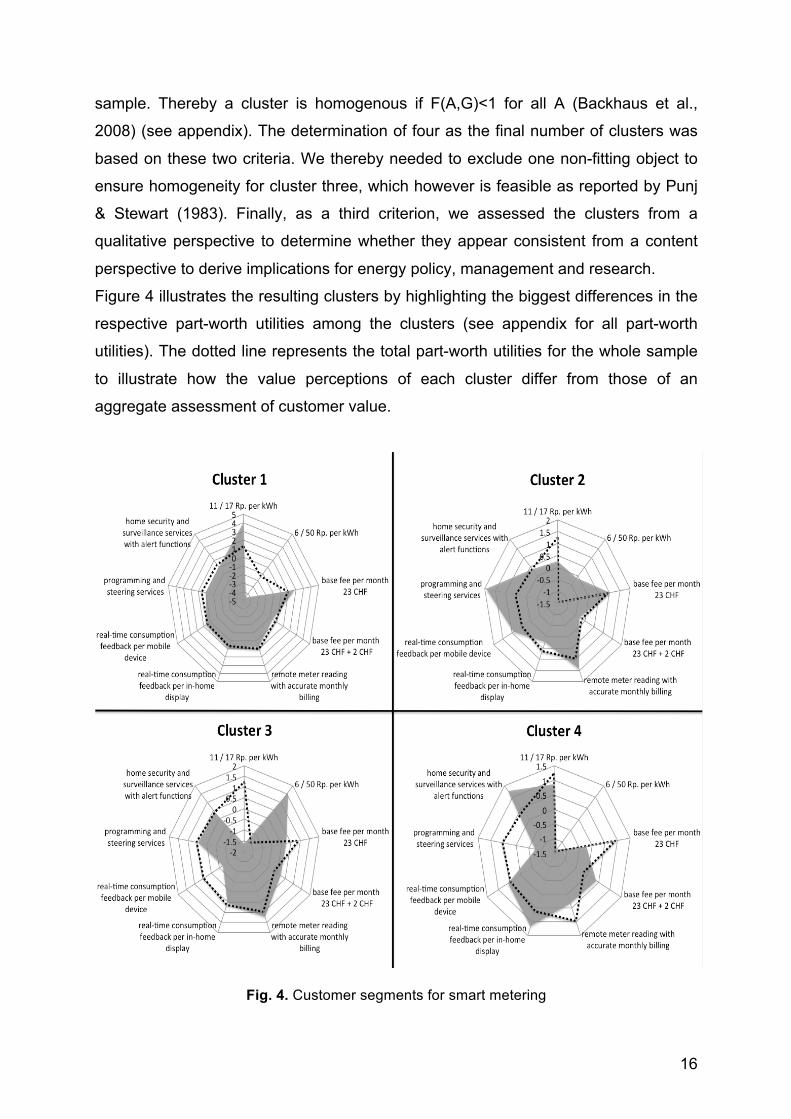
Attribute Cluster 1 Risk-averse

Cluster 2 Technology

minded

Cluster 3 Price

sensitive

Cluster 4 Safety-oriented

Tariff (low/high)

11 / 17 Rp. per kWh

11 / 17 or 6 / 50 Rp. per kWh

6 / 50 Rp. per kWh

11 / 17 Rp. per kWh

Base fee per month CHF 23.00 CHF 23.00

CHF 23.00 or

CHF 23.00 + CHF 2.00

CHF 23.00 + CHF 2.00

Remote meter reading with accurate monthly billing

✔ ✔ ✔ ✔

Real-time consumption feedback via - in-home display - online web portal - mobile device

✔ ✗ ✗

✗ ✗ ✔

✔ ✗ ✗

✔ ✗ ✗

Programming and steering services

✗ ✔ ✔ ✗ Home security and surveillance services with alert functions ✗ ✔ ✔ ✔

20

Besides a distinct communication and marketing approach for each of the segments

and the respective service bundles, there are other building blocks for a successful

implementation.

In general, given the relevance of a customer value perspective for smart metering,

we find that energy policy makers should integrate a solid understanding of

customer-perceived value of smart metering in their initiatives and measures. For

managers it will be important to monitor the customer-perceived value for smart

metering and innovate services that might be able to deliver a value to customers.

Additionally policy makers as well as managers should consider the different market

segments, as each segment might need to be attracted differently in order to foster

smart metering implementation and acceptance of the technology.

In particular, we consider it important to differentiate a potential mandatory smart

metering rollout. As discussed in the introduction, a mandatory smart metering rollout

might lead to suboptimal results because either firms might choose smart metering

solutions with benefits for the industry but not for the customer (Marvin et al., 1999;

Neenan and Hemphill, 2008; Darby, 2010), or the solutions might only attract some

customers but not all (Darby, 2010). We recommend designing energy policies along

different customer segments (or at least to consider these different segments).

Energy policy could, for example, encourage firms to implement different customer-

oriented solutions by providing some kind of incentives, such as tax reductions for

firms, which develop different customer-oriented solutions and thus engage a broad

customer base in smart metering. Therefore, policy measures for smart metering

should include a result-oriented (engagement of customer) aspect. Our results also

shed light upon how to approach the introduction of dynamic pricing programs such

as CPP and demand response, which both can be beneficial for customers (lower

bills) as well as utilities (load shifting and grid stability) (Herter, 2007; Faruqui et al.,

2010; Faruqui and Sergici, 2010). Certain customer segments (“price-sensitive”,

maybe “technology minded”) either attribute a high value to tariff models with a broad

span of high and low tariffs or do not perceive a high risk of such tariff models. These

customer groups should be the first target groups when introducing dynamic pricing

or demand response because little effort is needed to convince them about the

benefits. However, our results also show that certain customer segments (“risk-

averse”) would rather avoid dynamic tariffs due to the perceived risk of an increase in

their bills (Faruqui et al., 2010). To overcome this initial customer inertia, managers

21

or policy makers could offer some risk mitigation features, such as a “get-out-of-jail-

card” or setting an upper limit on the number of high-priced hours (Chapman et al.,

2001; Faruqui and Mauldin, 2002). Furthermore, customer education, providing the

right technology and a simple and transparent design are key to foster adoptions of

such programs (Faruqui and Mauldin, 2002). Finally, energy policy should keep in

mind that customers not only differ according to their value perceptions of smart

metering but also according to their resources. Thus, policy makers should consider

some mechanism, like special loan programs, to ensure that e.g., fuel poor

households with low income can also adapt smart metering services and dynamic

prices and thus profit from the potential benefits (e.g., better feedback on

consumption and therefore potentially lower bills) (Darby, 2011).

6. LIMITATIONS AND RESEARCH OUTLOOK Our study is of explorative nature only and our sample approach comprises some

biases. Although our sample was a convenient sample and thus may not lead to a

fully representative sample, the approach is common practice and can be justified

from the point of view of conducting economic research (Orme, 2006; Weiers, 2005).

Furthermore, we were not able to collect socio-demographic data, which further limits

the representativeness of our results. We tried to overcome this shortcoming by

distributing the survey through different channels. Due to the lack of socio-

demographic data we further could not characterize the different segments found in

our study. Thus, it will be important in a next step to gain larger datasets and even

conduct cross-country studies for customer preferences of smart metering. Such

studies should also incorporate socio- and psycho-demographic criteria to further

sharpen our understanding of customer segments and they should measure the

impact of different legislative aspects on customer value. Additionally, it would be of

interest to conduct a different experimental setup, which allows us to observe actual

behavior (rather than an online-based experiment only). Such research would allow

us to validate the willingness-to-pay further and compare the conjoint results with

additional data (e.g., by the BDM-method as proposed by Wertenbroch and Skiera,

2002; Miller et al., 2011). Furthermore, other segmentation approaches, such as the

finite-mixture methodology (DeSarbo et al., 2001) could be used to validate our

findings. Also of interest would be to investigate which tariff leads to what change in

preferences and whether different pricing models (e.g., TOU) or the introduction of

22

demand response would change our findings on customer-perceived value and

willingness-to-pay. Finally, there is need for research that elaborates on customer-

perceived value in context and investigates how customer-perceived value of smart

metering can be aligned with a firm value perspective and, for instance, how it could

be transferred to actual business models.

23

REFERENCES Appelrath, H.J., Kagermann, H., Mayer C. (Eds.), 2012. Future Energy Grid. Migrationspfade ins

Internet der Energie. Acatech Studie Februar 2012. Retrieved 20 August 2012 from <http://www.acatech.de/fileadmin/user_upload/Baumstruktur_nach_Website/Acatech/root/de/Publikationen/Projektberichte/acatech_STUDIE_Future-Energy-Grid_120131_WEB_final.pdf>

Backhaus, K., Erichson, B., Plinke, W., Weiber, R., 2008. Multivariate Analysemethoden: Eine

anwendungsorientiere Einführung (12th ed.). Springer Verlag, Berlin. Belz, C., Bieger, T., 2006. Customer Value: Kundenvorteile schaffen Unternehmensvorteil. mi-

Fachverlag, München. Berekoven, L., Eckert, W., Ellenrieder, P., 2009. Marktforschung: Methodische Grundlagen und

praktische Anwendung (12th ed.). Gabler, Wiesbaden. Braunwalder, A., 2007. Energieeffizienz: Online-Beratung. Beobachter kompakt (Bauen & Wohnen) 81

(22), 16-24. Brosius, F., 2008. SPSS 16: das mitp-Standardwerk. Redline, Heidelberg. Burkhalter, A., Kaenzig, J., Wüstenhagen, R., 2009. Kundenpräferenzen für leistungsrelevante

Attribute von Stromprodukten. Zeitschrift für Energiewirtschaft 33 (2), 161-172. Chapman, B., Faruqui, A., Hansen, D., Holmes, C., 2001. Hedging Exposure to Volatile Retail

Electricity Prices. The Electricity Journal 14 (5), 33-38. Clastres, C., 2011. Smart grids: Another step towards competition, energy security and climate

change objectives. Energy Policy 39 (9), 5399–5408. Curtius, H. C., Kuenzel, K., Loock, M., 2012. Generic customer segments and business models for

smart grids. der markt 51 (2-3), 63-74. COM/2011/0370, 2011. Proposal for a Directive of the European Parliament and of the Council on

energy efficiency and repealing Directives 2004/8/EC and 2006/32/EC. Darby, S., 2010. Smart metering: what potential for householder engagement? Building Research &

Information 38 (5), 442-457. Darby, S., 2012. Metering: EU policy and implications for fuel poor households. Energy Policy 49, 98-

106. Davis, F.D., 1989. Perceived Usefulness, Perceived Ease of Use, and User Acceptance of Information

Technology. MIS Quarterly 13 (3), 319-340. DeSarbo, W.S., Jedidi, K., Sinha, I., 2001. Customer Value Analysis in a Heterogeneous Market.

Strategic Management Journal 22 (9), 845-857. Dibb, S., Stern, P., Wensley, R., 2002. Marketing knowledge and the value of segmentation.

Marketing Intelligence & Planning 20 (2), 113-119. Directive 2006/32/EC, 2006. Directive 2006/32/EC of the European parliament and of the council of 5

April 2006 on energy end-use efficiency and energy services and repealing Council Directive 93/76/EEC.

Elcom, 2010. Wie setzt sich der Strompreis zusammen? Retrieved 13 August 2010 from

<http://www.strompreis.elcom.admin.ch/>. ESMA, 2008. Definition of Smart Metering and Applications and Identifications of Benefits. European

Smart Metering Alliance (ESMA). Retrieved 27 Mai 2010 from <http://www.esma-home.eu/UserFiles/file/downloads/Final_reports/ESMA_WP2D3_Definition_of%20Smart_metering_and_Benefits_v1_1.pdf>.

24

ESMA, 2012. Smart Metering. Issues. European Smart Metering Alliance (ESMA). Retrieved 20

February 2012 from < http://www.esma-home.eu/smartMetering/issues.asp>. European Commission, 2005. Towards Smart Power Networks (ref# EUR 21970). Retrieved 14 April

2010 from <http://ec.europa.eu/research/energy/pdf/towards_smartpower_en.pdf>. European Commission, 2006. European SmartGrids Technology Platform. Vision and Strategy for

Europe’s Electricity Networks of the Future (ref# EUR 22040). Retrieved 14 April 2010 from <http://ec.europa.eu/research/energy/pdf/smartgrids_en.pdf>.

European Commission, 2011. The Commission’s new Energy Efficiency Directive. Retrieved 20

February 2012 from <http://europa.eu/rapid/pressReleasesAction.do?reference=MEMO/11/440&format=HTML&aged=0&language=en&guiLanguage=en>.

EWD - Elektrizitätswerke Davos, 2010. Strompreise ab 1. Januar 2010. Retrieved 7 July 2010 from

<http://www.ewd.ch/dynasite.cfm?dsmid=79413>. Faruqui, A., Chao, H.P., Niemeyer, V., Platt, J.,Stahlkopf, K., 2001. Getting out of the dark. Regulation

24 (3), 58-62.. Faruqui, A., Mauldin, M., 2002. The barriers to real-time pricing: Separating fact from fiction. Public Utilities Fortnightly 140 (14), 30-40. Faruqui, A., Hledik, R., Sergici, S., 2009. Piloting the Smart Grid. The Electricity Journal 22 (7), 55-69. Faruqui, A., Harris, D., Hledik, R., 2010. Unlocking the €53 billion savings from smart meters in the

EU: How increasing the adoption of dynamic tariffs could make or break the EU’s smart grid investment. Energy Policy 38 (10), 6222-6231.

Faruqui, A., Sergici, S., 2010. Household response to dynamic pricing of electricity: a survey of 15

experiments. Journal of Regulatory Economics 38, 193-225. Forsa, 2010. Erfolgsfaktoren von Smart Metering aus Verbrauchersicht. Retrieved 7 July 2010 from

<http://www.vzbv.de/mediapics/smart_metering_studie_05_2010.pdf>. Giordano, V., Fulli, G., 2012. A business case for Smart Grid technologies: A systemic perspective.

Energy Policy 40 (1), 252-259. Green, P.E., Srinivasan, V., 1990. Conjoint Analysis in Marketing: New Developments with

Implications for Research and Practice. The Journal of Marketing 54 (4), 3-19. Gustafsson, A., Herrmann, A., Huber, F., 2007. Conjoint Measurement Methods and Applications 4th

ed. Springer, Berlin. Herter, K., 2007. Residential implementation of critical-peak pricing of electricity. Energy Policy 35 (4),

2121-2130. Holbrook, M.B. (Ed.), 1999. Consumer Value. A framework for analysis and research. Routledge,

London. Honebein, P.C., Cammarano, R.F., Donnelly, K.A., 2009. Will Smart Meters Ripen or Rot? Five First

Principles for Embracing Customers as Co-Creators of Value. The Electricity Journal 22 (5), 39-44.

Kim, H.-W., Chan, H.C., Gupta, S., 2007. Value-based Adoption of Mobile Internet: An empirical

investigation. Decision Support Systems 43 (1), 111-126. Kotler, P., 1997. Marketing Management: Analysis, Planning and Control. 9th edn. Prentice Hall,

Upper Saddle River, NJ.

25

Kranz, J., Gallenkamp, J., Picot, A.O., 2010. Exploring the Role of Control - Smart Meter Acceptance of Residential Consumers. Proceedings of the 16th American Conference on Information Systems (AMCIS) Lima (August 12-15, 2010), 1-9.

Leeds, D.J., 2009. The Smart Grid in 2010: Market Segments, Applications and Industry Players.

Retrieved 12 March 2010 from <http://www.gtmresearch.com/report/smart-grid-in-2010>. Loock, M., 2012. Going beyond best technology and lowest price: on renewable energy investors'

preference for service-driven business models. Energy Policy 40, 21-27. Louviere, J.J., Hensher, D.A., Swait, J.D., Adamowicz, W., 2003. Stated choice methods analysis and

applications. Cambridge University Press, Cambridge. Marvin, S., Chappels, H., Guy, S., 1999. Pathways of smart metering development: shaping

environmental innovation. Computers, Environment and Urban Systems 23 (2), 109-126. Miller, K.M., Hofstetter, R., Krohmer, H., Zhang, Z.J., 2011. How Should Consumers' Willingness to

Pay Be Measured? An Empirical Comparison of State-of-the-Art Approaches. Journal of Marketing Research 48 (1), 172-184.

Morris, M., Schindehutte, M., Allen, J., 2005. The entrepreneur's business model: toward a unified

perspective. Journal of Business Research 58 (6), 726-735. Neenan, B., Hemphill, R.C., 2008. Societal Benefits of Smart Metering Investments. The Electricity

Journal 21 (8), 32-45. Orme, B., 2006. Getting started with conjoint analysis: strategies for product design and pricing re-

search. Research Publishers, Madison. Orme, B., 2010. Sample Size Issues for Conjoint Analysis. In: Orme, B. (Ed.) Getting Started with

Conjoint Analysis: Strategies for Product Design and Pricing Research 2nd ed. Research Publishers, Madison.

Parasuraman, A., 1997. Reflections on Gaining Competitive Advantage Through Customer Value.

Journal of the Academy of Marketing Science 25 (2), 154-161. Punj, G., Stewart, D.W., 1983. Cluster Analysis in Marketing Research: Review and Suggestions for

Application. Journal of Marketing Research 20 (2), 134-148. Ruiz, D.M., Castro, C.B., Armario, E.M., 2007. Explaining Market Heterogeneity in Terms of Value

Perceptions. The Service Industries Journal 27 (8), 1087-1110. Ryberg, T., 2010. Smarte Metering in Western Europe. M2M Research Series 2010. BERG INSIGHT,

Gothenburg. Sammer, K., Wüstenhagen, R., 2006. The influence of eco-labeling on consumer behavior – results of

a discrete choice analysis for washing machines. Business Strategy and the Environment 15 (3), 185–199.

Sawtooth Software, 2009. The CBC/HB System for Hierarchical Bayes Estimation Version 5.0

Technical Paper. Retrieved 14 August 2010 from <http://www.sawtoothsoftware.com/education/techpap.shtml>.

Schaich, E., 1990. Schätz- und Testmethoden für Sozialwissenschaftler (2nd ed.). Vahlen, München. Schira, J., 2005. Statistische Methoden der VWL und BWL – Theorie und Praxis (2nd ed.). Pearson

Studium, München Schweizerischer Bundesrat, 2011. Energy Perspective 2050 – Federal Council’s analysis of the

options for provision of electricity. Fact Sheet. Retrieved 20 February from <http://www.bfe.admin.ch/themen/00526/00527/index.html?lang=en&dossier_id=05024>.

26

SFOE, 2009. Smart Metering für die Schweiz – Potenziale, Erfolgsfaktoren und Massnahmen für die Steigerung der Energieeffizienz (Publ. Nr. 290085). Retrieved 3 June 2010 from <http://www.bfe.admin.ch/dokumentation/energieforschung/index.html?height=400&lang=en&publication=10248&width=600>.

SFOE, 2011. Grundlagen für die Energiestrategie des Bundesrates; Frühjahr 2011. Retrieved 20

February 2012 from <http://www.bfe.admin.ch/themen/00526/00527/index.html?lang=en&dossier_id=05024>.

SFOE, 2012. Folgeabschätzung einer Einführung von «Smart Metering» im Zusammenhang mit

«Smart Grids» in der Schweiz. Retrieved 20 August from <http://www.news.admin.ch/NSBSubscriber/message/attachments/27519.pdf>

Sheth, J.N., Newman, B.I., Gross, B.L., 1991. Why We Buy What We Buy: A Theory of Consumption

Values. Journal of Business Research 22 (2), 159-170. Slater, S., 1997. Developing a Customer Value-based Theory of the Firm. Journal of the Academy of

Marketing Science 25 (2), 162-167. Stromback, J., Dromacque, C., Yassin, M.H., 2011. The potential of smart meter enabled programs to

increase energy and systems efficiency: a mass pilot comparison. Short name: Empower Demand. Vaasaett, Global Energy Think Tank. Retrieved 20 September 2011 from <http://www.esmig.eu/press/filestor/empower-demand-report.pdf>.

Train, K.E., 2003. Discrete Choice Methods with Simulation. Cambridge University Press, Cambridge. Weiers, R.M., 2005. Introduction to Business Statistics (5th ed.). Thomson Brooks / Cole, Belmont. Wertenbroch, K., Skiera, B., 2002. Measuring Consumers’ Willingness to Pay at the Point of

Purchase. Journal of Marketing Research 39 (2), 228-241. Wiedmann, K.-P., Hennigs, N., Siebels, A., 2009. Value-Based Segmentation of Luxury Consumption

Behavior. Psychology & Marketing 26 (7), 625-651. Wolsink, M., 2012. The research agenda on social acceptance of distributed generation in smart grids:

Renewable as common pool resources. Renewable and Sustainable Energy Reviews 16 (1), 822-835.

Woodruff, R., 1997. Customer Value: The Next Source for Competitive Advantage. Journal of the

Academy of Marketing Science 25 (2), 139-153. Wüstenhagen, R., Wolskin, M., Bürer, M.J., 2007. Social acceptance of renewable energy innovation:

An introduction to the concept. Energy Policy 35 (5), 2683-2691. Zeithaml, V.A., 1988. Consumer Perceptions of Price, Quality, and Value: A Means-End Model and

Synthesis of Evidence. The Journal of Marketing 52 (3), 2-22.

27

Endnotes 1 Sawtooth Software is a standard software for designing and analyzing conjoint

studies. Further information can be found under http://www.sawtoothsoftware.com/

2 Due to dummy coding the part-worth values sum up to zero. Thereby negative

values do not claim the attribute to be not attractive for customers, it only states that

other attributes of smart metering are preferred by customers. Further, the values

cannot be compared across different attributes (Sawtooth Software, 2009). 3 Our study and the experiment are of explorative nature only. This is mainly given

through the still relative small sample size and the convenience we report from.

Especially for the calculation of willingness-to-pay, we acknowledge that marketing

scholars recently point to the necessity to combine conjoint-based approaches with

additional data e.g. derived by the Becker-DeGroot-Marschak method (BDM)

(Wertenbroch and Skiera, 2002; Miller et al., 2011). However, customer preferences

for smart metering are an urgent topic for energy policy and for research economic

reasons, we suggest that researchers rely on conjoint data, as BDM data may only

hardly be collected.

4 As mentioned in endnote three, we cannot conclude that our estimation of

willingness-to-pay is correct due to the explorative nature of the experiment.

Furthermore, to get a realistic picture of the willingness-to-pay, other methods need

to be combined with our method (Wertenbroch and Skiera, 2002; Miller et al., 2011).

Thus, the here mentioned calculation solemnly exemplarily demonstrates how to

combine willingness-to-pay and total costs for smart metering and how to compare

them for calculating time to break even.

5 We refrained from calculating the willingness-to-pay for each segment. However

this can easily been done by using the formula provided in Section 4.2.

28

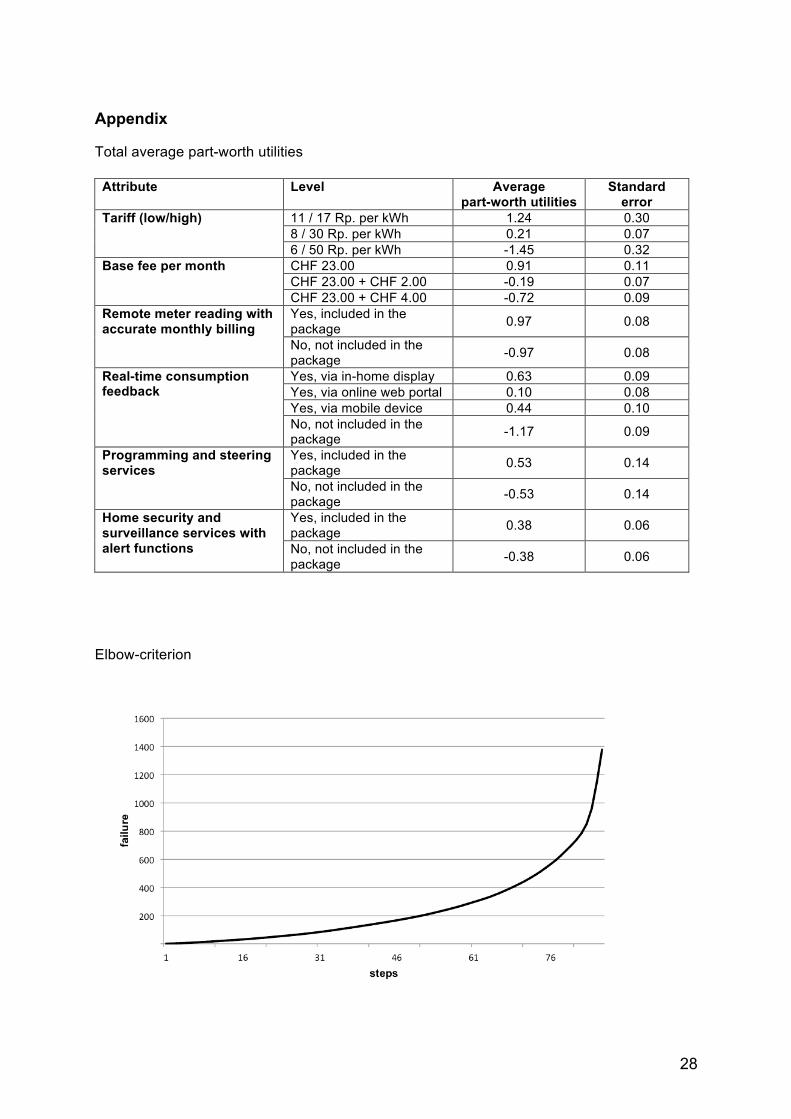
Appendix Total average part-worth utilities

Attribute Level Average part-worth utilities

Standard error

Tariff (low/high) 11 / 17 Rp. per kWh 1.24 0.30 8 / 30 Rp. per kWh 0.21 0.07 6 / 50 Rp. per kWh -1.45 0.32

Base fee per month CHF 23.00 0.91 0.11 CHF 23.00 + CHF 2.00 -0.19 0.07 CHF 23.00 + CHF 4.00 -0.72 0.09

Remote meter reading with accurate monthly billing

Yes, included in the package 0.97 0.08

No, not included in the package -0.97 0.08

Real-time consumption feedback

Yes, via in-home display 0.63 0.09 Yes, via online web portal 0.10 0.08 Yes, via mobile device 0.44 0.10 No, not included in the package -1.17 0.09

Programming and steering services

Yes, included in the package 0.53 0.14

No, not included in the package -0.53 0.14

Home security and surveillance services with alert functions

Yes, included in the package 0.38 0.06

No, not included in the package -0.38 0.06

Elbow-criterion

29

Part-worth utilities per cluster and homogeneity of the clusters

Attribute Level Cluster 1 (homogeneity)

Cluster 2 (homogeneity)

Cluster 3 (homogeneity)

Cluster 4 (homogeneity)

Tariff (low/high) 11 / 17 Rp. per kWh

4.01 (0.601*)

0.26 (0.327)

-1.63 (0.537)

0.86 (0.298)

8 / 30 Rp. per kWh

0.51 (0.737)

-0.15 (0.570)

0.02 (0.837)

0.49 (0.655)

6 / 50 Rp. per kWh

-4.51 (0.382)

-0.11 (0.346)

1.61 (0.491)

-1.34 (0.457)

Base fee per month

CHF 23.00 1.77 (0.328)

1.03 (0.570)

0.26 (1.000)

-0.22 (0.316)

CHF 23.00 + CHF 2.00

-0.62 (0.437)

-0.31 (0.859)

0.22 (0.994)

0.39 (0.388)

CHF 23.00 + CHF 4.00

-1.15 (0.504)

-0.72 (0.839)

-0.48 (0.833)

-0.17 (0.820)

Remote meter reading with accurate monthly billing

Yes, included in the package

0.80 (0.911)

1.44 (0.589)

1.23 (0.801)

0.33 (0.373)

No, not included in the package

-0.80 (0.911)

-1.44 (0.589)

-1.23 (0.801)

-0.33 (0.373)

Real-time consumption feedback

Yes, via in-home display

0.78 (0.991)

0.23 (0.615)

0.53 (0.871)

1.17 (0.984)

Yes, via online web portal

-0.08 (0.617)

0.41 (1.049)

0.38 (0.888)

-0.42 (0.738)

Yes, via mobile device

0.65 (0.391)

0.90 (0.902)

-0.71 (0.418)

0.57 (0.925)

No, not included in the package

-1.35 (0.359)

-1.53 (0.450)

-0.20 (0.992)

-1.32 (0.963)

Programming and steering services

Yes, included in the package

-0.01 (0.354)

1.94 (0.578)

0.45 (0.673)

-0.76 (0.212)

No, not included in the package

0.01 (0.354)

-1.94 (0.578)

-0.45 (0.673)

0.76 (0.212)

Home security and surveillance services with alert functions

Yes, included in the package

0.04 (0.210)

0.36 (0.569)

0.44 (0.992)

1.27 (0.944)

No, not included in the package

-0.04 (0.210)

-0.36 (0.569)

-0.44 (0.992)

-1.27 (0.944)

* = F(A,G)


Recommended