I T X W Cross-Industry Working Team October 1998 Customer View of Internet Service Performance: Measurement Methodology and Metrics Alcatel Telecom American Management Systems Ameritech AT&T Bell Atlantic Bellcore BellSouth Cisco Citicorp Compaq Corning CyberCash EarthLink Network Ericsson GTE Laboratories Hewlett-Packard Houston Associates Hughes Network Systems IBM Intel InterTrust Inverse Network Technologies Kaiser Permanente Lucent Technologies MCI Communications Motorola National Institute for Standards and Technology New York Times Nortel (Northern Telecom) Novell Philips Research Briarcliff Pitney Bowes QuantumLink Real Networks Science Applications International Corporation SBC Technology Resources Sun Microsystems Texas Instruments USWest West Group
Transcript
I
T
X
W
Cross-IndustryWorking Team
October 1998
Customer View of InternetService Performance:Measurement Methodology
and MetricsAlcatel Telecom
American Management Systems
Ameritech
AT&T
Bell Atlantic
Bellcore
BellSouth
Cisco
Citicorp
Compaq
Corning
CyberCash
EarthLink Network
Ericsson
GTE Laboratories
Hewlett-Packard
Houston Associates
Hughes Network Systems
IBM
Intel
InterTrust
Inverse Network Technologies
Kaiser Permanente
Lucent Technologies
MCI Communications
Motorola
National Institute for Standards and Technology
New York Times
Nortel (Northern Telecom)
Novell
Philips Research Briarcliff
Pitney Bowes
QuantumLink
Real Networks
Science Applications International Corporation
SBC Technology Resources
Sun Microsystems
Texas Instruments
USWest
West Group
I
T
X
W
Cross-IndustryWorking Team
August 1994
Customer View of InternetService Performance:Measurement Methodology
The Internet is increasingly critical for conducting business and engaging in commercialtransactions. Consequently, attention is being focused on reliability and performance issues,and customers are being driven to negotiate service guarantees with their Internet serviceproviders (ISPs). Such negotiations can be complex and time consuming: they are complicat-ed by a lack of common definitions for metrics and a similar lack of agreed-upon method-ologies for measuring and monitoring compliance. Furthermore, addressing these issues onan ad hoc basis between individual customers and ISPs is highly duplicative and could resultin a large increase in Internet measurement traffic.
Through the promulgation of a common set of metrics and a common measurement method-ology to assess, monitor, negotiate, and test compliance for service quality, a significantreduction in time and associated costs can be achieved and numerous benefits realized—for both ISPs and their customers.
A measurement architecture, measurement methodology, and common set of metrics are proposed in this paper. By limiting the scope to metrics and scenarios that are the mostmeaningful, a feasible architecture and methodology are derived; examples are given show-ing how they can be applied to assessing, monitoring, and testing compliance of servicequality. It is expected that the application of this methodology will lead to improved Internetperformance and foster greater cooperation between customers and ISPs.
1.0 Introduction
For large corporations and small businesses, government and private organizations, educa-tional institutions, consumers, and individuals, the Internet has become an integral means for conducting business, engaging in commercial activities, and simply communicating.Increasingly, the Internet is being viewed as critical infrastructure (PCCIP 1997), and itscontribution to economic output is growing.
As reliance on the Internet increases, expectations for reliability also increase. These expec-tations are driving customers to negotiate with their Internet service providers (ISPs) forguarantees that will meet customer requirements for specific quality-of-service levels.1
This, however, poses a number of problems. First, users’ perception of service quality canextend “end-to-end”; that is, remote networks that extend beyond the responsibility of thecustomer’s ISP can dictate application-level service quality. Second, reaching agreement canbe a complex and time-consuming task, encumbered by the myriad possible metrics thatdefine service quality and the lack of any common definitions for these metrics. Third, thereare no agreed-upon methodologies in place for measuring and monitoring negotiated metricsfor compliance.
Customer View of Internet Service Performance: Measurement Methodology and Metrics Abstract
Cross-Industry Working Team 1
1 Throughout this paper, we distinguish between an end-userand an ISPcustomer.The end-user is an individualwho uses the ISP’s services to access the Internet (browse the Web, for example); an ISP customer is a larger entity,such as a corporation, that pays the ISP to provide Internet services to its end-users (employees, for example).
If these problems are addressed on an ad hoc basis between each customer and its ISP, thenthe evaluation of performance and service quality will lead to a great duplication of effortand a large increase in measurement traffic. A common set of metric definitions and a com-mon measurement methodology would significantly reduce these multiple independentefforts (and their associated costs) while facilitating the specification of service level require-ments between a customer and an ISP, as well as the dissemination by an ISP (to its cus-tomers) of data on service quality.
This paper is intended as a first step in promulgating a common set of metrics and a com-mon measurement methodology that can be used to assess, monitor, negotiate, and test compliance of service quality. The intended audience is ISPs and customers of ISPs. The hope is that the application of the metrics and methodology will lead to improvedInternet performance and foster greater cooperation between customers and service providers.2
Adaptation of common metrics and methodologies has specific advantages for both an ISPand its customers. Benefits to an ISP include the following:
• faster identification of performance problems, leading to better service for all customers;
• a means for providing evidence that service degradations are beyond the ISP’s bound-aries and thus the information needed to work with other ISPs to help resolve problems;
• a common language to facilitate the diagnosis and resolution of service-related prob-lems;
• a means for differentiating service offerings from other ISPs; and
• a reduction in measurement traffic on the network—achieved by collecting commonmeasurement data sets that can be shared—and consequent reduction in the need forindependent measurements by customers.
For the customer, the benefits include:
• the opportunity to shift some of the task of monitoring and measuring service perfor-mance to the ISP,
• mechanisms for auditing the performance of a service provider,
• methods for quickly troubleshooting network problems and a means to better cooperatewith ISPs to resolve these problems, and
• the ability to compare ISP service quality and make price-performance tradeoffs.
Additionally, both ISPs and their customers will benefit from the fact that less time will beneeded to reach agreement on negotiated levels of service.
The metrics defined in this paper can be measured and monitored to determine service quality levels and, if necessary, used for auditing compliance with a negotiated and mutuallyagreed-upon contract. While such a model of cooperation is expected to be mutually benefi-cial, the metrics and methodology presented here are not to be limited to such a scenario:
Customer View of Internet Service Performance: Measurement Methodology and Metrics 1.0 Introduction
Cross-Industry Working Team2
1.1 Benefits
1.2 Scope
2 Measurements based on these metrics and this methodology are being collected by XIWT; results will be madeavailable at a later date.
they can also be used to monitor intranets or service quality outside the domain of the customer’s ISP. This paper focuses on metrics that relate to the network; application-levelmetrics are deferred to a future publication.
Several fundamental assumptions about these metrics are needed to ensure their relevanceand to limit the scope of this effort to a practical level:
• The metrics are indicative of the quality of service perceived by the end-user; the metricvalues (measurements) are directly or indirectly affected by the quality of serviceoffered by the ISP.
• Cooperation by an ISP is not a prerequisite to obtaining relevant and meaningful mea-surement data.
• The customer has direct dedicated access to a service provider (via a premises router).This consequently excludes dialup, ADSL, and cable modem users, for example.Nondedicated access will be considered in a future study.
• Service quality can mean different things to different users. The metrics must be broadand include both performance- and reliability-oriented measures.
Initially, active testing and measurement—in which traffic is introduced in order to collectdata—will be the basis for assessing service quality. Passive measurement—in which mea-surement data are derived from normal Internet traffic—will be the subject of a future studyand may be incorporated after careful validation and after appropriate monitoring tools aredeveloped.
Several other efforts are also under way that seek to define metrics for Internet quality ofservice. It is our intent to complement and build on these efforts, and to collaborate withthem as appropriate, in order to meet the goals of improving Internet performance andencouraging greater cooperation between ISPs and their customers.
1.3.1 Internet Engineering Task Force (IETF)
IETF’s Internet Protocol Performance Metrics Working Group (IPPM WG) is developing aset of standard metrics that can be applied to the quality, performance, and reliability ofInternet data delivery services. While the working group will define specific metrics, actualimplementations and applications are beyond its scope; rather, IPPM WG will promote thesharing of effective tools and procedures for measuring these metrics. The metrics will bedefined so that the tools can be used by network operators, end-users, and/or independenttesting groups.
IPPM WG has work in progress that defines a general framework for developing specific IP-level metrics (Paxson et al. 1998). To the greatest extent possible, our metrics andmethodology will build on this framework.
1.3.2 Automotive Industry Action Group (AIAG)
AIAG’s Automotive Network Exchange (ANX) effort aims to provide a large virtual privatenetwork for interconnecting automotive industry trading partners. This network of certifiedand monitored providers has been designed to reduce the data communication costs of thetrading partners while meeting quality of service requirements in the areas of performance,
Customer View of Internet Service Performance: Measurement Methodology and Metrics 1.0 Introduction
Cross-Industry Working Team 3
1.3 Related Work
reliability, security, and administration and management (AIAG 1997). Service quality ischaracterized by requirements for mission-critical business-to-business communications.
AIAG has developed metrics and stringent requirements (AIAG 1997) focused on the specif-ic needs of the trading partners. Specialized measurement tools (hardware and software) areneeded to collect data for the metrics defined. Our effort, in contrast, is intended to be moregeneric and applicable to the general customer. The use of specialized hardware is specifical-ly avoided.
1.3.3 T1A1
The T1A1 Network Survivability Performance Working Group, T1A1.2, studies networksurvivability performance by establishing a framework for measuring service outages and aframework for classifying network survivability techniques and measures. T1A1.2 is address-ing the challenges posed by the Internet in maintaining a highly available, reliable, and sur-vivable public switched telephone network (PSTN) (T1A1.2 1998a). T1A1.2 is also consid-ering the impacts of the interaction between the PSTN and the Internet and addressing theseimpacts from an end-user’s perspective. As part of its work, T1A1.2 will describe parametersfor quantifying network failures and methods for measuring these parameters (T1A1.2 1998b).
This work is potentially related to the present efforts through its specification of and mea-surement methodology for reliability objectives.
Another T1A1 working group, the Performance of Digital Networks and Services WorkingGroup (T1A1.3), is developing standards and technical reports describing performance anddata services, and their multimedia integration within U.S. telecommunications networks(T1A1.3 1998). A current T1A1.3 project (T1A1-14) addresses the specification and alloca-tion of Internet service performance, but no output documents will be available before thethird quarter of 1998.
1.3.4 ITU-T Study Group 13
ITU-T Study Group 13 has developed Recommendation I.380, Internet Protocol DataCommunication Service—IP Packet Transfer and Availability Performance Parameters. This recommendation is currently in its final form and is targeted for ITU-T approval inFebruary 1999. Ongoing work related to Internet service performance will harmonize withRecommendation I.380 as appropriate.
1.3.5 Other Efforts
The National Internet Measurement Infrastructure (NIMI) effort (Mahdavi et al. 1997)uses software methodologies and tools as a vehicle for testing measurement strategies and asthe basis for a ubiquitous infrastructure (i.e., one that is readily available and easy todeploy). The challenges NIMI seeks to address include the following:
Scaling—How to deal with millions of nodes and with costs for end-to-end measurementsthat increase as the square of the number of nodes.
Mapping—How to discover the topology needed for path decomposition and the statisticaldistribution of end-to-end tests.
Customer View of Internet Service Performance: Measurement Methodology and Metrics 1.0 Introduction
Cross-Industry Working Team4
Optimization—How to minimize the amount of measurement traffic while maximizing thevalue of the data.
Result distribution—What techniques, such as caching, should be employed for scalabledata movement.
NIMI is especially aimed at solving the broader, longer term issues that will arise whenmany entities are involved in measuring and characterizing Internet performance. Until aubiquitous infrastructure is available, focused efforts such as ours will be needed. By con-centrating on the customer-ISP relationship, our initiative will help define the types of mea-surements NIMI will need to address.
Surveyor is a joint initiative of Advanced Network & Services, Inc. (ANS), and theCommon Solutions Group, a collaboration of 23 universities jointly addressing challenges to networking (ANS 1997). Surveyor is focused on an early implementation of metrics developed within IPPM WG. Measurement devices (Surveyor tools) will be deployed ateach university, and several traffic measurements will be taken from these sites, includingestimates of one-way delay and packet loss. The measurement devices are PCs (runningFreeBSD) equipped with GPS antennae to provide accurate (±50 microsecond) time stamps.A database system is being developed to analyze data and permit Web-based access by par-ticipants. This initiative parallels our own measurement effort, with the major differencesbeing the nature of the participants (XIWT comprises corporations and government organi-zations); the types of tools used (ours comprise tools developed by the high-energy physicscommunity); and, to some extent, the types of traffic measurements (XIWT will focus ini-tially on round trip delay and packet loss).
The remainder of this paper is organized as follows. Section 2.0 defines the XIWT measure-ment architecture and methodology. These are motivated by a set of ideal requirements, anassumed generic topology, and a set of usage scenarios representative of how users accessdata. Examples of how the measurement methodology can be applied to typical usage sce-narios are also provided. In section 3.0, definitions of the relevant performance and reliabili-ty metrics—measurable using the methodology described in section 2.0—are provided.Guidelines for aggregating measurements to provide useful estimates of long-term perfor-mance and details on the techniques for measuring and computing the metrics are also given.Section 4.0 provides a summary and an outline of future work.
2.0 Measurement Methodology
Ideally, a measurement methodology should meet the following requirements:
Isolate sources of problems—Since one of the motivating factors for defining the metrics isto isolate sources of problems in end-to-end service, the measurement methodology shouldhelp identify administrative domains responsible for the problem, thus ensuring account-ability. For example, measurements should isolate whether the problem is within an ISP’sdomain, and, if so, should indicate components that may be the cause of the problem.
Customer View of Internet Service Performance: Measurement Methodology and Metrics 2.0 Measurement Methodology
Cross-Industry Working Team 5
1.4 Organization ofThis Paper
2.1 Requirements
Provide meaningful results—The results must facilitate communication between customersand operators. Thus, for example, while a “router queue length” metric may be very mean-ingful to an operator, it is unlikely to be used by an ISP customer. The customer may bemore interested in a “packet loss” or “response time” metric.
Not require new infrastructure—It should be possible to make the measurements usingexisting infrastructure. Although there may be cases where operators or customers mayinstall measurement instruments for improved efficiency or ease of administration, themethodology itself should not require this.
Avoid unnecessary or duplicate measurements/traffic—Measurements that are required to meet multiple customer/ISP needs should not be replicated; instead, the results should be shared as appropriate. This ensures that nonvalue-added traffic is minimized over the network.
Be auditable—Since the intent of the measurements is to communicate service quality metrics between suppliers and consumers, the architecture should support independent measurement and validation.
Be robust—Because a large part of the reason for measurement is to detect and correctproblems, the methodology must be robust in the presence of faults and should containchecks to ensure measurement accuracy.
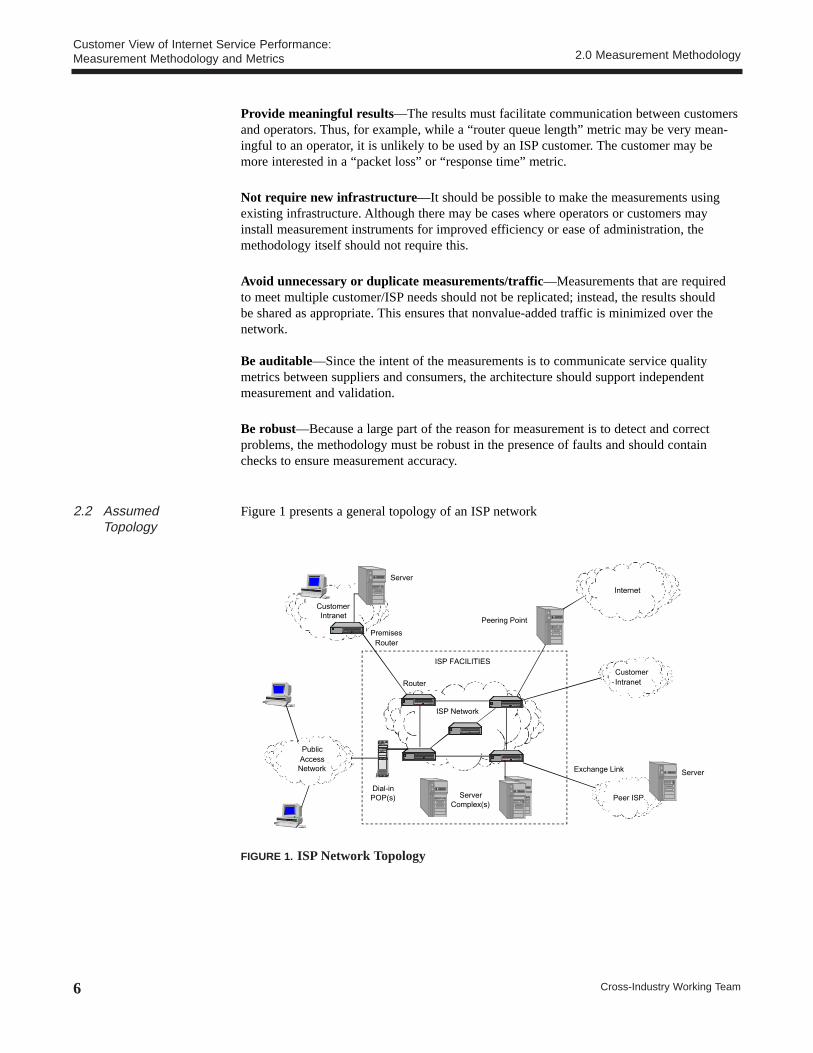
Figure 1 presents a general topology of an ISP network
FIGURE 1. ISP Network Topology
PublicAccessNetwork
Internet
Router
Dial-inPOP(s) Server
Complex(s)
Peering Point
CustomerIntranet
ISP Network
ISP FACILITIES
CustomerIntranet
Peer ISP
Exchange Link
PremisesRouter
Server
Server
Customer View of Internet Service Performance: Measurement Methodology and Metrics 2.0 Measurement Methodology
Cross-Industry Working Team6
2.2 AssumedTopology
In the figure, we assume that the ISP network consists of a number of routers communi-cating over links (an IP “cloud”). The ISP has servers providing services (DNS, e-mail, Webhosting) on hosts inside server complexes that are connected to the IP cloud and one or morePOPs for dialup connections from the public access network. The IP cloud controlled by theISP is connected to the other parts of the Internet either through peering points (e.g., publicNAPs) or through exchange links based on private peering arrangements. The ISP also pro-vides IP services to customers through dedicated links. As mentioned above, nondedicatedaccess is not considered in this paper; therefore, measurements of the public access networkare not discussed. We consider that the ISP boundary is demarcated at the premises routerslocated at the customer’s facilities and at the ISP border routers at public or private peeringpoints.3 The methodology and metrics defined below can easily accommodate other demar-cation points.
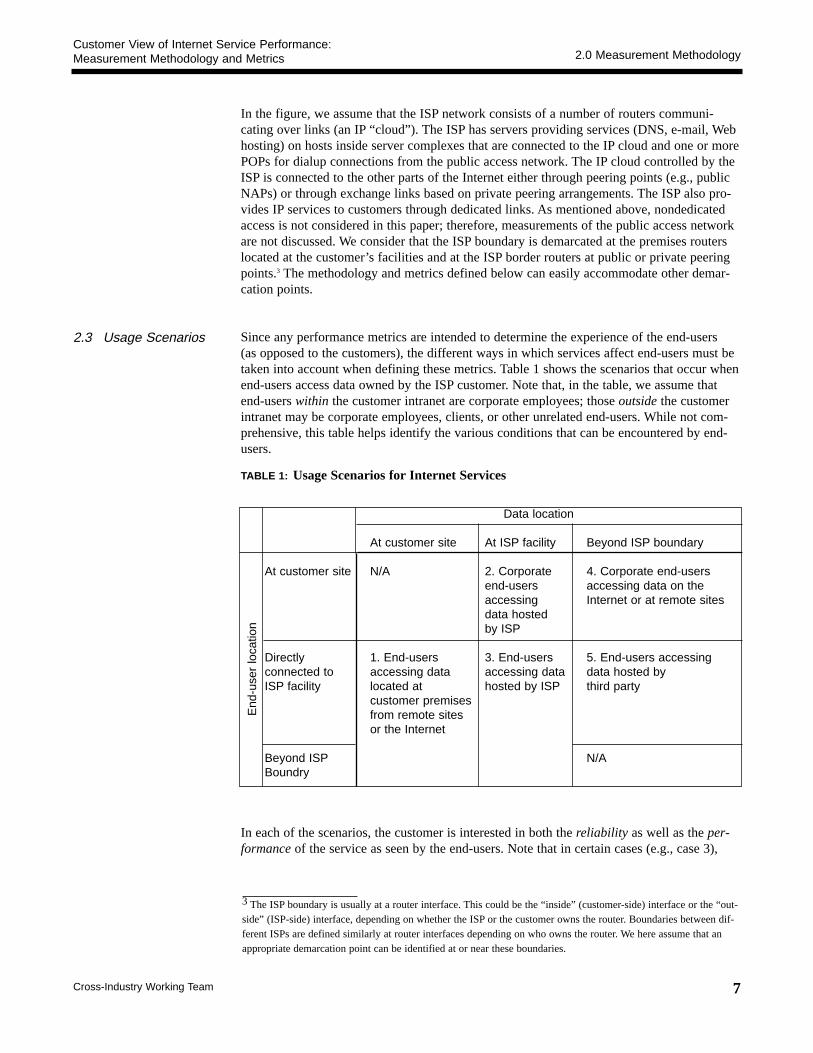
Since any performance metrics are intended to determine the experience of the end-users (as opposed to the customers), the different ways in which services affect end-users must betaken into account when defining these metrics. Table 1 shows the scenarios that occur whenend-users access data owned by the ISP customer. Note that, in the table, we assume thatend-users within the customer intranet are corporate employees; those outside the customerintranet may be corporate employees, clients, or other unrelated end-users. While not com-prehensive, this table helps identify the various conditions that can be encountered by end-users.
TABLE 1: Usage Scenarios for Internet Services
In each of the scenarios, the customer is interested in both the reliability as well as the per-formanceof the service as seen by the end-users. Note that in certain cases (e.g., case 3),
Customer View of Internet Service Performance: Measurement Methodology and Metrics 2.0 Measurement Methodology
Cross-Industry Working Team 7
Data location
At customer site At ISP facility Beyond ISP boundary
At customer site N/A 2. Corporate 4. Corporate end-usersend-users accessing data on theaccessing Internet or at remote sitesdata hosted by ISP
Directly 1. End-users 3. End-users 5. End-users accessingconnected to accessing data accessing data data hosted byISP facility located at hosted by ISP third party
customer premises from remote sites or the Internet
Beyond ISP N/ABoundry
End
-use
r lo
catio
n
2.3 Usage Scenarios
3 The ISP boundary is usually at a router interface. This could be the “inside” (customer-side) interface or the “out-side” (ISP-side) interface, depending on whether the ISP or the customer owns the router. Boundaries between dif-ferent ISPs are defined similarly at router interfaces depending on who owns the router. We here assume that anappropriate demarcation point can be identified at or near these boundaries.
there is no direct way for the customer to measure service from its site—it has to rely onmeasurements made by the ISP or some third party, or rely on users to notify the ISP that thedata are not accessible.
These scenarios demonstrate that end-to-end service quality depends on the ISP facilities,customer facilities, and—in many instances—on elements that are outside the control ofether party.
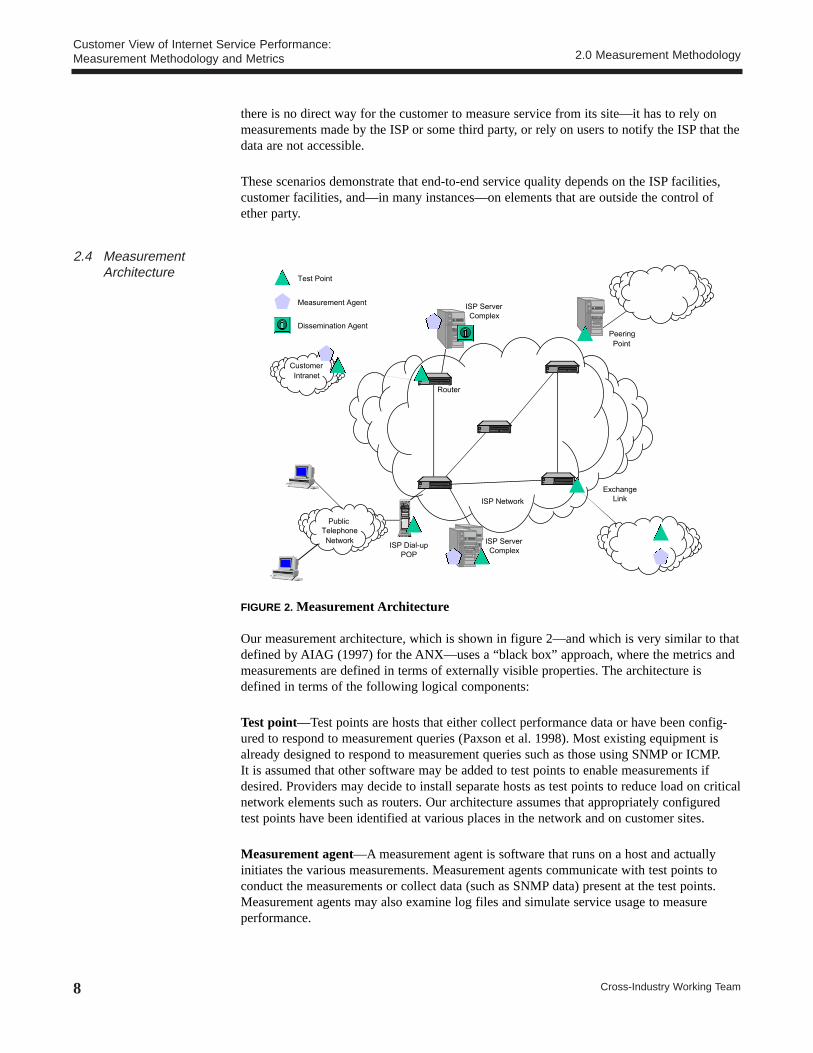
FIGURE 2. Measurement Architecture
Our measurement architecture, which is shown in figure 2—and which is very similar to thatdefined by AIAG (1997) for the ANX—uses a “black box” approach, where the metrics andmeasurements are defined in terms of externally visible properties. The architecture isdefined in terms of the following logical components:
Test point—Test points are hosts that either collect performance data or have been config-ured to respond to measurement queries (Paxson et al. 1998). Most existing equipment isalready designed to respond to measurement queries such as those using SNMP or ICMP. It is assumed that other software may be added to test points to enable measurements ifdesired. Providers may decide to install separate hosts as test points to reduce load on criticalnetwork elements such as routers. Our architecture assumes that appropriately configuredtest points have been identified at various places in the network and on customer sites.
Measurement agent—A measurement agent is software that runs on a host and actually initiates the various measurements. Measurement agents communicate with test points toconduct the measurements or collect data (such as SNMP data) present at the test points.Measurement agents may also examine log files and simulate service usage to measure performance.
PublicTelephoneNetwork
CustomerIntranet
ISP ServerComplex
PeeringPoint
ISP ServerComplex
ISP Dial-upPOP
ExchangeLinkISP Network
Router
Measurement Agent
Test Point
Dissemination Agent
Customer View of Internet Service Performance: Measurement Methodology and Metrics 2.0 Measurement Methodology
Cross-Industry Working Team8
2.4 MeasurementArchitecture
Dissemination agent—A dissemination agent provides, to interested parties, the results ofthe measurements that have been collected. The actual form/format of, and mechanisms for,this information dissemination are left open. Based on need, the results from various agentsmay be combined/correlated before dissemination or may be left in a “raw” form. The pro-cess by which data are transferred from the measurement agent to the dissemination agent isalso left to the implementation.
We assume that appropriately configured test points can be identified (or located) as neededto enable measurements. Measurement agents may run on both the customer site as well ason the ISP network and server complexes. In many instances, both the measurement agentand the test point may be co-located on the same host.
For each measure of interest, the location of both the measurement agent as well as the testpoints used are specified along with the metric. This defines exactly what is being measuredand within which domain(s) the responsibility for maintaining performance lies. Proper iden-tification of measurement agents and test points allows different parts of the network or ser-vice to be tested independently, and thus allows problems to be isolated to specific segmentsof the network.4 In particular,if test points exist at administrative boundaries, it may be pos-sible to isolate problems to either inside or outside those boundaries. This lets providersoffer service guarantees to customers for their part of the service, even when the end-to-endservice spans multiple providers.
As part of its operations, the ISP’s staff needs to monitor the health of the network and otherservices provided by the ISP. Thus, we assume that the ISP can run measurement agents onvarious network hosts and configure various network and service elements as test points. By making some of these measurements available through a dissemination agent (e.g., byproviding the measurement summary data at a Web site), the ISP can provide the results ofthese tests to its customers and peers.
Even if customers rely on the ISP for most measurements, they may conduct their own measurements (1) to validate (audit) the results provided by the ISP, and (2) to measureitems of interest to them that are not being provided by the ISP. Customers may also chooseto have third parties make such measurements on their behalf. To do so, a customer may askthe ISP to make selected test points available to it. The customer may also make some of itsown test points “public” to enable other interested parties to test overall performance incommunicating with the customer’s site.
This section shows how the methodology described above can be applied in the varioususage scenarios from section 2.3 to monitor service reliability and performance.
2.6.1 Service Level Agreement (SLA) Monitoring
In this example, we illustrate how an ISP can provide SLA reporting capabilities to its customers. Consider a customer that has signed up with the ISP for Internet access and has
Customer View of Internet Service Performance: Measurement Methodology and Metrics 2.0 Measurement Methodology
Cross-Industry Working Team 9
2.5 Methodology
2.6 Examples
4 Strictly speaking, this requires that the end-to-end measurement be decomposed into independent measurementsover the individual segments, which may not always be possible. However, for the purpose of coarse-grained faultisolation, a segment that shows problems has a high likelihood of being the cause of the end-to-end problem in theabsence of other detectable faults.
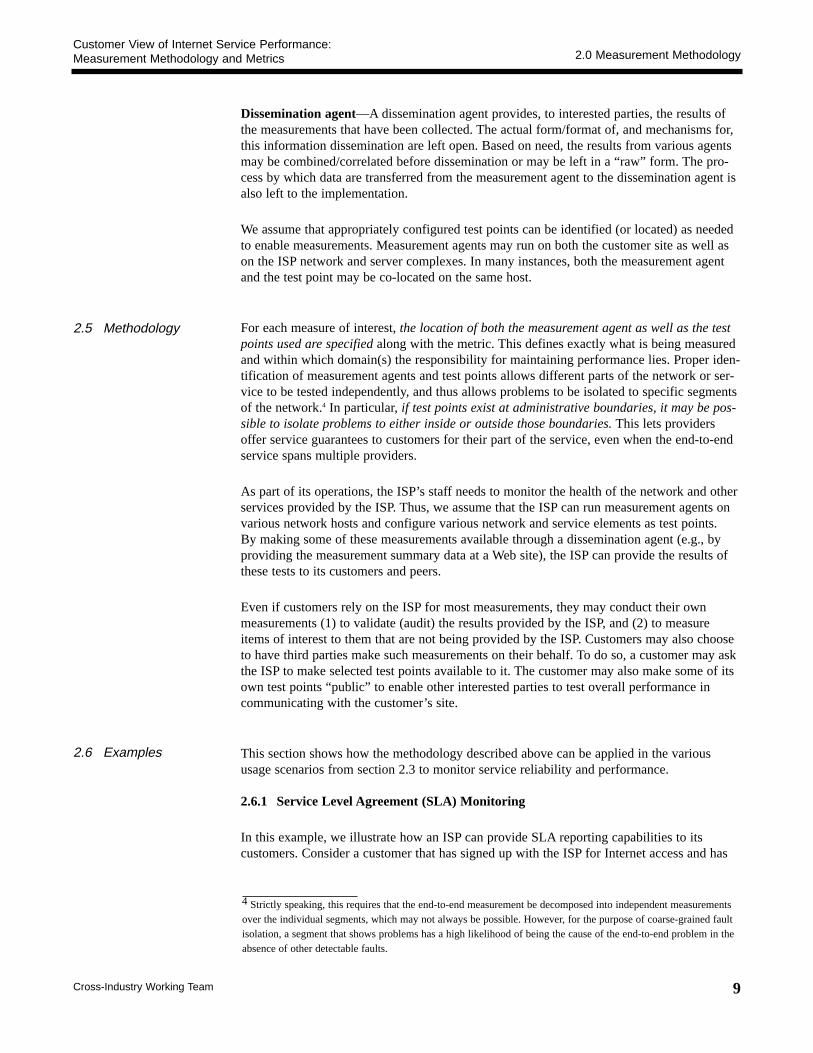
outsourced its e-mail and Web site to the ISP for hosting (figure 3). The ISP has offered anSLA to the customer with guaranteed availability for network access, as well as availabilityguarantees on the mail and Web services. The ISP has peering arrangements at two points onits network and runs a server complex where services are provided. Let us assume that theISP provides the customer with a premises router which it continues to own and manage.
The ISP identifies the two border routers and the customer premises router as the test pointsfor checking customer access to the Internet; it also identifies the Web and e-mail servers astest points to meet its Web and e-mail service guarantees. The ISP locates measurementagents near the customer premises router and at the data center. It periodically tests (A) thecustomer premises router as well as (B) the border routers to ensure that they are up, andmakes network measurements (C) to ensure that the customer traffic can reach the borderrouters. The ISP also makes periodic measurements (D) to check that the customer’s e-mailand Web hosting services are up. The results are aggregated and made available (E) to thecustomer using a customer service Web site, where the customer has access (F) to the mostcurrent data.
FIGURE 3. SLA Monitoring for Internet Services
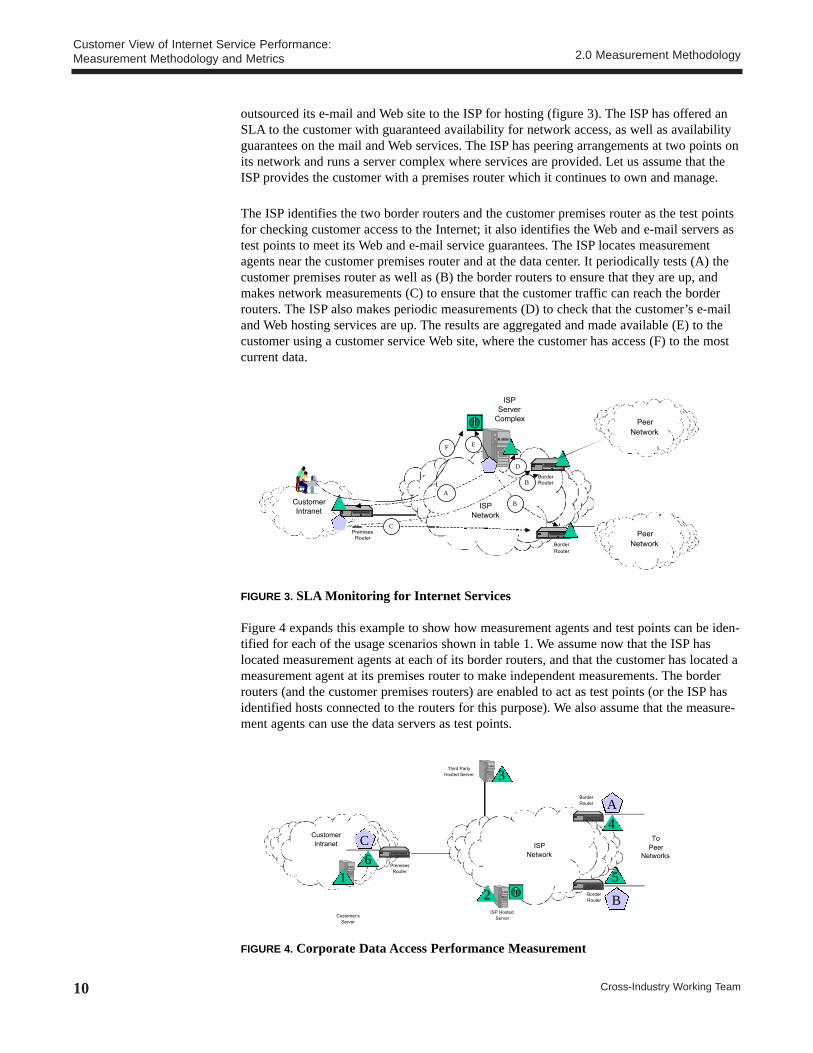
Figure 4 expands this example to show how measurement agents and test points can be iden-tified for each of the usage scenarios shown in table 1. We assume now that the ISP haslocated measurement agents at each of its border routers, and that the customer has located ameasurement agent at its premises router to make independent measurements. The borderrouters (and the customer premises routers) are enabled to act as test points (or the ISP hasidentified hosts connected to the routers for this purpose). We also assume that the measure-ment agents can use the data servers as test points.
FIGURE 4. Corporate Data Access Performance Measurement
ISPNetwork
CustomerIntranet
PremisesRouter
BorderRouter
BorderRouter
CustomerÕsServer
ToPeer
Networks
ISP HostedServer
Third PartyHosted Server
1
A
B
3
2
C4
56
ISPNetwork
CustomerIntranet
PremisesRouter
BorderRouter
BorderRouter
ISPServer
Complex
A
E
D
B
B
F
PeerNetwork
PeerNetwork
C
Customer View of Internet Service Performance: Measurement Methodology and Metrics 2.0 Measurement Methodology
Cross-Industry Working Team10
Case 1: External end-users accessing data located at a customer-owned server at thecustomer site—In this case, the customer is interested in end-users accessing data on thecustomer’s server from outside its intranet. The user experience in this case requires instru-mentation of the user’s client-machines. However, measurements taken from measurementagents A and B to test point 1 can provide client experience insofar as it is affected by theISP.As an alternative, if the ISP provides only test points 4 and 5, the customer can obtainan approximation of client performance by making measurements using measurement agentC to test points 1, 4, and 5. Assuming that test point 6 is located as close to the premisesrouter as possible, it can be used to determine if the problem is on the ISP network or on thecustomer intranet.
Case 2: Corporate end-users accessing data hosted by the ISP—In this case, measure-ment agent C and test point 2 located at the ISP-hosted server would be used. Note that inthis case the customer can directly make these measurements or can choose to outsourcethem to the ISP.
Case 3: External end-users accessing data hosted by the ISP—As in case 1, the ISPcould use measurement agents A and B with test point 2 to measure performance. In thiscase, the customer cannot directly measure performance from inside its intranet without relying on third-party measurements.
Case 4: Corporate end-users accessing data on the Internet—The customer can makedirect measurements using measurement agent C. If the ISP provides test points 4 and 5, it isalso possible to decide if problems in accessing the Internet are within the ISP’s boundary orbeyond it. Test point 6 can be used to determine if the problem is on the customer’s intranet.
Case 5: External users accessing third-party hosted data—This is similar to case 3, withmeasurement agents A and B using test point 3 to make the measurements. As in case 3, it is difficult for the customer to make this measurement directly.
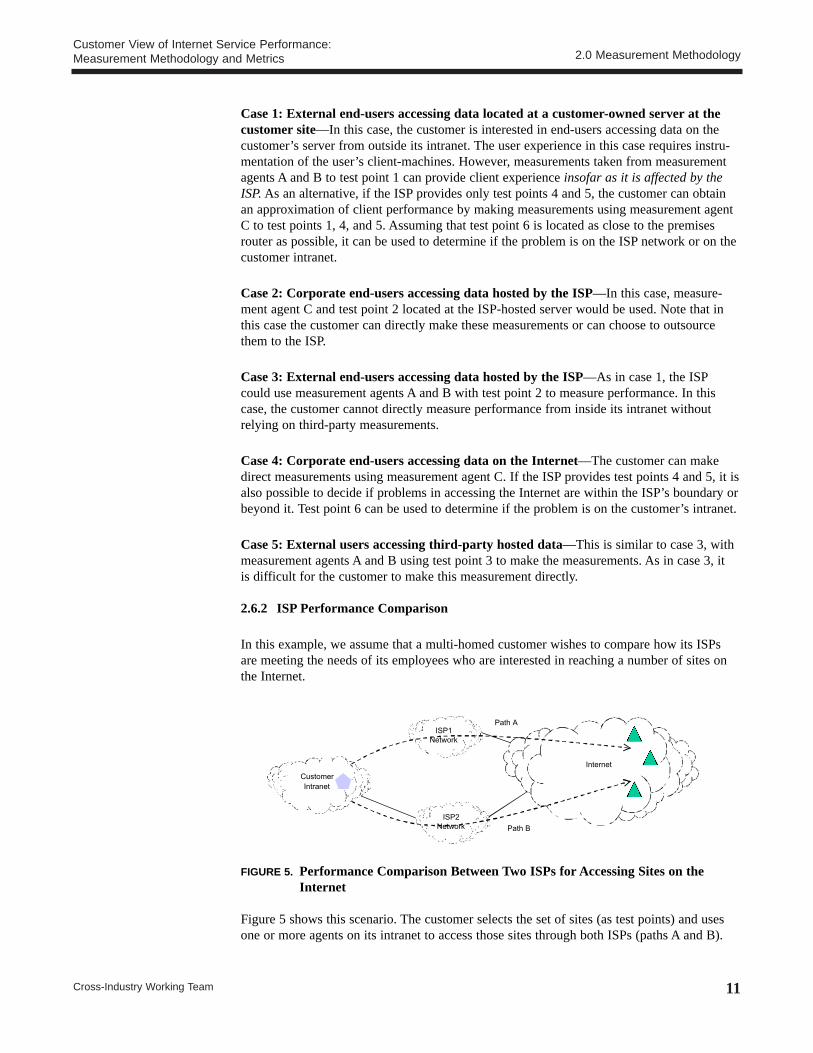
2.6.2 ISP Performance Comparison
In this example, we assume that a multi-homed customer wishes to compare how its ISPs are meeting the needs of its employees who are interested in reaching a number of sites onthe Internet.
FIGURE 5. Performance Comparison Between Two ISPs for Accessing Sites on theInternet
Figure 5 shows this scenario. The customer selects the set of sites (as test points) and usesone or more agents on its intranet to access those sites through both ISPs (paths A and B).
Internet
ISP1Network
CustomerIntranet
ISP2Network
Path A
Path B
Customer View of Internet Service Performance: Measurement Methodology and Metrics 2.0 Measurement Methodology
Cross-Industry Working Team 11
Because the same destinations are used in both cases, this is a meaningful comparison. If path A provides better performance most of the time (as measured to the test points ofinterest), the customer may consider the service offered by ISP1 to be better than that pro-vided by ISP2, even if the problem is in fact on the Internet beyond ISP2’s boundary.
2.6.3 Network Monitoring and Domain Isolation
As mentioned earlier, multiple network providers are usually involved in providing end-to-end service. In the SLA monitoring example, we assumed that the ISP provided guaranteesonly to its boundaries. This is likely to be unacceptable to most customers. Clearly, to guar-antee end-to-end performance, multiple ISPs need to cooperate. In this example, we showhow the methodology can be used to isolate problems in end-to-end service by cooperatingISPs.
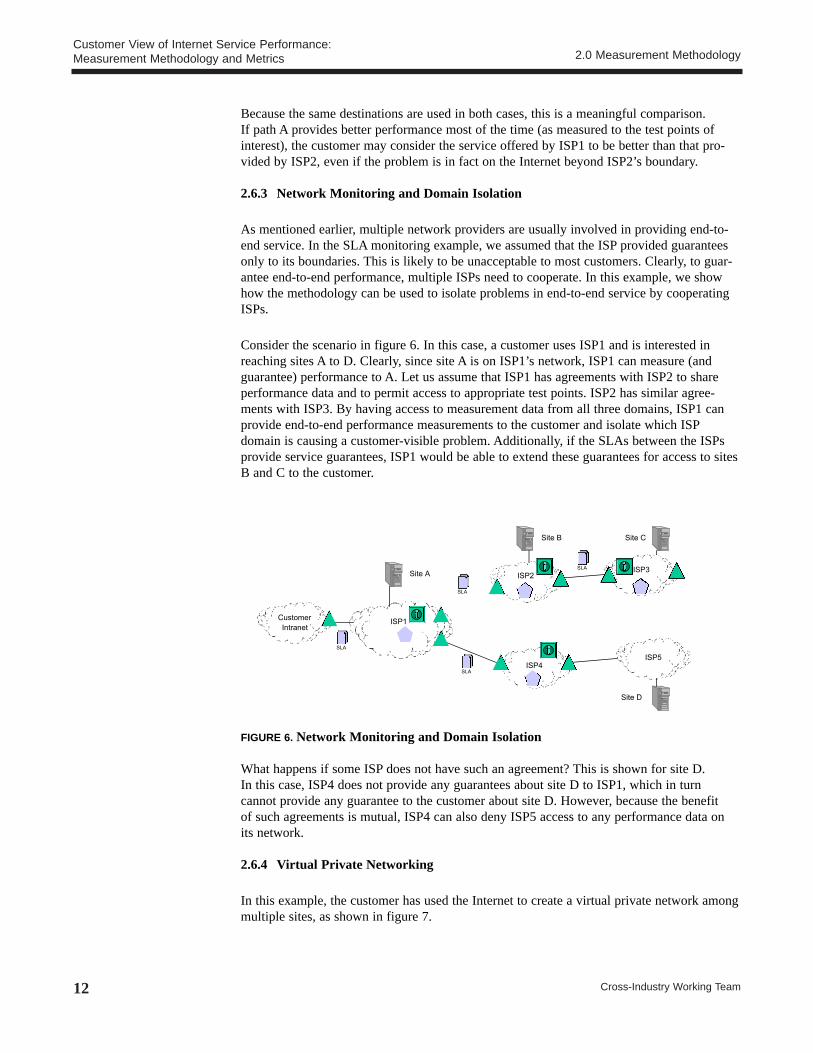
Consider the scenario in figure 6. In this case, a customer uses ISP1 and is interested inreaching sites A to D. Clearly, since site A is on ISP1’s network, ISP1 can measure (andguarantee) performance to A. Let us assume that ISP1 has agreements with ISP2 to shareperformance data and to permit access to appropriate test points. ISP2 has similar agree-ments with ISP3. By having access to measurement data from all three domains, ISP1 canprovide end-to-end performance measurements to the customer and isolate which ISPdomain is causing a customer-visible problem. Additionally, if the SLAs between the ISPsprovide service guarantees, ISP1 would be able to extend these guarantees for access to sitesB and C to the customer.
FIGURE 6. Network Monitoring and Domain Isolation
What happens if some ISP does not have such an agreement? This is shown for site D. In this case, ISP4 does not provide any guarantees about site D to ISP1, which in turn cannot provide any guarantee to the customer about site D. However, because the benefit of such agreements is mutual, ISP4 can also deny ISP5 access to any performance data on its network.
2.6.4 Virtual Private Networking
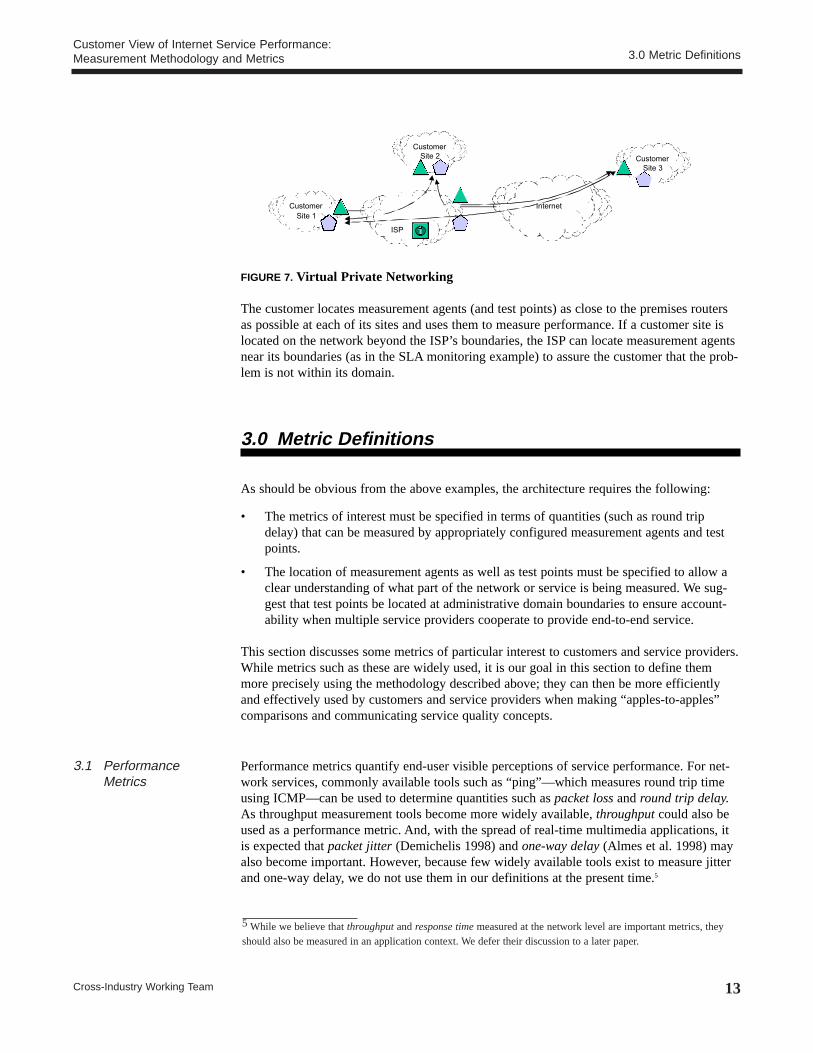
In this example, the customer has used the Internet to create a virtual private network amongmultiple sites, as shown in figure 7.
ISP2
ISP1
ISP3
ISP4ISP5
CustomerIntranet
Site D
Site CSite B
Site A
SLA
SLA
SLA
SLA
Customer View of Internet Service Performance: Measurement Methodology and Metrics 2.0 Measurement Methodology
Cross-Industry Working Team12
FIGURE 7. Virtual Private Networking
The customer locates measurement agents (and test points) as close to the premises routersas possible at each of its sites and uses them to measure performance. If a customer site islocated on the network beyond the ISP’s boundaries, the ISP can locate measurement agentsnear its boundaries (as in the SLA monitoring example) to assure the customer that the prob-lem is not within its domain.
3.0 Metric Definitions
As should be obvious from the above examples, the architecture requires the following:
• The metrics of interest must be specified in terms of quantities (such as round tripdelay) that can be measured by appropriately configured measurement agents and testpoints.
• The location of measurement agents as well as test points must be specified to allow aclear understanding of what part of the network or service is being measured. We sug-gest that test points be located at administrative domain boundaries to ensure account-ability when multiple service providers cooperate to provide end-to-end service.
This section discusses some metrics of particular interest to customers and service providers.While metrics such as these are widely used, it is our goal in this section to define themmore precisely using the methodology described above; they can then be more efficientlyand effectively used by customers and service providers when making “apples-to-apples”comparisons and communicating service quality concepts.
Performance metrics quantify end-user visible perceptions of service performance. For net-work services, commonly available tools such as “ping”—which measures round trip timeusing ICMP—can be used to determine quantities such as packet lossand round trip delay.As throughput measurement tools become more widely available, throughput could also beused as a performance metric. And, with the spread of real-time multimedia applications, itis expected that packet jitter(Demichelis 1998) and one-way delay(Almes et al. 1998) mayalso become important. However, because few widely available tools exist to measure jitterand one-way delay, we do not use them in our definitions at the present time.5
Internet
ISP
CustomerSite 3
CustomerSite 1
CustomerSite 2
Customer View of Internet Service Performance: Measurement Methodology and Metrics 3.0 Metric Definitions
Cross-Industry Working Team 13
3.1 PerformanceMetrics
5 While we believe that throughput and response timemeasured at the network level are important metrics, theyshould also be measured in an application context. We defer their discussion to a later paper.
We recommend that (at a minimum) network performance be measured using the followingmetrics.
3.1.1 Packet Loss
Packet loss is defined as the fraction of packets sent from a measurement agent to a testpoint for which the measurement agent does not receive an acknowledgment from the testpoint. This includes packets that are not received by the test point as well as acknowledg-ments that are lost before returning to the measurement agent. Acknowledgments that do notarrive within a predefined round trip delay (see below) at the measurement agent are alsoconsidered lost.
3.1.2 Round Trip Delay
Round trip delay is defined as the interval between the time a measurement agent applicationsends a packet to a test point and the time it receives acknowledgment that the packet wasreceived by the test point. Round trip delay includes any queuing delays at the end-points orthe intermediate hosts, but does not include any DNS lookup times by the measurementapplication.6
System reliability is particularly important in business-critical applications. Because of thenature of the Internet, it is difficult for ISPs and customers to specify service levels baseddirectly on reliability (which typically indicates only if a system is operational), and termssuch as “availability” are used instead. However, because no common definitions and com-putational methodology exist for such terms, it is often difficult to negotiate reliability guar-antees—and harder still to compare quality of service based on quoted values. We believethat from a customer perspective, there are three components to service reliability:
• Can the customer reach the service?
• If so, is the service available?
• If not, how frequently and for how long do the outages last?
We capture these components in the following metrics.
3.2.1 Reachability
A test point is considered reachable from a measurement agent if the agent can send packetsto the test point and, within a short predefined time interval, receive acknowledgment fromthe test point that the packet was received. In most instances, we can consider the ping test(described in section 3.1) as a sufficient metric of reachability.
Thus, if each measurement sample consists of multiple pings, the test point is consideredreachable from the measurement agent if the latter receives at least one acknowledgmentfrom the test point.
Customer View of Internet Service Performance: Measurement Methodology and Metrics 3.0 Metric Definitions
Cross-Industry Working Team14
3.2 Reliability Metrics
6 Note that we define round trip delay to include the queuing delay at the end hosts including the one running themeasurement agent. The measurement agent can estimate the delay at the local host by using a local “loopback” toensure that the measurement host is not contributing significantly to the delay measured value.
This definition can be extended for various topologies to derive more general reachabilitymetrics. For example, an ISP may consider a host on the Internet reachable from a customersite if:
• a measurement agent placed just before the customer premises router can send packetsto a test point placed just beyond the last router on the ISP’s network that has a commoninitial subpath with the site being accessed; and
• within a short time interval, receive acknowledgment that the test point received thepackets.
Note that unless the site is on the ISP’s network, this does not imply that the customer canactually reach the site in question. Rather, it implies only that the problem, if any, is not inthe ISP’s network and that the ISP is, in fact, meeting its commitment to provide access tosites on the Internet.
3.2.2 Network Service Availability
The network between a measurement agent and a test point is considered available at a giventime t if, during a specified time interval ∆ around t, the measured packet loss rate and theround trip delays are both below predefined thresholds.
Network service availability is defined as the fraction of time the network is available from aspecified group (one or more) of measurement agents to a specified group of test points.
Again, this definition depends on network topology. Thus, for example, a customer may con-sider an ISP’s network service to be available if, over a predefined interval,
• test points located just before peering points and exchange links on the ISP’s networkare reachable from a measurement agent located near the customer’s premises router,and
• the packet loss rate and round trip delays to the test points from the measurement agentare all below predefined thresholds.
3.2.3 Duration of Outage
The duration of an outage is defined as the difference between the time a service becomesunavailable and the time it is restored. Note that because of the statistical nature of Internettraffic, the duration over which service is measured to be unavailable should exceed someminimum threshold before it is declared an outage. Similarly, when service is restored afteran outage, it should stay available for some minimum duration before the outage is declaredover.
3.2.4 Time Between Outages
Time between outages is defined as the difference between the start times of two consecutiveoutages.
Customer View of Internet Service Performance: Measurement Methodology and Metrics 3.0 Metric Definitions
Cross-Industry Working Team 15
Ancillary metrics are often needed to interpret the results obtained from direct measurementof performance or availability. Specifically, most performance metrics depend on the utiliza-tion of underlying resources (defined below) and of network services. For example, DNS, acritical network service, is now used by almost all applications to resolve host names to thecorresponding IP addresses. A performance problem with DNS results in a large variety ofsymptoms including poor response time, or even failure, of applications.
3.3.1 Network Resource Utilization
Network resource utilization is the percentage of a particular part of the network infrastruc-ture used during a given time interval. It is a dimensionless number calculated by dividingthe amount of the particular resource used during a given time interval by the total theoreti-cally available amount of that particular resource during that same interval. Measuringresource utilization is especially important for key resources that include links and routers.Both utilization peaks and percentiles must be monitored.
3.3.2 DNS Performance
DNS has become an increasingly important part of the Internet because almost all applica-tions now use it to resolve host names to IP addresses. As a result, application-level responsetimes can appear slow if DNS performance is bad. We define DNS performance measuresusing two metrics—DNS query loss andDNS response time.
DNS query lossis defined as the fraction of DNS queries made by a measurement agent forwhich the measurement agent does not receive a response from the DNS server within a pre-determined time. This definition is analogous to the packet loss definition cited earlier.
DNS response timeis defined as the interval between the time a measurement agent applica-tion sends a DNS query to a DNS server and the time it receives a response from the serverproviding the result of the query. This is analogous to the round trip delay metric.
In general, the metrics described above are related, but provide different types of informationto the customer. Good results with one metric may be balanced by a poor showing in anoth-er. If time between outages is high, that is good. But if the duration of the outage is verylong when it does occur, the overall picture is not good, despite the infrequency of outages.Similarly, if an ISP network demonstrates good performance metrics for points within itsdomain, but poor peering arrangements lead to poor reachability of other sites on theInternet, the ISP’s service may not be acceptable to customers.
Actions taken to improve one metric may have a negative effect on others. For example,round trip delay can be improved by reducing router queue lengths. While this may have thepositive effect of reducing delay, it may also have the negative impact of increasing packetloss.
Finally, most metrics depend on the utilization of resources in the network. If a customeruses low-capacity links to connect to the ISP and traffic patterns show that the link runs nearcapacity most of the time, obtaining higher levels of performance requires subscription to ahigher speed access link. Metrics should thus be evaluated as a group to provide a completepicture of the service and to examine the tradeoffs of improving one metric at the expense ofanother.
Customer View of Internet Service Performance: Measurement Methodology and Metrics 3.0 Metric Definitions
Cross-Industry Working Team16
3.3 Ancillary Metrics
3.4 Tradeoffs BetweenMetrics
Because the Internet is based on best-effort protocols, instantaneous performance does notrelate directly to long-term performance. Although individual measurements can be used todetect operational problems in near real time, metrics of interest usually need to be aggre-gated over time to obtain valid estimates of performance. Due to system complexity, it is difficult to predict the performance that can be achieved a priori; it is thus necessary to com-pute baselines that can be used for setting quality-of-service targets and for comparing per-formance.
Statistical aggregates such as means or standard deviations are not appropriate to quantifyperformance of data networks because the underlying primary metrics have “heavy-tailed”distributions that are not represented well by those aggregates. These metrics can be moreappropriately represented by percentiles (Bickel and Doksum 1977) andorder statisticssuchas the median.
We define each measurement aggregate A as follows:
Measurement values Vm—Each measurement sample M results in a value Vm. Note that inmost cases, Vm will itself be computed from a set of measurements. Thus, Vm could be thefraction of responses received when a given host is pinged 10 times at one-second intervals,or it could be the median round trip delay computed from the returned responses. As anotherexample, Vm could represent the median packet loss measured between a group of sites inNorth America and a group in Europe.
Measurement interval Im—Im is the interval between measurement samples. If measure-ments occur at random times, then Im is the expected value of the interval associated withthe measurement. Thus, for example, a measurement may be taken every five minutes (periodic) or at intervals that are Poisson distributed with expected time of arrival equal tofive minutes. Note that Im defines the temporal resolution of the measurements—i.e., eventsthat are shorter than Im in duration are likely to be missed by the measurements.
Baseline value Bm—A baseline value represents the expected value of M. Baselines may bestatic (i.e., time invariant) or dynamic (time dependent). Baselines may also be dependent onservice load and other system parameters. It is expected that under normal circumstances,baselines will be computed from historical records of measurement samples. As noted above,the sample mean is a poor baseline value, and the median is probably a better baseline.7
Baseline spread Sm—The baseline spread is a measure of the normal variability associatedwith M. As with baselines, the baseline spread may be static or dynamic. Once again, webelieve that spread should be computed using quartiles or percentiles rather than the standarddeviation. A measurement is considered to be within baseline if
|Vm – Bm| / Sm ≤ Tm
where Tm is a threshold.8 If the underlying measurement distributions are significantly asym-metric, the baseline spread may be specified in terms of an upper specification limit Um anda lower specification limit Lm.
Customer View of Internet Service Performance: Measurement Methodology and Metrics 3.0 Metric Definitions
Cross-Industry Working Team 17
3.5 Aggregation ofMeasurements
7 Some XIWT members are currently making measurements over the Internet by periodically pinging one another’ssites. We expect to use these data to try various means of baselining and will report on our findings in a subsequentpaper.
Aggregation interval Ia—Ia is the time over which multiple measurement samples areaggregated to create the metric A which is representative of system behavior over that time.Typically, aggregation may be provided over hourly, daily, weekly, monthly, quarterly orannual intervals.
For example, an SLA may contain multiple aggregation intervals over which performance ismeasured. Note that aggregation intervals may be disjoint, i.e., aggregation may occur onlyat peak times or during business hours.
Aggregate value F—The aggregate value Fa is the fraction of measurements that are withinbaseline over the aggregation interval. Thus, if N measurements are taken over the aggrega-tion interval, and Nb are within baseline, the aggregate value is
Fa = Nb/N
Bounds may be placed on Fa to specify “acceptable” service behavior. Measurements thatreturn illegal or unknown values (e.g., if all packets are lost in a round trip delay measure-ment) should normally be considered out of baseline for computing the aggregate value.9
Note that while aggregation intervals used to compute Fa are likely to be large for monitor-ing and planning purposes, alarms may be generated by as few as one or two sequentialmeasurements if they are sufficiently out of baseline.
Also note that we resist the temptation to arrive at an aggregate value by averaging the mea-surement values. In our opinion, because of the long time intervals involved in aggregation,such values do not provide meaningful conclusions about service quality. The baselinevalue(s), however, can be used for historical comparisons if they are dynamic.
In this section, we use the SLA monitoring example (section 2.6.1) and the corporate dataaccess scenarios (table 1) to show how to measure and compute the metrics. For each sce-nario, we should measure the following:
• packet loss,
• round trip delay,
• network service availability,
• time between outages, and
• length of outages.
Packet loss and delay estimate the performance that users expect to see when the network is“operational.” Network service availability, time between outages, and length of outagesquantify service availability to the customer’s Internet users.
Customer View of Internet Service Performance: Measurement Methodology and Metrics 3.0 Metric Definitions
Cross-Industry Working Team18
8 Division by Sm allows Tm to be specified as a dimensionless quantity. This is useful for specifications such as“take action when measurement falls outside the 99 percentile value.”The threshold could also be specified in thesame units as Vm, in which case normalization need not be done.9 Strictly speaking, such measurements should be considered out of baseline only if the loss of data is caused bythe system and not due to problems in the measurement process itself. Determining the cause of data loss is diffi-cult, and significant effort is required in the implementation to decide how to deal with this.
3.6 Computation ofMetrics
Case 1: External users accessing data located at customer premises—In this case,the customer has some resources that it wishes to make available for users on the Internet.This case encompasses virtual private networking where the external users are employees of the customer connecting through the Internet to resources within the company. Ideally,the customer should instrument a test point as close as possible to the demarcation betweenits intranet and its ISP. The ISP should provide measurement agents as close to its peeringpoints with other ISPs as possible. These measurement agents can then be applied to esti-mate the performance for users of those ISPs, aid in problem isolation, and give the cus-tomer some idea of how well its ISP peers with other ISPs.
The measurement agents will sample at some given interval—5-, 10-, 15- or 30-minute sampling intervals are typical. A measurement agent can ping each test point and then use the results to measure round trip delay, packet loss, and reachability. These measure-ments can then be used to determine availability during the sampling interval. When a testpoint is not reachable, the measurement agent records the time that the outage occurred.When the outage has been repaired, duration of the outage can be calculated with these data. When another outage occurs, time between outages can be recorded.
Measurement first needs to take place for a few weeks (a minimum of two) to establishbaseline values and baseline spreads for all metrics. The objective is to establish norms ofnetwork behavior. Since some of the measurement agents are not on the customer’s ISP,there may be different levels of performance and availability depending on the measurementagents’ location. In this particular case, aggregation is an important issue. Aggregation byISP or geographic region will help isolate peering problems between ISPs or within localregions.
Once the baseline values and spreads have been determined, operational measurements canbegin. Measurements that fall sufficiently far outside the baseline can be flagged as prob-lems. Comparisons between the measurements made by agents on the customer’s ISP andagents on other ISPs can be used to decide if the problem is due to the customer’s ISP orbeyond it.
There are two difficult aspects to this particular case. The first aspect is gathering data fromagents on other ISPs. This can be done by cooperative associations (e.g., XIWT’s InternetPerformance Working Team) or by third-party vendors (e.g., Keynote or Inverse Networks).The second difficulty is what to do when problems are found. ISPs have little direct controlto fix problems on other ISPs’ networks. This is an issue that may be addressed by bodiessuch as Internet Operators (IOPS.ORG 1998).
Case 2: Corporate users accessing data hosted by the ISP—In this case, the customer’susers access data hosted by the customer’s ISP. A test point should be located at the ISP’shosting center. A measurement agent should be located as close as possible to the customer’sdemarcation point with the ISP. After a baseline is established (as described in the previouscase), operational measurements can begin and deviations from established baseline spreadsflagged for ISP notification. All the data can be aggregated together. Monitoring perfor-mance and correcting problems in this case is much easier because only one ISP is involved.
Case 3: External users access data hosted by the ISP—Here, users on the Internet accessthe customer’s data hosted by the customer’s ISP. This case is similar to case 1, except thatthe test point should move to the ISP hosting facilities. Measurement agents should be sta-tioned within the customer’s ISP and on other ISPs. As with case 1, a key point of interest isthe ability of the customer’s ISP to peer with other ISPs.
Customer View of Internet Service Performance: Measurement Methodology and Metrics 3.0 Metric Definitions
Cross-Industry Working Team 19
Data should, as in case 1, be aggregated by ISP or geographic region where the measurementagents are located. And again, as in case 1, issues arise with regard to fixing problems whenthey occur at an ISP other than the customer’s ISP.
Case 4: Customer’s employees accessing data on the Internet—This is the inverse of case 1. A measuring agent should be located as close to the ISP’s point of demarcation at thecustomer’s premises as possible. Test points should be distributed at the customer’s ISP andother ISPs. This is the exact opposite placement of test points and measurement agents as incase 1. Instead of aggregating data by ISP or geographic region of the measurement agents,data should be aggregated by ISP or geographic region of the test points.
As in cases 1 and 3, difficulties exist in fixing problems when these occur at an ISP otherthan the customer’s own.
Case 5: External users accessing customer’s data hosted by third party—This is basi-cally case 3, but the data are hosted at a location not on the customer’s ISP. This scenariooften occurs when a customer wants to outsource handling of its content. The test point thenmoves to the third party’s data center. As in case 3, aggregation is done by ISP and geo-graphy. And again as in case 3, there may be difficulties in debugging problems that occur at ISPs other than the customer’s.
4.0 Summary
To simplify the process of negotiating service quality agreements between customers and theirISPs, a measurement architecture and methodology, and a common set of metrics that can bequantified using this methodology, have been described. Motivated by ideal requirementsand common usage scenarios, and scoped by metrics most meaningful to both customers andISPs, the methodology is both practical and applicable to a wide range of performance andreliability issues. Guidelines for aggregating measurements to provide useful estimates oflong-term performance and details on the techniques for measuring and computing the met-rics have also been given.
Ongoing effort in this area by XIWT is expected to address the following outstanding issues:
• The feasibility of the proposed architecture and methodology needs to be demonstratedwith data from an example implementation. XIWT members are currently running suchan experiment, and it is expected that initial results will be published in the near future.
• The measurement architecture and methodology have been limited to customers withdedicated access to their ISP (via a premises router). For other customers with dedicatedaccess (such as small business customers with xDSL connections or individual custo-mers with cable-modems, for example), the architecture and methodology ought to beapplicable. The subject of dialup customers also needs to be addressed.
• The methodology has focused on active measurements. The use of passive measure-ments should be investigated, since these can significantly reduce the amount of overhead traffic.
• The metrics definitions should be expanded to include those relevant to specific applica-tions (e.g., TCP- and HTTP-level measurements, jitter for voiceover IP applications,etc.).
Customer View of Internet Service Performance: Measurement Methodology and Metrics 4.0 Summary
Cross-Industry Working Team20
5.0 Glossary
ADSL asymmetric digital subscriber loop
AIAG Automotive Industry Action Group
ANX Automotive Network Exchange
DNS Domain Name System
DSL digital subscriber loop
GPS global positioning system
HTTP Hypertext Transfer Protocol
ICMP Internet Control Message Protocol
IETF Internet Engineering Task Force
IP Internet protocol
IPPM WG Internet Protocol Performance Metrics Working Group of the IETF
ISP Internet service provider
NAP network access point
NIMI National Internet Measurement Infrastructure
POP point-of-presence
PSTN public switched telephone network
SLA service level agreement
SNMP Simple Network Management Protocol
TCP Transmission Control Protocol
6.0 References
Advanced Network & Services, Inc. (ANS). 1997. Surveyor home page.<<http://www.advanced.org/csg-ippm>>
Almes, G., S. Kalidindi, and M. Zekauskas. 1998. “A One-Way Delay Metric for IPPM.”Internet Engineering Task Force, Network Working Group, Internet Draft.<<http://www.ietf.org/internet-drafts/draft-ietf-ippm-delay-03.txt>>
Automotive Industry Action Group (AIAG). 1997. ANX Release 1 Draft DocumentPublication.TEL 2. Southfield, MI. << http://www.aiag.org/pub/>>
Bickel, P., and K. Doksum. 1977. Mathematical Statistics: Basic Ideas and Selected Topics.San Francisco: Holden-Day.
Customer View of Internet Service Performance: Measurement Methodology and Metrics 5.0 Glossary
Cross-Industry Working Team 21
Demichelis, C. 1998. “Instantaneous Packet Delay Variation Metric for IPPM.” InternetEngineering Task Force, Network Working Group, Internet Draft.<<http://www.ietf.cnri.reston.va.us/internet-drafts/draft-ietf-ippm-ipdv-01.txt>>
Internet Operators (IOPS.ORG). 1998. IOPS.ORG home page. <<http://www.iops.org/>>
Mahdavi, J., M. Mathis, and V. Paxson. 1997. “Creating a National MeasurementInfrastructure.” Presentation at the Internet Statistics and Metrics Analysis Workshop, May1997. <<http://www.psc.edu/networking/nimi/slides/welcome.html>>
Paxson, V., G. Almes, J. Mahdavi, and M. Mathis. 1998. “Framework for IP PerformanceMetrics.” The Internet Society RFC 2330. <<ftp://ftp.isi.edu/in-notes/rfc2330.txt>>
T1A1.2. 1998a. Alliance for Telecommunications Industry Solutions Network SurvivabilityPerformance Working Group. <<http://www.t1.org/t1a1/_a12-hom.htm>>
T1A1.3. 1998. Alliance for Telecommunications Industry Solutions Performance of DigitalNetworks and Services Working Group. <<http://www.t1.org/t1a1/_a13-hom.htm>>
Customer View of Internet Service Performance: Measurement Methodology and Metrics 6.0 References
Cross-Industry Working Team22
XIWT Corporation for National Research Initiatives