1 Customs Duty Rationalization in the Union Budget 2020-21: An Assay I. Introduction: Union Budget 2020-21 Announcements to rationalize Customs Duties The Union Budget 2020-21 announced a spate of measures to rationalize Custom Duties with a view to meeting the twin objectives of “promoting domestic manufacturing and helping India get onto global value chain and export better.” Outmoded exemptions on Customs Duties have either been dispensed with or are put up for review through a consultative process. From 1 st October 2021, the Budget proposed a revised customs duty structure, free of distortions, valid up to the 31st March following two years from the date of its issue. Further, with a view to ease procedures and compliance, certain changes were announced in the provisions relating to ADD and CVD levies, including prescribing definite timelines to complete Customs investigations. The Turant Customs initiative, for “Faceless, Paperless, and Contactless Customs measures” was introduced in 2020. With effect from September 2020, a new procedure was implemented for administration of Rules of Origin to check on misuse of FTAs. The following table summarizes the sector/industry-wise announcements in the realm of Custom Duty in Hon’ble Finance Minister’s Budget speech: Table 1: Budget 2020-21 Announcements on Custom Duty Changes, Sector/Industry Wise Industry Intervention Rationale for International Trade Value Addition of India Anticipated Direction of Imports by Policymakers ( Increase or Decrease) Electronic and Mobile Phone Industry Withdrawal of few exemptions on parts of chargers and sub-parts of mobiles. Also, some parts of mobiles will move from ‘nil’ rate to a moderate 2.5%. Greater domestic value addition, reduction in imports. Higher exports of items such as mobiles and chargers. ↓ Iron and Steel Reduction of Customs duty uniformly to 7.5% on semis, flat, and long products of non-alloy, alloy, and stainless steels. Exemption of duty on steel scrap for a period up to 31 st March, 2022. Revoking ADD and CVD on certain steel products. Reduction of duty on copper scrap from 5% to 2.5%. Boosting imports by MSMEs and other user industries (severely hit by recent sharp rise in iron and steel prices). Providing relief to metal re- cyclers, mostly MSMEs to enable higher imports Providing relief to copper recyclers to aid imports ↑
Transcript
1
Customs Duty Rationalization in the Union Budget
2020-21: An Assay
I. Introduction: Union Budget 2020-21 Announcements to rationalize
Customs Duties
The Union Budget 2020-21 announced a spate of measures to rationalize Custom Duties with
a view to meeting the twin objectives of “promoting domestic manufacturing and helping
India get onto global value chain and export better.” Outmoded exemptions on Customs
Duties have either been dispensed with or are put up for review through a consultative
process. From 1st October 2021, the Budget proposed a revised customs duty structure, free
of distortions, valid up to the 31st March following two years from the date of its issue.
Further, with a view to ease procedures and compliance, certain changes were announced in
the provisions relating to ADD and CVD levies, including prescribing definite timelines to
complete Customs investigations. The Turant Customs initiative, for “Faceless, Paperless, and
Contactless Customs measures” was introduced in 2020. With effect from September 2020,
a new procedure was implemented for administration of Rules of Origin to check on misuse
of FTAs.
The following table summarizes the sector/industry-wise announcements in the realm of
Custom Duty in Hon’ble Finance Minister’s Budget speech:
Industry Intervention Rationale for International Trade Value Addition of India
Anticipated Direction of Imports by Policymakers ( Increase or Decrease)
Electronic and Mobile Phone Industry
Withdrawal of few exemptions on
parts of chargers and sub-parts of
mobiles.
Also, some parts of mobiles will
move from ‘nil’ rate to a moderate
2.5%.
Greater domestic value addition, reduction in imports.
Higher exports of items such as mobiles and chargers.
↓
Iron and Steel
Reduction of Customs duty
uniformly to 7.5% on semis, flat,
and long products of non-alloy,
alloy, and stainless steels.
Exemption of duty on steel scrap
for a period up to 31st March, 2022.
Revoking ADD and CVD on certain
steel products.
Reduction of duty on copper scrap
from 5% to 2.5%.
Boosting imports by MSMEs
and other user industries
(severely hit by recent sharp
rise in iron and steel prices).
Providing relief to metal re-
cyclers, mostly MSMEs to
enable higher imports
Providing relief to copper
recyclers to aid imports
↑
2
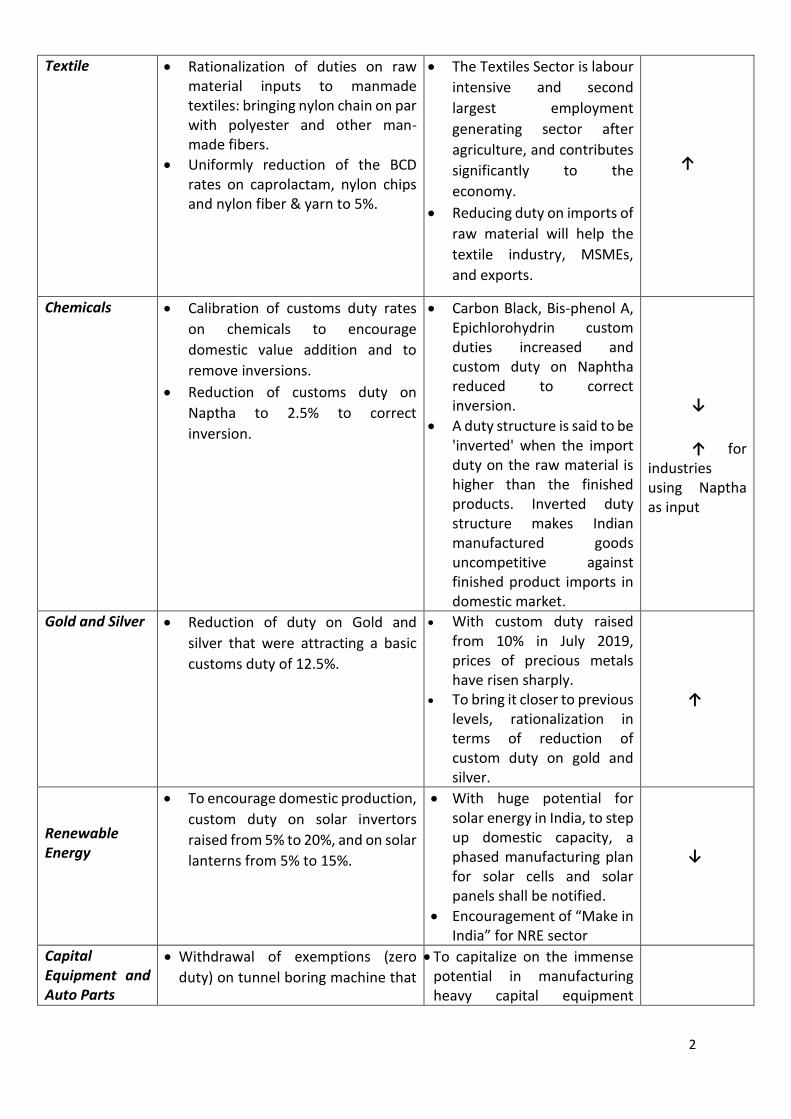
Textile
Rationalization of duties on raw material inputs to manmade textiles: bringing nylon chain on par with polyester and other man-made fibers.
Uniformly reduction of the BCD rates on caprolactam, nylon chips and nylon fiber & yarn to 5%.
The Textiles Sector is labour
intensive and second
largest employment
generating sector after
agriculture, and contributes
significantly to the
economy.
Reducing duty on imports of
raw material will help the
textile industry, MSMEs,
and exports.
↑
Chemicals Calibration of customs duty rates
on chemicals to encourage
domestic value addition and to
remove inversions.
Reduction of customs duty on
Naptha to 2.5% to correct
inversion.
Carbon Black, Bis-phenol A, Epichlorohydrin custom duties increased and custom duty on Naphtha reduced to correct inversion.
A duty structure is said to be 'inverted' when the import duty on the raw material is higher than the finished products. Inverted duty structure makes Indian manufactured goods uncompetitive against finished product imports in domestic market.
↓
↑ for industries using Naptha as input
Gold and Silver
Reduction of duty on Gold and
silver that were attracting a basic
customs duty of 12.5%.
With custom duty raised from 10% in July 2019, prices of precious metals have risen sharply.
To bring it closer to previous levels, rationalization in terms of reduction of custom duty on gold and silver.
↑
Renewable Energy
To encourage domestic production,
custom duty on solar invertors
raised from 5% to 20%, and on solar
lanterns from 5% to 15%.
With huge potential for solar energy in India, to step up domestic capacity, a phased manufacturing plan for solar cells and solar panels shall be notified.
Encouragement of “Make in India” for NRE sector
↓
Capital Equipment and Auto Parts
Withdrawal of exemptions (zero
duty) on tunnel boring machine that
To capitalize on the immense potential in manufacturing heavy capital equipment
3
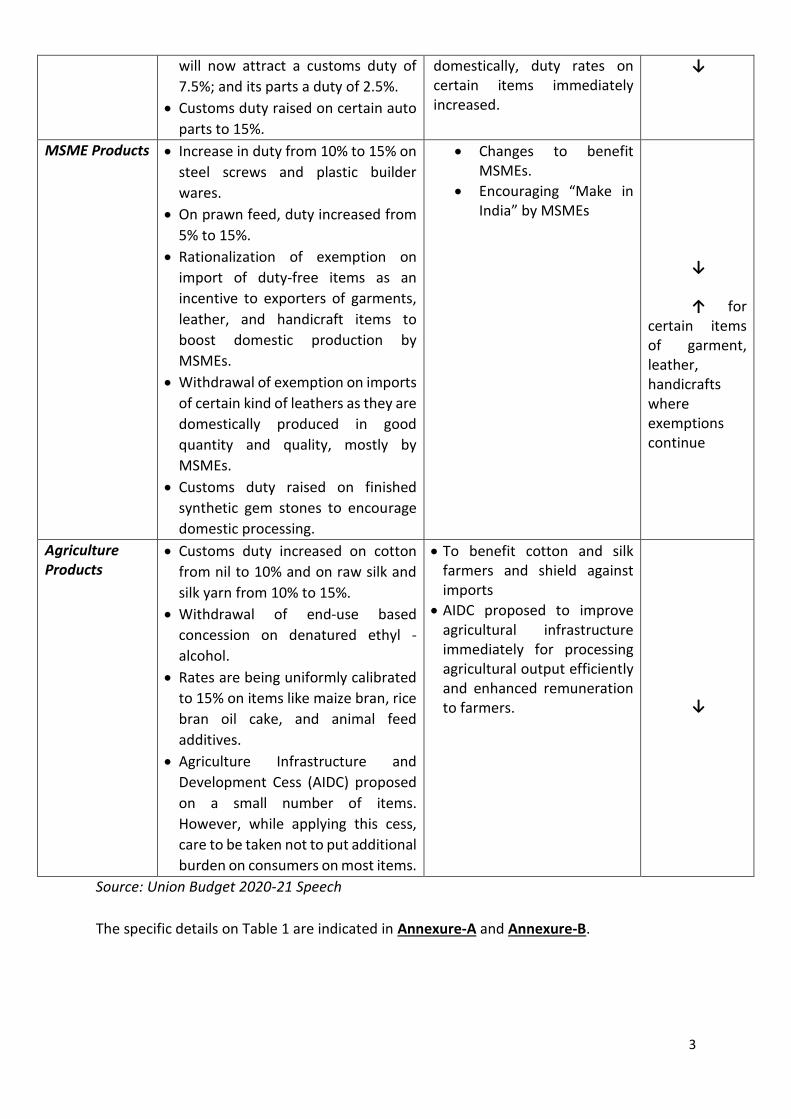
Source: Union Budget 2020-21 Speech
The specific details on Table 1 are indicated in Annexure-A and Annexure-B.
will now attract a customs duty of
7.5%; and its parts a duty of 2.5%.
Customs duty raised on certain auto
parts to 15%.
domestically, duty rates on certain items immediately increased.
↓
MSME Products
Increase in duty from 10% to 15% on
steel screws and plastic builder
wares.
On prawn feed, duty increased from
5% to 15%.
Rationalization of exemption on
import of duty-free items as an
incentive to exporters of garments,
leather, and handicraft items to
boost domestic production by
MSMEs.
Withdrawal of exemption on imports
of certain kind of leathers as they are
domestically produced in good
quantity and quality, mostly by
MSMEs.
Customs duty raised on finished
synthetic gem stones to encourage
domestic processing.
Changes to benefit MSMEs.
Encouraging “Make in India” by MSMEs
↓ ↑ for certain items of garment, leather, handicrafts where exemptions continue
Agriculture Products
Customs duty increased on cotton
from nil to 10% and on raw silk and
silk yarn from 10% to 15%.
Withdrawal of end-use based
concession on denatured ethyl -
alcohol.
Rates are being uniformly calibrated
to 15% on items like maize bran, rice
bran oil cake, and animal feed
additives.
Agriculture Infrastructure and
Development Cess (AIDC) proposed
on a small number of items.
However, while applying this cess,
care to be taken not to put additional
burden on consumers on most items.
To benefit cotton and silk farmers and shield against imports
AIDC proposed to improve agricultural infrastructure immediately for processing agricultural output efficiently and enhanced remuneration to farmers.
↓
4
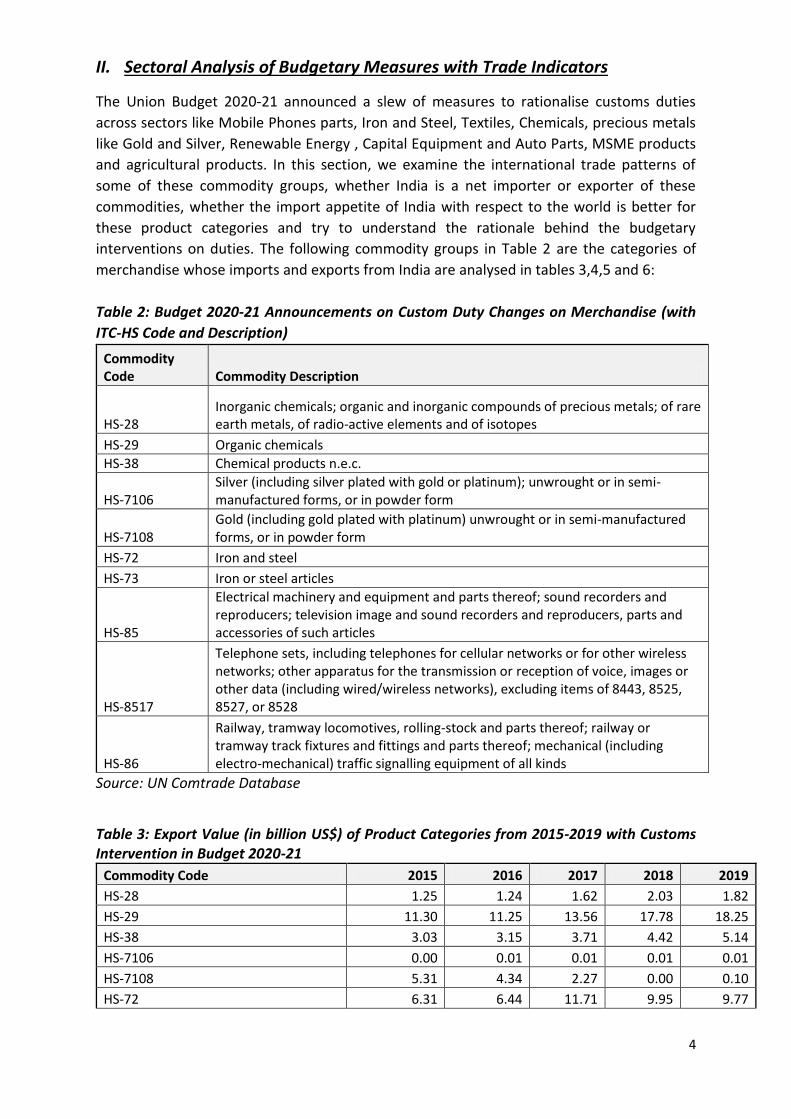
II. Sectoral Analysis of Budgetary Measures with Trade Indicators
The Union Budget 2020-21 announced a slew of measures to rationalise customs duties
across sectors like Mobile Phones parts, Iron and Steel, Textiles, Chemicals, precious metals
like Gold and Silver, Renewable Energy , Capital Equipment and Auto Parts, MSME products
and agricultural products. In this section, we examine the international trade patterns of
some of these commodity groups, whether India is a net importer or exporter of these
commodities, whether the import appetite of India with respect to the world is better for
these product categories and try to understand the rationale behind the budgetary
interventions on duties. The following commodity groups in Table 2 are the categories of
merchandise whose imports and exports from India are analysed in tables 3,4,5 and 6:
Table 2: Budget 2020-21 Announcements on Custom Duty Changes on Merchandise (with
ITC-HS Code and Description)
Commodity Code Commodity Description
HS-28 Inorganic chemicals; organic and inorganic compounds of precious metals; of rare earth metals, of radio-active elements and of isotopes
HS-29 Organic chemicals
HS-38 Chemical products n.e.c.
HS-7106 Silver (including silver plated with gold or platinum); unwrought or in semi-manufactured forms, or in powder form
HS-7108 Gold (including gold plated with platinum) unwrought or in semi-manufactured forms, or in powder form
HS-72 Iron and steel
HS-73 Iron or steel articles
HS-85
Electrical machinery and equipment and parts thereof; sound recorders and reproducers; television image and sound recorders and reproducers, parts and accessories of such articles
HS-8517
Telephone sets, including telephones for cellular networks or for other wireless networks; other apparatus for the transmission or reception of voice, images or other data (including wired/wireless networks), excluding items of 8443, 8525, 8527, or 8528
HS-86
Railway, tramway locomotives, rolling-stock and parts thereof; railway or tramway track fixtures and fittings and parts thereof; mechanical (including electro-mechanical) traffic signalling equipment of all kinds
Source: UN Comtrade Database
Table 3: Export Value (in billion US$) of Product Categories from 2015-2019 with Customs Intervention in Budget 2020-21
Commodity Code 2015 2016 2017 2018 2019
HS-28 1.25 1.24 1.62 2.03 1.82
HS-29 11.30 11.25 13.56 17.78 18.25
HS-38 3.03 3.15 3.71 4.42 5.14
HS-7106 0.00 0.01 0.01 0.01 0.01
HS-7108 5.31 4.34 2.27 0.00 0.10
HS-72 6.31 6.44 11.71 9.95 9.77
5
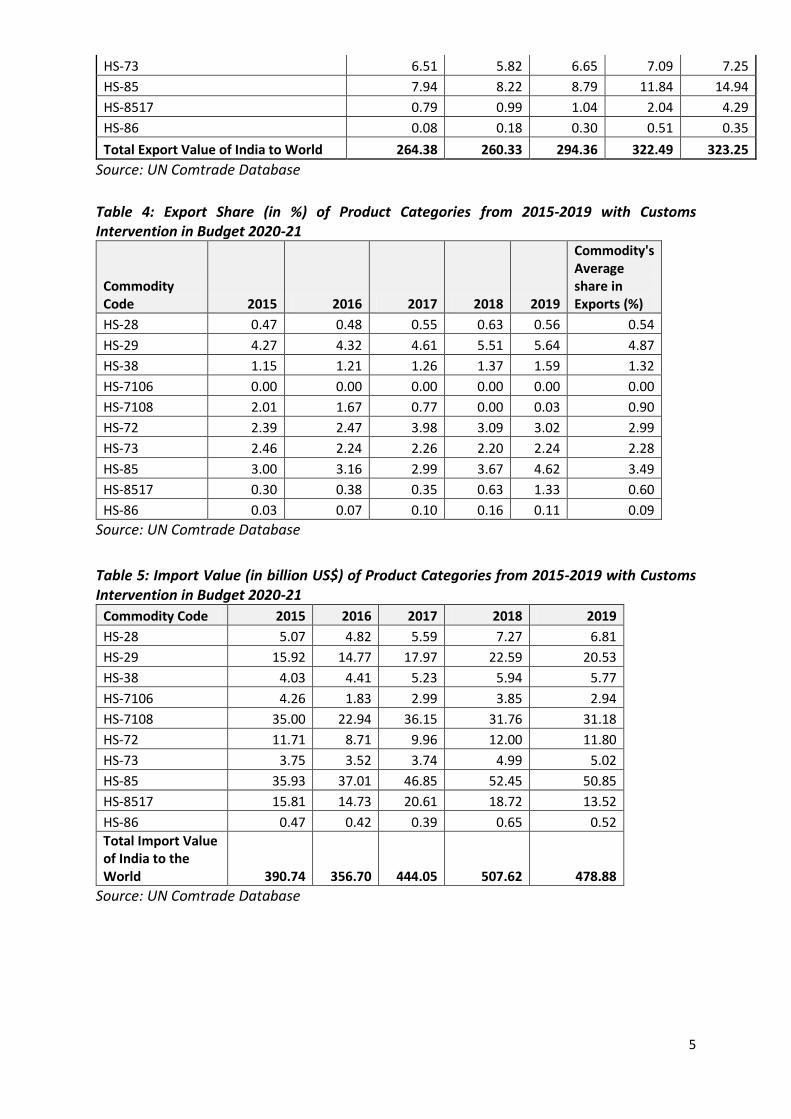
HS-73 6.51 5.82 6.65 7.09 7.25
HS-85 7.94 8.22 8.79 11.84 14.94
HS-8517 0.79 0.99 1.04 2.04 4.29
HS-86 0.08 0.18 0.30 0.51 0.35
Total Export Value of India to World 264.38 260.33 294.36 322.49 323.25
Source: UN Comtrade Database
Table 4: Export Share (in %) of Product Categories from 2015-2019 with Customs Intervention in Budget 2020-21
Commodity Code 2015 2016 2017 2018 2019
Commodity's Average share in Exports (%)
HS-28 0.47 0.48 0.55 0.63 0.56 0.54
HS-29 4.27 4.32 4.61 5.51 5.64 4.87
HS-38 1.15 1.21 1.26 1.37 1.59 1.32
HS-7106 0.00 0.00 0.00 0.00 0.00 0.00
HS-7108 2.01 1.67 0.77 0.00 0.03 0.90
HS-72 2.39 2.47 3.98 3.09 3.02 2.99
HS-73 2.46 2.24 2.26 2.20 2.24 2.28
HS-85 3.00 3.16 2.99 3.67 4.62 3.49
HS-8517 0.30 0.38 0.35 0.63 1.33 0.60
HS-86 0.03 0.07 0.10 0.16 0.11 0.09
Source: UN Comtrade Database
Table 5: Import Value (in billion US$) of Product Categories from 2015-2019 with Customs Intervention in Budget 2020-21
Commodity Code 2015 2016 2017 2018 2019
HS-28 5.07 4.82 5.59 7.27 6.81
HS-29 15.92 14.77 17.97 22.59 20.53
HS-38 4.03 4.41 5.23 5.94 5.77
HS-7106 4.26 1.83 2.99 3.85 2.94
HS-7108 35.00 22.94 36.15 31.76 31.18
HS-72 11.71 8.71 9.96 12.00 11.80
HS-73 3.75 3.52 3.74 4.99 5.02
HS-85 35.93 37.01 46.85 52.45 50.85
HS-8517 15.81 14.73 20.61 18.72 13.52
HS-86 0.47 0.42 0.39 0.65 0.52
Total Import Value of India to the World 390.74 356.70 444.05 507.62 478.88
Source: UN Comtrade Database
6
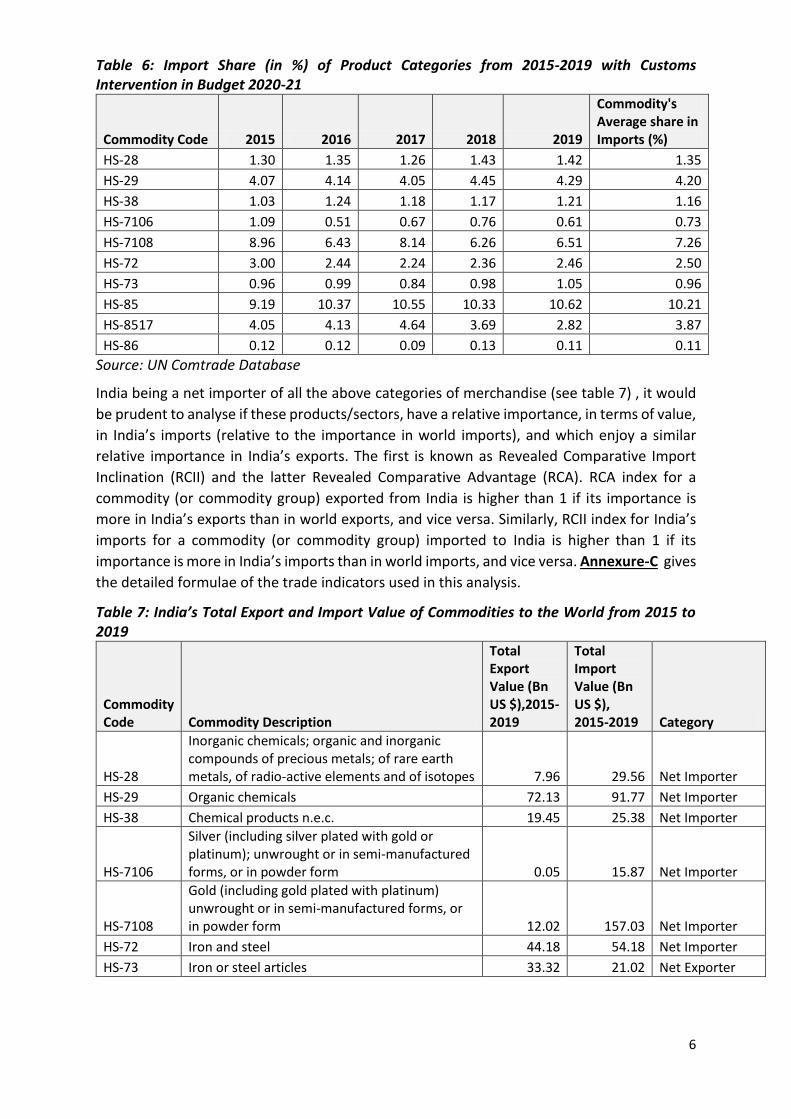
Table 6: Import Share (in %) of Product Categories from 2015-2019 with Customs Intervention in Budget 2020-21
Commodity Code 2015 2016 2017 2018 2019
Commodity's Average share in Imports (%)
HS-28 1.30 1.35 1.26 1.43 1.42 1.35
HS-29 4.07 4.14 4.05 4.45 4.29 4.20
HS-38 1.03 1.24 1.18 1.17 1.21 1.16
HS-7106 1.09 0.51 0.67 0.76 0.61 0.73
HS-7108 8.96 6.43 8.14 6.26 6.51 7.26
HS-72 3.00 2.44 2.24 2.36 2.46 2.50
HS-73 0.96 0.99 0.84 0.98 1.05 0.96
HS-85 9.19 10.37 10.55 10.33 10.62 10.21
HS-8517 4.05 4.13 4.64 3.69 2.82 3.87
HS-86 0.12 0.12 0.09 0.13 0.11 0.11
Source: UN Comtrade Database
India being a net importer of all the above categories of merchandise (see table 7) , it would
be prudent to analyse if these products/sectors, have a relative importance, in terms of value,
in India’s imports (relative to the importance in world imports), and which enjoy a similar
relative importance in India’s exports. The first is known as Revealed Comparative Import
Inclination (RCII) and the latter Revealed Comparative Advantage (RCA). RCA index for a
commodity (or commodity group) exported from India is higher than 1 if its importance is
more in India’s exports than in world exports, and vice versa. Similarly, RCII index for India’s
imports for a commodity (or commodity group) imported to India is higher than 1 if its
importance is more in India’s imports than in world imports, and vice versa. Annexure-C gives
the detailed formulae of the trade indicators used in this analysis.
Table 7: India’s Total Export and Import Value of Commodities to the World from 2015 to 2019
Commodity Code Commodity Description
Total Export Value (Bn US $),2015-2019
Total Import Value (Bn US $), 2015-2019 Category
HS-28
Inorganic chemicals; organic and inorganic compounds of precious metals; of rare earth metals, of radio-active elements and of isotopes 7.96 29.56 Net Importer
HS-29 Organic chemicals 72.13 91.77 Net Importer
HS-38 Chemical products n.e.c. 19.45 25.38 Net Importer
HS-7106
Silver (including silver plated with gold or platinum); unwrought or in semi-manufactured forms, or in powder form 0.05 15.87 Net Importer
HS-7108
Gold (including gold plated with platinum) unwrought or in semi-manufactured forms, or in powder form 12.02 157.03 Net Importer
HS-72 Iron and steel 44.18 54.18 Net Importer
HS-73 Iron or steel articles 33.32 21.02 Net Exporter
7
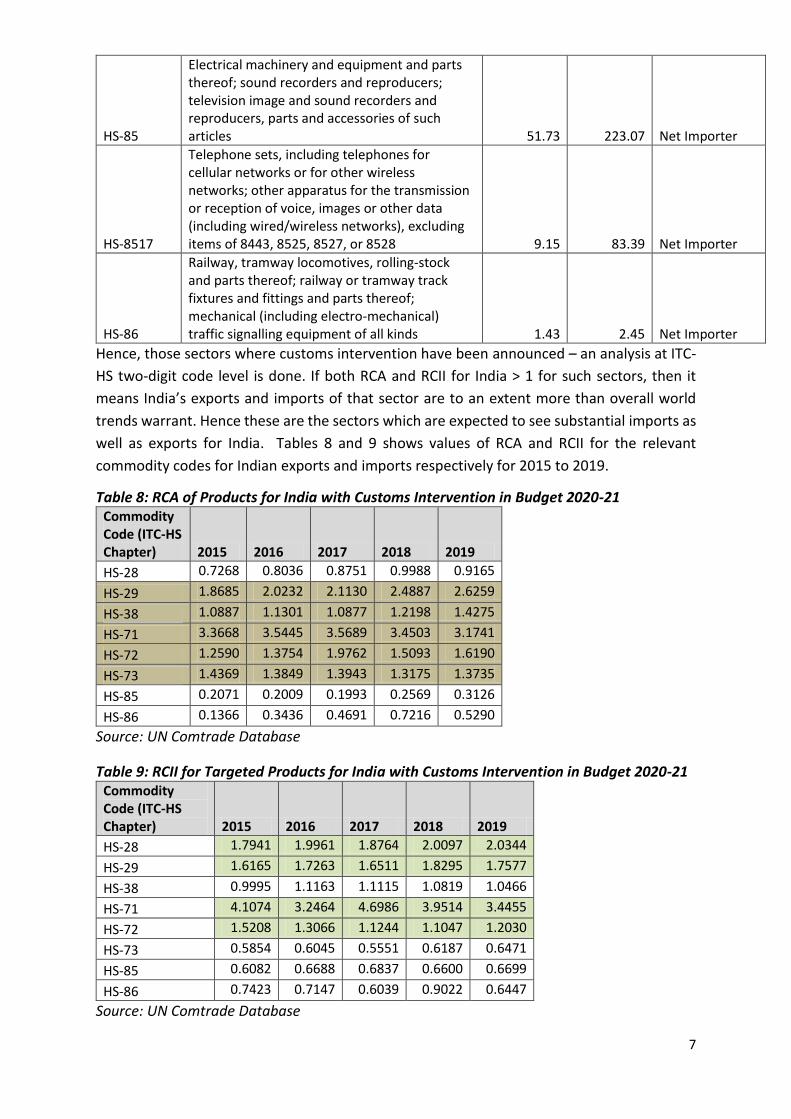
HS-85
Electrical machinery and equipment and parts thereof; sound recorders and reproducers; television image and sound recorders and reproducers, parts and accessories of such articles 51.73 223.07 Net Importer
HS-8517
Telephone sets, including telephones for cellular networks or for other wireless networks; other apparatus for the transmission or reception of voice, images or other data (including wired/wireless networks), excluding items of 8443, 8525, 8527, or 8528 9.15 83.39 Net Importer
HS-86
Railway, tramway locomotives, rolling-stock and parts thereof; railway or tramway track fixtures and fittings and parts thereof; mechanical (including electro-mechanical) traffic signalling equipment of all kinds 1.43 2.45 Net Importer
Hence, those sectors where customs intervention have been announced – an analysis at ITC-
HS two-digit code level is done. If both RCA and RCII for India > 1 for such sectors, then it
means India’s exports and imports of that sector are to an extent more than overall world
trends warrant. Hence these are the sectors which are expected to see substantial imports as
well as exports for India. Tables 8 and 9 shows values of RCA and RCII for the relevant
commodity codes for Indian exports and imports respectively for 2015 to 2019.
Table 8: RCA of Products for India with Customs Intervention in Budget 2020-21 Commodity Code (ITC-HS Chapter) 2015 2016 2017 2018 2019
HS-28 0.7268 0.8036 0.8751 0.9988 0.9165
HS-29 1.8685 2.0232 2.1130 2.4887 2.6259
HS-38 1.0887 1.1301 1.0877 1.2198 1.4275
HS-71 3.3668 3.5445 3.5689 3.4503 3.1741
HS-72 1.2590 1.3754 1.9762 1.5093 1.6190
HS-73 1.4369 1.3849 1.3943 1.3175 1.3735
HS-85 0.2071 0.2009 0.1993 0.2569 0.3126
HS-86 0.1366 0.3436 0.4691 0.7216 0.5290
Source: UN Comtrade Database
Table 9: RCII for Targeted Products for India with Customs Intervention in Budget 2020-21 Commodity Code (ITC-HS Chapter) 2015 2016 2017 2018 2019
HS-28 1.7941 1.9961 1.8764 2.0097 2.0344
HS-29 1.6165 1.7263 1.6511 1.8295 1.7577
HS-38 0.9995 1.1163 1.1115 1.0819 1.0466
HS-71 4.1074 3.2464 4.6986 3.9514 3.4455
HS-72 1.5208 1.3066 1.1244 1.1047 1.2030
HS-73 0.5854 0.6045 0.5551 0.6187 0.6471
HS-85 0.6082 0.6688 0.6837 0.6600 0.6699
HS-86 0.7423 0.7147 0.6039 0.9022 0.6447
Source: UN Comtrade Database
8
RCII is exceeding 1 for ITC-HS chapters 28,29, 71 and 72 (refer table 8).From table, it is seen
that RCA >1 for ITC HS Codes 29,28,71, 72 and 73, implying these sectors indicate greater
export promise for India vis-à-vis the world. These ITC-HS chapters are
29: Organic Chemicals
28: Inorganic chemicals, precious metal compound, isotopes
71: Pearls, precious stones, metals, coins, etc
72: Iron and steel
73: Articles of iron or steel
Thus to boost these sectoral exports, it may require reducing customs duties on imports of
these products or raw materials that add into the manufacture of these products with higher
export potential. This is under the assumption that these commodities once imported, with
substantial value addition are then exported back with higher price (perhaps with higher
degree of sectoral Intra-Industry Trade). The Budget 2020-21 seems to have echoed the above
logic by
Reducing customs duty on Naptha and other chemical (ITC-HS Chapter 28 and 29)
inputs to correct inversion which may boost imports of chemicals (used as raw
materials) and subsequently exports of finished products.
This may also substitute imports of finished chemical products through “Make in
India”. Carbon Black, Bis-phenol A, Epichlorohydrin custom duties were increased for
higher domestic value addition and more exports. There exists a fair degree of intra-
industry trade (refer table 9: Grubel-Lloyd Index above 0.5) for ITC-HS Chapter 29
(“Organic Chemicals) for India and the largest trading countries of the world. Thus,
India, may be both importing and exporting organic chemicals and if this is so, there is
higher interdependence and trade interrelationship between imports and exports of
organic chemicals and a change in customs-duty may have greater elasticity of
exports.
Reducing customs duty on Iron and Steel (ITC-HS Chapters 72 and 73) thus boosting
their imports by MSMEs in the wake of sharp rise in iron and steel prices.
This policy decision would help align the iron and steel industry with the Hon’ble Prime
Minister’s clarion call for self-reliant or “Atmanirbhar” Bharat and give a fillip to
MSMEs. MSMEs contribute 30% or one-third to India’s GDP, about 48% of exports and
has high employment potential.
However, export value of Gold and Silver (under ITC-HS Chapter 71) has not picked up in the
last few years despite disproportionately higher imports. Reduction of custom duty on gold
and silver may boost domestic demand on precious metals’ consumption but has bleak
potential for boosting value added exports as can be made out from the last five years’ trend
9
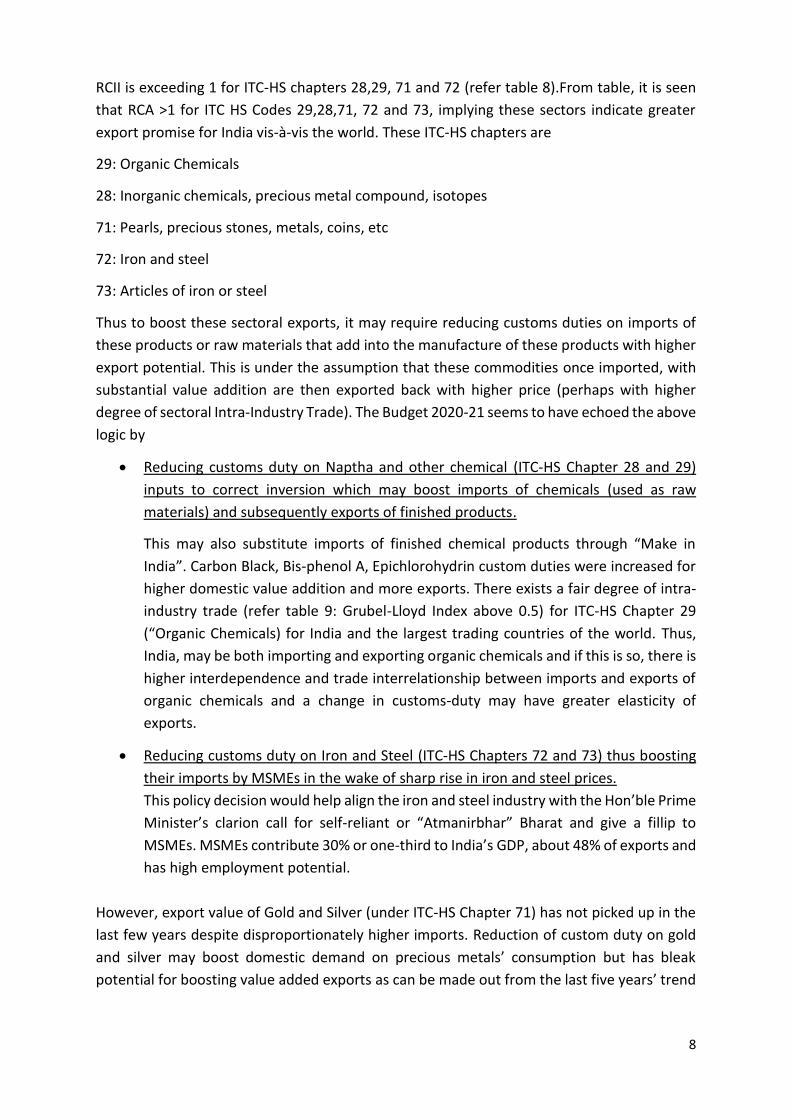
(refer to the export and import values in Billion US $ from years 2015 to 2019, for HS-7106
and HS-7108, in Tables 3 and 5 respectively).
Table 10: Intra-Industry Trade(IIT) between India and Top Importers in 2019
ITC-HS Chapters
Countries 28 29 71 72 73
USA 0.453 0.961 0.829 0.526 0.250
China 0.233 0.549 0.661 0.622 0.092
Germany 0.386 0.745 0.858 0.699 0.835
Source: UN Comtrade Database
Intra-industry trade usually takes place in the countries that have similar social structure and
economical. Meanwhile, the key factors that affecting intra-industry trade are product
differentiation, human capital intensity and economies of scale (Hu & Ma, 1999). The sources
of gains from intra-industry trade between similar economies—namely, the learning that
comes from a high degree of specialization and splitting up the value chain and from
economies of scale—are not contradictory to the earlier theory of comparative advantage.
Instead, they help to broaden the concept. Trade in intermediate goods reinforces the inter-
dependence between countries’ resources and factors to make the best possible utilisation
of inputs to enhance production and supply value chains.
Table 10 above shows that for the ITC HS Chapters 29,71 and 72 i.e. organic chemicals, gems
and jewellery and iron and steel, the IIT value is fairly high (shaded cells in Table 10) indicating
high degree of intra-industry trade and potential for more efficient allocation of resources in
the supply chain. Thus, it would be interesting to study how tinkering the quantum of imports
by India through customs duties’ changes in these industries, may lead to interactions with
value-added in exports.
The low values of Hirschman Index or Export Concentration Indices from 2015 to 2019 as shown in Table 11 for India shows that India’s export basket is not concentrated in a few commodities. The index value is used to determine export market competitiveness. Thus, India, albeit, exposed to lower levels of world trade and global industry concentration risk, does not have a much specialised export basket with “accumulation” in few product types and the Indian export market is fairly competitive. The closer the export market is to a monopoly with dominance in one or few products, the higher the market's concentration (and the lower its competition). If there were several entities or firms/exporters competing, each would have low market share, and the HHI would be close to zero, indicating near perfect competition.
Table 11: Hirshman-Herfindahl Index (HHI) between India and the World from 2015 to 2019 Year Hirschman
The above analysis has been attempted to examine the Budget 2020-21 proposals in the light
of few trade indices. With The Trade Complimentary Index (TCI) between Indian and the
World in 2019 was 0.39, there is a lot of potential to improve bilateral trade performance
between countries through trade agreements and treaties. Only if the exports of one country
match well with the imports of the other, and vice versa, and the trade complementarity is
high between two countries, it is beneficial to enter into a trade agreement. The Budget 2020-
21 does a prudent job in rationalising the Customs Duties structures, keeping the sectoral
needs in cognizance, balancing the objectives of giving boost to the critical MSME sector and
boosting export value addition with a thrust on “Atmanirbhar” and “Make in India”. The ITC
HS Chapters 29,28,71, 72 and 73 with greater export promise for India vis-à-vis the world
encompassing Chemicals, Pearls, precious stones, metals, coins and Iron and steel sector have
been suitably reviewed in the Budget through changes in import tariff structure. Doing away
with unwarranted exemptions on Customs Duties and easing of procedures and compliance
as well as the Turant Customs initiative are expected to give a fillip to the much-needed value-
added export trades as well as facilitation for domestic manufacturing and judicious import-
substitution.
***
11
Annexure-A
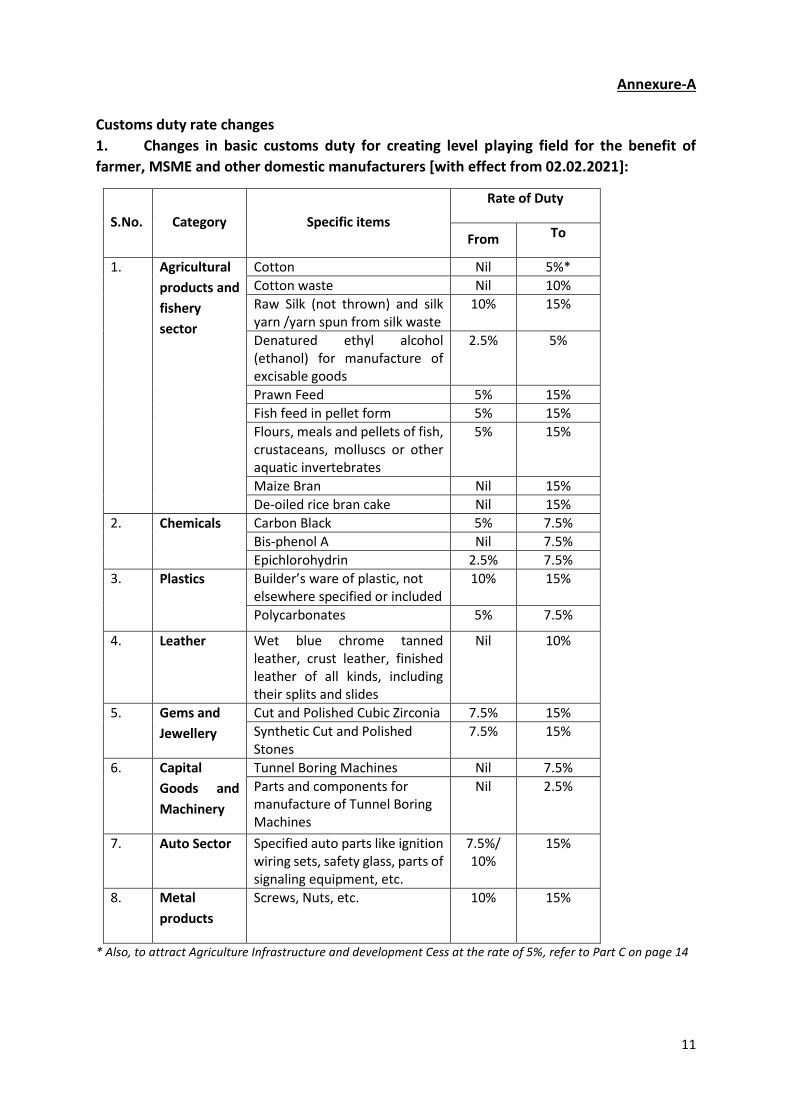
Customs duty rate changes
1. Changes in basic customs duty for creating level playing field for the benefit of
farmer, MSME and other domestic manufacturers [with effect from 02.02.2021]:
S.No. Category Specific items
Rate of Duty
From To
1. Agricultural
products and
fishery
sector
Cotton Nil 5%*
Cotton waste Nil 10%
Raw Silk (not thrown) and silk yarn /yarn spun from silk waste
10% 15%
Denatured ethyl alcohol (ethanol) for manufacture of excisable goods
2.5% 5%
Prawn Feed 5% 15%
Fish feed in pellet form 5% 15%
Flours, meals and pellets of fish, crustaceans, molluscs or other aquatic invertebrates
5% 15%
Maize Bran Nil 15%
De-oiled rice bran cake Nil 15%
2. Chemicals Carbon Black 5% 7.5%
Bis-phenol A Nil 7.5%
Epichlorohydrin 2.5% 7.5%
3. Plastics Builder’s ware of plastic, not elsewhere specified or included
10% 15%
Polycarbonates 5% 7.5%
4. Leather Wet blue chrome tanned leather, crust leather, finished leather of all kinds, including their splits and slides
Nil 10%
5. Gems and
Jewellery
Cut and Polished Cubic Zirconia 7.5% 15%
Synthetic Cut and Polished Stones
7.5% 15%
6. Capital
Goods and
Machinery
Tunnel Boring Machines Nil 7.5%
Parts and components for manufacture of Tunnel Boring Machines
Nil 2.5%
7. Auto Sector Specified auto parts like ignition wiring sets, safety glass, parts of signaling equipment, etc.
7.5%/ 10%
15%
8. Metal
products
Screws, Nuts, etc. 10% 15%
* Also, to attract Agriculture Infrastructure and development Cess at the rate of 5%, refer to Part C on page 14
12
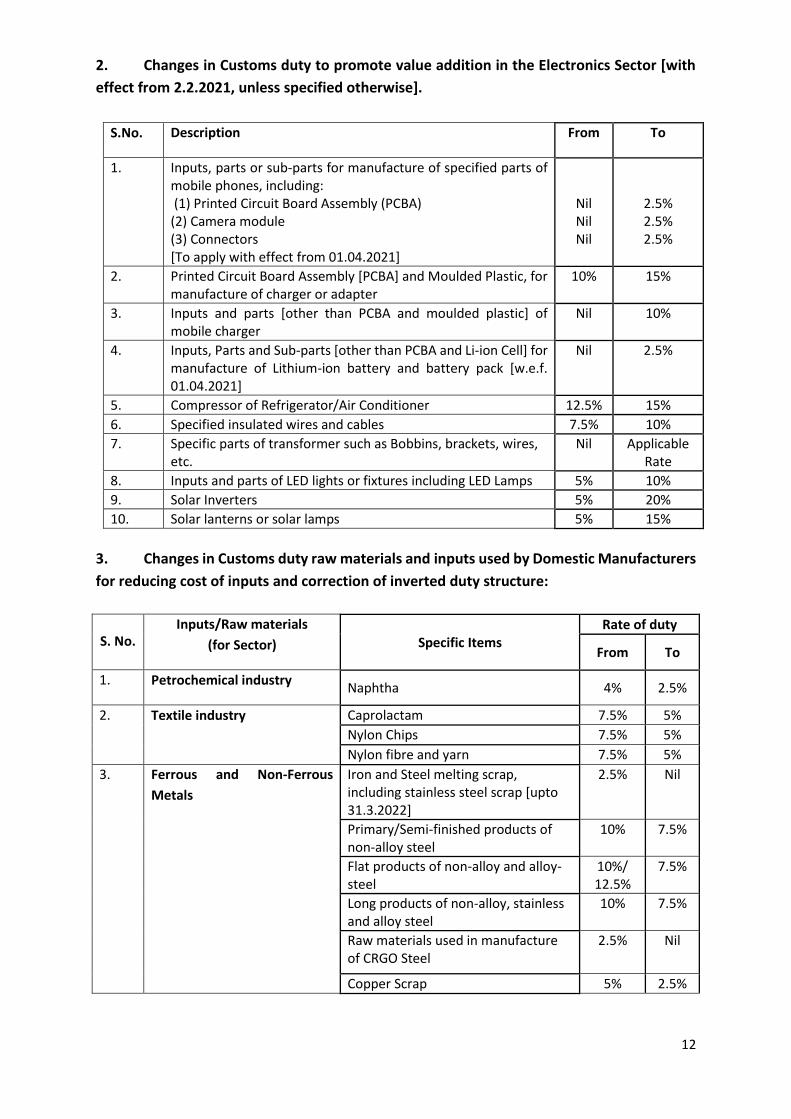
2. Changes in Customs duty to promote value addition in the Electronics Sector [with
effect from 2.2.2021, unless specified otherwise].
S.No. Description From To
1. Inputs, parts or sub-parts for manufacture of specified parts of mobile phones, including: (1) Printed Circuit Board Assembly (PCBA) (2) Camera module (3) Connectors [To apply with effect from 01.04.2021]
Nil Nil Nil
2.5% 2.5% 2.5%
2. Printed Circuit Board Assembly [PCBA] and Moulded Plastic, for manufacture of charger or adapter
10% 15%
3. Inputs and parts [other than PCBA and moulded plastic] of mobile charger
Nil 10%
4. Inputs, Parts and Sub-parts [other than PCBA and Li-ion Cell] for manufacture of Lithium-ion battery and battery pack [w.e.f. 01.04.2021]
Nil 2.5%
5. Compressor of Refrigerator/Air Conditioner 12.5% 15%
6. Specified insulated wires and cables 7.5% 10%
7. Specific parts of transformer such as Bobbins, brackets, wires, etc.
Nil Applicable Rate
8. Inputs and parts of LED lights or fixtures including LED Lamps 5% 10%
9. Solar Inverters 5% 20%
10. Solar lanterns or solar lamps 5% 15%
3. Changes in Customs duty raw materials and inputs used by Domestic Manufacturers
for reducing cost of inputs and correction of inverted duty structure:
S. No. Inputs/Raw materials
(for Sector) Specific Items Rate of duty
From To
1. Petrochemical industry Naphtha 4% 2.5%
2. Textile industry Caprolactam 7.5% 5%
Nylon Chips 7.5% 5%
Nylon fibre and yarn 7.5% 5%
3. Ferrous and Non-Ferrous
Metals
Iron and Steel melting scrap, including stainless steel scrap [upto 31.3.2022]
2.5% Nil
Primary/Semi-finished products of non-alloy steel
10% 7.5%
Flat products of non-alloy and alloy-steel
10%/ 12.5%
7.5%
Long products of non-alloy, stainless and alloy steel
10% 7.5%
Raw materials used in manufacture of CRGO Steel
2.5% Nil
Copper Scrap 5% 2.5%
13
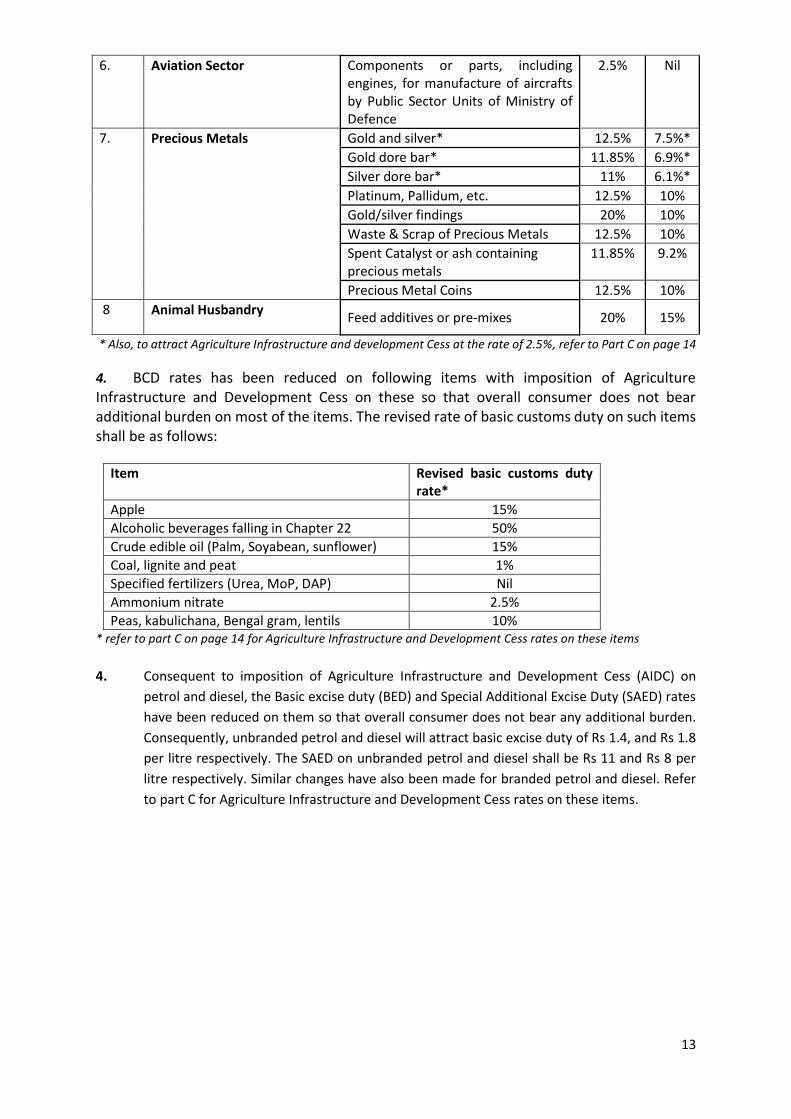
6. Aviation Sector Components or parts, including engines, for manufacture of aircrafts by Public Sector Units of Ministry of Defence
2.5% Nil
7. Precious Metals Gold and silver* 12.5% 7.5%*
Gold dore bar* 11.85% 6.9%*
Silver dore bar* 11% 6.1%*
Platinum, Pallidum, etc. 12.5% 10%
Gold/silver findings 20% 10%
Waste & Scrap of Precious Metals 12.5% 10%
Spent Catalyst or ash containing precious metals
11.85% 9.2%
Precious Metal Coins 12.5% 10%
8 Animal Husbandry Feed additives or pre-mixes 20% 15%
* Also, to attract Agriculture Infrastructure and development Cess at the rate of 2.5%, refer to Part C on page 14
4. BCD rates has been reduced on following items with imposition of Agriculture Infrastructure and Development Cess on these so that overall consumer does not bear additional burden on most of the items. The revised rate of basic customs duty on such items shall be as follows:
Item Revised basic customs duty rate*
Apple 15%
Alcoholic beverages falling in Chapter 22 50%
Crude edible oil (Palm, Soyabean, sunflower) 15%
Coal, lignite and peat 1%
Specified fertilizers (Urea, MoP, DAP) Nil
Ammonium nitrate 2.5%
Peas, kabulichana, Bengal gram, lentils 10% * refer to part C on page 14 for Agriculture Infrastructure and Development Cess rates on these items
4. Consequent to imposition of Agriculture Infrastructure and Development Cess (AIDC) on
petrol and diesel, the Basic excise duty (BED) and Special Additional Excise Duty (SAED) rates
have been reduced on them so that overall consumer does not bear any additional burden.
Consequently, unbranded petrol and diesel will attract basic excise duty of Rs 1.4, and Rs 1.8
per litre respectively. The SAED on unbranded petrol and diesel shall be Rs 11 and Rs 8 per
litre respectively. Similar changes have also been made for branded petrol and diesel. Refer
to part C for Agriculture Infrastructure and Development Cess rates on these items.
14
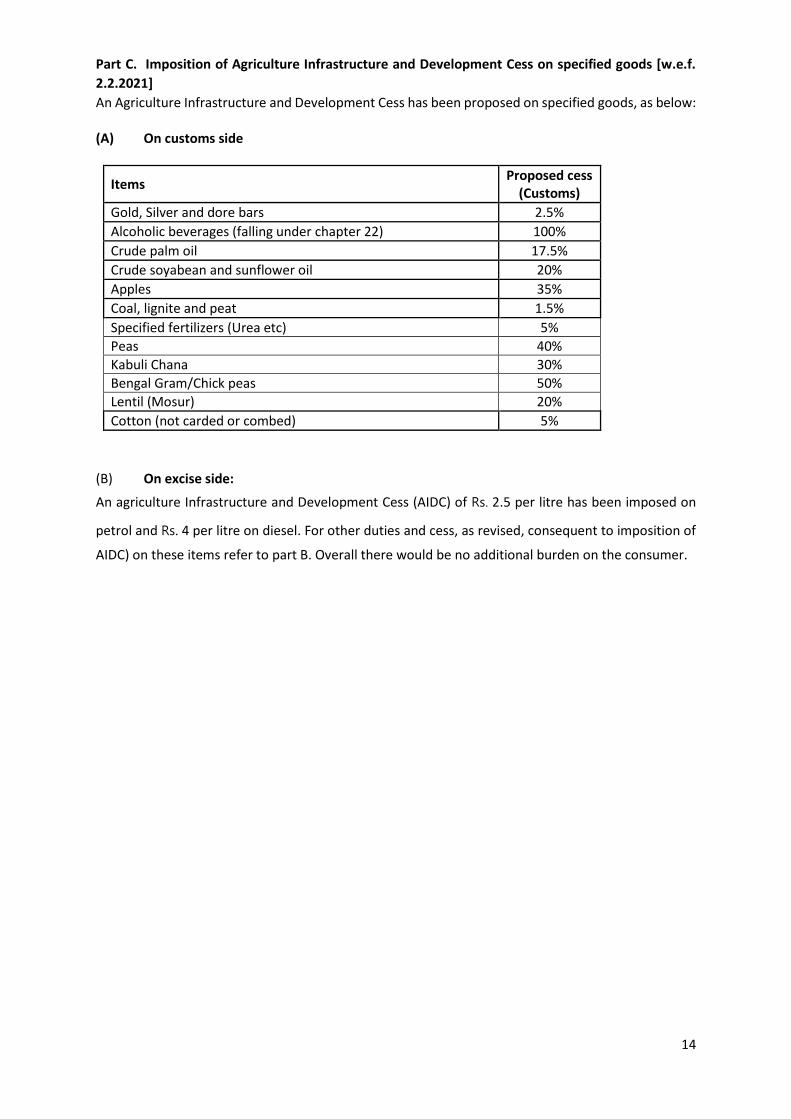
Part C. Imposition of Agriculture Infrastructure and Development Cess on specified goods [w.e.f.
2.2.2021]
An Agriculture Infrastructure and Development Cess has been proposed on specified goods, as below: (A) On customs side
Items Proposed cess
(Customs)
Gold, Silver and dore bars 2.5%
Alcoholic beverages (falling under chapter 22) 100%
Crude palm oil 17.5%
Crude soyabean and sunflower oil 20%
Apples 35%
Coal, lignite and peat 1.5%
Specified fertilizers (Urea etc) 5%
Peas 40%
Kabuli Chana 30%
Bengal Gram/Chick peas 50%
Lentil (Mosur) 20%
Cotton (not carded or combed) 5%
(B) On excise side:
An agriculture Infrastructure and Development Cess (AIDC) of Rs. 2.5 per litre has been imposed on
petrol and Rs. 4 per litre on diesel. For other duties and cess, as revised, consequent to imposition of
AIDC) on these items refer to part B. Overall there would be no additional burden on the consumer.
15
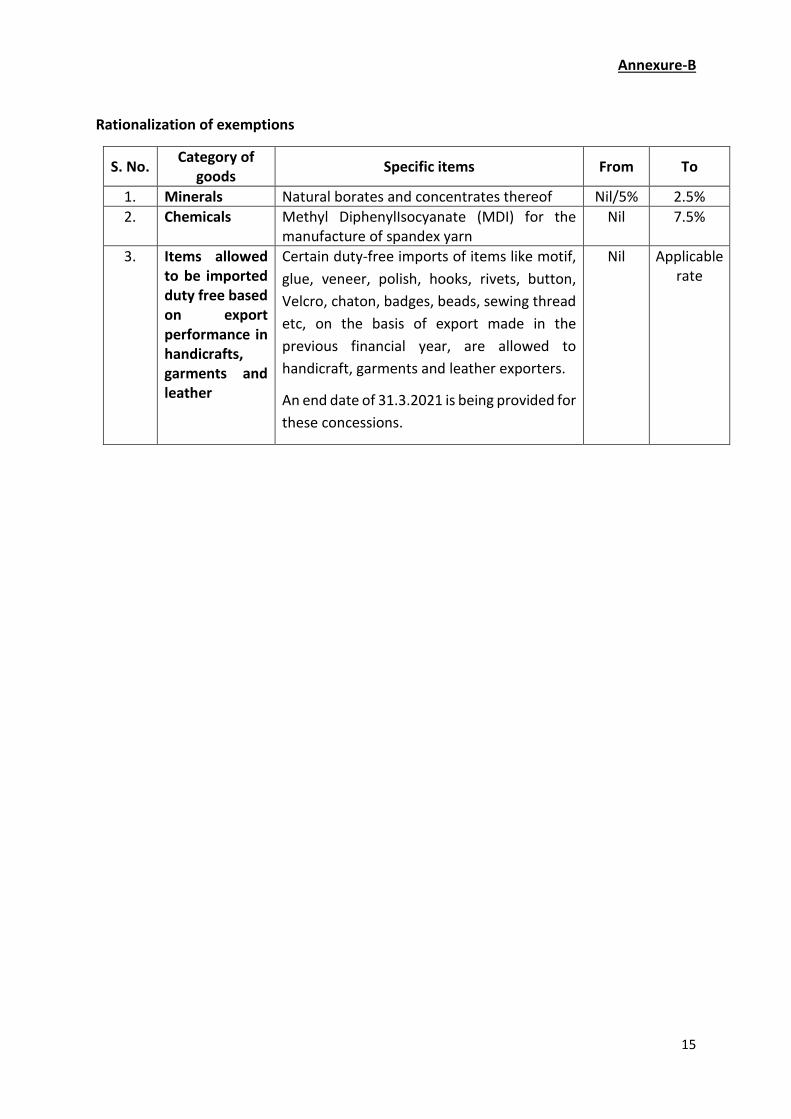
Annexure-B
Rationalization of exemptions
S. No. Category of
goods Specific items From To
1. Minerals Natural borates and concentrates thereof Nil/5% 2.5%
2. Chemicals Methyl DiphenylIsocyanate (MDI) for the manufacture of spandex yarn
Nil 7.5%
3. Items allowed to be imported duty free based on export performance in handicrafts, garments and leather
Certain duty-free imports of items like motif,
glue, veneer, polish, hooks, rivets, button,
Velcro, chaton, badges, beads, sewing thread
etc, on the basis of export made in the
previous financial year, are allowed to
handicraft, garments and leather exporters.
An end date of 31.3.2021 is being provided for
these concessions.
Nil Applicable rate
16
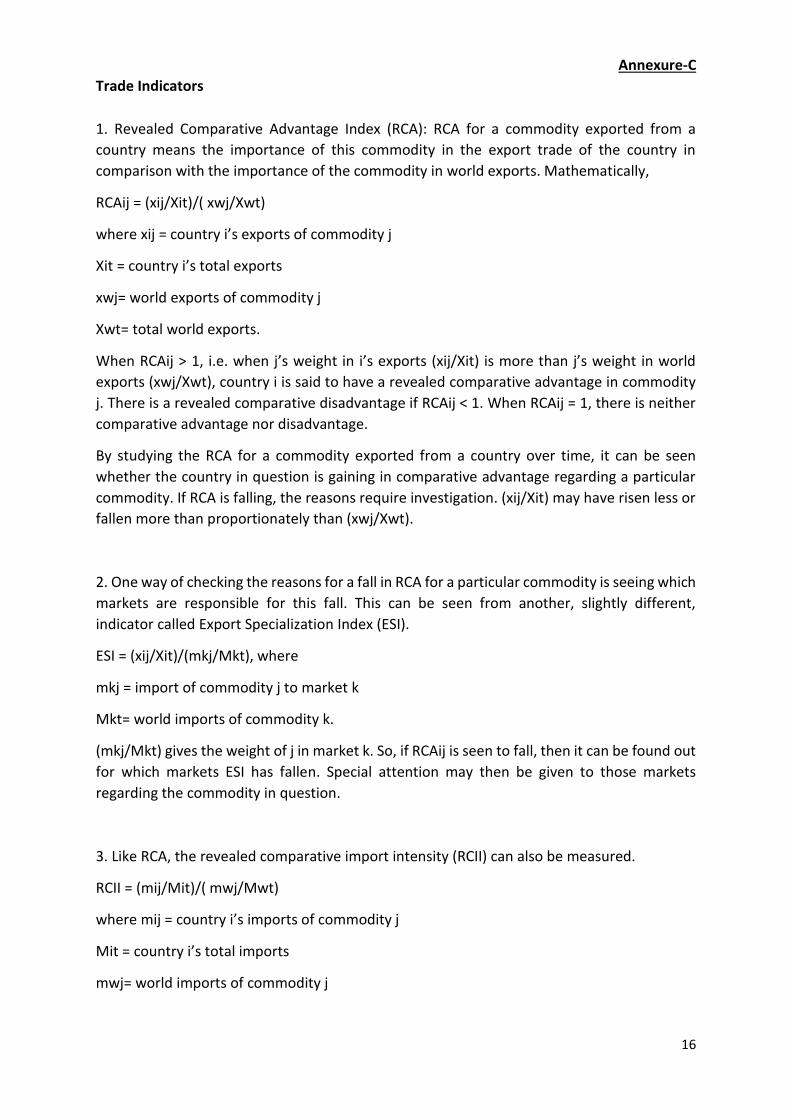
Annexure-C
Trade Indicators
1. Revealed Comparative Advantage Index (RCA): RCA for a commodity exported from a
country means the importance of this commodity in the export trade of the country in
comparison with the importance of the commodity in world exports. Mathematically,
RCAij = (xij/Xit)/( xwj/Xwt)
where xij = country i’s exports of commodity j
Xit = country i’s total exports
xwj= world exports of commodity j
Xwt= total world exports.
When RCAij > 1, i.e. when j’s weight in i’s exports (xij/Xit) is more than j’s weight in world
exports (xwj/Xwt), country i is said to have a revealed comparative advantage in commodity
j. There is a revealed comparative disadvantage if RCAij < 1. When RCAij = 1, there is neither
comparative advantage nor disadvantage.
By studying the RCA for a commodity exported from a country over time, it can be seen
whether the country in question is gaining in comparative advantage regarding a particular
commodity. If RCA is falling, the reasons require investigation. (xij/Xit) may have risen less or
fallen more than proportionately than (xwj/Xwt).
2. One way of checking the reasons for a fall in RCA for a particular commodity is seeing which
markets are responsible for this fall. This can be seen from another, slightly different,
indicator called Export Specialization Index (ESI).
ESI = (xij/Xit)/(mkj/Mkt), where
mkj = import of commodity j to market k
Mkt= world imports of commodity k.
(mkj/Mkt) gives the weight of j in market k. So, if RCAij is seen to fall, then it can be found out
for which markets ESI has fallen. Special attention may then be given to those markets
regarding the commodity in question.
3. Like RCA, the revealed comparative import intensity (RCII) can also be measured.
RCII = (mij/Mit)/( mwj/Mwt)
where mij = country i’s imports of commodity j
Mit = country i’s total imports
mwj= world imports of commodity j
17
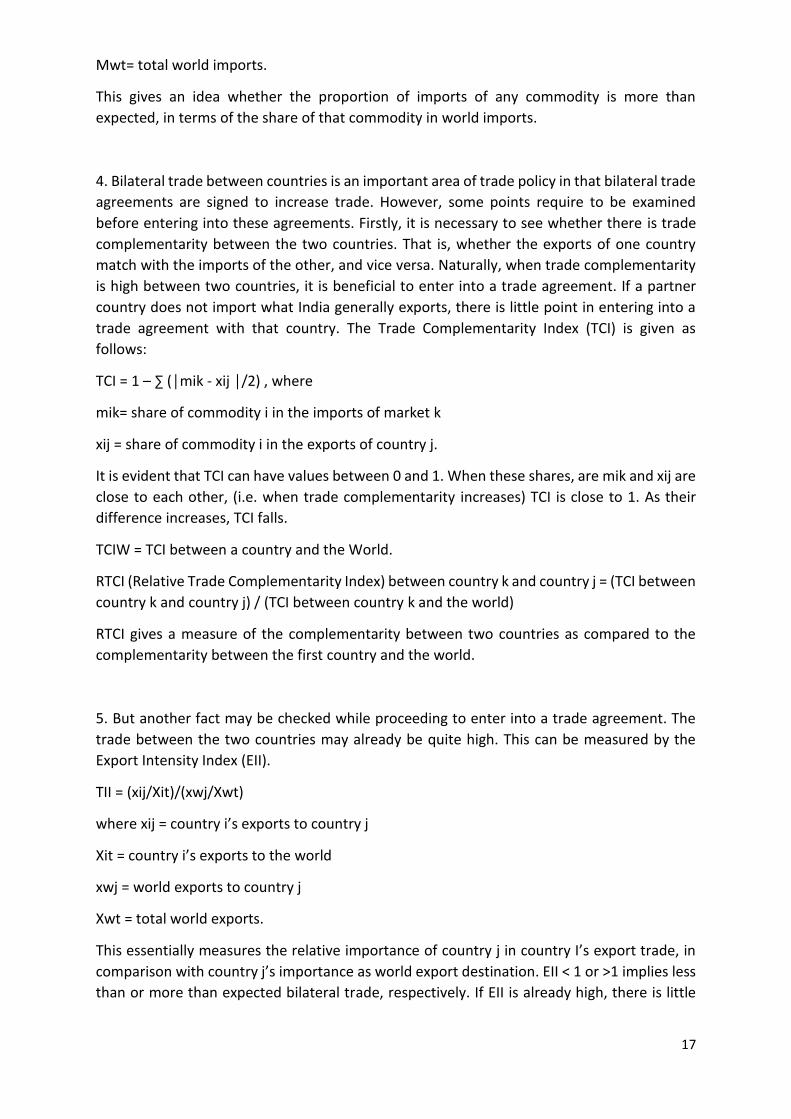
Mwt= total world imports.
This gives an idea whether the proportion of imports of any commodity is more than
expected, in terms of the share of that commodity in world imports.
4. Bilateral trade between countries is an important area of trade policy in that bilateral trade
agreements are signed to increase trade. However, some points require to be examined
before entering into these agreements. Firstly, it is necessary to see whether there is trade
complementarity between the two countries. That is, whether the exports of one country
match with the imports of the other, and vice versa. Naturally, when trade complementarity
is high between two countries, it is beneficial to enter into a trade agreement. If a partner
country does not import what India generally exports, there is little point in entering into a
trade agreement with that country. The Trade Complementarity Index (TCI) is given as
follows:
TCI = 1 – ∑ (│mik - xij │/2) , where
mik= share of commodity i in the imports of market k
xij = share of commodity i in the exports of country j.
It is evident that TCI can have values between 0 and 1. When these shares, are mik and xij are
close to each other, (i.e. when trade complementarity increases) TCI is close to 1. As their
difference increases, TCI falls.
TCIW = TCI between a country and the World.
RTCI (Relative Trade Complementarity Index) between country k and country j = (TCI between
country k and country j) / (TCI between country k and the world)
RTCI gives a measure of the complementarity between two countries as compared to the
complementarity between the first country and the world.
5. But another fact may be checked while proceeding to enter into a trade agreement. The
trade between the two countries may already be quite high. This can be measured by the
Export Intensity Index (EII).
TII = (xij/Xit)/(xwj/Xwt)
where xij = country i’s exports to country j
Xit = country i’s exports to the world
xwj = world exports to country j
Xwt = total world exports.
This essentially measures the relative importance of country j in country I’s export trade, in
comparison with country j’s importance as world export destination. EII < 1 or >1 implies less
than or more than expected bilateral trade, respectively. If EII is already high, there is little
18
scope of further increasing bilateral trade between i and j. But if is low, and if TCI is high,
bilateral trade can very well be increased through trade agreements.
6. A related indicator is the Export Similarity Index (XSI), which helps us identify a country’s
competitors.
XSI = ∑ [ min (Xij, Xik)*100]
where Xij= share of commodity i in exports of country j
Xik= share of commodity i in exports of country k
XSI can vary between 0 and 100. It will be seen that when Xij= Xik for all i’s, XSI = 100, which
means complete export similarity between countries j and k. As Xij and Xik start to differ, XSI
falls. Countries exporting the same commodities are competitors in the world market, and
export strategies, taking in to account such competition, have to be designed accordingly.
7. It is necessary to know whether the exports of a country are concentrated in a few
products. A high concentration, while enabling a country to reap the benefits of specialization
and economies of scale, also exposes a country to the risks arising from the vicissitudes of
global trade. The Hirschman Index (HI), used by UNCTAD, is a handy measure for monitoring
export concentration.
HI = √[∑Sq(xi/Xt)]
where xi is the country’s exports of commodity i
Xt is the country’s total exports.
HI ranges from (1/n) to 1. The higher the value of HI, the higher the concentration of
exports.
8. Intraindustry trade is of importance as it can increase and expand markets. The standard
indicator is the Index of Intraindustry Trade (IIT).
IITjk = 1 – [∑│Xijk – Mijk│/ (Xijk + Mijk)]
where Xijk = exports of products of industry i from country j to country k
Mijk = imports of products of industry i from country k to country j.
IIT can take values from 1 (extremely high intra-industry trade, exports equalling imports) to