Page 1
CUTS International Page 1
CUTS Dossier on Preferential Trade Agreements
January-March 2018
(Volume XII, No. 1)
Contents
1. Indonesia-Australia Comprehensive Economic Partnership Agreement ............................... 1
2. Canada-Mercosur Preferential Trade Agreement .................................................................. 5
3. Sri Lanka Singapore Free Trade Agreement ......................................................................... 9
1. Indonesia-Australia Comprehensive Economic Partnership Agreement
Australia and Indonesia are building on the ASEAN-Australia-New Zealand Free Trade
Agreement which has a focus on tariff reduction and economic integration into ASEAN,
including an aid-for-trade program. They have been working since 2010 to put together an
Economic Partnership Agreement which is expected to address impediments to bilateral
trade, including both tariff and non-tariff barriers. It is also hoped that the Indonesia-Australia
Comprehensive Economic Partnership Agreement (IA-CEPA) could improve access for both
countries in each other’s services markets and address impediments to increasing Australian
investment in Indonesia and Indonesian investment in Australia. IA-CEPA aims to liberalise
the current trading environment by eliminating and reducing tariff barriers, building more
trade facilitative processes, and improving conditions that impede their services suppliers and
investors. The ninth round of negotiations concluded in October 2017.
(https://www.aph.gov.au/Parliamentary_Business/Committees/Joint/Trade_and_Investment_
Growth/IndonesiaTrade/Report_1/section?id=committees%2Freportjnt%2F024065%2F2460
1)
CUTS Comments
Indonesia is India’s second largest trading partner amongst the ASEAN (10-member
Association of Southeast Asian Nations) countries. India is in a trade agreement with
Indonesia through the India-ASEAN free trade agreement and with Australia the negotiations
are going on to establish free trade relations.
Top ten exported products of India and Indonesia to Australia in 2016 are given by Table 1.1.
The volume of India’s and Indonesia’s top ten export products is roughly the same but in
overall term Indonesia exports more to Australia.
India and Indonesia’s exports to Australia are of diverse nature and there is no product
overlapping between the exports of these two. In general, both are exporting petroleum oils &
oils obtained from bituminous to Australia but the former is exporting the same in non-crude
form, whereas the latter is exporting in crude form.
Page 2
CUTS International Page 2
Table 1.1: India and Indonesia’s Top Ten Exports to Australia
Product
Code Product Description
India’s Exports to
Australia
Indonesia’s Exports to
Australia
Export Value in
2016 (US$ mn)
CAGR
(2012-16)
Export Value in
2016 (US$ mn)
CAGR
(2012-16)
271019 Petroleum oils & oils obtained from
bituminous (Non-crude)
496.54
(16.84) 27.44 -- --
271011 Light petroleum oils & preparations 265.72
(9.01) 66.91 -- --
300490 Medicaments 172.7
(5.86) 15.14 -- --
710239 Diamonds 159.33
(5.4) 1.31 -- --
711319 Articles of jewellery & parts thereof 105.85
(3.59) -3.19 -- --
870322 Transport Vehicle 38.45
(1.3) -25.49 -- --
100630 Semi-milled/wholly milled rice 35.34
(1.2) 6.07 -- --
630260 Toilet linen & kitchen linen 33.4
(1.13) 9.13 -- --
300410 Medicaments containing
penicillins/derivatives
22.15
(0.75) 21.73 -- --
380893 Herbicides 21.59
(0.73) 16.35 -- --
270900 Petroleum oils & oils obtained from
bituminous (Crude) -- --
534.3
(16.7) -23.29
730890 Mechanical structures and their parts -- -- 435.53
(13.61) 70.76
440929 Wood (including strips & friezes for
parquet flooring, not assembled) -- --
99.46
(3.11) -5.96
401110 New pneumatic tyres -- -- 54.25
(1.7) -15.74
480300 Toilet tissue and napkin paper -- -- 47.43
(1.48) 12.86
310210 Urea, whether/not in aqueous solution -- -- 46.89
(1.47) -15.61
730799 Tube/pipe fittings of iron/steel -- -- 43.9
(1.37) 191.67
847490 Parts of the machinery -- -- 43.57
(1.36) 7.94
731589 Chain, of iron/steel -- -- 42
(1.31) 362.38
852872 Colour reception apparatus for television -- -- 40.69
(1.27) -17.96
Sub-Total* 1351.06
(45.82) --
1388.02
(43.39) --
Total Exports in 2016 (US$ mn) 2948.41 -- 3199.01 --
Notes: Values in the parenthesis are export shares of particular products in total exports;
* Summation of the top ten exported products
Source: WITS database
India and Australia’s top ten exports, with their corresponding CAGRs, to Indonesia are
represented by Table 1.2. Australia’s top ten exports to Indonesia are roughly twice in
comparison to that of India but this difference is little in terms of total exports.
Page 3
CUTS International Page 3
India and Australia are competing in two products in Indonesia’s market. They are: meat of
bovine animals and cotton (non-carded/combed). Though the volume of exports of meat of
bovine animals is nearly the same from India and Australia but India’s CAGR is very high
(201.07) as compared to that of Australia (24.65). This rapid growth of India’s exports shows
that in future India may face more competition Australia as a result of the formation of this
CEPA between Indonesia and Australia.
Table 1.2: India and Australia’s Top Ten Exports to Indonesia
Product
Code Product Description
India’s Exports to
Indonesia
Australia’s Exports to
Indonesia
Export Value in
2016 (US$ mn)
CAGR
(2012-16)
Export Value in
2016 (US$ mn)
CAGR
(2012-16)
120220 Ground-nuts 218.34
(6.97) 1.21 -- --
20230 Meat of bovine animals 203.39
(6.5) 201.07
208.18
(5.24) 24.65
890590 Light-vessels 173.89
(5.55) 44.24 -- --
890400 Tugs & pusher craft 112.17
(3.58) 20.17 -- --
290243 p-Xylene 107.97
(3.45) -31.33 -- --
870899 Motor Vehicle parts 79.66
(2.54) -7.45 -- --
520100 Cotton (Non-carded/combed) 73.14
(2.34) 14.32
129.05
(3.25) -15.11
271011 Light petroleum oils & preparations 61.23
(1.96) -54.14 -- --
90420 Fruits of the genera Capsicum/Pimenta 48.69
(1.55) 28.07 -- --
721913 Flat-rolled products of stainless steel 46.71
(1.49) -5.43 -- --
100190 Wheat other than durum wheat -- -- 732.09
(18.41) -14.50
10290 Live bovine animals -- -- 511.14
(12.86) 28.12
270900 Petroleum oils & oils obtained from
bituminous (Crude) -- -- 457.56
(11.51) 16.12
270112 Bituminous coal -- -- 217.74
(5.48) 771.03
40210 Milk in powder/granules/other solid
form -- -- 77.53
(1.95) 2.43
790111 Zinc, not alloyed, unwrought -- -- 54.83
(1.38) 21.23
230110 Flours, meals & pellets of meat/meat
offal -- -- 53.28
(1.34) -14.13
760110 Aluminum, not alloyed, unwrought -- -- 50.36
(1.27) -30.44
Sub-Total* 1125.18
(35.93) --
2491.75
(62.67) --
Total Exports in 2016 (US$ mn) 3131.5 -- 3975.95 --
Notes: Values in the parenthesis are export shares of particular products in total exports;
* Summation of the top ten exported products
Source: WITS database
The other common product is cotton (non-carded/combed). Though Australia’s export value
is nearly twice than that of India but this is declining over time, as shown by negative CAGR.
On the other hand, India’s exports of the same product are making decent progress overtime.
Page 4
CUTS International Page 4
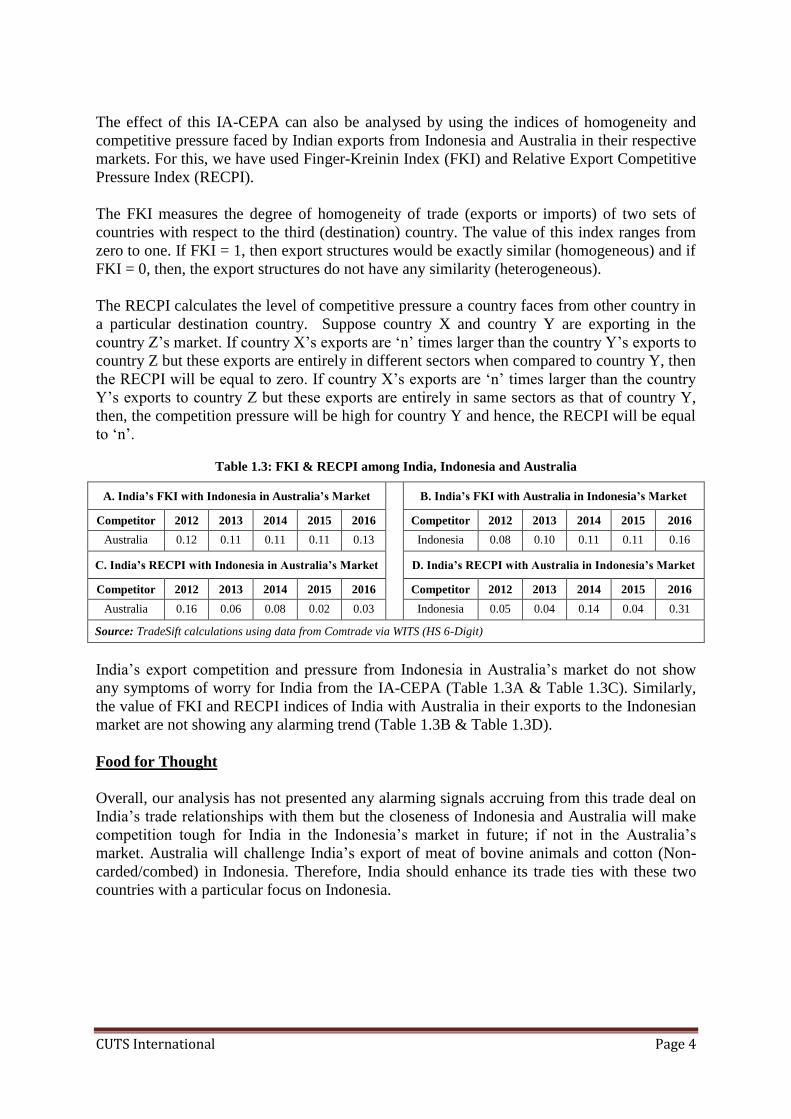
The effect of this IA-CEPA can also be analysed by using the indices of homogeneity and
competitive pressure faced by Indian exports from Indonesia and Australia in their respective
markets. For this, we have used Finger-Kreinin Index (FKI) and Relative Export Competitive
Pressure Index (RECPI).
The FKI measures the degree of homogeneity of trade (exports or imports) of two sets of
countries with respect to the third (destination) country. The value of this index ranges from
zero to one. If FKI = 1, then export structures would be exactly similar (homogeneous) and if
FKI = 0, then, the export structures do not have any similarity (heterogeneous).
The RECPI calculates the level of competitive pressure a country faces from other country in
a particular destination country. Suppose country X and country Y are exporting in the
country Z’s market. If country X’s exports are ‘n’ times larger than the country Y’s exports to
country Z but these exports are entirely in different sectors when compared to country Y, then
the RECPI will be equal to zero. If country X’s exports are ‘n’ times larger than the country
Y’s exports to country Z but these exports are entirely in same sectors as that of country Y,
then, the competition pressure will be high for country Y and hence, the RECPI will be equal
to ‘n’.
Table 1.3: FKI & RECPI among India, Indonesia and Australia
A. India’s FKI with Indonesia in Australia’s Market
B. India’s FKI with Australia in Indonesia’s Market
Competitor 2012 2013 2014 2015 2016
Competitor 2012 2013 2014 2015 2016
Australia 0.12 0.11 0.11 0.11 0.13 Indonesia 0.08 0.10 0.11 0.11 0.16
C. India’s RECPI with Indonesia in Australia’s Market
D. India’s RECPI with Australia in Indonesia’s Market
Competitor 2012 2013 2014 2015 2016
Competitor 2012 2013 2014 2015 2016
Australia 0.16 0.06 0.08 0.02 0.03 Indonesia 0.05 0.04 0.14 0.04 0.31
Source: TradeSift calculations using data from Comtrade via WITS (HS 6-Digit)
India’s export competition and pressure from Indonesia in Australia’s market do not show
any symptoms of worry for India from the IA-CEPA (Table 1.3A & Table 1.3C). Similarly,
the value of FKI and RECPI indices of India with Australia in their exports to the Indonesian
market are not showing any alarming trend (Table 1.3B & Table 1.3D).
Food for Thought
Overall, our analysis has not presented any alarming signals accruing from this trade deal on
India’s trade relationships with them but the closeness of Indonesia and Australia will make
competition tough for India in the Indonesia’s market in future; if not in the Australia’s
market. Australia will challenge India’s export of meat of bovine animals and cotton (Non-
carded/combed) in Indonesia. Therefore, India should enhance its trade ties with these two
countries with a particular focus on Indonesia.
Page 5
CUTS International Page 5
2. Canada-Mercosur Free Trade Agreement
Ministers of the Mercosur1 member states underscored the opportunity for a comprehensive,
progressive and commercially meaningful free trade agreement (FTA) which will provide
mutual benefit to Canada and Mercosur. Strengthening ties through enhanced trade and
investment flows is an integral step toward a shared interest in sustainable prosperity and a
shared commitment to trade liberalization and open markets. The ministers recognized the
importance of advancing this initiative in an inclusive manner. Mercosur and Canada will
seek to negotiate issues such as market access for goods and services, labour, the
environment, trade and gender, micro-, small and medium-sized enterprises, among others.
Integrating these elements will reinforce a collective commitment to lasting economic growth
and development for all people. Following the announcement made on March 9, 2018 in
Asuncion, Paraguay, to launch negotiations toward a comprehensive Canada-Mercosur free
trade agreement (FTA), the Honourable François-Philippe Champagne, Minister of
International Trade, is pleased to welcome the first round of formal negotiations in Ottawa
from March 20 to 23, 2018.
(https://www.canada.ca/en/global-affairs/news/2018/03/minister-of-international-trade-
welcomes-first-round-of-negotiations-with-mercosur-countries-in-ottawa.html)
CUTS Comments
India has a preferential trade agreement (PTA) with Mercosur and is now putting more efforts
to expand this existing PTA, whereas, with Canada India is still looking for a breakthrough.
India, Canada and Mercosur’s volume of exports of top ten exported products with their
corresponding CAGRs is given by Table 2.1 and Table 2.2, respectively. From Table 2.1, it is
clear that India is in competition with Canada in two commodities: medicaments and
petroleum oils & oils obtained from bituminous (non-crude).
Canada’s exports of medicaments are more than double than the Indian exports and are also
having very high CAGR. These exports account for only four per cent of India’s total exports
to Mercosur, whereas, for Canada, the same products account for more than 15 per cent of
Canada’s total exports to Mercosur.
India’s exports of petroleum oils & oils obtained from bituminous (non-crude) to Mercosur
are six times higher than Canada’s exports. Both are experiencing a declining CAGR and this
decline in CAGR is higher in case of growth of Indian exports (-55.86).
1 Mercosur includes Argentina, Brazil, Paraguay and Uruguay
Page 6
CUTS International Page 6
Table 2.1: India and Canada’s Top Ten Exports to Mercosur
Product
Code Product Description
India’s Exports to
Mercosur
Canada’s Exports to
Mercosur
Export Value in
2016 (US$ mn)
CAGR
(2012-16)
Export Value in
2016 (US$ mn)
CAGR
(2012-16)
540233 Textured yarn 154.91
(5.05) -6.56
380892 Fungicides 133.27
(4.34) 52.06
300490 Medicaments 132.89
(4.33) 4.94
296.74
(15.59) 99.68
271019 Petroleum oils & oils obtained from
bituminous (Non-crude)
127.85
(4.17) -55.86
24.04
(1.26) -13.84
380891 Insecticides 115.49
(3.76) -15.70
870899 Motor Vehicle parts 110.76
(3.61) 1.43
380899 Rodenticides & other biocides 80.26
(2.61) 10.38
294200 Organic Compounds 62.82
(2.05) -17.71
380893 Herbicides, anti-sprounting products
& plant-growth regulators
55.93
(1.82) 29.10
840710 Spark-ignition reciprocating/rotary 51.09
(1.66) NA#
310420 Potassium chloride 498.33
(26.18) -11.36
270112 Bituminous coal 124.54
(6.54) -25.03
480100 Newsprint 69.69
(3.66) -23.59
270900 Petroleum oils & oils obtained from
bituminous (Crude)
64
(3.36) NA#
880529 Ground flying trainers 35.99
(1.89) 5.63
100190 Wheat other than durum wheat 34.84
(1.83) 333.61
880330 Parts of aeroplanes/helicopters 33.81
(1.78) 32.4
999999 Commodities not specified 23.1
(1.21) -6.2
Sub-Total* 1025.27
(33.40)
1205.08
(63.32)
Total Exports in 2016 (US$ mn) 3069.48 1903.16
Notes: Values in the parenthesis are export shares of particular products in total exports;
* Summation of the top ten exported products # Data for the year 2012 is not available.
Source: WITS database
Table 2.2 highlights that Mercosur’s total exports to Canada are approximately double than
that of India. Furthermore, there is no product that India and Mercosur are exporting
commonly to Canada’s market.
Like in Canada’s market, India is mainly exporting medicament products to Mercosur’s
market. On the other hand, the majority of Canada’s exports are gold, aluminium oxide and
cane sugar (raw) in solid form.
Page 7
CUTS International Page 7
Table 2.2: India and Mercosur’s Top Ten Exports to Canada
Product
Code Product Description
India’s Exports to
Canada
Mercosur’s Exports to
Canada
Export Value in
2016 (US$ mn)
CAGR
(2012-16)
Export Value in
2016 (US$ mn)
CAGR
(2012-16)
300490 Medicaments 123.57
(6.27) 3.29 -- --
30613 Shrimps & prawns (Frozen) 75.97
(3.86) 7.33 -- --
711319 Articles of jewellery & parts 69.72
(3.54) 3.79 -- --
710239 Diamonds 43.42
(2.20) 6.89 -- --
870899 Motor Vehicles parts 39.54
(2.01) 33.44 -- --
100630 Semi-milled or wholly milled rice 34.59
(1.76) -2.19 -- --
630260 Toilet linen & kitchen linen 32.81
(1.67) 19.91 -- --
392690 Articles of plastics 27.47
(1.39) 5.86 -- --
610910 Knitted garments 24.36
(1.24) -7.45 -- --
630419 Bedspreads (non-knitted ) 23.05
(1.17) 16.91 -- --
710812 Gold -- -- 1102.59
(30.70) -12.77
281820 Aluminium oxide -- -- 750.98
(20.91) 5.40
170111 Cane sugar, raw, in solid form -- -- 257.04
(7.16) -14.41
710813 Gold -- -- 198.49
(5.53) 59.50
90111 Coffee -- -- 124.24
(3.46) 5.28
20230 Meat of bovine animals (Frozen) -- -- 66.92
(1.86) 5.89
220421 Wine -- -- 64.52
(1.80) -6.73
260600 Aluminium ores & concentrates -- -- 59.10
(1.65) -0.32
720712 Semi-finished products of iron -- -- 53.00
(1.48) 30.84
842920 Self-propelled graders & levellers -- -- 46.08
(1.28) 2.65
Sub-Total* 494.51
(25.10) --
2722.96
(75.81) --
Total Exports in 2016 (US$ mn) 1970.16 -- 3591.68 --
Notes: Values in the parenthesis are export shares of particular products in total exports;
* Summation of the top ten exported products
Source: WITS database
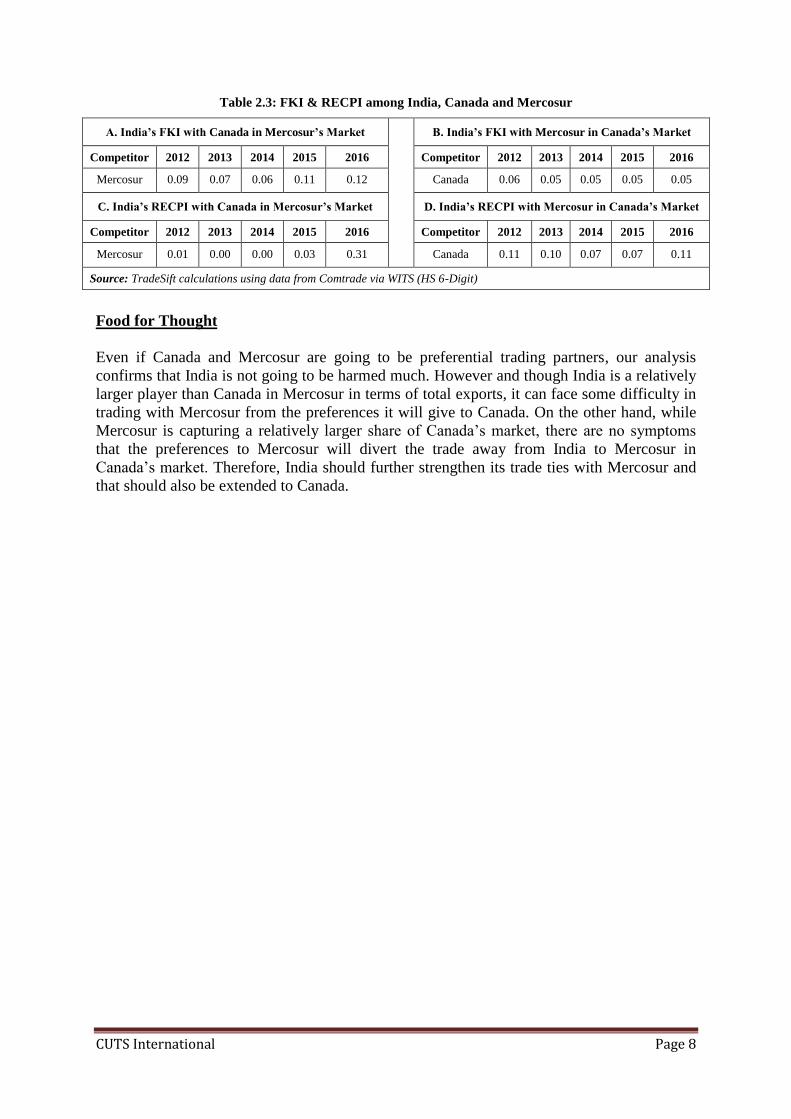
The level of similarity and competitive pressure from the exports of Canada and Mercosur in
each other’s market with India is given by Table 2.3. It is evident that India is facing low
degree of similarity and competitive pressure from Canada in Mercosur’s market (Table 2.3A
& Table 2.3C). Also, the extent of similarity and competitive pressure faced by India from
Canada while exporting to Mercosur’s market is almost negligible (Table 2.3B & Table
2.3D).
Page 8
CUTS International Page 8
Table 2.3: FKI & RECPI among India, Canada and Mercosur
A. India’s FKI with Canada in Mercosur’s Market
B. India’s FKI with Mercosur in Canada’s Market
Competitor 2012 2013 2014 2015 2016
Competitor 2012 2013 2014 2015 2016
Mercosur 0.09 0.07 0.06 0.11 0.12 Canada 0.06 0.05 0.05 0.05 0.05
C. India’s RECPI with Canada in Mercosur’s Market
D. India’s RECPI with Mercosur in Canada’s Market
Competitor 2012 2013 2014 2015 2016
Competitor 2012 2013 2014 2015 2016
Mercosur 0.01 0.00 0.00 0.03 0.31 Canada 0.11 0.10 0.07 0.07 0.11
Source: TradeSift calculations using data from Comtrade via WITS (HS 6-Digit)
Food for Thought
Even if Canada and Mercosur are going to be preferential trading partners, our analysis
confirms that India is not going to be harmed much. However and though India is a relatively
larger player than Canada in Mercosur in terms of total exports, it can face some difficulty in
trading with Mercosur from the preferences it will give to Canada. On the other hand, while
Mercosur is capturing a relatively larger share of Canada’s market, there are no symptoms
that the preferences to Mercosur will divert the trade away from India to Mercosur in
Canada’s market. Therefore, India should further strengthen its trade ties with Mercosur and
that should also be extended to Canada.
Page 9
CUTS International Page 9
3. Sri Lanka Singapore Free Trade Agreement
Sri Lanka-Singapore Free Trade Agreement (SLSFTA) was signed by Singapore’s Minister
for Trade and Industry (Industry) S Iswaran and Sri Lanka’s Minister for Development
Strategies and International Trade Malik Samarawickrama on January 23, 2018. This is a
comprehensive free trade agreement which covers goods, services, e-commerce,
telecommunications, foreign direct investment, intellectual property and public procurement.
With this deal, Singapore and Sri Lanka companies will gain greater access to each other’s
markets across many sectors. Sri Lanka will eliminate tariffs on 80 per cent of Singapore’s
exports over 15 years, and has committed to very liberal rules of origin. Singapore already
grants Sri Lanka tariff free access on most goods.
(http://www.businesstimes.com.sg/government-economy/singapore-sri-lanka-keen-to-pursue-
bilateral-free-trade-pact)
CUTS Comments
India’s economic relations with Singapore are very good as enshrined in the ASEAN-India
Free Trade Agreement and the India-Singapore Comprehensive Economic Cooperation
Agreement. India is also connected with Sri Lanka through the India-Sri Lanka FTA.
Table 3.1 and Table 3.2 display the top ten exported products of India, Sri Lanka and
Singapore along with their corresponding shares in total trade for 2016 and, also, product-
wise CAGR over five years (2012 - 2016).
As shown in Table 3.1, the volume of India’s top ten products is more than seventy times
larger than Sri Lanka’s exports of top ten products to Singapore. This portrays that India is a
major player in comparison to Sri Lanka while exporting to Singapore. Majority of Indian
exported products include petroleum products, diamond made products and jewellery related
items.
India is competing with Sri Lanka in two products: petroleum oils & oils obtained from
bituminous minerals and articles of jewellery & parts thereof. India’s exports of petroleum
oils & oils obtained from bituminous minerals are many times higher than Sri Lanka’s
exports of the same. However, both have very low CAGR in the exports of aforementioned
commodity and India is experiencing a negative growth in comparison to Sri Lanka.
Articles of jewellery & parts thereof are the sixth largest exporting items from India as well
as Sri Lanka to Singapore. Here again, the CAGRs are very low for India and Sri Lanka, and
while Sri Lanka is experiencing a positive growth, India’s CAGR is negative.
Page 10
CUTS International Page 10
Table 3.1 India and Sri Lanka’s Top Ten Exports to Singapore
Product
Code Product Description
India's Exports to
Singapore
Sri Lanka’s Exports to
Singapore
Export Value in
2016 (US$ mn)
CAGR
(2012-16)
Export Value in
2016 (US$ mn)
CAGR
(2012-16)
271019 Petroleum oils & oils obtained from
bituminous (Non-crude)
2004.81
(27.26) -0.08
18.24
(21.93) 0.28
271011 Light petroleum oils & preparations 1364.9
(18.56) -0.23
890400 Tugs & pusher craft 358.86
(4.88) -0.02
740311 Cathodes & sections of cathodes 274.51
(3.73) 0.46
890590 Light-vessels, fire-floats 261.77
(3.56) -0.18
711319 Articles of jewellery & parts thereof 194.79
(2.65) -0.09
2.71
(15.80) 0.68
710231 Diamonds, non-industrial, unworked 187.23
(2.55) 2.86
880330 Parts of aeroplanes/helicopters 176.79
(2.40) 0.10
710239 Diamonds, non-industrial other than 96.22
(1.31) -0.16
290715 Naphthols & their salts 69.18
(0.94) 165.45
890190 Vessels for the transport of goods
25.33
(6.42) -0.01
490700 Unused postage, revenue
7.42
(2.97)
3.26
250610 Quartz, other than natural sands
3.43
(2.47) 0.00
110100 Wheat/meslin flour
2.85
(2.35) -0.16
090230 Tea, black (fermented)
2.56
(2.22) 0.01
710391 Rubies, sapphires & emeralds
2.43
(2.10) 1.35
853225 Fixed electrical capacitors
2.31
(2.00) -0.02
200819 Nuts (excl. ground-nuts)
2.13
(1.85) 0.13
Sub-Total* 4989.06
(67.83)
69.41
(60.11)
Total Exports in 2016 (US$ mn) 7354.86 115.47
Notes: Values in the parenthesis are export shares of particular products in total exports;
* Summation of the top ten exported products
Source: WITS database
From Table 3.2, it is clear that while there is a significant difference in the volume of
products exported by India to Sri Lanka and Singapore to Sri Lanka but the gap in CAGR is
not as large as the difference in volumes of India and Sri Lanka’s trade to Singapore. India’s
volume of exports of top ten products to Sri Lanka is two times larger than the volume of
Singapore’s top ten exports. Likewise, in case of India and Sri Lanka’s competition in terms
of exports of petroleum oils & oils obtained from bituminous minerals, India and Singapore
are competing in terms of exports of the same product in the Sri Lanka’s market. However,
both have very minimal CAGRs in the exports of petroleum oils & oils obtained from
bituminous minerals with declining trends overtime.
Page 11
CUTS International Page 11
Table 3.2 India and Singapore’s Top Ten Exports to Sri Lanka
Product
Code Product Description
India's Exports to
Sri Lanka
Singapore’s Exports to
Sri Lanka
Export Value in
2016 (US$ mn)
CAGR
(2012-16)
Export Value in
2016 (US$ mn)
CAGR
(2012-16)
271019 Petroleum oils & oils obtained from
bituminous (Non-crude)
333.43
(8.10) -0.03
375.51
(28.26) -0.14
880230 Aeroplanes & other aircrafts 226.65
(5.50) 0.10
871120 Motorcycles (incl. mopeds) & cycles 208.52
(5.06) 0.12
880240 Aeroplanes & other aircrafts 186.72
(4.53) -0.29
300490 Medicaments 138.24
(3.36) 0.08
890510 Dredgers 121.8
(2.96) 0.15
870321 Vehicles (excl. of 87.02 & 8703.10) 121.74
(2.96) -0.04
252329 Portland cement (excl. white cement) 120.38
(2.92) 0.11
870421 Motor vehicles 96.19
(2.34) 0.00
90420 Fruits of the genera Capsicum 86.73
(2.11) 0.14
271011 Light petroleum oils & preparations
244.86
(18.43)
0.32
851712 Telephones for cellular networks
37.58
(2.83)
0.36
711319 Articles of jewellery & parts there
31.6
(2.38)
-0.01
847130 Portable automatic data processing
28.55
(2.15)
-0.02
999999 Commodities not specified according
21.24
(1.60)
-0.07
844399 Other parts & accessories for print
19.16
(1.44)
0.07
847330 Parts & accessories of the machines
19.04
(1.43)
-0.11
845229 Sewing machines (excl. h-hold. Type)
18.66
(1.40)
0.07
851762 Machines for the reception
12.64
(0.95)
0.09
Sub-Total* 1640.4
(39.83)
808.84
(60.87)
Total Exports in 2016 (US$ mn) 4118.25 1328.84
Notes: Values in the parenthesis are export shares of particular products in total exports;
* Summation of the top ten exported products
Source: WITS database
Degrees of homogeneity and competitive pressure for India in the markets of Singapore and
Sri Lanka are presented by Table 3.3. India’s exported products are not very much
homogenous with Sri Lanka’s exported products to Singapore’s market (Table 3.3A) and
hence, facing not much competitive pressure from Sri Lanka (Table 3.3C).
Page 12
CUTS International Page 12
Table 3.3: FKI & RECPI among India, Sri Lanka and Singapore
A. India’s FKI with Sri Lanka in Singapore’s Market
B. India’s FKI with Singapore in Sri Lanka’s Market
Competitor 2012 2013 2014 2015 2016
Competitor 2012 2013 2014 2015 2016
Singapore 0.11 0.05 0.18 0.25 0.23 Sri Lanka 0.23 0.22 0.17 0.23 0.20
C. India’s RECPI with Sri Lanka in Singapore’s Market
D. India’s RECPI with Singapore in Sri Lanka’s Market
Competitor 2012 2013 2014 2015 2016
Competitor 2012 2013 2014 2015 2016
Singapore 0.00 0.00 0.00 0.00 0.01 Sri Lanka 0.94 0.53 0.08 0.19 0.38
Source: TradeSift calculations using data from Comtrade via WITS (HS 6-Digit)
India’s export similarity with Singapore is somewhat higher than its export similarity with Sri
Lanka (Table 3.3B) and, as a result of this, there is some competitive pressure for India from
Singapore in Sri Lanka’s market, it not very high (Table 3.3D).
Food For Thought
India’s exports to Singapore are sufficiently diversified. Despite some commonality with Sri
Lanka’s exports to Singapore, since Singapore already allowed tariff-free access on a
majority of products to Sri Lanka, the SLSFTA should not result in a rapid increase in
competing products being exported from Sri Lanka to Singapore. But some Indian exports to
Sri Lanka may under threat because under the SLSFTA Sri Lanka has committed to reduce
tariffs for Singapore. India’s position as Sri Lanka’s biggest trading partner is likely to be
challenged in the near future. This challenge can be dispensed by expanding the scope of the
existing India-Sri Lanka FTA.