19
Cutting back on alcohol consumption Key results from the 2015/16 Attitudes and Behaviour towards Alcohol Survey & 2016 Health and Lifestyles Survey March 2018

Cutting back on alcohol consumption
Key results from the 2015/16 Attitudes and Behaviour towards Alcohol Survey & 2016 Health and Lifestyles Survey
March 2018

1
ISBN: 978-0-478-44931-0
Citation: Health Promotion Agency. (2018). Cutting back on alcohol consumption: Key results
from the 2015/16 Attitudes and Behaviour towards Alcohol Survey & 2016 Health and Lifestyles
Survey. Wellington: Health Promotion Agency
Prepared for the Health Promotion Agency by:
Hayley Guiney, Rhiannon Newcombe, Holly Trowland, Fiona Imlach, & Susan Cook
This document is available at: http://www.hpa.org.nz/research-library/research-publications
Any queries regarding this report should be directed to HPA at the following address:
Health Promotion Agency
PO Box 2142
Wellington 6140
New Zealand
March 2018
Copyright
The copyright owner of this publication is HPA. HPA permits the reproduction of material from this
publication without prior notification, provided that fair representation is made of the material and
HPA is acknowledged as the source.
2
Contents
Executive Summary ............................................................................................................... 4
Introduction ............................................................................................................................ 6
Method ................................................................................................................................... 7
Results ................................................................................................................................... 9

3
Tables and Figures
Tables
Table 1: Total sample size and response rate for the 2015/16 ABAS and 2016 HLS ...................... 7
Table 2: Demographic characteristics of respondents, 2015/16 ABAS and 2016 HLS .................... 9
Table 3: Places or services respondents would seek help from if they wanted to cut back on their
drinking, 2016 HLS ....................................................................................................................... 15
Table 4: Actions taken after last drinking occasion, 2015/16 ABAS ............................................... 16
Figures
Figure 1: Last occasion drinkers who said they had thought about cutting back on how much
they drink in the last 12 months, by age and risky drinking status ................................................. 10
Figure 2: Past-year drinkers who said they had thought about cutting back on how much they
drink in the last 12 months, by age, ethnicity, and risky drinking status ......................................... 11
Figure 3: Past-year drinkers who said they had made a serious attempt to cut back on how
much they drink in the last 12 months, by age, ethnicity, and risky drinking status ........................ 12
Figure 4: Last occasion drinkers who said that someone had given them advice, information or
help on how to cut back on their drinking in the last 12 months, by age, ethnicity, and risky drinking
status ............................................................................................................................................ 14
Figure 5: Last occasion drinkers who said that after their last drinking occasion, they had
thought about cutting back how much they drink, by risky drinking status and region ............ 16
Figure 6: Last occasion drinkers who said that after their last drinking occasion, they had
decided to drink less, by ethnicity and risky drinking status ........................................................ 17
Figure 7: Last occasion drinkers who said that after their last drinking occasion, they had
decided to drink more water or eat more food after drinking alcohol, by gender, age, ethnicity,
and risky drinking status ................................................................................................................ 18

4
Executive Summary
The Attitudes and Behaviour towards Alcohol Survey (ABAS) and Health and Lifestyles Survey
(HLS) are national surveys of people aged 15 years and over. Both surveys contain questions
about alcohol-related attitudes and behaviour, consumption patterns, consequences of consuming
alcohol, and help-seeking.
This report uses results from ‘last occasion drinkers’ (people who reported having at least two
drinks containing alcohol on a single occasion in the past three months) in the 2015/16 ABAS and
‘past-year drinkers’ (people who reported consuming alcohol in the past 12 months) in the 2016
HLS to provide insight into New Zealanders’ attitudes and actions relating to cutting back on their
alcohol consumption. Such findings can be used to develop and target programmes and activities
that effectively support drinkers to reduce problematic alcohol consumption.
Key findings about cutting back on alcohol consumption
36% of last occasion drinkers and 26% of past-year drinkers said that in the last 12 months
they had thought about cutting back on how much they drink.
o Last occasion drinkers more likely to report thinking about cutting back were:
those aged 45 years and over (35%), compared with 15 to 17-year-olds (25%)1
risky drinkers (47%), compared with non-risky drinkers (30%).
o Past-year drinkers more likely to report thinking about cutting back were:
those aged 45 years and over (27%), compared with 18 to 24-year-olds (22%)
European/Other respondents (27%), compared with Asian respondents (6%)
risky drinkers (43%), compared with non-risky drinkers (17%).
18% of past-year drinkers said they had made a serious attempt in the past 12 months to cut
back how much they drank. Those more likely to have made such an attempt were:
o people aged 45 years and over (18%), compared with 18 to 24-year-olds (12%)
o Māori respondents (28%), compared with European/Other (18%)
o European/Other respondents (18%), compared with Asian respondents (5%)
o risky drinkers (29%), compared with non-risky drinkers (13%).
4% of last occasion drinkers said they had looked or asked for advice, information, or help on
how to cut back on their drinking in the past 12 months. Those more likely to say they had
done so were:
o Pacific respondents (8%), compared with European/Other (3%)
o risky drinkers (7%), compared with non-risky drinkers (3%)
o people living in areas of the lower North Island other than Wellington/Wairarapa
(8%), compared with those living in Auckland region (4%).
1 The comparisons between groups presented here have been checked by regression analyses that adjust for potential
confounding variables (gender, age, ethnicity, risky drinking, region). Only statistically significant comparisons are reported.

5
9% of last occasion drinkers said that someone had given them advice, information, or help on
how to cut back on their drinking in the past 12 months. Those more likely to say they had
received such advice were:
o 15 to 17-year-olds (17%) and 18 to 24-year-olds (15%), compared with those aged
45 years and over (7%)
o Pacific respondents (20%), compared with European/Other (8%)
o risky drinkers (15%), compared with non-risky drinkers (7%).
The most common potential sources of advice or support to cut back on drinking reported by
past-year drinkers were friends/family members (31%) and their doctor/GP (22%). However,
39% said they would not use any of the suggested sources.2
The table below shows the proportion of last occasion drinkers who reported taking specific
actions after their last drinking occasion, as well as those more likely to report taking these
actions.
After the last drinking occasion, action taken
% ‘yes’
People who were more likely to report this action after their last occasion
Thought about cutting back how much you drink
8
Risky drinkers (11%), compared with non-risky drinkers (6%)
People living in Auckland region (9%), compared with those living in areas of the South Island other than Canterbury (4%)
Decided to drink less 12
Pacific (19%), and Asian (22%) respondents, compared with European/Other (10%)
Risky drinkers (16%), compared with non-risky drinkers (10%)
Decided to drink more water or eat more food when drinking alcohol
28
Females (31%), compared with males (26%)
15 to 17-year-olds (46%) and 18 to 24-year-olds (43%), compared with those aged 45 years and over (22%)
Māori (39%), Pacific (50%), and Asian (45%) respondents, compared with European/Other (24%)
Risky drinkers (37%), compared with non-risky drinkers (24%)
2 Participants were asked if they would look for advice or support from any of the following: an 0800 telephone helpline (eg, Alcohol and Drug Helpline), a website about alcohol issues (eg, Alcohol.org.nz, alcoholdrughelp.org.nz), a website about supporting cutting back (eg, Living Sober, Hello Sunday Morning, Dry July), a general Internet search, a self-help or peer support group, social services, a community alcohol and drug service, a doctor / GP, a midwife, a Māori community health worker, a Pacific community health worker, a counsellor, a friend or family member, and Church / prayer. Multiple responses were allowed.
6
Introduction
The Attitudes and Behaviour towards Alcohol Survey (ABAS) and Health and Lifestyles Survey
(HLS) are national surveys of people aged 15 years and over undertaken by the Health Promotion
Agency (HPA). Both surveys contain questions on alcohol-related attitudes and behaviour,
consumption patterns, consequences of consuming alcohol, and help-seeking behaviours.
Whereas the ABAS questions focus largely on the last drinking occasion within the last three
months, the HLS asks about drinking in the past year. Results from these surveys are used to
inform the planning and development of alcohol activities, policies and programmes that aim to
reduce alcohol-related harm in New Zealand.
HPA has a particular focus on reducing alcohol-related harm. The questions in the ABAS and HLS
around cutting back on alcohol consumption provide valuable information about the extent to which
drinkers consider reducing their consumption and how they might achieve this.
The Ministry of Health’s National Drug Policy 2015 to 20203 includes the objective of shifting
attitudes to alcohol and other drugs. This involves reducing discrimination towards those who are
seeking help for problematic alcohol and drug use. Monitoring the number and type of drinkers who
seek help or advice about their drinking, and where this help is found, provides insight into how
easily drinkers are able to access the support they need and what barriers may exist that stop
drinkers seeking help. Such findings can be used to develop and target programmes and activities
that effectively support drinkers to reduce problematic alcohol consumption, including help-seeking
campaigns.
This report
This report presents descriptive results from the 2015/16 ABAS and 2016 HLS. Information is
provided on New Zealand adults’ attitudes and actions relating to cutting back on their alcohol
consumption. The results are also compared by age, gender, ethnicity, risky drinking behaviour,
and region. All results are weighted so that they are representative of the total New Zealand
population aged 15 years and over.
The ABAS questions presented in this report were asked only of those respondents who reported
having at least two alcoholic drinks on any one occasion in the last three months. In contrast, the
HLS questions were asked of those respondents who reported drinking alcohol in the past year.
The two main sections of this report mirror this difference when information is available: first,
actions taken over the past year are described, followed by actions taken after the last drinking
occasion. Having results on the same topic from two different surveys provides a more solid
evidence base for decisions. For example, results that are consistent across both surveys paint a
stronger picture about which drinkers are more likely to try or think about cutting back, which can
inform targeting of help-seeking campaigns.
3 Inter-Agency Committee on Drugs. (2015). National Drug Policy 2015 to 2020. Wellington: Ministry of Health
7
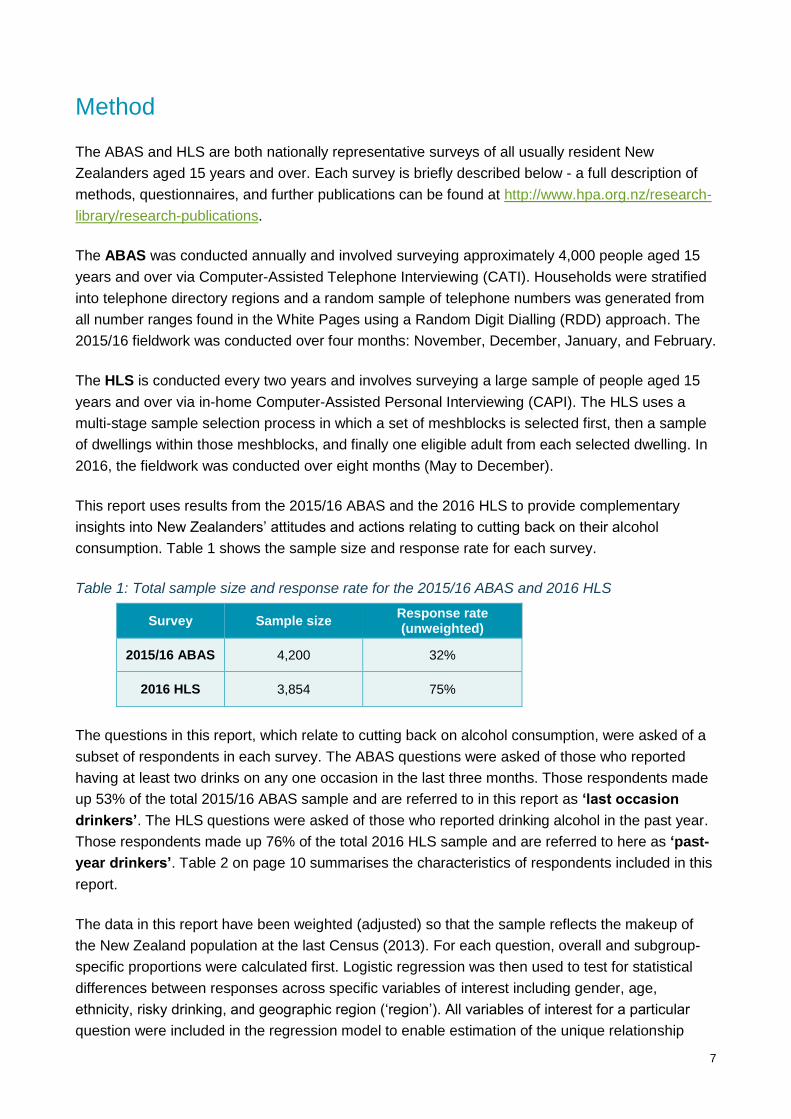
Method
The ABAS and HLS are both nationally representative surveys of all usually resident New
Zealanders aged 15 years and over. Each survey is briefly described below - a full description of
methods, questionnaires, and further publications can be found at http://www.hpa.org.nz/research-
library/research-publications.
The ABAS was conducted annually and involved surveying approximately 4,000 people aged 15
years and over via Computer-Assisted Telephone Interviewing (CATI). Households were stratified
into telephone directory regions and a random sample of telephone numbers was generated from
all number ranges found in the White Pages using a Random Digit Dialling (RDD) approach. The
2015/16 fieldwork was conducted over four months: November, December, January, and February.
The HLS is conducted every two years and involves surveying a large sample of people aged 15
years and over via in-home Computer-Assisted Personal Interviewing (CAPI). The HLS uses a
multi-stage sample selection process in which a set of meshblocks is selected first, then a sample
of dwellings within those meshblocks, and finally one eligible adult from each selected dwelling. In
2016, the fieldwork was conducted over eight months (May to December).
This report uses results from the 2015/16 ABAS and the 2016 HLS to provide complementary
insights into New Zealanders’ attitudes and actions relating to cutting back on their alcohol
consumption. Table 1 shows the sample size and response rate for each survey.
Table 1: Total sample size and response rate for the 2015/16 ABAS and 2016 HLS
Survey Sample size Response rate (unweighted)
2015/16 ABAS 4,200 32%
2016 HLS 3,854 75%
The questions in this report, which relate to cutting back on alcohol consumption, were asked of a
subset of respondents in each survey. The ABAS questions were asked of those who reported
having at least two drinks on any one occasion in the last three months. Those respondents made
up 53% of the total 2015/16 ABAS sample and are referred to in this report as ‘last occasion
drinkers’. The HLS questions were asked of those who reported drinking alcohol in the past year.
Those respondents made up 76% of the total 2016 HLS sample and are referred to here as ‘past-
year drinkers’. Table 2 on page 10 summarises the characteristics of respondents included in this
report.
The data in this report have been weighted (adjusted) so that the sample reflects the makeup of
the New Zealand population at the last Census (2013). For each question, overall and subgroup-
specific proportions were calculated first. Logistic regression was then used to test for statistical
differences between responses across specific variables of interest including gender, age,
ethnicity, risky drinking, and geographic region (‘region’). All variables of interest for a particular
question were included in the regression model to enable estimation of the unique relationship

8
between each predictor (eg, age) and outcome (eg, tried to cut back on drinking), while holding
constant all other predictors (eg, gender, ethnicity, risky drinking, and region).
Interpreting the results
All percentages in this report (including in the figures) represent the weighted unadjusted
percentages, with error bars representing the 95% confidence intervals. The text and figures in the
Results section also indicate where there were significant differences in response across particular
subgroups of interest, after adjusting for all other variables included in that particular regression
model. For example, if the model includes gender, ethnicity, age, risky drinking status, and region,
the mention of a significant difference by age can be interpreted as, ‘a significant difference by age,
after adjusting for gender, ethnicity, risky drinking status, and region’.
The notes below each figure specify which variables were included in that particular regression
model. They also indicate the sample size (‘base’). In some cases, the base may be slightly
reduced from the overall total, as respondents were only included in the regression if they had no
missing data and no ‘don’t know’ or ‘refused’ responses across any of the variables of interest. For
example, if someone had all other variables recorded but was unable to be categorised as a risky
or non-risky drinker, they would be excluded from the regression for that question.
9
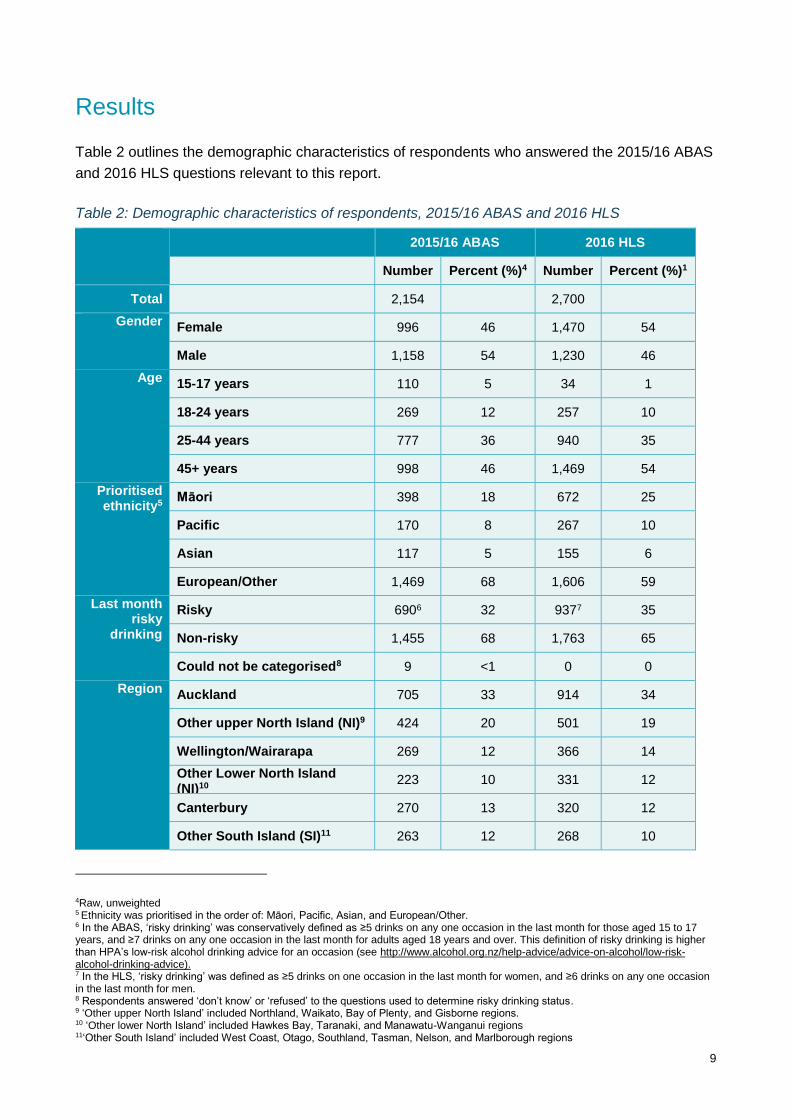
Results
Table 2 outlines the demographic characteristics of respondents who answered the 2015/16 ABAS
and 2016 HLS questions relevant to this report.
Table 2: Demographic characteristics of respondents, 2015/16 ABAS and 2016 HLS
2015/16 ABAS 2016 HLS
Number Percent (%)4 Number Percent (%)1
Total 2,154 2,700
Gender Female 996 46 1,470 54
Male 1,158 54 1,230 46
Age 15-17 years 110 5 34 1
18-24 years 269 12 257 10
25-44 years 777 36 940 35
45+ years 998 46 1,469 54
Prioritised ethnicity5
Māori 398 18 672 25
Pacific 170 8 267 10
Asian 117 5 155 6
European/Other 1,469 68 1,606 59
Last month risky
drinking
Risky 6906 32 9377 35
Non-risky 1,455 68 1,763 65
Could not be categorised8 9 <1 0 0
Region Auckland 705 33 914 34
Other upper North Island (NI)9 424 20 501 19
Wellington/Wairarapa 269 12 366 14
Other Lower North Island (NI)10
223 10 331 12
Canterbury 270 13 320 12
Other South Island (SI)11 263 12 268 10
4Raw, unweighted 5 Ethnicity was prioritised in the order of: Māori, Pacific, Asian, and European/Other. 6 In the ABAS, ‘risky drinking’ was conservatively defined as ≥5 drinks on any one occasion in the last month for those aged 15 to 17 years, and ≥7 drinks on any one occasion in the last month for adults aged 18 years and over. This definition of risky drinking is higher than HPA’s low-risk alcohol drinking advice for an occasion (see http://www.alcohol.org.nz/help-advice/advice-on-alcohol/low-risk-alcohol-drinking-advice). 7 In the HLS, ‘risky drinking’ was defined as ≥5 drinks on one occasion in the last month for women, and ≥6 drinks on any one occasion in the last month for men. 8 Respondents answered ‘don’t know’ or ‘refused’ to the questions used to determine risky drinking status. 9 ‘Other upper North Island’ included Northland, Waikato, Bay of Plenty, and Gisborne regions. 10 ‘Other lower North Island’ included Hawkes Bay, Taranaki, and Manawatu-Wanganui regions 11‘Other South Island’ included West Coast, Otago, Southland, Tasman, Nelson, and Marlborough regions

10
Actions taken in the last 12 months
Thinking about cutting back on alcohol consumption
In the 2015/16 ABAS and 2016 HLS, last occasion drinkers (ABAS) and past-year drinkers (HLS)
were asked whether they had thought about cutting back on how much they drink in the last 12
months.
Overall, 36% of last occasion drinkers (2015/16 ABAS) said they had thought about cutting back
on how much they drink in the last 12 months. As shown in Figure 1, the proportion of
respondents who said ‘yes’ varied by age, and risky drinking status. Specifically, those more likely
to say ‘yes’ were:
those aged 45 years and over, compared with 15 to 17-year-olds
risky drinkers, compared with non-risky drinkers.
There were no differences by gender, ethnicity, or region.
Figure 1: Last occasion drinkers who said they had thought about cutting back on how much
they drink in the last 12 months, by age and risky drinking status
Base: Last occasion drinkers (n = 2,142) Source: ABAS 2015/16 * Significantly different from the reference group (R), from a logistic regression model including gender, age, ethnicity, risky
drinking status, and region.
25
36
3735
47
30
0
10
20
30
40
50
60
15-17 18-24 25-44 45+ Risky Non-risky
Age (years) Risky drinker
%
*
*
R
R

11
Overall, 26% of past-year drinkers (2016 HLS) said they had thought about cutting back on how
much they drink in the last 12 months. As shown in Figure 2, the proportion of respondents who
said ‘yes’ varied by age, ethnicity, and risky drinking status. Note that compared to the 2015/16
ABAS analysis, this analysis of HLS results used slightly different categories for risky drinking
status (at least 5 drinks on one occasion for women; at least 6 for men).
Those more likely to say that they had thought about cutting back on how much they drink in the
last 12 months were:
those aged 45 years and over, compared with 18 to 24-year-olds
European/Other respondents, compared with Asian respondents
risky drinkers, compared with non-risky drinkers.
There were no differences by gender or region.
Figure 2: Past-year drinkers who said they had thought about cutting back on how much they
drink in the last 12 months, by age, ethnicity, and risky drinking status
Base: Past-year drinkers (n = 2,694) Source: HLS 2016 * Significantly different from the reference group (R), from a logistic regression model including gender, age, ethnicity, risky
drinking status, and region.
13
22
2627
34
22
6
27
43
17
0
10
20
30
40
50
15-17 18-24 25-44 45+ Māori Pacific Asian European/Other
Risky Non-risky
Age (years) Ethnicity Risky drinker
%
R R
R
*
*
*

12
Attempting to cut back on alcohol consumption
In the 2016 HLS, past-year drinkers were asked whether they had made a serious attempt to cut
back on how much they drink in the last 12 months. A ‘serious attempt’ was not defined – this
was up to respondents to interpret. Overall, 18% said ‘yes’.
As shown in Figure 3, the proportion of respondents who had made a serious attempt to cut back
varied by age, ethnicity, and risky drinking status. Specifically, those more likely to say ‘yes’ were:
those aged 45 years and over, compared with 18 to 24-year-olds
Māori respondents, compared with European/Other
European/Other respondents, compared with Asian respondents
risky drinkers, compared with non-risky drinkers.
There were no differences by gender or region.
Figure 3: Past-year drinkers who said they had made a serious attempt to cut back on how
much they drink in the last 12 months, by age, ethnicity, and risky drinking status
Base: Past-year drinkers (n = 2,694) Source: HLS 2016 * Significantly different from the reference group (R), from a logistic regression model including gender, age, ethnicity, risky
drinking status, and region.
4
12
21
18
28
17
5
18
29
13
0
10
20
30
40
15-17 18-24 25-44 45+ Māori Pacific Asian European/Other
Risky Non-risky
Age (years) Ethnicity Risky drinker
%
*
*
*
*
R R
R

13
Information and advice-seeking
Looking or asking for advice
In the 2015/16 ABAS, last occasion drinkers were asked whether they had looked or asked for
advice, information, or help on how to cut back on their drinking in the last 12 months. Overall,
4% said ‘yes’.
The proportion of respondents who said they had looked for advice, information, or help in the last
12 months varied by ethnicity, risky drinking status, and region. Specifically, those more likely to
say they had done so were:
Pacific respondents (8%), compared with European/Other (3%)
risky drinkers (7%), compared with non-risky drinkers (3%)
people living in areas of the lower North Island (8%) excluding Wellington/Wairarapa,12
compared with those living in Auckland region (4%).
There were no differences by gender or age.
12 ie, those living in Hawkes Bay, Taranaki, or Manawatu-Wanganui regions

14
Last occasion drinkers were also asked, whether anyone had given them any advice,
information or help on how to cut back on their drinking in the last 12 months. Overall, 9% said
‘yes’.
As shown in Figure 4, the proportion of respondents who said they had been given advice,
information, or help in the last 12 months varied by age, ethnicity, and risky drinking status.
Specifically, those more likely to say they had received advice, etc were:
15 to 24-year-olds, compared with those aged 45 years and over
Pacific respondents, compared with European/Other
risky drinkers, compared with non-risky drinkers.
There were no differences by gender or region.
Figure 4: Last occasion drinkers who said that someone had given them advice, information or
help on how to cut back on their drinking in the last 12 months, by age, ethnicity, and risky drinking
status
Base: Last occasion drinkers (n = 2,142) Source: ABAS 2015/16 * Significantly different from the reference group (R), from a logistic regression model including gender, age, ethnicity, risky
drinking status, and region.
17 15
10
7
13
20
9
8
15
7
0
10
20
30
15-17 18-24 25-44 45+ Māori Pacific Asian European/Other
Risky Non-risky
Age (years) Ethnicity Risky drinker
%
R R
*
* *
R
*
15
Potential sources of advice
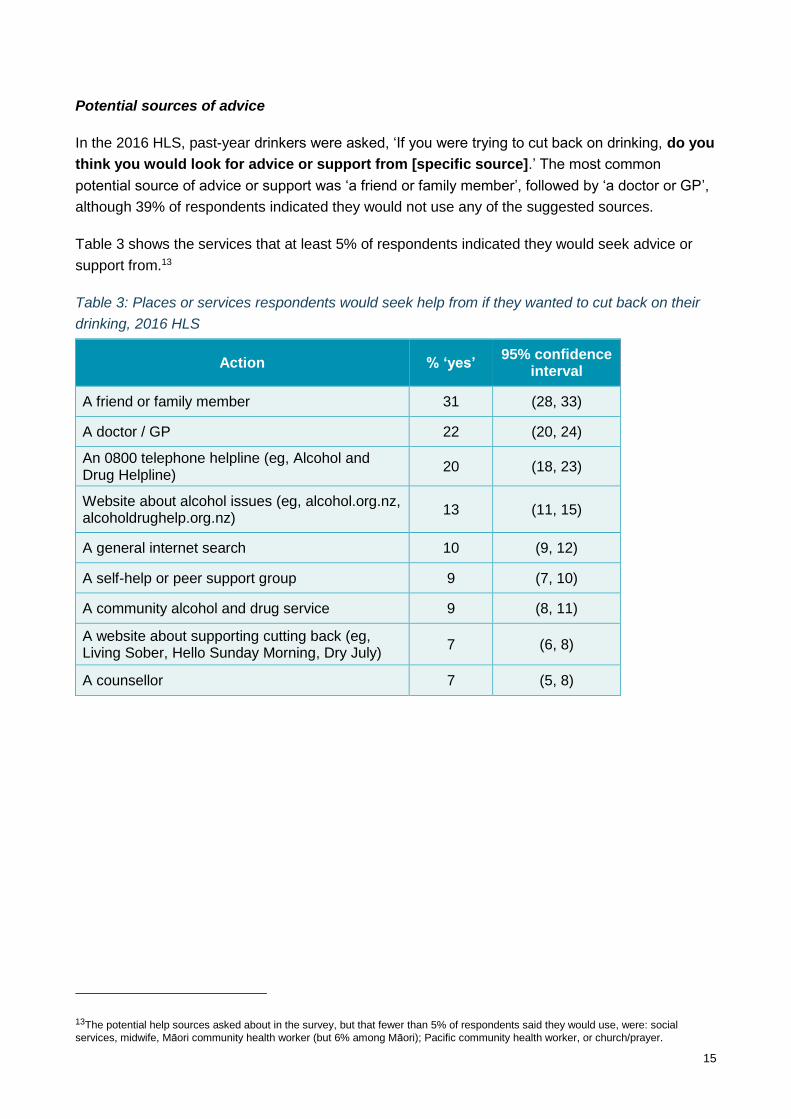
In the 2016 HLS, past-year drinkers were asked, ‘If you were trying to cut back on drinking, do you
think you would look for advice or support from [specific source].’ The most common
potential source of advice or support was ‘a friend or family member’, followed by ‘a doctor or GP’,
although 39% of respondents indicated they would not use any of the suggested sources.
Table 3 shows the services that at least 5% of respondents indicated they would seek advice or
support from.13
Table 3: Places or services respondents would seek help from if they wanted to cut back on their
drinking, 2016 HLS
Action % ‘yes’ 95% confidence
interval
A friend or family member 31 (28, 33)
A doctor / GP 22 (20, 24)
An 0800 telephone helpline (eg, Alcohol and Drug Helpline)
20 (18, 23)
Website about alcohol issues (eg, alcohol.org.nz, alcoholdrughelp.org.nz)
13 (11, 15)
A general internet search 10 (9, 12)
A self-help or peer support group 9 (7, 10)
A community alcohol and drug service 9 (8, 11)
A website about supporting cutting back (eg, Living Sober, Hello Sunday Morning, Dry July)
7 (6, 8)
A counsellor 7 (5, 8)
13The potential help sources asked about in the survey, but that fewer than 5% of respondents said they would use, were: social
services, midwife, Māori community health worker (but 6% among Māori); Pacific community health worker, or church/prayer.
16
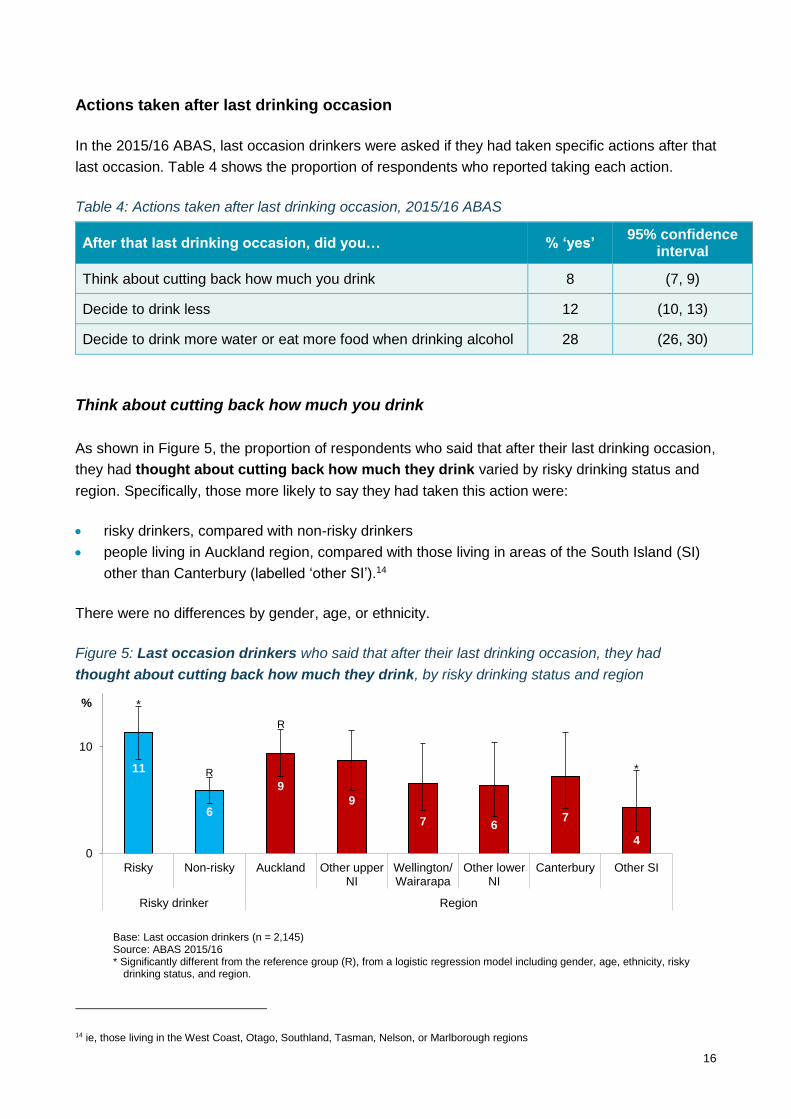
Actions taken after last drinking occasion
In the 2015/16 ABAS, last occasion drinkers were asked if they had taken specific actions after that
last occasion. Table 4 shows the proportion of respondents who reported taking each action.
Table 4: Actions taken after last drinking occasion, 2015/16 ABAS
After that last drinking occasion, did you… % ‘yes’ 95% confidence
interval
Think about cutting back how much you drink 8 (7, 9)
Decide to drink less 12 (10, 13)
Decide to drink more water or eat more food when drinking alcohol 28 (26, 30)
Think about cutting back how much you drink
As shown in Figure 5, the proportion of respondents who said that after their last drinking occasion,
they had thought about cutting back how much they drink varied by risky drinking status and
region. Specifically, those more likely to say they had taken this action were:
risky drinkers, compared with non-risky drinkers
people living in Auckland region, compared with those living in areas of the South Island (SI)
other than Canterbury (labelled ‘other SI’).14
There were no differences by gender, age, or ethnicity.
Figure 5: Last occasion drinkers who said that after their last drinking occasion, they had
thought about cutting back how much they drink, by risky drinking status and region
Base: Last occasion drinkers (n = 2,145) Source: ABAS 2015/16 * Significantly different from the reference group (R), from a logistic regression model including gender, age, ethnicity, risky
drinking status, and region.
14 ie, those living in the West Coast, Otago, Southland, Tasman, Nelson, or Marlborough regions
11
6
9
9
7 67
40
10
Risky Non-risky Auckland Other upperNI
Wellington/Wairarapa
Other lowerNI
Canterbury Other SI
Risky drinker Region
% *
*
R
R

17
Decide to drink less
As shown in Figure 6, the proportion of respondents who said that after their last drinking occasion,
they had decided to drink less varied by ethnicity, and risky drinking status. Specifically, those
more likely to say they had taken this action were:
Pacific, and Asian respondents, compared with European/Other
risky drinkers, compared with non-risky drinkers.
There were no differences by gender, age, or region.
Figure 6: Last occasion drinkers who said that after their last drinking occasion, they had
decided to drink less, by ethnicity and risky drinking status
Base: Last occasion drinkers (n = 2,145) Source: ABAS 2015/16 * Significantly different from the reference group (R), from a logistic regression model including gender, age, ethnicity, risky
drinking status, and region.
16 1922
10
16
10
0
10
20
30
Māori Pacific Asian European/Other
Risky Non-risky
Ethnicity Risky drinker
%
R R
*
*
*
18
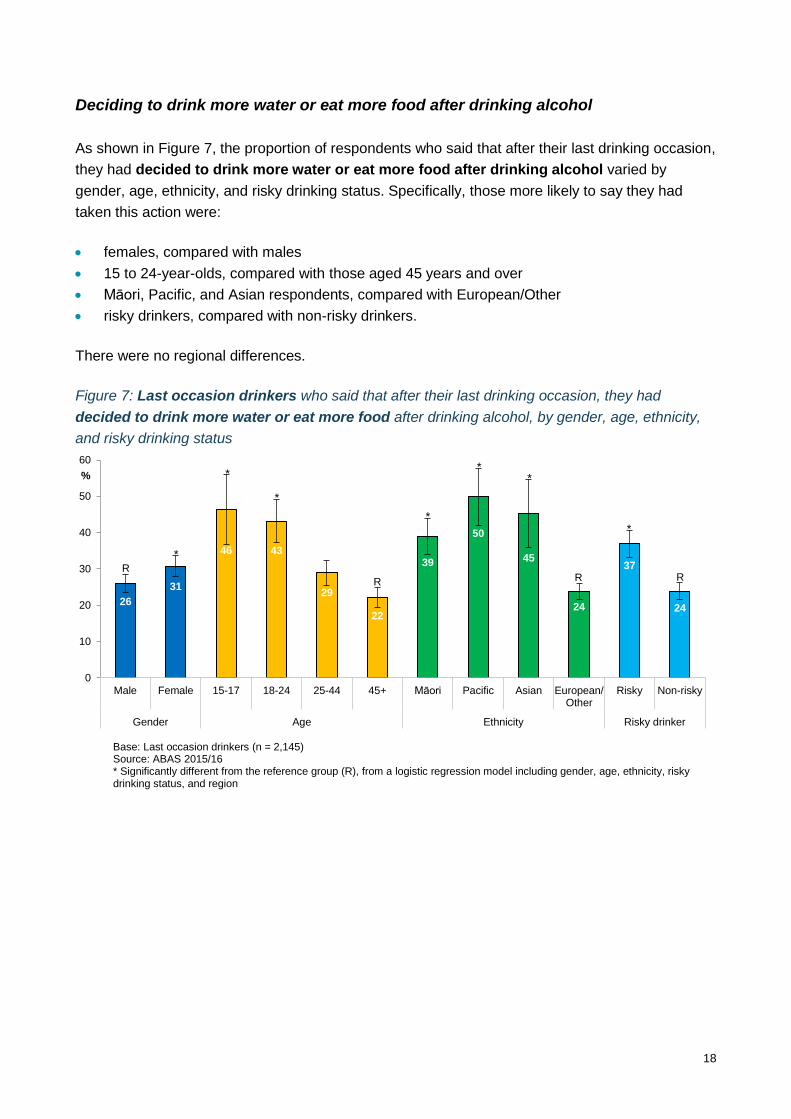
Deciding to drink more water or eat more food after drinking alcohol
As shown in Figure 7, the proportion of respondents who said that after their last drinking occasion,
they had decided to drink more water or eat more food after drinking alcohol varied by
gender, age, ethnicity, and risky drinking status. Specifically, those more likely to say they had
taken this action were:
females, compared with males
15 to 24-year-olds, compared with those aged 45 years and over
Māori, Pacific, and Asian respondents, compared with European/Other
risky drinkers, compared with non-risky drinkers.
There were no regional differences.
Figure 7: Last occasion drinkers who said that after their last drinking occasion, they had
decided to drink more water or eat more food after drinking alcohol, by gender, age, ethnicity,
and risky drinking status
Base: Last occasion drinkers (n = 2,145) Source: ABAS 2015/16 * Significantly different from the reference group (R), from a logistic regression model including gender, age, ethnicity, risky drinking status, and region
26
31
46 43
29
22
39
50
45
24
37
24
0
10
20
30
40
50
60
Male Female 15-17 18-24 25-44 45+ Māori Pacific Asian European/Other
Risky Non-risky
Gender Age Ethnicity Risky drinker
%
*
*
*
*
* *
*
R
R R R


