89
CVD: Primary Care Intelligence Packs June 2017 Version 1 NHS Blackpool CCG
CVD: Primary Care Intelligence
Packs
June 2017
Version 1
NHS Blackpool CCG
Contents 1. Introduction 3
2. CVD prevention
• The narrative 11
• The data 13
3. Hypertension
• The narrative 16
• The data 17
4. Stroke
• The narrative 27
• The data 28
5. Diabetes
• The narrative 42
• The data 43
6. Kidney
• The narrative 53
• The data 54
7. Heart
• The narrative 65
• The data 66
8. Outcomes 82
9. Appendix 88
2
This document is valid only when viewed via the internet. If it is printed into hard copy or saved to another location, you must first check that
the version number on your copy matches that of the one online. Printed copies are uncontrolled copies.
CVD: Primary Care Intelligence Packs

3
Introduction
CVD: Primary Care Intelligence Packs

4
This intelligence pack has been compiled by GPs and nurses and pharmacists in
the Primary Care CVD Leadership Forum in collaboration with the National
Cardiovascular Intelligence Network
Matt Kearney Sarit Ghosh Kathryn Griffith
George Kassianos Jo Whitmore Matthew Fay
Chris Harris Jan Procter-King Yassir Javaid
Ivan Benett Ruth Chambers Ahmet Fuat
Mike Kirby Peter Green Kamlesh Khunti
Helen Williams Quincy Chuhka Sheila McCorkindale
Nigel Rowell Ali Morgan Stephen Kirk
Sally Christie Clare Hawley Paul Wright
Bruce Taylor Mike Knapton John Robson
Richard Mendelsohn Chris Arden David Fitzmaurice
CVD: Primary Care Intelligence Packs
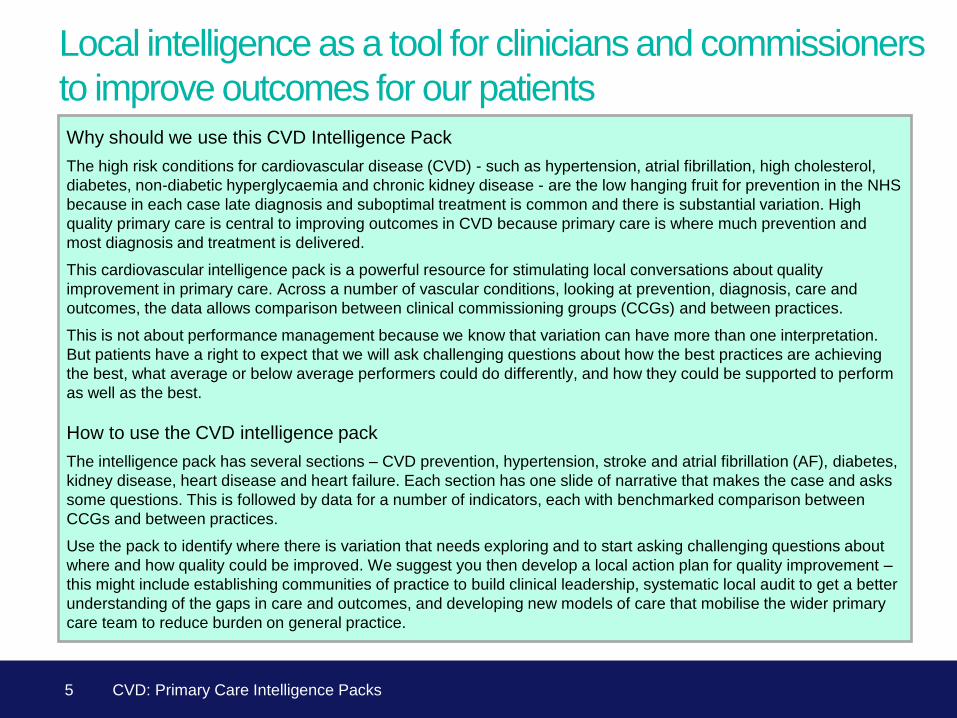
Local intelligence as a tool for clinicians and commissioners
to improve outcomes for our patients
Why should we use this CVD Intelligence Pack
The high risk conditions for cardiovascular disease (CVD) - such as hypertension, atrial fibrillation, high cholesterol,
diabetes, non-diabetic hyperglycaemia and chronic kidney disease - are the low hanging fruit for prevention in the NHS
because in each case late diagnosis and suboptimal treatment is common and there is substantial variation. High
quality primary care is central to improving outcomes in CVD because primary care is where much prevention and
most diagnosis and treatment is delivered.
This cardiovascular intelligence pack is a powerful resource for stimulating local conversations about quality
improvement in primary care. Across a number of vascular conditions, looking at prevention, diagnosis, care and
outcomes, the data allows comparison between clinical commissioning groups (CCGs) and between practices.
This is not about performance management because we know that variation can have more than one interpretation.
But patients have a right to expect that we will ask challenging questions about how the best practices are achieving
the best, what average or below average performers could do differently, and how they could be supported to perform
as well as the best.
How to use the CVD intelligence pack
The intelligence pack has several sections – CVD prevention, hypertension, stroke and atrial fibrillation (AF), diabetes,
kidney disease, heart disease and heart failure. Each section has one slide of narrative that makes the case and asks
some questions. This is followed by data for a number of indicators, each with benchmarked comparison between
CCGs and between practices.
Use the pack to identify where there is variation that needs exploring and to start asking challenging questions about
where and how quality could be improved. We suggest you then develop a local action plan for quality improvement –
this might include establishing communities of practice to build clinical leadership, systematic local audit to get a better
understanding of the gaps in care and outcomes, and developing new models of care that mobilise the wider primary
care team to reduce burden on general practice.
5 CVD: Primary Care Intelligence Packs
6
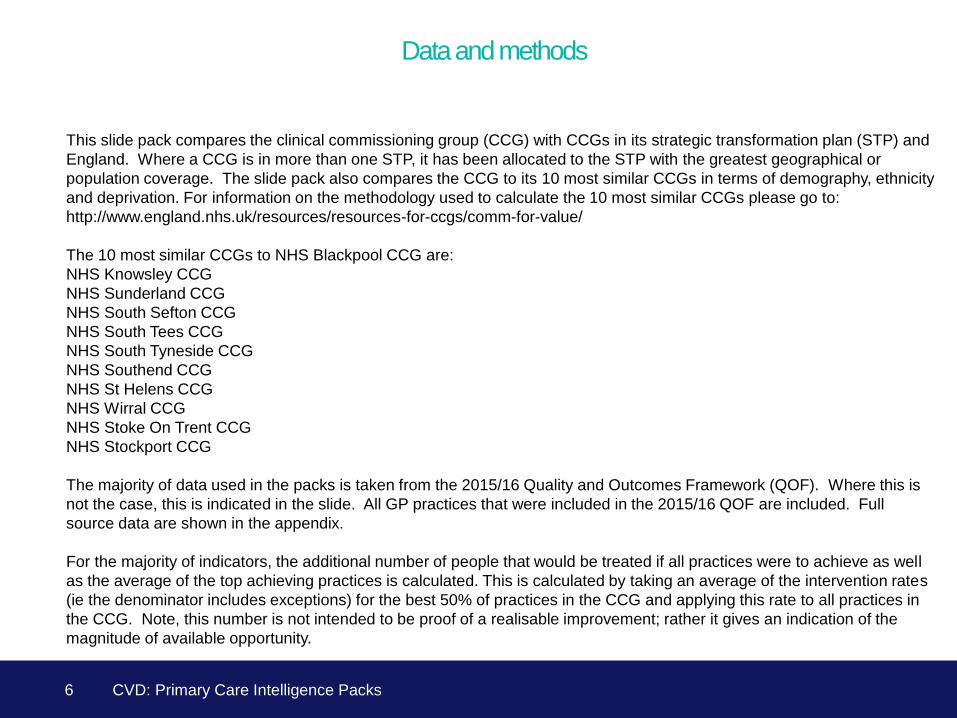
Data and methods
This slide pack compares the clinical commissioning group (CCG) with CCGs in its strategic transformation plan (STP) and
England. Where a CCG is in more than one STP, it has been allocated to the STP with the greatest geographical or
population coverage. The slide pack also compares the CCG to its 10 most similar CCGs in terms of demography, ethnicity
and deprivation. For information on the methodology used to calculate the 10 most similar CCGs please go to:
http://www.england.nhs.uk/resources/resources-for-ccgs/comm-for-value/
The 10 most similar CCGs to NHS Blackpool CCG are:
NHS Knowsley CCG
NHS Sunderland CCG
NHS South Sefton CCG
NHS South Tees CCG
NHS South Tyneside CCG
NHS Southend CCG
NHS St Helens CCG
NHS Wirral CCG
NHS Stoke On Trent CCG
NHS Stockport CCG
The majority of data used in the packs is taken from the 2015/16 Quality and Outcomes Framework (QOF). Where this is
not the case, this is indicated in the slide. All GP practices that were included in the 2015/16 QOF are included. Full
source data are shown in the appendix.
For the majority of indicators, the additional number of people that would be treated if all practices were to achieve as well
as the average of the top achieving practices is calculated. This is calculated by taking an average of the intervention rates
(ie the denominator includes exceptions) for the best 50% of practices in the CCG and applying this rate to all practices in
the CCG. Note, this number is not intended to be proof of a realisable improvement; rather it gives an indication of the
magnitude of available opportunity.
CVD: Primary Care Intelligence Packs
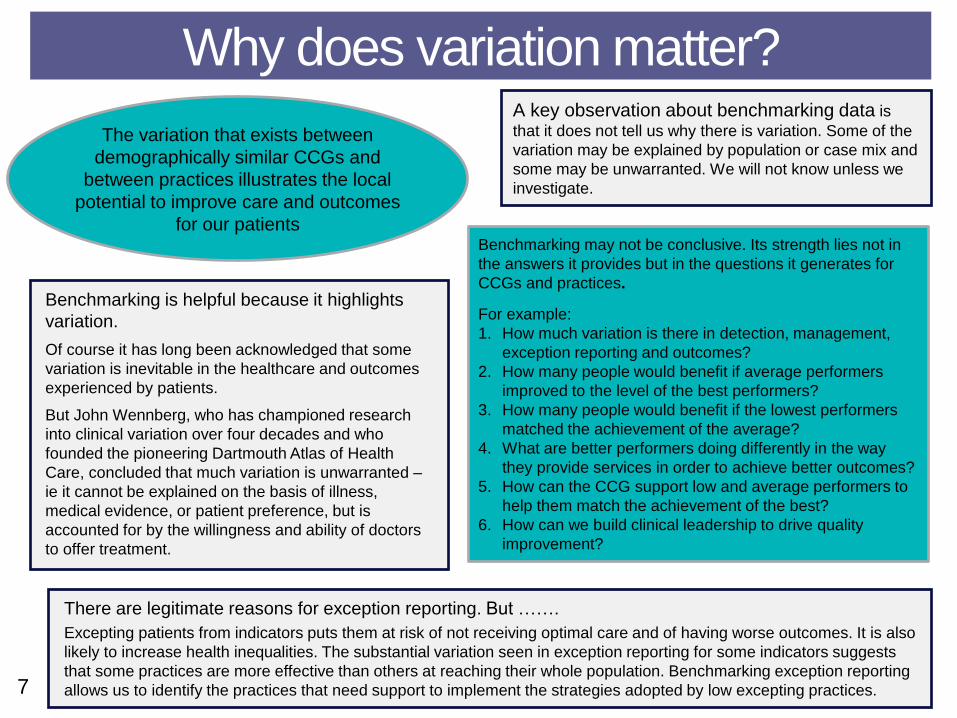
Benchmarking is helpful because it highlights
variation.
Of course it has long been acknowledged that some
variation is inevitable in the healthcare and outcomes
experienced by patients.
But John Wennberg, who has championed research
into clinical variation over four decades and who
founded the pioneering Dartmouth Atlas of Health
Care, concluded that much variation is unwarranted –
ie it cannot be explained on the basis of illness,
medical evidence, or patient preference, but is
accounted for by the willingness and ability of doctors
to offer treatment.
Benchmarking may not be conclusive. Its strength lies not in
the answers it provides but in the questions it generates for
CCGs and practices.
For example:
1. How much variation is there in detection, management,
exception reporting and outcomes?
2. How many people would benefit if average performers
improved to the level of the best performers?
3. How many people would benefit if the lowest performers
matched the achievement of the average?
4. What are better performers doing differently in the way
they provide services in order to achieve better outcomes?
5. How can the CCG support low and average performers to
help them match the achievement of the best?
6. How can we build clinical leadership to drive quality
improvement?
A key observation about benchmarking data is
that it does not tell us why there is variation. Some of the
variation may be explained by population or case mix and
some may be unwarranted. We will not know unless we
investigate.
The variation that exists between
demographically similar CCGs and
between practices illustrates the local
potential to improve care and outcomes
for our patients
There are legitimate reasons for exception reporting. But …….
Excepting patients from indicators puts them at risk of not receiving optimal care and of having worse outcomes. It is also
likely to increase health inequalities. The substantial variation seen in exception reporting for some indicators suggests
that some practices are more effective than others at reaching their whole population. Benchmarking exception reporting
allows us to identify the practices that need support to implement the strategies adopted by low excepting practices.
Why does variation matter?
7
Cluster methodology: your most similar practices
Each practice has been grouped on the basis of demographic data into
15 national clusters. These demographic factors cover:
• deprivation (practice level)
• age profile (% < 5, % < 18, % 15-24, % 65+, % 75+, % 85+)
• ethnicity (% population of white ethnicity)
• practice population side
These demographic factors closely align with those used to calculate
the “Similar 10 CCGs”.
These demographic factors have been used to compare practices with
similar populations to account for potential factors which may drive
variation. Some local interpretation will need to be applied to the data
contained within the packs as practices with significant outlying
population characteristics e.g. university populations or care home
practices will need further contextualisation.
Further detailed information including full technical methodology and a
full PDF report on each of the 15 practice clusters is available here:
https://github.com/julianflowers/geopractice.
8 CVD: Primary Care Intelligence Packs
7
9
22
21
17
31
14
15
12
9
3
5
1
1
1
-20%-15%-10%-5%0%5%
WELLINGTON ROAD SURGERY
EMERSONS GREEN MEDICAL CENTRE
LEAP VALLEY MEDICAL CENTRE
CHRISTCHURCH FAMILY MEDICAL CENTRE
CONISTON MEDICAL PRACTICE
FROME VALLEY MEDICAL CENTRE
ST MARY STREET SURGERY
KINGSWOOD HEALTH CENTRE
CONCORD MEDICAL CENTRE
KENNEDY WAY SURGERY
BRADLEY STOKE SURGERY
THE WILLOW SURGERY
CLOSE FARM SURGERY
PILNING SURGERY
COURTSIDE SURGERY
ALMONDSBURY SURGERY
STOKE GIFFORD MEDICAL CENTRE
ORCHARD MEDICAL CENTRE
WEST WALK SURGERY
THORNBURY HEALTH CENTRE - BURNEY
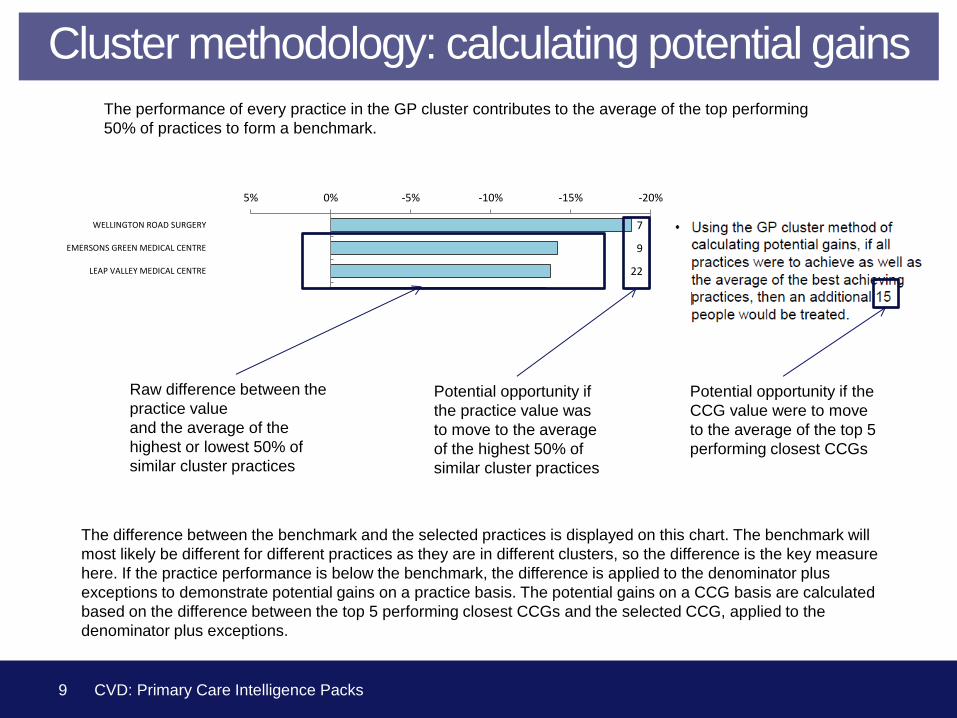
The performance of every practice in the GP cluster contributes to the average of the top performing
50% of practices to form a benchmark.
The difference between the benchmark and the selected practices is displayed on this chart. The benchmark will
most likely be different for different practices as they are in different clusters, so the difference is the key measure
here. If the practice performance is below the benchmark, the difference is applied to the denominator plus
exceptions to demonstrate potential gains on a practice basis. The potential gains on a CCG basis are calculated
based on the difference between the top 5 performing closest CCGs and the selected CCG, applied to the
denominator plus exceptions.
Cluster methodology: calculating potential gains
Raw difference between the
practice value
and the average of the
highest or lowest 50% of
similar cluster practices
Potential opportunity if
the practice value was
to move to the average
of the highest 50% of
similar cluster practices
Potential opportunity if the
CCG value were to move
to the average of the top 5
performing closest CCGs
9 CVD: Primary Care Intelligence Packs
CVD prevention
10 CVD: Primary Care Intelligence Packs
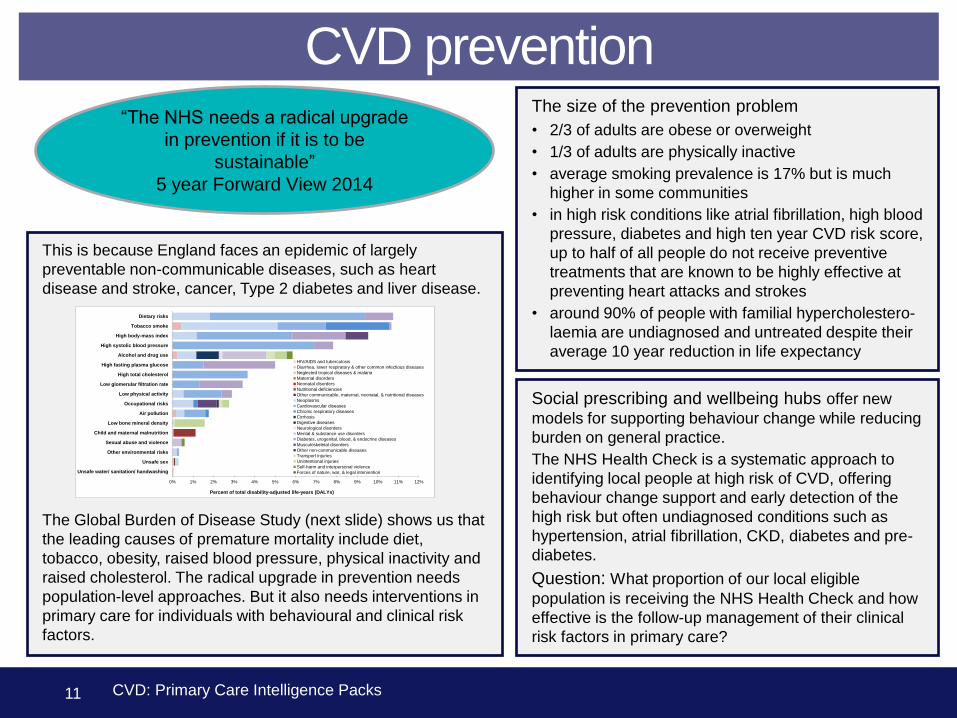
CVD prevention “The NHS needs a radical upgrade
in prevention if it is to be
sustainable”
5 year Forward View 2014
The size of the prevention problem
• 2/3 of adults are obese or overweight
• 1/3 of adults are physically inactive
• average smoking prevalence is 17% but is much
higher in some communities
• in high risk conditions like atrial fibrillation, high blood
pressure, diabetes and high ten year CVD risk score,
up to half of all people do not receive preventive
treatments that are known to be highly effective at
preventing heart attacks and strokes
• around 90% of people with familial hypercholestero-
laemia are undiagnosed and untreated despite their
average 10 year reduction in life expectancy
This is because England faces an epidemic of largely
preventable non-communicable diseases, such as heart
disease and stroke, cancer, Type 2 diabetes and liver disease.
The Global Burden of Disease Study (next slide) shows us that
the leading causes of premature mortality include diet,
tobacco, obesity, raised blood pressure, physical inactivity and
raised cholesterol. The radical upgrade in prevention needs
population-level approaches. But it also needs interventions in
primary care for individuals with behavioural and clinical risk
factors.
0% 1% 2% 3% 4% 5% 6% 7% 8% 9% 10% 11% 12%
Unsafe water/ sanitation/ handwashing
Unsafe sex
Other environmental risks
Sexual abuse and violence
Child and maternal malnutrition
Low bone mineral density
Air pollution
Occupational risks
Low physical activity
Low glomerular filtration rate
High total cholesterol
High fasting plasma glucose
Alcohol and drug use
High systolic blood pressure
High body-mass index
Tobacco smoke
Dietary risks
HIV/AIDS and tuberculosis
Diarrhea, lower respiratory & other common infectious diseases
Neglected tropical diseases & malaria
Maternal disorders
Neonatal disorders
Nutritional deficiencies
Other communicable, maternal, neonatal, & nutritional diseases
Neoplasms
Cardiovascular diseases
Chronic respiratory diseases
Cirrhosis
Digestive diseases
Neurological disorders
Mental & substance use disorders
Diabetes, urogenital, blood, & endocrine diseases
Musculoskeletal disorders
Other non-communicable diseases
Transport injuries
Unintentional injuries
Self-harm and interpersonal violence
Forces of nature, war, & legal intervention
Percent of total disability-adjusted life-years (DALYs)
Social prescribing and wellbeing hubs offer new
models for supporting behaviour change while reducing
burden on general practice.
The NHS Health Check is a systematic approach to
identifying local people at high risk of CVD, offering
behaviour change support and early detection of the
high risk but often undiagnosed conditions such as
hypertension, atrial fibrillation, CKD, diabetes and pre-
diabetes.
Question: What proportion of our local eligible
population is receiving the NHS Health Check and how
effective is the follow-up management of their clinical
risk factors in primary care?
11 11 CVD: Primary Care Intelligence Packs
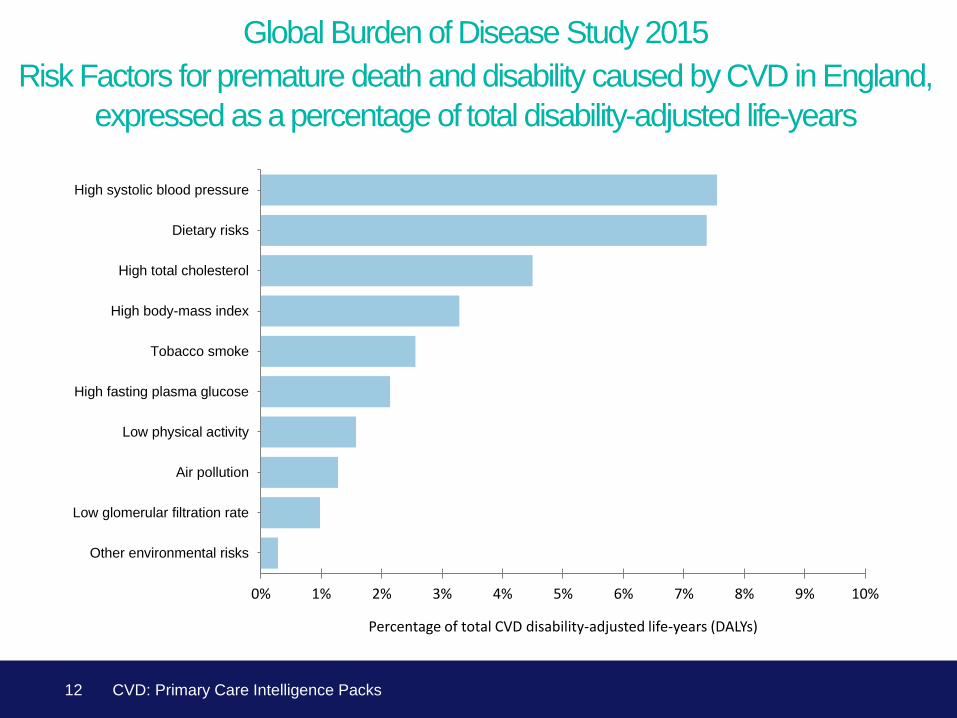
Global Burden of Disease Study 2015
Risk Factors for premature death and disability caused by CVD in England, expressed as a percentage of total disability-adjusted life-years
0% 1% 2% 3% 4% 5% 6% 7% 8% 9% 10%
Other environmental risks
Low glomerular filtration rate
Air pollution
Low physical activity
High fasting plasma glucose
Tobacco smoke
High body-mass index
High total cholesterol
Dietary risks
High systolic blood pressure
Percentage of total CVD disability-adjusted life-years (DALYs)
12 CVD: Primary Care Intelligence Packs
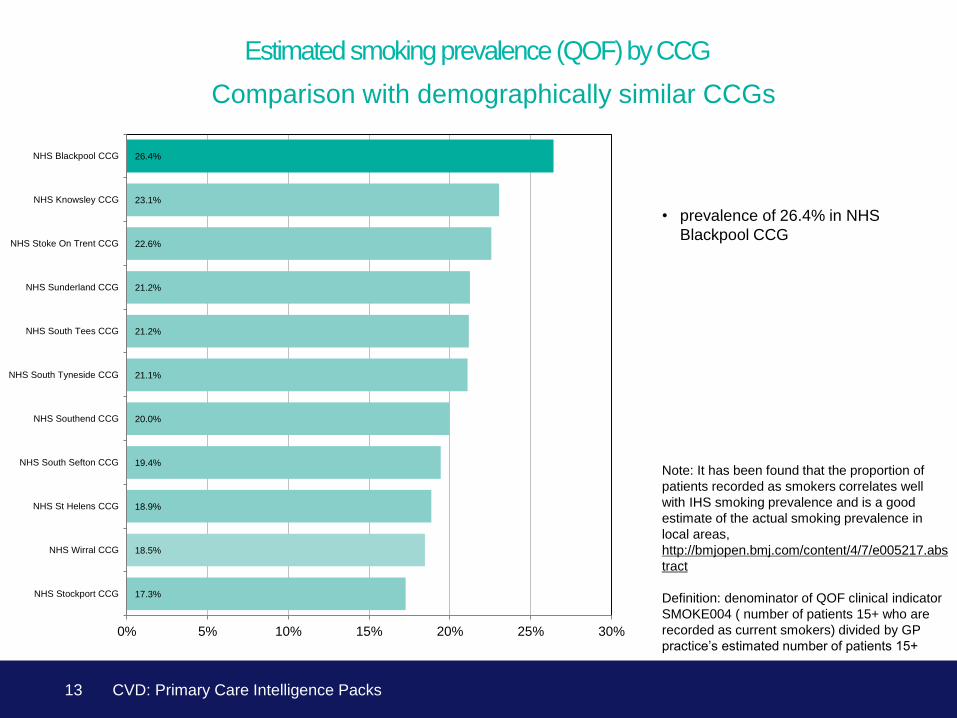
17.3%
18.5%
18.9%
19.4%
20.0%
21.1%
21.2%
21.2%
22.6%
23.1%
26.4%
0% 5% 10% 15% 20% 25% 30%
NHS Stockport CCG
NHS Wirral CCG
NHS St Helens CCG
NHS South Sefton CCG
NHS Southend CCG
NHS South Tyneside CCG
NHS South Tees CCG
NHS Sunderland CCG
NHS Stoke On Trent CCG
NHS Knowsley CCG
NHS Blackpool CCG
13
Estimated smoking prevalence (QOF) by CCG
Comparison with demographically similar CCGs
Note: It has been found that the proportion of
patients recorded as smokers correlates well
with IHS smoking prevalence and is a good
estimate of the actual smoking prevalence in
local areas,
http://bmjopen.bmj.com/content/4/7/e005217.abs
tract
Definition: denominator of QOF clinical indicator
SMOKE004 ( number of patients 15+ who are
recorded as current smokers) divided by GP
practice’s estimated number of patients 15+
CVD: Primary Care Intelligence Packs
• prevalence of 26.4% in NHS
Blackpool CCG
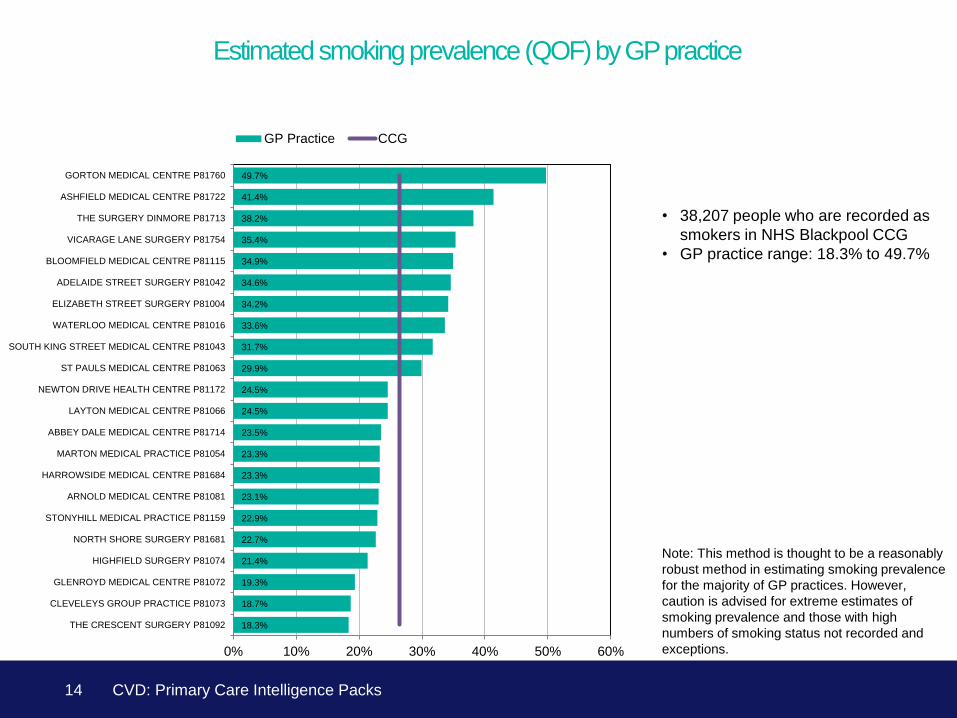
18.3%
18.7%
19.3%
21.4%
22.7%
22.9%
23.1%
23.3%
23.3%
23.5%
24.5%
24.5%
29.9%
31.7%
33.6%
34.2%
34.6%
34.9%
35.4%
38.2%
41.4%
49.7%
0% 10% 20% 30% 40% 50% 60%
THE CRESCENT SURGERY P81092
CLEVELEYS GROUP PRACTICE P81073
GLENROYD MEDICAL CENTRE P81072
HIGHFIELD SURGERY P81074
NORTH SHORE SURGERY P81681
STONYHILL MEDICAL PRACTICE P81159
ARNOLD MEDICAL CENTRE P81081
HARROWSIDE MEDICAL CENTRE P81684
MARTON MEDICAL PRACTICE P81054
ABBEY DALE MEDICAL CENTRE P81714
LAYTON MEDICAL CENTRE P81066
NEWTON DRIVE HEALTH CENTRE P81172
ST PAULS MEDICAL CENTRE P81063
SOUTH KING STREET MEDICAL CENTRE P81043
WATERLOO MEDICAL CENTRE P81016
ELIZABETH STREET SURGERY P81004
ADELAIDE STREET SURGERY P81042
BLOOMFIELD MEDICAL CENTRE P81115
VICARAGE LANE SURGERY P81754
THE SURGERY DINMORE P81713
ASHFIELD MEDICAL CENTRE P81722
GORTON MEDICAL CENTRE P81760
GP Practice CCG
14
Estimated smoking prevalence (QOF) by GP practice
Note: This method is thought to be a reasonably
robust method in estimating smoking prevalence
for the majority of GP practices. However,
caution is advised for extreme estimates of
smoking prevalence and those with high
numbers of smoking status not recorded and
exceptions.
CVD: Primary Care Intelligence Packs
• 38,207 people who are recorded as
smokers in NHS Blackpool CCG
• GP practice range: 18.3% to 49.7%
Hypertension
15 CVD: Primary Care Intelligence Packs
16
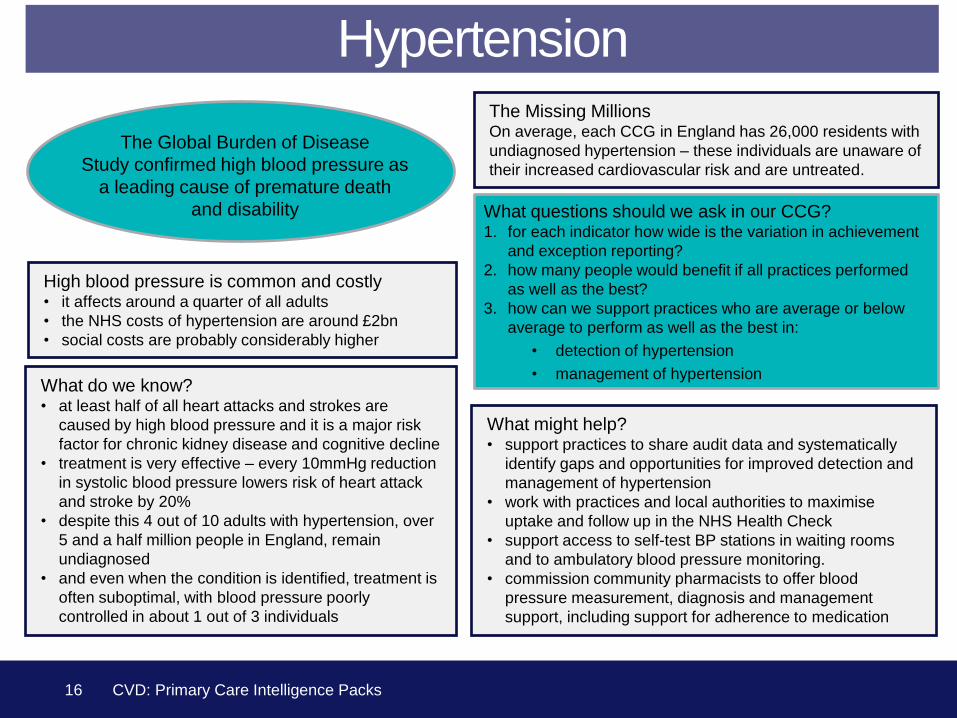
The Missing Millions On average, each CCG in England has 26,000 residents with
undiagnosed hypertension – these individuals are unaware of
their increased cardiovascular risk and are untreated.
What might help? • support practices to share audit data and systematically
identify gaps and opportunities for improved detection and
management of hypertension
• work with practices and local authorities to maximise
uptake and follow up in the NHS Health Check
• support access to self-test BP stations in waiting rooms
and to ambulatory blood pressure monitoring.
• commission community pharmacists to offer blood
pressure measurement, diagnosis and management
support, including support for adherence to medication
What questions should we ask in our CCG? 1. for each indicator how wide is the variation in achievement
and exception reporting?
2. how many people would benefit if all practices performed
as well as the best?
3. how can we support practices who are average or below
average to perform as well as the best in:
• detection of hypertension
• management of hypertension What do we know? • at least half of all heart attacks and strokes are
caused by high blood pressure and it is a major risk
factor for chronic kidney disease and cognitive decline
• treatment is very effective – every 10mmHg reduction
in systolic blood pressure lowers risk of heart attack
and stroke by 20%
• despite this 4 out of 10 adults with hypertension, over
5 and a half million people in England, remain
undiagnosed
• and even when the condition is identified, treatment is
often suboptimal, with blood pressure poorly
controlled in about 1 out of 3 individuals
Hypertension
High blood pressure is common and costly • it affects around a quarter of all adults
• the NHS costs of hypertension are around £2bn
• social costs are probably considerably higher
CVD: Primary Care Intelligence Packs
The Global Burden of Disease
Study confirmed high blood pressure as
a leading cause of premature death
and disability
0.59
0.57
0.58
0.59
0.59
0.60
0.61
0.62
0.62
0.0 0.1 0.2 0.3 0.4 0.5 0.6 0.7
England
NHS Blackburn With Darwen CCG
NHS Lancashire North CCG
NHS Greater Preston CCG
NHS East Lancashire CCG
NHS Chorley And South Ribble CCG
NHS West Lancashire CCG
NHS Fylde & Wyre CCG
NHS Blackpool CCG
Ratio
0.59
0.57
0.58
0.59
0.59
0.60
0.61
0.62
0.62
0.0 0.1 0.2 0.3 0.4 0.5 0.6 0.7
England
NHS Blackburn With Darwen CCG
NHS Lancashire North CCG
NHS Greater Preston CCG
NHS East Lancashire CCG
NHS Chorley And South Ribble CCG
NHS West Lancashire CCG
NHS Fylde & Wyre CCG
NHS Blackpool CCG
Ratio
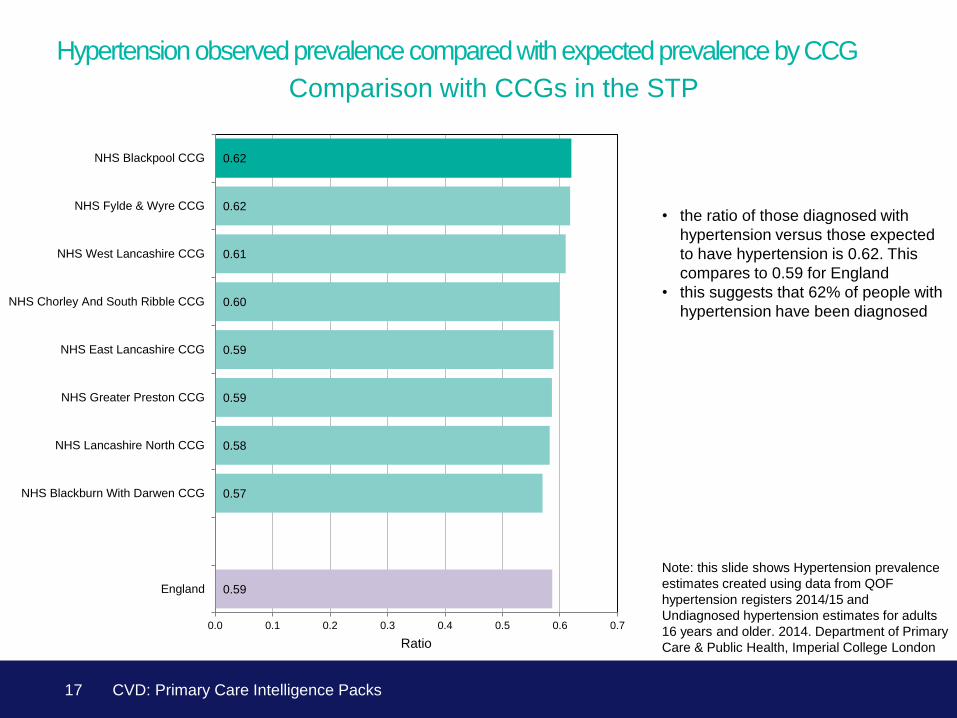
17
Hypertension observed prevalence compared with expected prevalence by CCG
Comparison with CCGs in the STP
CVD: Primary Care Intelligence Packs
Note: this slide shows Hypertension prevalence
estimates created using data from QOF
hypertension registers 2014/15 and
Undiagnosed hypertension estimates for adults
16 years and older. 2014. Department of Primary
Care & Public Health, Imperial College London
• the ratio of those diagnosed with
hypertension versus those expected
to have hypertension is 0.62. This
compares to 0.59 for England
• this suggests that 62% of people with
hypertension have been diagnosed
0.60
0.60
0.60
0.60
0.60
0.61
0.61
0.62
0.62
0.63
0.64
0% 10% 20% 30% 40% 50% 60% 70%
NHS South Tees CCG
NHS Stockport CCG
NHS Southend CCG
NHS South Tyneside CCG
NHS Wirral CCG
NHS Knowsley CCG
NHS Sunderland CCG
NHS Stoke On Trent CCG
NHS Blackpool CCG
NHS South Sefton CCG
NHS St Helens CCG
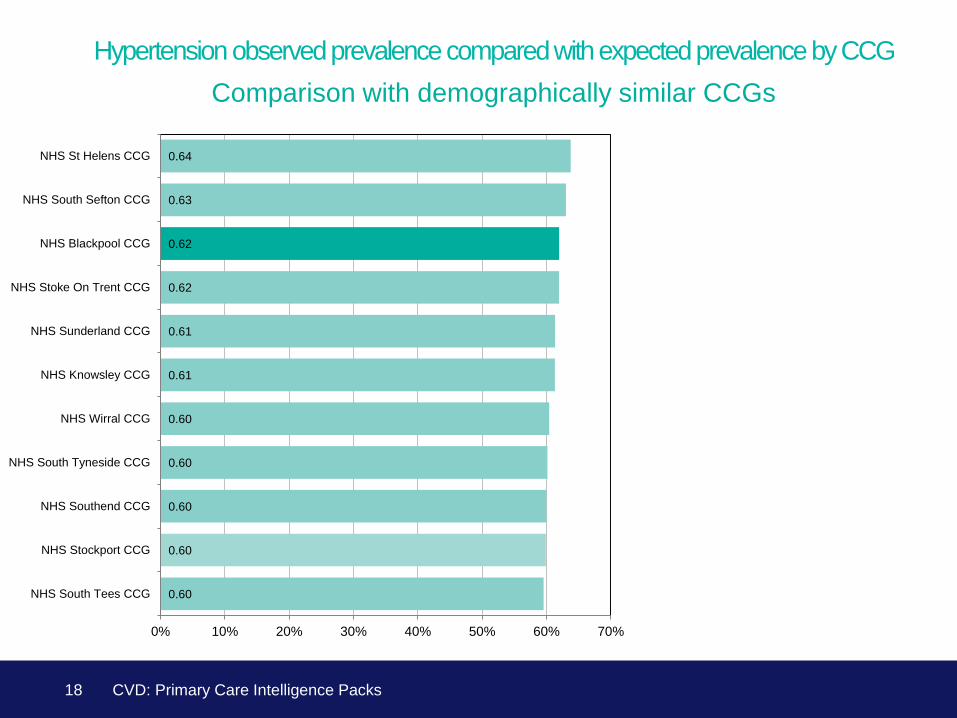
18
Hypertension observed prevalence compared with expected prevalence by CCG
Comparison with demographically similar CCGs
CVD: Primary Care Intelligence Packs
0.21
0.49
0.51
0.53
0.54
0.55
0.56
0.57
0.59
0.59
0.60
0.61
0.62
0.62
0.62
0.65
0.66
0.66
0.66
0.67
0.67
0.70
0.0 0.1 0.2 0.3 0.4 0.5 0.6 0.7 0.8 0.9 1.0
ASHFIELD MEDICAL CENTRE P81722
THE SURGERY DINMORE P81713
WATERLOO MEDICAL CENTRE P81016
VICARAGE LANE SURGERY P81754
ELIZABETH STREET SURGERY P81004
MARTON MEDICAL PRACTICE P81054
GORTON MEDICAL CENTRE P81760
LAYTON MEDICAL CENTRE P81066
NEWTON DRIVE HEALTH CENTRE P81172
HARROWSIDE MEDICAL CENTRE P81684
ABBEY DALE MEDICAL CENTRE P81714
SOUTH KING STREET MEDICAL CENTRE P81043
BLOOMFIELD MEDICAL CENTRE P81115
GLENROYD MEDICAL CENTRE P81072
THE CRESCENT SURGERY P81092
STONYHILL MEDICAL PRACTICE P81159
HIGHFIELD SURGERY P81074
NORTH SHORE SURGERY P81681
ST PAULS MEDICAL CENTRE P81063
ARNOLD MEDICAL CENTRE P81081
ADELAIDE STREET SURGERY P81042
CLEVELEYS GROUP PRACTICE P81073
Ratio
GP practice CCG
19
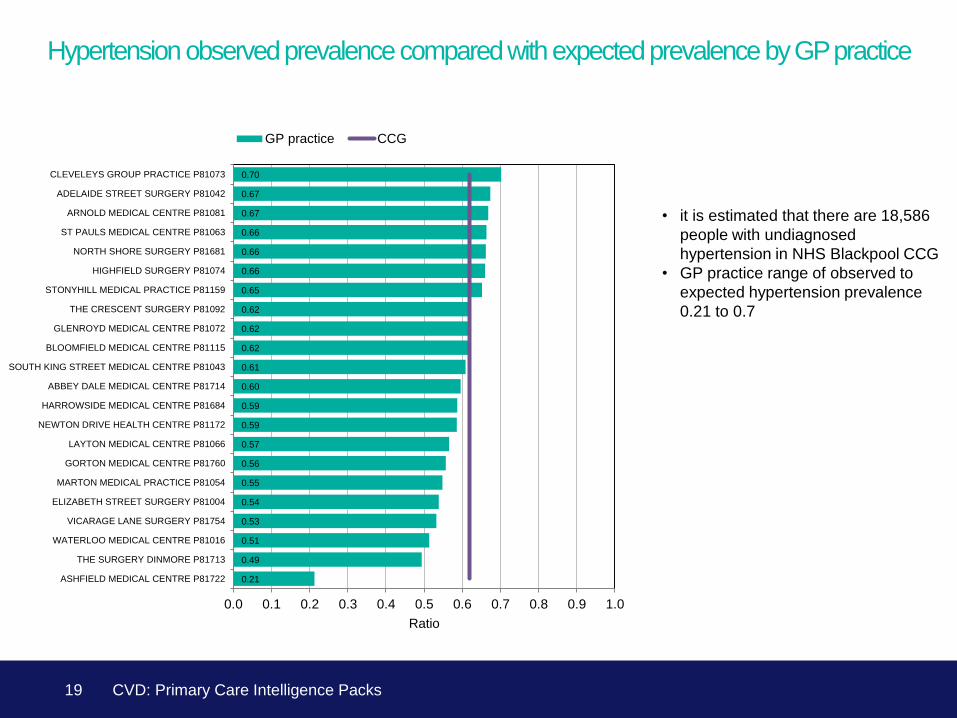
Hypertension observed prevalence compared with expected prevalence by GP practice
• it is estimated that there are 18,586
people with undiagnosed
hypertension in NHS Blackpool CCG
• GP practice range of observed to
expected hypertension prevalence
0.21 to 0.7
CVD: Primary Care Intelligence Packs
79.6%
76.8%
80.5%
80.5%
80.6%
80.7%
80.9%
81.4%
82.5%
0% 10% 20% 30% 40% 50% 60% 70% 80% 90%
England
NHS Lancashire North CCG
NHS East Lancashire CCG
NHS Greater Preston CCG
NHS Chorley And South Ribble CCG
NHS Blackburn With Darwen CCG
NHS Blackpool CCG
NHS Fylde & Wyre CCG
NHS West Lancashire CCG
79.6%
76.8%
80.5%
80.5%
80.6%
80.7%
80.9%
81.4%
82.5%
0% 10% 20% 30% 40% 50% 60% 70% 80% 90%
England
NHS Lancashire North CCG
NHS East Lancashire CCG
NHS Greater Preston CCG
NHS Chorley And South Ribble CCG
NHS Blackburn With Darwen CCG
NHS Blackpool CCG
NHS Fylde & Wyre CCG
NHS West Lancashire CCG
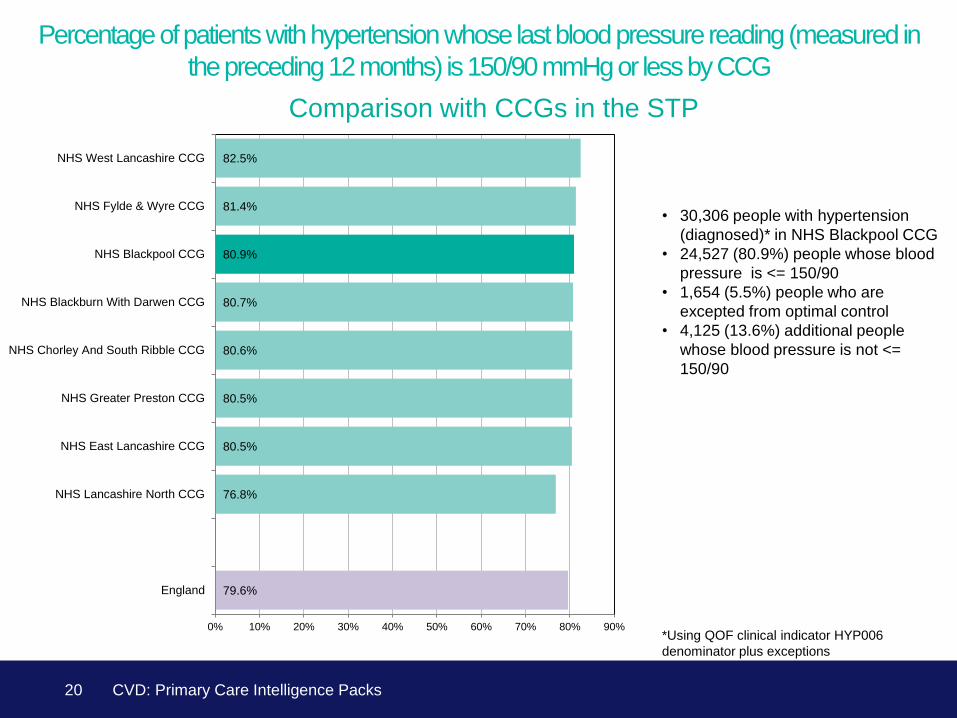
20
Percentage of patients with hypertension whose last blood pressure reading (measured in
the preceding 12 months) is 150/90 mmHg or less by CCG
Comparison with CCGs in the STP
*Using QOF clinical indicator HYP006
denominator plus exceptions
• 30,306 people with hypertension
(diagnosed)* in NHS Blackpool CCG
• 24,527 (80.9%) people whose blood
pressure is <= 150/90
• 1,654 (5.5%) people who are
excepted from optimal control
• 4,125 (13.6%) additional people
whose blood pressure is not <=
150/90
CVD: Primary Care Intelligence Packs
77.5%
78.0%
79.4%
79.5%
80.0%
80.0%
80.5%
80.9%
81.5%
81.9%
82.4%
0% 10% 20% 30% 40% 50% 60% 70% 80% 90%
NHS South Sefton CCG
NHS Southend CCG
NHS Wirral CCG
NHS Sunderland CCG
NHS South Tyneside CCG
NHS South Tees CCG
NHS St Helens CCG
NHS Blackpool CCG
NHS Stoke On Trent CCG
NHS Stockport CCG
NHS Knowsley CCG
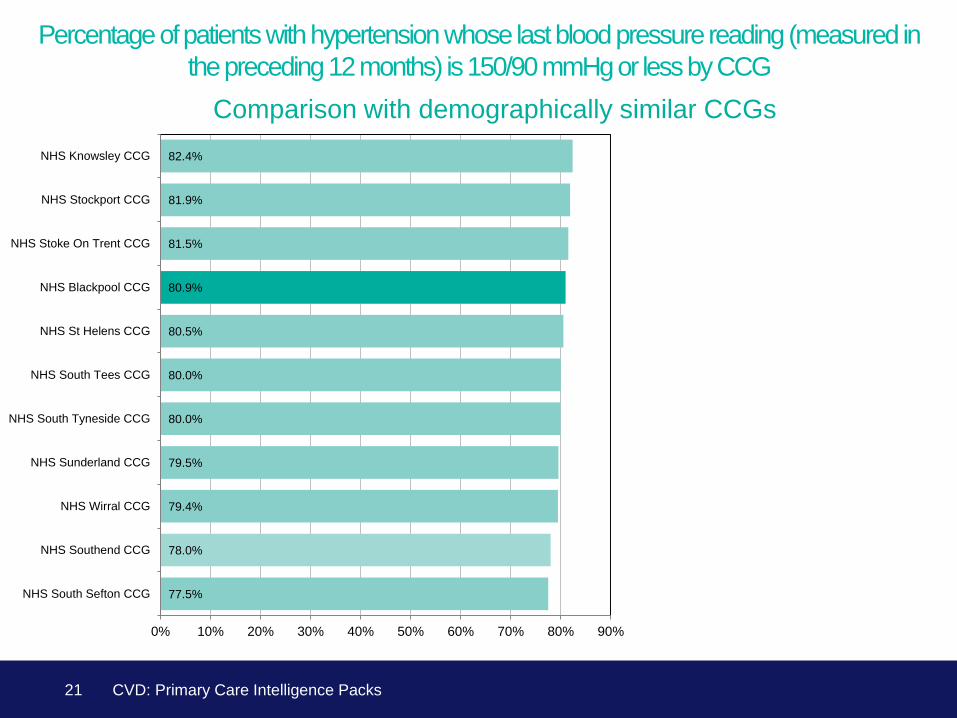
21
Percentage of patients with hypertension whose last blood pressure reading (measured in
the preceding 12 months) is 150/90 mmHg or less by CCG
Comparison with demographically similar CCGs
CVD: Primary Care Intelligence Packs
104
36
152
417
427
270
63
118
206
315
55
379
177
270
311
222
128
456
605
436
613
19
0% 10% 20% 30% 40% 50% 60% 70% 80% 90% 100%
ARNOLD MEDICAL CENTRE P81081
THE SURGERY DINMORE P81713
LAYTON MEDICAL CENTRE P81066
HIGHFIELD SURGERY P81074
CLEVELEYS GROUP PRACTICE P81073
STONYHILL MEDICAL PRACTICE P81159
GORTON MEDICAL CENTRE P81760
ELIZABETH STREET SURGERY P81004
MARTON MEDICAL PRACTICE P81054
THE CRESCENT SURGERY P81092
VICARAGE LANE SURGERY P81754
ADELAIDE STREET SURGERY P81042
HARROWSIDE MEDICAL CENTRE P81684
NEWTON DRIVE HEALTH CENTRE P81172
WATERLOO MEDICAL CENTRE P81016
SOUTH KING STREET MEDICAL CENTRE P81043
ABBEY DALE MEDICAL CENTRE P81714
ST PAULS MEDICAL CENTRE P81063
GLENROYD MEDICAL CENTRE P81072
BLOOMFIELD MEDICAL CENTRE P81115
NORTH SHORE SURGERY P81681
ASHFIELD MEDICAL CENTRE P81722
No treatment Exceptions reported
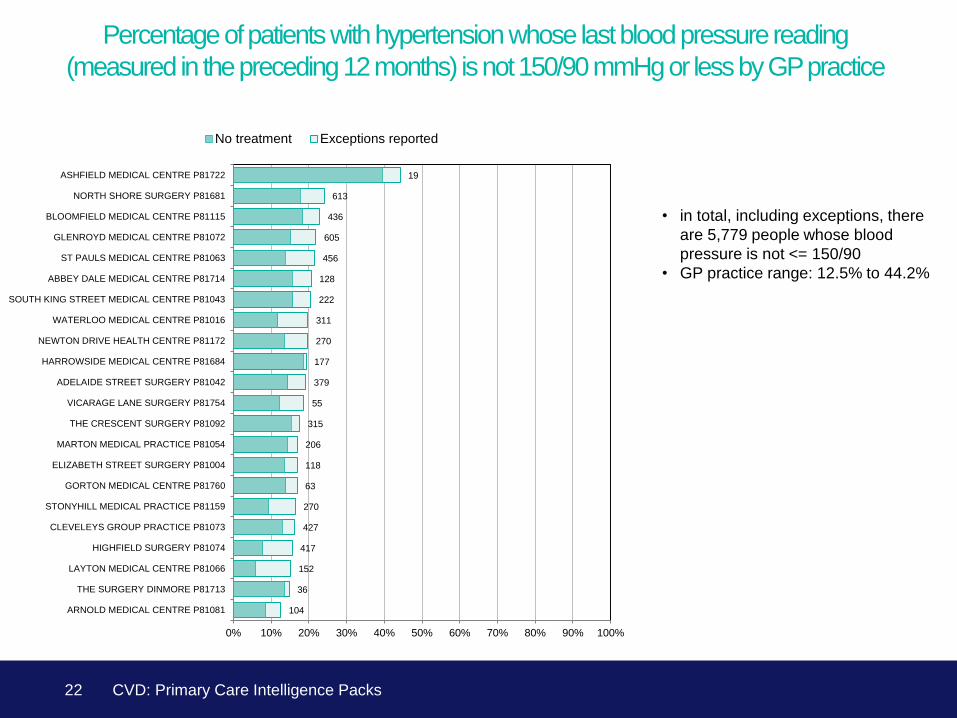
22
Percentage of patients with hypertension whose last blood pressure reading
(measured in the preceding 12 months) is not 150/90 mmHg or less by GP practice
• in total, including exceptions, there
are 5,779 people whose blood
pressure is not <= 150/90
• GP practice range: 12.5% to 44.2%
CVD: Primary Care Intelligence Packs
66.5%
55.6%
57.7%
59.7%
62.9%
64.3%
64.5%
70.9%
75.0%
0% 10% 20% 30% 40% 50% 60% 70% 80%
England
NHS Lancashire North CCG
NHS Blackpool CCG
NHS Greater Preston CCG
NHS Chorley And South Ribble CCG
NHS East Lancashire CCG
NHS Fylde & Wyre CCG
NHS Blackburn With Darwen CCG
NHS West Lancashire CCG
66.5%
55.6%
57.7%
59.7%
62.9%
64.3%
64.5%
70.9%
75.0%
0% 10% 20% 30% 40% 50% 60% 70% 80%
England
NHS Lancashire North CCG
NHS Blackpool CCG
NHS Greater Preston CCG
NHS Chorley And South Ribble CCG
NHS East Lancashire CCG
NHS Fylde & Wyre CCG
NHS Blackburn With Darwen CCG
NHS West Lancashire CCG
23
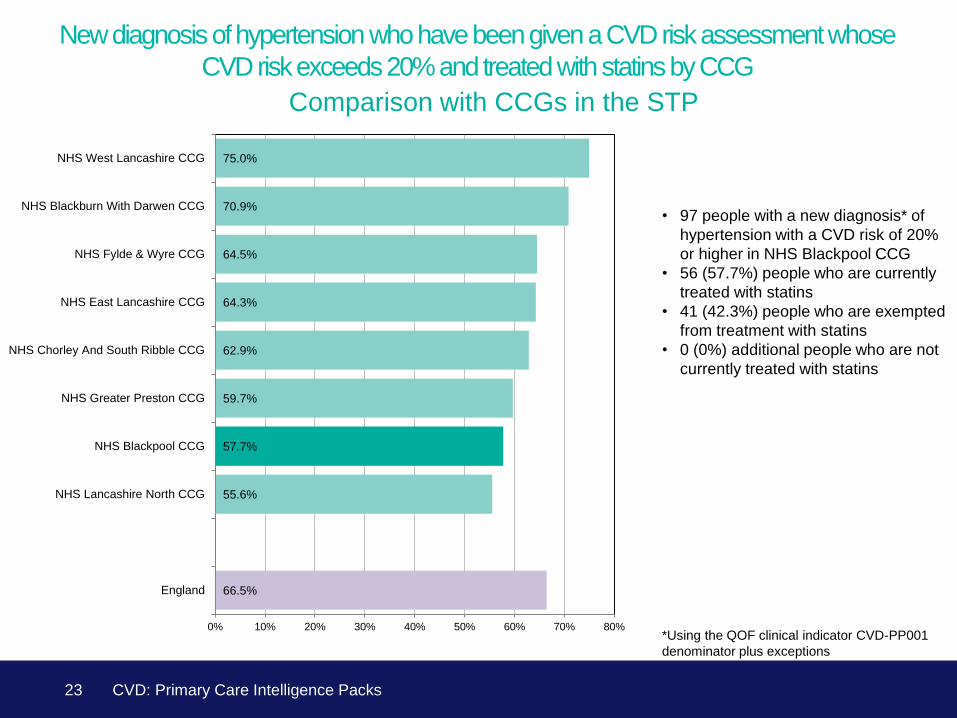
New diagnosis of hypertension who have been given a CVD risk assessment whose
CVD risk exceeds 20% and treated with statins by CCG
Comparison with CCGs in the STP
• 97 people with a new diagnosis* of
hypertension with a CVD risk of 20%
or higher in NHS Blackpool CCG
• 56 (57.7%) people who are currently
treated with statins
• 41 (42.3%) people who are exempted
from treatment with statins
• 0 (0%) additional people who are not
currently treated with statins
*Using the QOF clinical indicator CVD-PP001
denominator plus exceptions
CVD: Primary Care Intelligence Packs

57.7%
58.2%
60.1%
61.8%
63.0%
68.8%
69.2%
70.2%
71.1%
74.5%
83.5%
0% 10% 20% 30% 40% 50% 60% 70% 80% 90%
NHS Blackpool CCG
NHS South Tyneside CCG
NHS Stockport CCG
NHS Sunderland CCG
NHS Southend CCG
NHS Stoke On Trent CCG
NHS Wirral CCG
NHS St Helens CCG
NHS South Sefton CCG
NHS South Tees CCG
NHS Knowsley CCG
24
New diagnosis of hypertension who have been given a CVD risk assessment whose
CVD risk exceeds 20% and treated with statins by CCG
Comparison with demographically similar CCGs
CVD: Primary Care Intelligence Packs
3
4
2
4
1
1
1
1
3
3
2
6
3
4
3
0% 10% 20% 30% 40% 50% 60% 70% 80% 90% 100%
THE SURGERY DINMORE P81713
ASHFIELD MEDICAL CENTRE P81722
GORTON MEDICAL CENTRE P81760
VICARAGE LANE SURGERY P81754
HARROWSIDE MEDICAL CENTRE P81684
THE CRESCENT SURGERY P81092
WATERLOO MEDICAL CENTRE P81016
BLOOMFIELD MEDICAL CENTRE P81115
ST PAULS MEDICAL CENTRE P81063
ADELAIDE STREET SURGERY P81042
HIGHFIELD SURGERY P81074
MARTON MEDICAL PRACTICE P81054
SOUTH KING STREET MEDICAL CENTRE P81043
STONYHILL MEDICAL PRACTICE P81159
ELIZABETH STREET SURGERY P81004
ABBEY DALE MEDICAL CENTRE P81714
NORTH SHORE SURGERY P81681
CLEVELEYS GROUP PRACTICE P81073
GLENROYD MEDICAL CENTRE P81072
ARNOLD MEDICAL CENTRE P81081
NEWTON DRIVE HEALTH CENTRE P81172
LAYTON MEDICAL CENTRE P81066
No treatment Exceptions reported
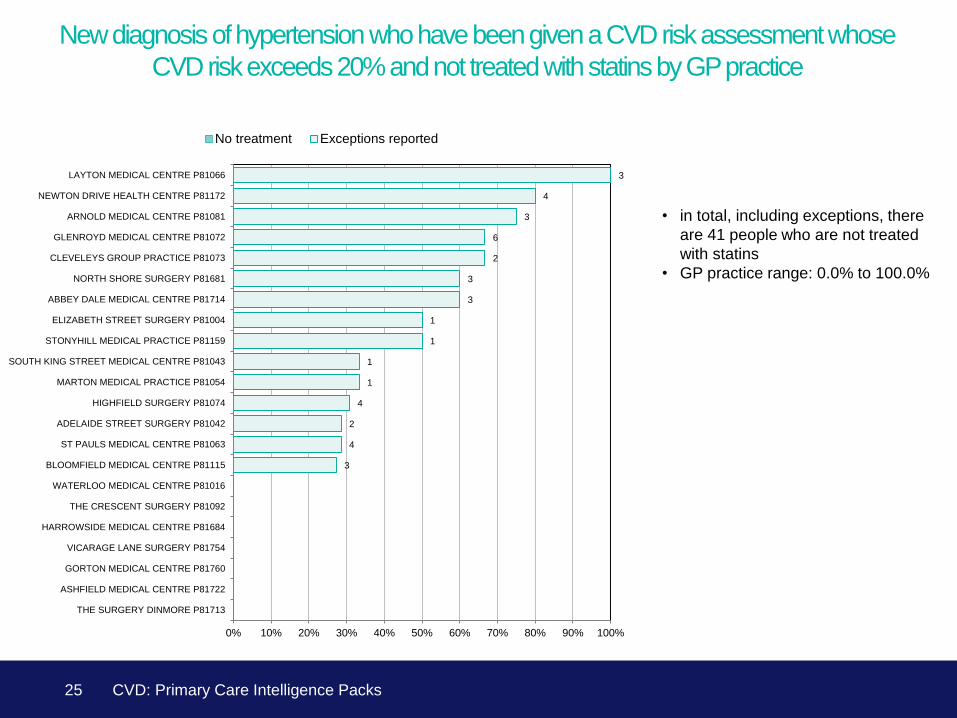
25
New diagnosis of hypertension who have been given a CVD risk assessment whose
CVD risk exceeds 20% and not treated with statins by GP practice
• in total, including exceptions, there
are 41 people who are not treated
with statins
• GP practice range: 0.0% to 100.0%
CVD: Primary Care Intelligence Packs

Stroke
26 CVD: Primary Care Intelligence Packs
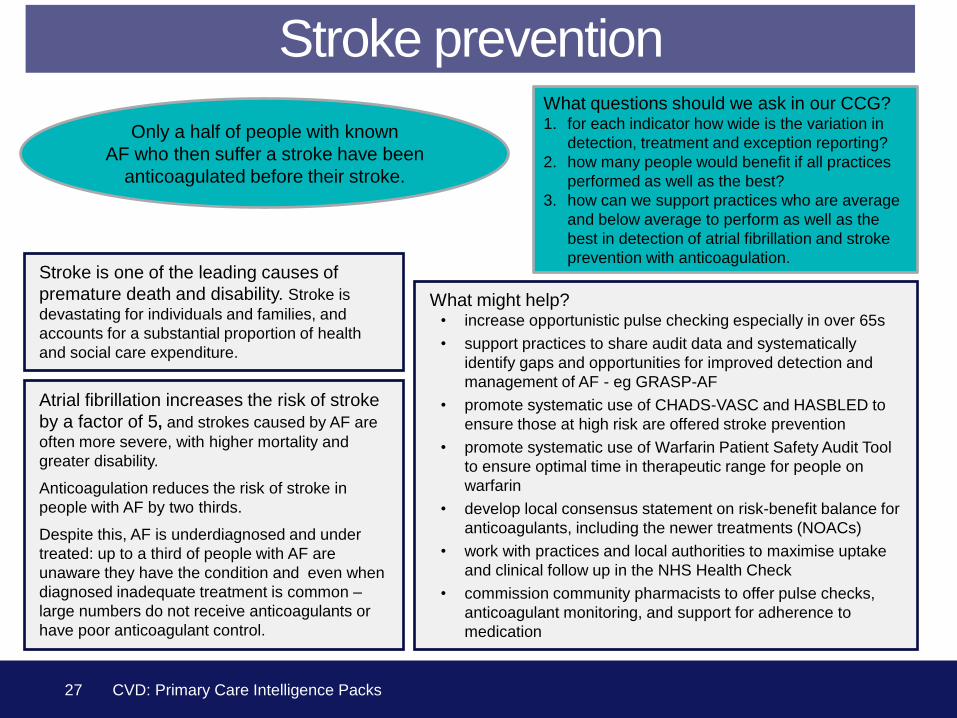
27
Only a half of people with known
AF who then suffer a stroke have been
anticoagulated before their stroke.
Stroke is one of the leading causes of
premature death and disability. Stroke is
devastating for individuals and families, and
accounts for a substantial proportion of health
and social care expenditure.
What might help? • increase opportunistic pulse checking especially in over 65s
• support practices to share audit data and systematically
identify gaps and opportunities for improved detection and
management of AF - eg GRASP-AF
• promote systematic use of CHADS-VASC and HASBLED to
ensure those at high risk are offered stroke prevention
• promote systematic use of Warfarin Patient Safety Audit Tool
to ensure optimal time in therapeutic range for people on
warfarin
• develop local consensus statement on risk-benefit balance for
anticoagulants, including the newer treatments (NOACs)
• work with practices and local authorities to maximise uptake
and clinical follow up in the NHS Health Check
• commission community pharmacists to offer pulse checks,
anticoagulant monitoring, and support for adherence to
medication
What questions should we ask in our CCG? 1. for each indicator how wide is the variation in
detection, treatment and exception reporting?
2. how many people would benefit if all practices
performed as well as the best?
3. how can we support practices who are average
and below average to perform as well as the
best in detection of atrial fibrillation and stroke
prevention with anticoagulation.
Atrial fibrillation increases the risk of stroke
by a factor of 5, and strokes caused by AF are
often more severe, with higher mortality and
greater disability.
Anticoagulation reduces the risk of stroke in
people with AF by two thirds.
Despite this, AF is underdiagnosed and under
treated: up to a third of people with AF are
unaware they have the condition and even when
diagnosed inadequate treatment is common –
large numbers do not receive anticoagulants or
have poor anticoagulant control.
Stroke prevention
CVD: Primary Care Intelligence Packs
0.70
0.65
0.68
0.70
0.71
0.72
0.73
0.75
0.77
0.0 0.1 0.2 0.3 0.4 0.5 0.6 0.7 0.8 0.9
England
NHS Blackburn With Darwen CCG
NHS East Lancashire CCG
NHS Greater Preston CCG
NHS West Lancashire CCG
NHS Fylde & Wyre CCG
NHS Chorley And South Ribble CCG
NHS Lancashire North CCG
NHS Blackpool CCG
0.70
0.65
0.68
0.70
0.71
0.72
0.73
0.75
0.77
0.0 0.1 0.2 0.3 0.4 0.5 0.6 0.7 0.8 0.9
England
NHS Blackburn With Darwen CCG
NHS East Lancashire CCG
NHS Greater Preston CCG
NHS West Lancashire CCG
NHS Fylde & Wyre CCG
NHS Chorley And South Ribble CCG
NHS Lancashire North CCG
NHS Blackpool CCG
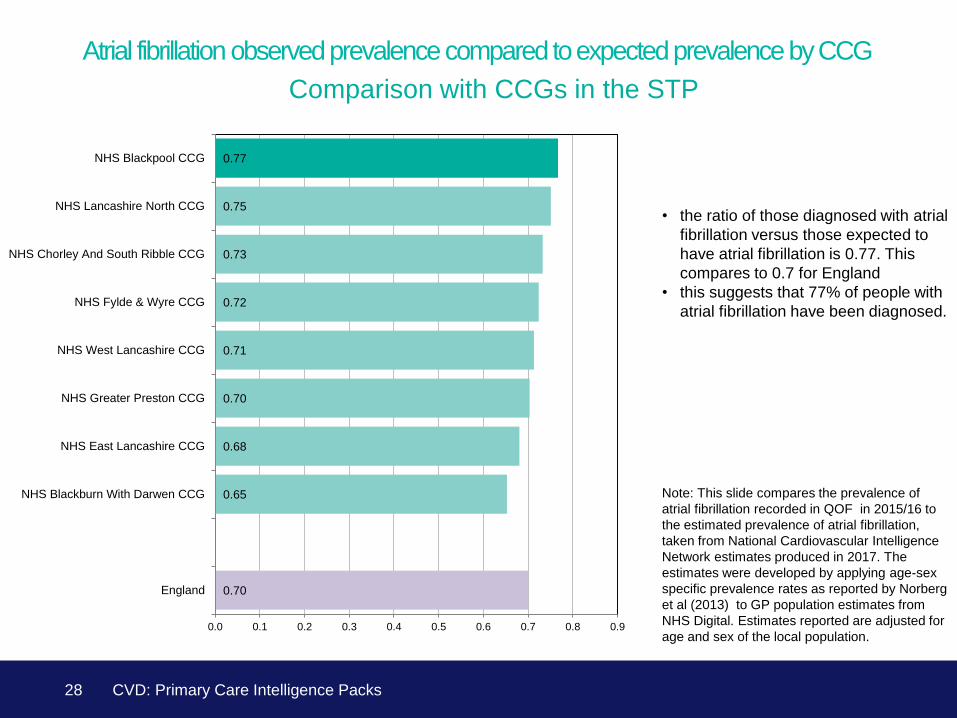
28
Atrial fibrillation observed prevalence compared to expected prevalence by CCG
Comparison with CCGs in the STP
Note: This slide compares the prevalence of
atrial fibrillation recorded in QOF in 2015/16 to
the estimated prevalence of atrial fibrillation,
taken from National Cardiovascular Intelligence
Network estimates produced in 2017. The
estimates were developed by applying age-sex
specific prevalence rates as reported by Norberg
et al (2013) to GP population estimates from
NHS Digital. Estimates reported are adjusted for
age and sex of the local population.
• the ratio of those diagnosed with atrial
fibrillation versus those expected to
have atrial fibrillation is 0.77. This
compares to 0.7 for England
• this suggests that 77% of people with
atrial fibrillation have been diagnosed.
CVD: Primary Care Intelligence Packs
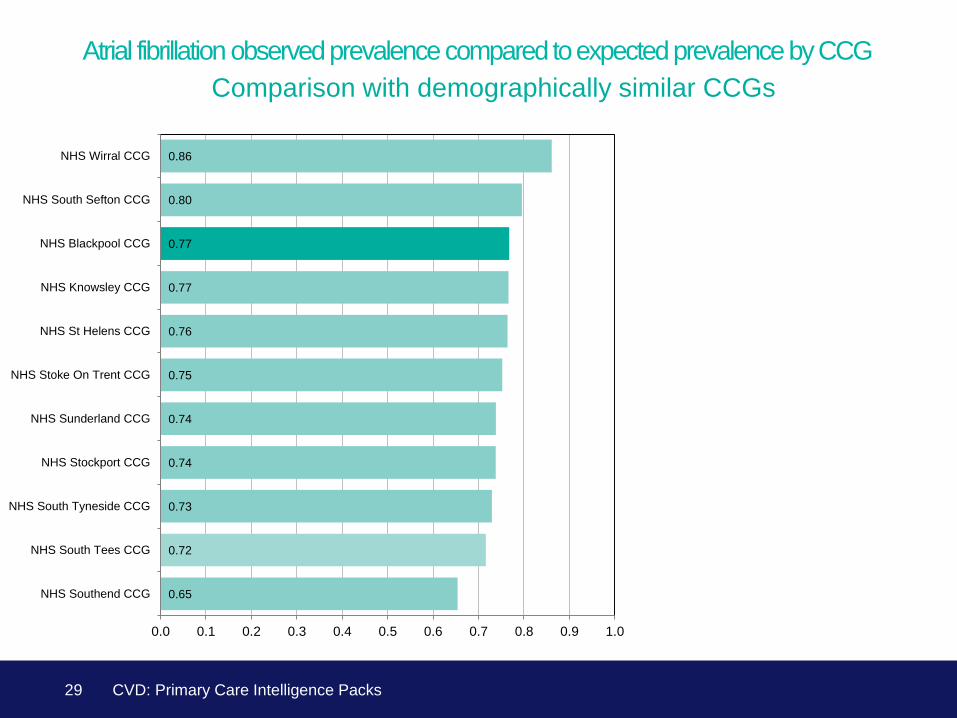
0.65
0.72
0.73
0.74
0.74
0.75
0.76
0.77
0.77
0.80
0.86
0.0 0.1 0.2 0.3 0.4 0.5 0.6 0.7 0.8 0.9 1.0
NHS Southend CCG
NHS South Tees CCG
NHS South Tyneside CCG
NHS Stockport CCG
NHS Sunderland CCG
NHS Stoke On Trent CCG
NHS St Helens CCG
NHS Knowsley CCG
NHS Blackpool CCG
NHS South Sefton CCG
NHS Wirral CCG
29
Atrial fibrillation observed prevalence compared to expected prevalence by CCG
Comparison with demographically similar CCGs
CVD: Primary Care Intelligence Packs
0.5
0.6
0.6
0.6
0.7
0.7
0.7
0.7
0.7
0.7
0.8
0.8
0.8
0.8
0.8
0.8
0.8
0.8
0.9
0.9
1.1
0.0 0.1 0.2 0.3 0.4 0.5 0.6 0.7 0.8 0.9 1.0
THE SURGERY DINMORE P81713
GORTON MEDICAL CENTRE P81760
LAYTON MEDICAL CENTRE P81066
ELIZABETH STREET SURGERY P81004
ABBEY DALE MEDICAL CENTRE P81714
THE CRESCENT SURGERY P81092
ST PAULS MEDICAL CENTRE P81063
MARTON MEDICAL PRACTICE P81054
SOUTH KING STREET MEDICAL CENTRE P81043
WATERLOO MEDICAL CENTRE P81016
HARROWSIDE MEDICAL CENTRE P81684
NORTH SHORE SURGERY P81681
NEWTON DRIVE HEALTH CENTRE P81172
STONYHILL MEDICAL PRACTICE P81159
BLOOMFIELD MEDICAL CENTRE P81115
ARNOLD MEDICAL CENTRE P81081
HIGHFIELD SURGERY P81074
CLEVELEYS GROUP PRACTICE P81073
GLENROYD MEDICAL CENTRE P81072
ADELAIDE STREET SURGERY P81042
VICARAGE LANE SURGERY P81754
Ratio
GP practice CCG
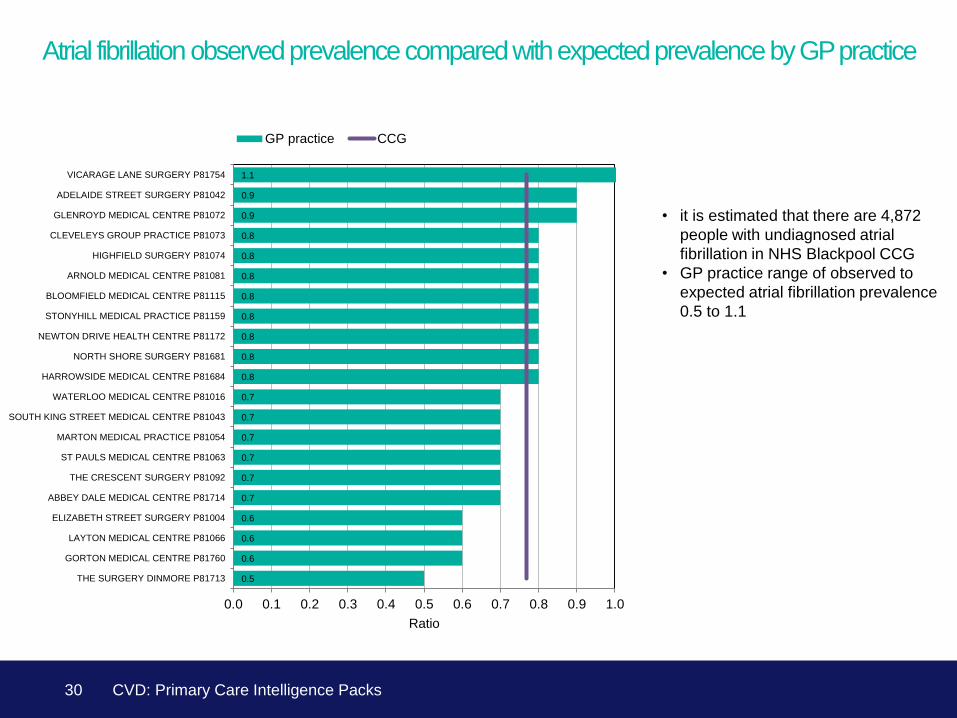
30
Atrial fibrillation observed prevalence compared with expected prevalence by GP practice
• it is estimated that there are 4,872
people with undiagnosed atrial
fibrillation in NHS Blackpool CCG
• GP practice range of observed to
expected atrial fibrillation prevalence
0.5 to 1.1
CVD: Primary Care Intelligence Packs
77.9%
72.3%
72.5%
73.4%
74.1%
74.4%
74.9%
75.3%
76.5%
0% 20% 40% 60% 80% 100%
England
NHS East Lancashire CCG
NHS Chorley And South Ribble CCG
NHS Lancashire North CCG
NHS Greater Preston CCG
NHS West Lancashire CCG
NHS Blackburn With Darwen CCG
NHS Blackpool CCG
NHS Fylde & Wyre CCG
Optimal management No treatment Exceptions reported
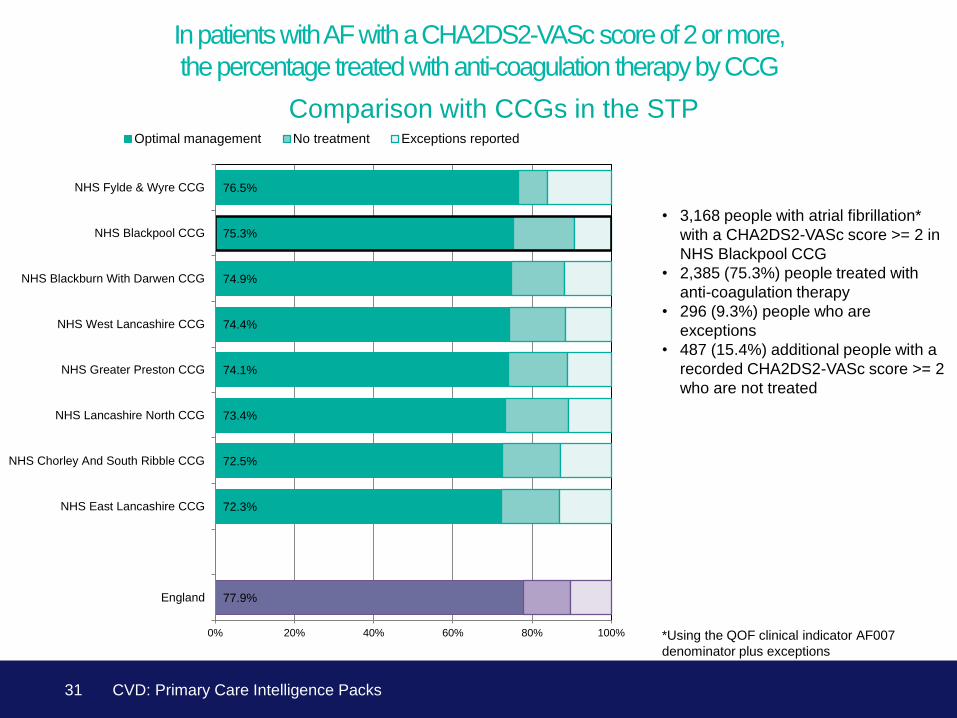
31
In patients with AF with a CHA2DS2-VASc score of 2 or more,
the percentage treated with anti-coagulation therapy by CCG
Comparison with CCGs in the STP
• 3,168 people with atrial fibrillation*
with a CHA2DS2-VASc score >= 2 in
NHS Blackpool CCG
• 2,385 (75.3%) people treated with
anti-coagulation therapy
• 296 (9.3%) people who are
exceptions
• 487 (15.4%) additional people with a
recorded CHA2DS2-VASc score >= 2
who are not treated
*Using the QOF clinical indicator AF007
denominator plus exceptions
CVD: Primary Care Intelligence Packs
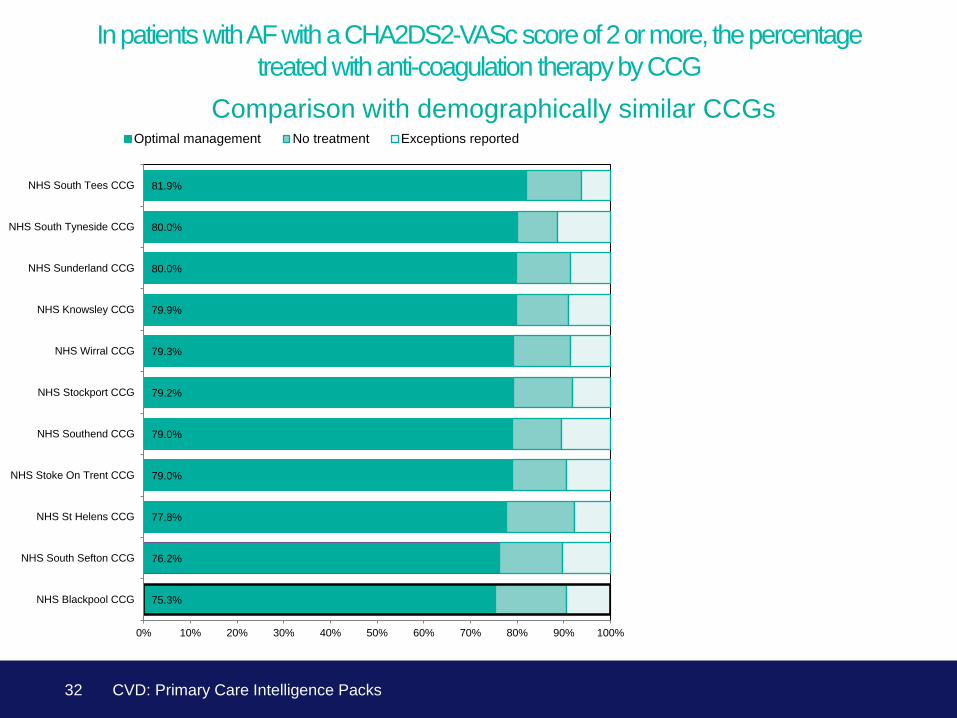
75.3%
76.2%
77.8%
79.0%
79.0%
79.2%
79.3%
79.9%
80.0%
80.0%
81.9%
0% 10% 20% 30% 40% 50% 60% 70% 80% 90% 100%
NHS Blackpool CCG
NHS South Sefton CCG
NHS St Helens CCG
NHS Stoke On Trent CCG
NHS Southend CCG
NHS Stockport CCG
NHS Wirral CCG
NHS Knowsley CCG
NHS Sunderland CCG
NHS South Tyneside CCG
NHS South Tees CCG
Optimal management No treatment Exceptions reported
32
In patients with AF with a CHA2DS2-VASc score of 2 or more, the percentage
treated with anti-coagulation therapy by CCG
Comparison with demographically similar CCGs
CVD: Primary Care Intelligence Packs

13
66
23
76
27
63
52
44
23
69
54
4
46
44
37
17
5
19
60
27
13
1
0% 10% 20% 30% 40% 50% 60% 70% 80% 90% 100%
SOUTH KING STREET MEDICAL CENTRE P81043
CLEVELEYS GROUP PRACTICE P81073
HARROWSIDE MEDICAL CENTRE P81684
GLENROYD MEDICAL CENTRE P81072
NEWTON DRIVE HEALTH CENTRE P81172
HIGHFIELD SURGERY P81074
THE CRESCENT SURGERY P81092
STONYHILL MEDICAL PRACTICE P81159
ARNOLD MEDICAL CENTRE P81081
NORTH SHORE SURGERY P81681
ADELAIDE STREET SURGERY P81042
THE SURGERY DINMORE P81713
WATERLOO MEDICAL CENTRE P81016
BLOOMFIELD MEDICAL CENTRE P81115
MARTON MEDICAL PRACTICE P81054
ELIZABETH STREET SURGERY P81004
GORTON MEDICAL CENTRE P81760
ABBEY DALE MEDICAL CENTRE P81714
ST PAULS MEDICAL CENTRE P81063
LAYTON MEDICAL CENTRE P81066
VICARAGE LANE SURGERY P81754
ASHFIELD MEDICAL CENTRE P81722
No treatment Exceptions reported
33
In patients with AF with a CHA2DS2-VASc score of 2 or more, the percentage treated
with anti-coagulation therapy by GP practice
• in total, including exceptions, there
are 783 people with a recorded
CHA2DS2-VASc score >= 2 who are
not treated
• GP practice range: 14.6% to 100.0%
CVD: Primary Care Intelligence Packs
7
14
30
3
9
8
17
20
21
2
9
17
23
9
17
6
18
10
1
-25%-20%-15%-10%-5%0%5%
VICARAGE LANE SURGERY
LAYTON MEDICAL CENTRE
ST PAULS MEDICAL CENTRE
GORTON MEDICAL CENTRE
ABBEY DALE MEDICAL CENTRE
ELIZABETH STREET SURGERY
MARTON MEDICAL PRACTICE
BLOOMFIELD MEDICAL CENTRE
WATERLOO MEDICAL CENTRE
THE SURGERY DINMORE
ARNOLD MEDICAL CENTRE
STONYHILL MEDICAL PRACTICE
NORTH SHORE SURGERY
NEWTON DRIVE HEALTH CENTRE
HIGHFIELD SURGERY
HARROWSIDE MEDICAL CENTRE
GLENROYD MEDICAL CENTRE
THE CRESCENT SURGERY
CLEVELEYS GROUP PRACTICE
SOUTH KING STREET MEDICAL CENTRE
34 34 CVD: Primary Care Intelligence Packs
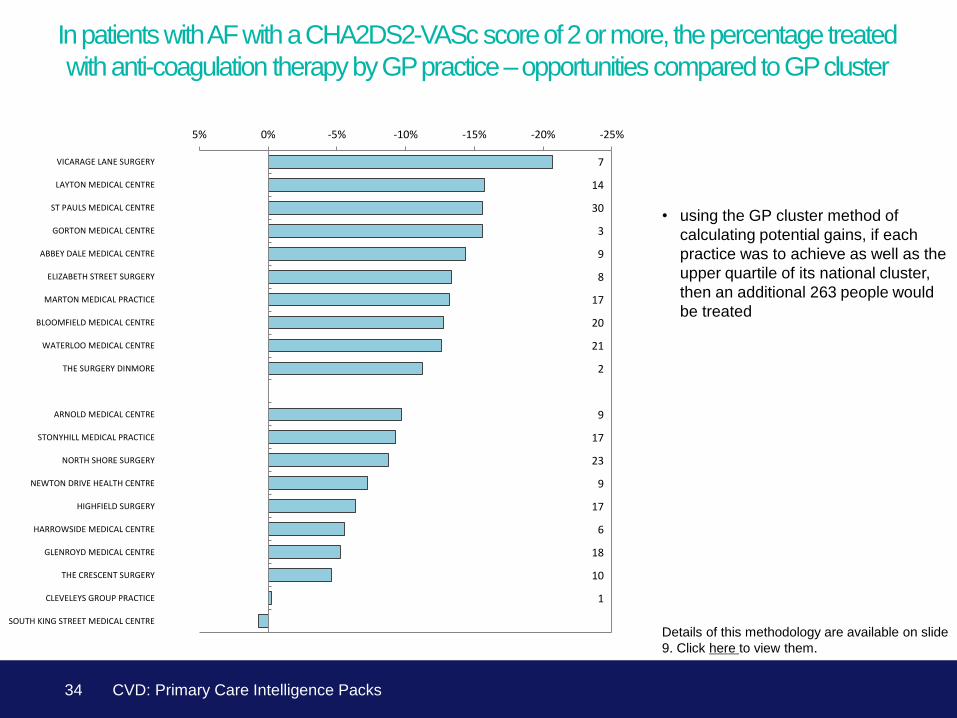
In patients with AF with a CHA2DS2-VASc score of 2 or more, the percentage treated
with anti-coagulation therapy by GP practice – opportunities compared to GP cluster
• using the GP cluster method of
calculating potential gains, if each
practice was to achieve as well as the
upper quartile of its national cluster,
then an additional 263 people would
be treated
Details of this methodology are available on slide
9. Click here to view them.
83.8%
81.0%
83.9%
84.0%
85.4%
85.7%
86.0%
86.6%
87.2%
0% 20% 40% 60% 80% 100%
England
NHS Lancashire North CCG
NHS Chorley And South Ribble CCG
NHS Blackpool CCG
NHS Greater Preston CCG
NHS East Lancashire CCG
NHS Fylde & Wyre CCG
NHS Blackburn With Darwen CCG
NHS West Lancashire CCG
Below 150/90 Not below 150/90 Exceptions reported
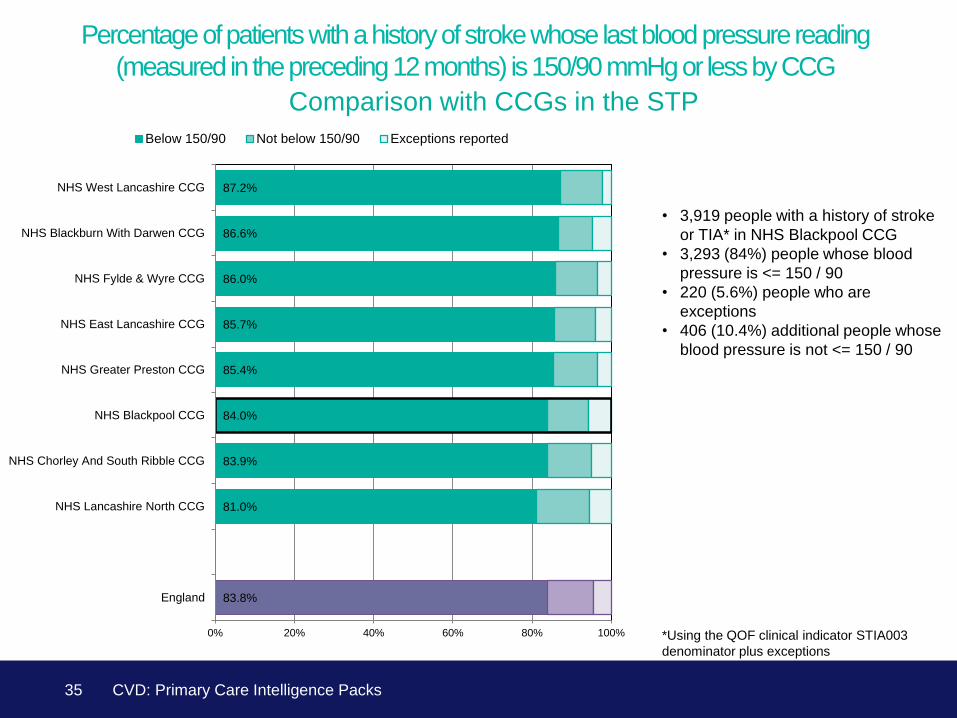
35
Percentage of patients with a history of stroke whose last blood pressure reading
(measured in the preceding 12 months) is 150/90 mmHg or less by CCG
Comparison with CCGs in the STP
*Using the QOF clinical indicator STIA003
denominator plus exceptions
• 3,919 people with a history of stroke
or TIA* in NHS Blackpool CCG
• 3,293 (84%) people whose blood
pressure is <= 150 / 90
• 220 (5.6%) people who are
exceptions
• 406 (10.4%) additional people whose
blood pressure is not <= 150 / 90
CVD: Primary Care Intelligence Packs
82.4%
82.5%
83.0%
83.2%
84.0%
84.2%
84.3%
84.9%
85.1%
86.3%
87.1%
0% 10% 20% 30% 40% 50% 60% 70% 80% 90% 100%
NHS South Sefton CCG
NHS Southend CCG
NHS Sunderland CCG
NHS South Tees CCG
NHS Blackpool CCG
NHS South Tyneside CCG
NHS Wirral CCG
NHS Stoke On Trent CCG
NHS St Helens CCG
NHS Knowsley CCG
NHS Stockport CCG
Below 150/90 Not below 150/90 Exceptions reported
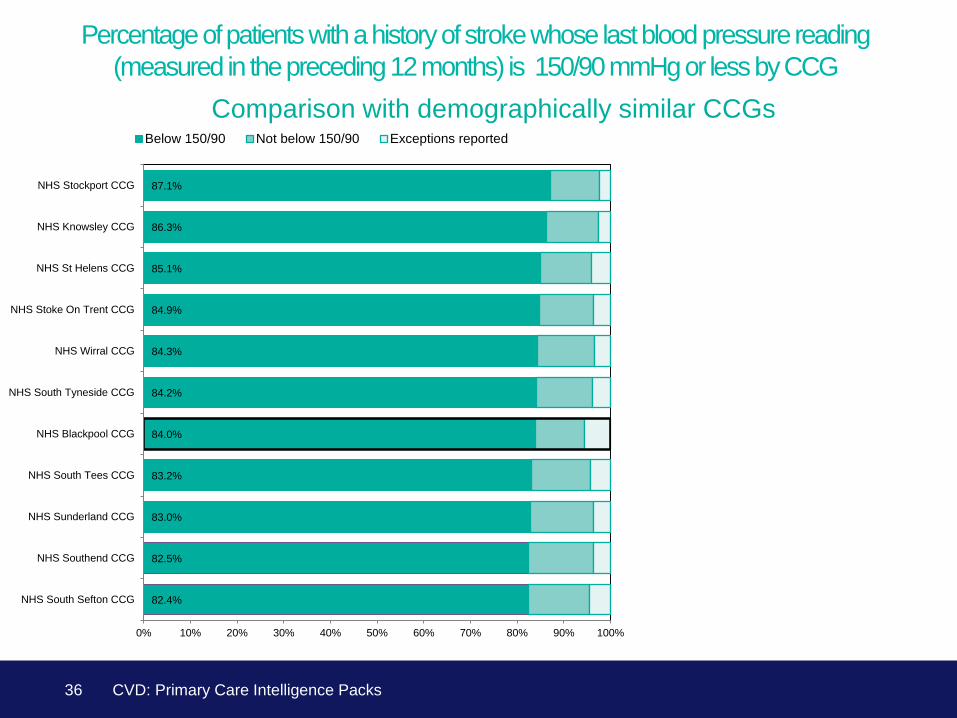
36
Percentage of patients with a history of stroke whose last blood pressure reading
(measured in the preceding 12 months) is 150/90 mmHg or less by CCG
Comparison with demographically similar CCGs
CVD: Primary Care Intelligence Packs
8
5
25
30
16
17
3
20
59
29
38
60
8
45
8
26
16
27
60
48
75
3
0% 10% 20% 30% 40% 50% 60% 70% 80% 90% 100%
ARNOLD MEDICAL CENTRE P81081
ELIZABETH STREET SURGERY P81004
ADELAIDE STREET SURGERY P81042
WATERLOO MEDICAL CENTRE P81016
MARTON MEDICAL PRACTICE P81054
LAYTON MEDICAL CENTRE P81066
THE SURGERY DINMORE P81713
NEWTON DRIVE HEALTH CENTRE P81172
CLEVELEYS GROUP PRACTICE P81073
STONYHILL MEDICAL PRACTICE P81159
ST PAULS MEDICAL CENTRE P81063
GLENROYD MEDICAL CENTRE P81072
VICARAGE LANE SURGERY P81754
THE CRESCENT SURGERY P81092
GORTON MEDICAL CENTRE P81760
HARROWSIDE MEDICAL CENTRE P81684
ABBEY DALE MEDICAL CENTRE P81714
SOUTH KING STREET MEDICAL CENTRE P81043
HIGHFIELD SURGERY P81074
BLOOMFIELD MEDICAL CENTRE P81115
NORTH SHORE SURGERY P81681
ASHFIELD MEDICAL CENTRE P81722
No treatment Exceptions reported
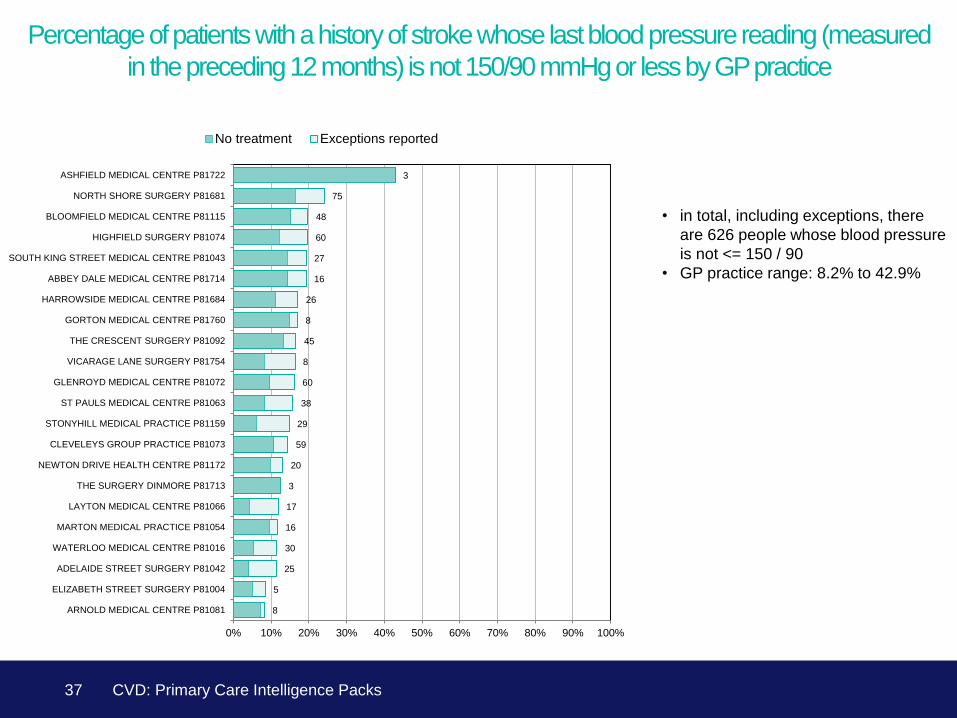
37
Percentage of patients with a history of stroke whose last blood pressure reading (measured
in the preceding 12 months) is not 150/90 mmHg or less by GP practice
• in total, including exceptions, there
are 626 people whose blood pressure
is not <= 150 / 90
• GP practice range: 8.2% to 42.9%
CVD: Primary Care Intelligence Packs
91.8%
89.6%
90.1%
90.1%
90.6%
90.9%
91.7%
92.2%
93.5%
0% 20% 40% 60% 80% 100%
England
NHS Blackpool CCG
NHS Lancashire North CCG
NHS Fylde & Wyre CCG
NHS Chorley And South Ribble CCG
NHS East Lancashire CCG
NHS Blackburn With Darwen CCG
NHS West Lancashire CCG
NHS Greater Preston CCG
Below 150/90 Not below 150/90 Exceptions reported
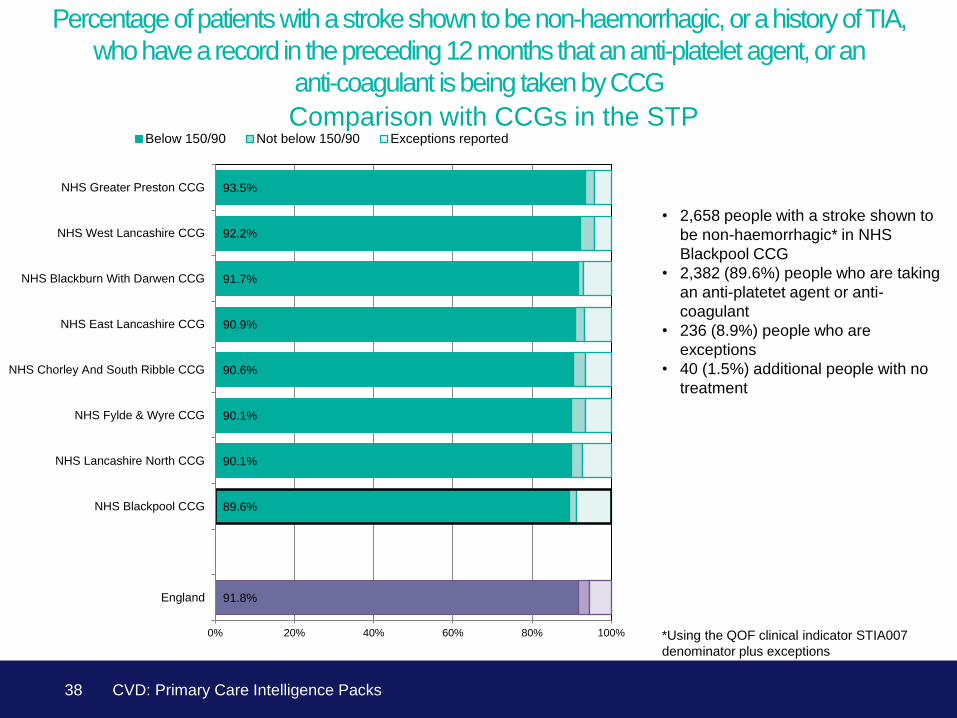
38
Percentage of patients with a stroke shown to be non-haemorrhagic, or a history of TIA,
who have a record in the preceding 12 months that an anti-platelet agent, or an
anti-coagulant is being taken by CCG
Comparison with CCGs in the STP
*Using the QOF clinical indicator STIA007
denominator plus exceptions
CVD: Primary Care Intelligence Packs
• 2,658 people with a stroke shown to
be non-haemorrhagic* in NHS
Blackpool CCG
• 2,382 (89.6%) people who are taking
an anti-platetet agent or anti-
coagulant
• 236 (8.9%) people who are
exceptions
• 40 (1.5%) additional people with no
treatment
89.6%
89.7%
90.0%
91.6%
92.2%
92.6%
92.9%
92.9%
93.2%
93.5%
93.7%
0% 10% 20% 30% 40% 50% 60% 70% 80% 90% 100%
NHS Blackpool CCG
NHS Wirral CCG
NHS St Helens CCG
NHS Southend CCG
NHS Stoke On Trent CCG
NHS South Sefton CCG
NHS Knowsley CCG
NHS South Tees CCG
NHS Sunderland CCG
NHS South Tyneside CCG
NHS Stockport CCG
Below 150/90 Not below 150/90 Exceptions reported
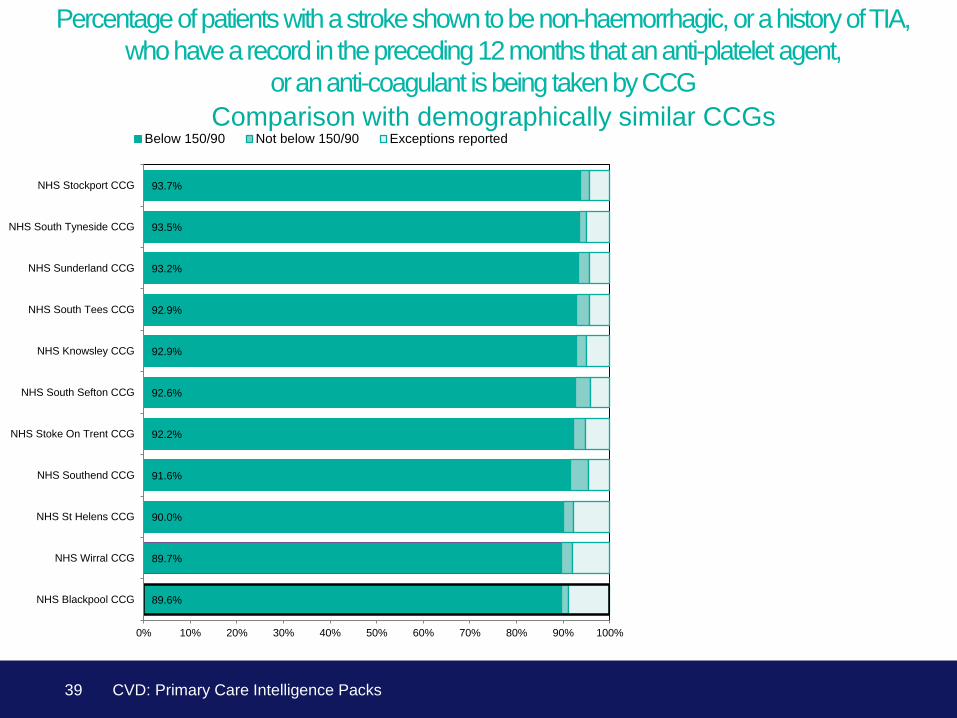
39
Percentage of patients with a stroke shown to be non-haemorrhagic, or a history of TIA,
who have a record in the preceding 12 months that an anti-platelet agent,
or an anti-coagulant is being taken by CCG
Comparison with demographically similar CCGs
CVD: Primary Care Intelligence Packs
8
5
5
8
3
27
11
20
27
14
10
17
20
21
25
13
13
6
22
1
0% 10% 20% 30% 40% 50% 60% 70% 80% 90% 100%
GORTON MEDICAL CENTRE P81760
THE SURGERY DINMORE P81713
ADELAIDE STREET SURGERY P81042
ARNOLD MEDICAL CENTRE P81081
ABBEY DALE MEDICAL CENTRE P81714
LAYTON MEDICAL CENTRE P81066
ELIZABETH STREET SURGERY P81004
GLENROYD MEDICAL CENTRE P81072
STONYHILL MEDICAL PRACTICE P81159
THE CRESCENT SURGERY P81092
CLEVELEYS GROUP PRACTICE P81073
BLOOMFIELD MEDICAL CENTRE P81115
SOUTH KING STREET MEDICAL CENTRE P81043
WATERLOO MEDICAL CENTRE P81016
ST PAULS MEDICAL CENTRE P81063
HIGHFIELD SURGERY P81074
NORTH SHORE SURGERY P81681
NEWTON DRIVE HEALTH CENTRE P81172
MARTON MEDICAL PRACTICE P81054
VICARAGE LANE SURGERY P81754
HARROWSIDE MEDICAL CENTRE P81684
ASHFIELD MEDICAL CENTRE P81722
No treatment Exceptions reported
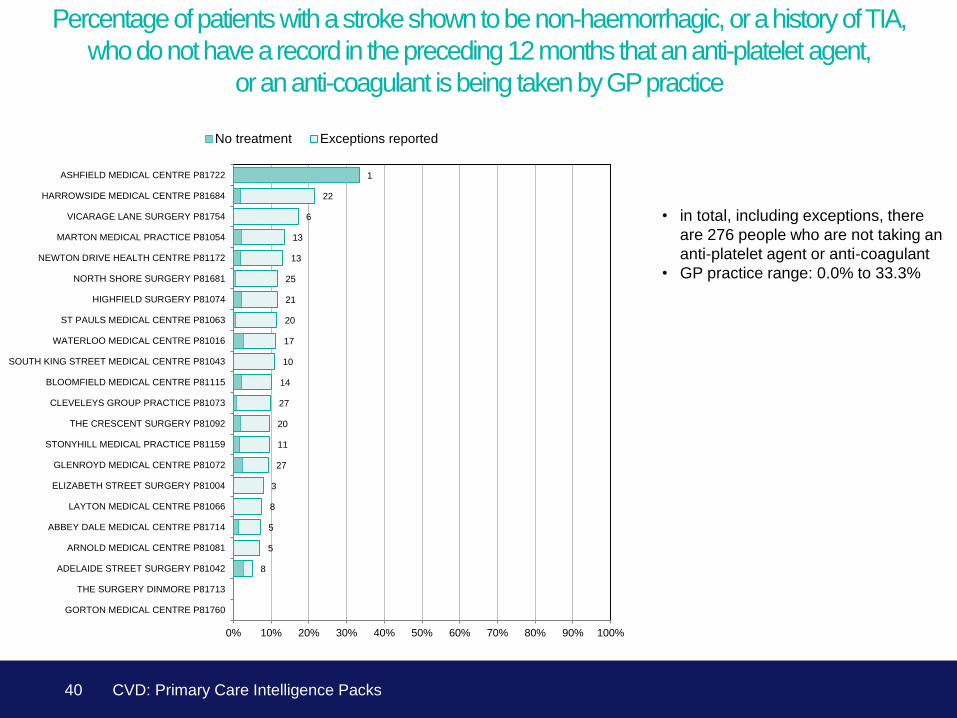
40
Percentage of patients with a stroke shown to be non-haemorrhagic, or a history of TIA,
who do not have a record in the preceding 12 months that an anti-platelet agent,
or an anti-coagulant is being taken by GP practice
CVD: Primary Care Intelligence Packs
• in total, including exceptions, there
are 276 people who are not taking an
anti-platelet agent or anti-coagulant
• GP practice range: 0.0% to 33.3%
Diabetes
41 CVD: Primary Care Intelligence Packs
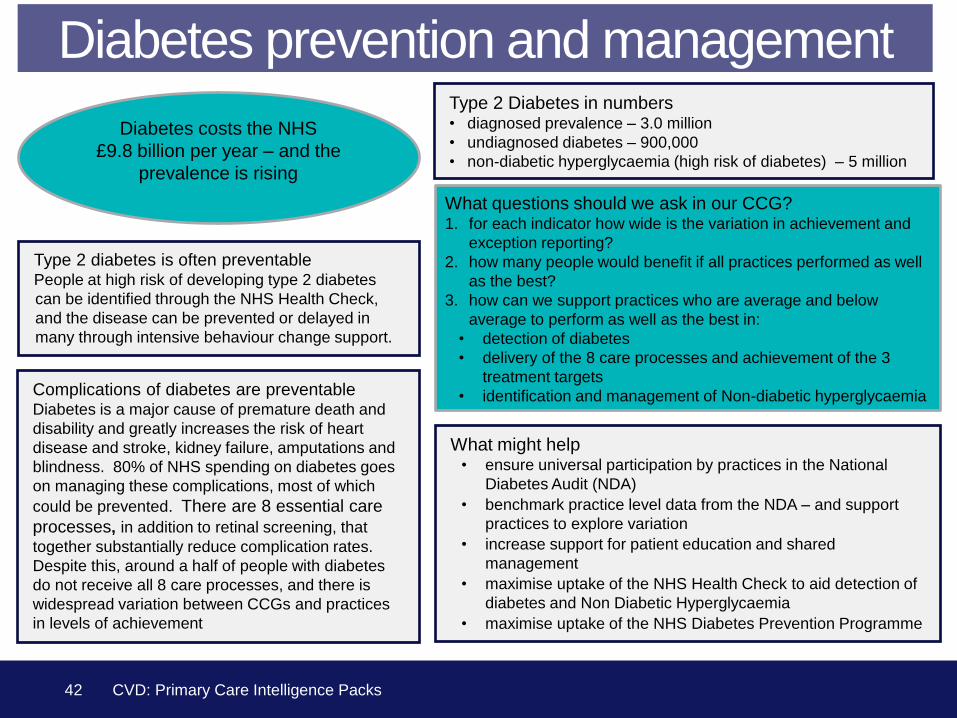
Type 2 Diabetes in numbers • diagnosed prevalence – 3.0 million
• undiagnosed diabetes – 900,000
• non-diabetic hyperglycaemia (high risk of diabetes) – 5 million
What might help • ensure universal participation by practices in the National
Diabetes Audit (NDA)
• benchmark practice level data from the NDA – and support
practices to explore variation
• increase support for patient education and shared
management
• maximise uptake of the NHS Health Check to aid detection of
diabetes and Non Diabetic Hyperglycaemia
• maximise uptake of the NHS Diabetes Prevention Programme
What questions should we ask in our CCG? 1. for each indicator how wide is the variation in achievement and
exception reporting?
2. how many people would benefit if all practices performed as well
as the best?
3. how can we support practices who are average and below
average to perform as well as the best in:
• detection of diabetes
• delivery of the 8 care processes and achievement of the 3
treatment targets
• identification and management of Non-diabetic hyperglycaemia
Type 2 diabetes is often preventable People at high risk of developing type 2 diabetes
can be identified through the NHS Health Check,
and the disease can be prevented or delayed in
many through intensive behaviour change support.
Complications of diabetes are preventable Diabetes is a major cause of premature death and
disability and greatly increases the risk of heart
disease and stroke, kidney failure, amputations and
blindness. 80% of NHS spending on diabetes goes
on managing these complications, most of which
could be prevented. There are 8 essential care
processes, in addition to retinal screening, that
together substantially reduce complication rates.
Despite this, around a half of people with diabetes
do not receive all 8 care processes, and there is
widespread variation between CCGs and practices
in levels of achievement
Diabetes prevention and management
42 CVD: Primary Care Intelligence Packs
Diabetes costs the NHS
£9.8 billion per year – and the
prevalence is rising

0.77
0.75
0.77
0.78
0.80
0.81
0.83
0.85
0.85
0.0 0.1 0.2 0.3 0.4 0.5 0.6 0.7 0.8 0.9
England
NHS Fylde & Wyre CCG
NHS Greater Preston CCG
NHS East Lancashire CCG
NHS Blackpool CCG
NHS West Lancashire CCG
NHS Chorley And South Ribble CCG
NHS Lancashire North CCG
NHS Blackburn With Darwen CCG
0.77
0.75
0.77
0.78
0.80
0.81
0.83
0.85
0.85
0.0 0.1 0.2 0.3 0.4 0.5 0.6 0.7 0.8 0.9
England
NHS Fylde & Wyre CCG
NHS Greater Preston CCG
NHS East Lancashire CCG
NHS Blackpool CCG
NHS West Lancashire CCG
NHS Chorley And South Ribble CCG
NHS Lancashire North CCG
NHS Blackburn With Darwen CCG
43
Diabetes observed prevalence compared with expected prevalence by CCG
Comparison with CCGs in the STP
CVD: Primary Care Intelligence Packs
Note: This slide compares the prevalence of
Diabetes recorded in QOF in 2015/16 to the
expected prevalence of Diabetes in 2016 taken
from the NCVIN diabetes prevalence model
produced in 2015.
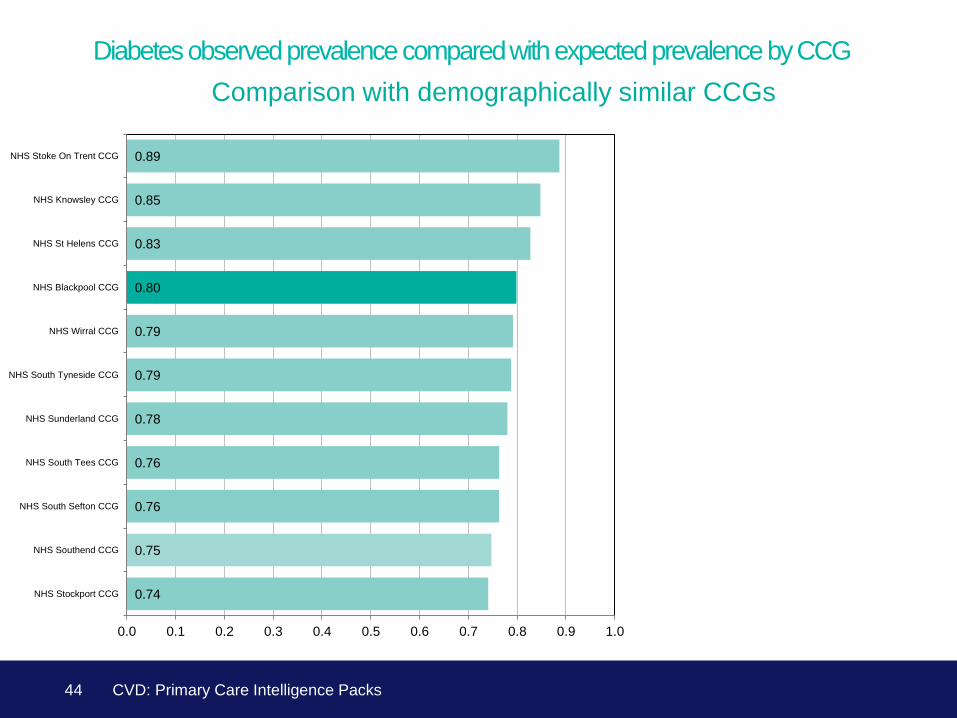
• 0.80 ratio of observed to expected
diabetes prevalence in NHS
Blackpool CCG, compared to 0.77 in
England
• this suggests 80% of people have
been diagnosed
0.74
0.75
0.76
0.76
0.78
0.79
0.79
0.80
0.83
0.85
0.89
0.0 0.1 0.2 0.3 0.4 0.5 0.6 0.7 0.8 0.9 1.0
NHS Stockport CCG
NHS Southend CCG
NHS South Sefton CCG
NHS South Tees CCG
NHS Sunderland CCG
NHS South Tyneside CCG
NHS Wirral CCG
NHS Blackpool CCG
NHS St Helens CCG
NHS Knowsley CCG
NHS Stoke On Trent CCG
44
Diabetes observed prevalence compared with expected prevalence by CCG
Comparison with demographically similar CCGs
CVD: Primary Care Intelligence Packs
3.7%
6.0%
6.1%
6.2%
6.3%
6.7%
7.2%
7.2%
7.3%
7.3%
7.4%
7.5%
7.6%
7.7%
7.7%
7.8%
7.9%
8.1%
8.2%
8.4%
8.6%
9.1%
0% 1% 2% 3% 4% 5% 6% 7% 8% 9% 10%
ASHFIELD MEDICAL CENTRE P81722
THE SURGERY DINMORE P81713
GORTON MEDICAL CENTRE P81760
ARNOLD MEDICAL CENTRE P81081
NEWTON DRIVE HEALTH CENTRE P81172
MARTON MEDICAL PRACTICE P81054
BLOOMFIELD MEDICAL CENTRE P81115
ABBEY DALE MEDICAL CENTRE P81714
VICARAGE LANE SURGERY P81754
STONYHILL MEDICAL PRACTICE P81159
SOUTH KING STREET MEDICAL CENTRE P81043
GLENROYD MEDICAL CENTRE P81072
LAYTON MEDICAL CENTRE P81066
NORTH SHORE SURGERY P81681
ADELAIDE STREET SURGERY P81042
ELIZABETH STREET SURGERY P81004
WATERLOO MEDICAL CENTRE P81016
HARROWSIDE MEDICAL CENTRE P81684
HIGHFIELD SURGERY P81074
ST PAULS MEDICAL CENTRE P81063
THE CRESCENT SURGERY P81092
CLEVELEYS GROUP PRACTICE P81073
GP practice CCG
45
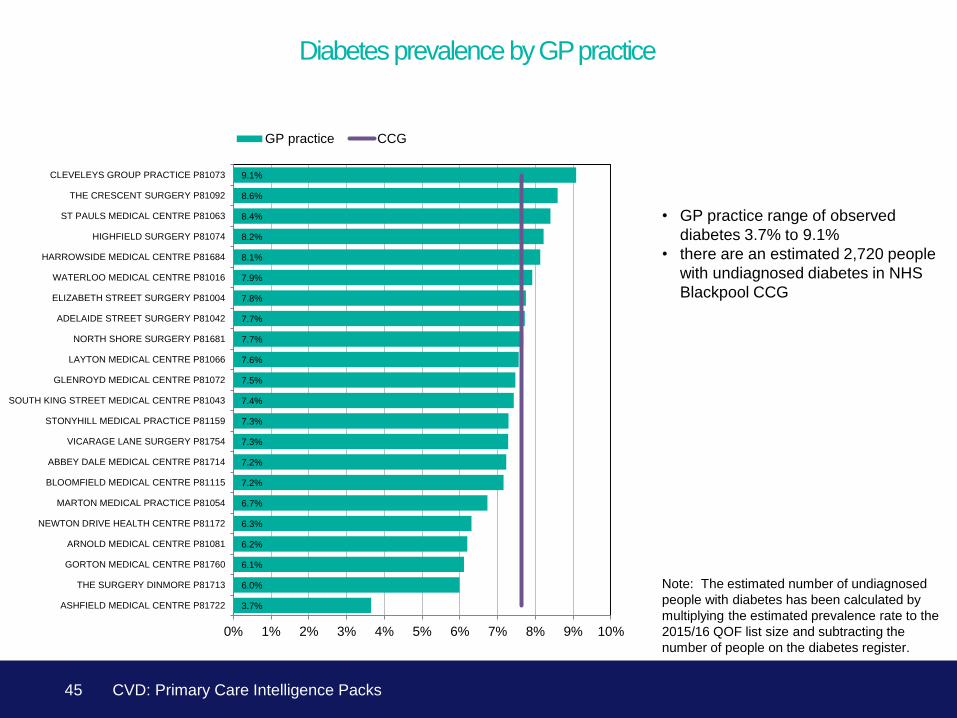
Diabetes prevalence by GP practice
• GP practice range of observed
diabetes 3.7% to 9.1%
• there are an estimated 2,720 people
with undiagnosed diabetes in NHS
Blackpool CCG
CVD: Primary Care Intelligence Packs
Note: The estimated number of undiagnosed
people with diabetes has been calculated by
multiplying the estimated prevalence rate to the
2015/16 QOF list size and subtracting the
number of people on the diabetes register.

6.5%
6.8%
6.9%
6.5%
6.8%
7.1%
8.2%
7.6%
7.1%
1.9%
1.2%
1.4%
1.9%
1.6%
2.0%
1.4%
1.9%
2.4%
11.2%
10.8%
11.0%
11.1%
11.3%
11.4%
11.7%
11.9%
12.8%
0% 5% 10% 15% 20% 25%
England
NHS Lancashire North CCG
NHS Chorley And South Ribble CCG
NHS Greater Preston CCG
NHS West Lancashire CCG
NHS East Lancashire CCG
NHS Blackburn With Darwen CCG
NHS Blackpool CCG
NHS Fylde & Wyre CCG
Diabetes prevalence Undiagnosed diabetes prevalence
Expected non-diabetic hyperglycaemia prevalence
6.5%
6.8%
6.9%
6.5%
6.8%
7.1%
8.2%
7.6%
7.1%
1.9%
1.2%
1.4%
1.9%
1.6%
2.0%
1.4%
1.9%
2.4%
11.2%
10.8%
11.0%
11.1%
11.3%
11.4%
11.7%
11.9%
12.8%
0% 5% 10% 15% 20% 25%
England
NHS Lancashire North CCG
NHS Chorley And South Ribble CCG
NHS Greater Preston CCG
NHS West Lancashire CCG
NHS East Lancashire CCG
NHS Blackburn With Darwen CCG
NHS Blackpool CCG
NHS Fylde & Wyre CCG
Diabetes prevalence Undiagnosed diabetes prevalence
Expected non-diabetic hyperglycaemia prevalence
46
Expected total prevalence of diabetes and non-diabetic hyperglycaemia
• the estimated total prevalence of
diabetes in NHS Blackpool CCG is
9.5% (diagnosed and undiagnosed)
• in addition, there are an estimated
11.9% of people in NHS Blackpool
CCG who are at increased risk of
developing diabetes (i.e. with non-
diabetic hyperglycaemia)
Note: Prevalence estimates of non-diabetic
hyperglycaemia were developed using Health
Survey for England (HSE) data. Five years of
HSE data were combined, 2009- 2013. The
estimates take into account the age, ethnic group
and estimated body mass index of the population.
These estimates were produced using the GP
registered population.
CVD: Primary Care Intelligence Packs
• this means that 21.5% of the
population in NHS Blackpool CCG
are estimated to have diabetes, or at
high risk of developing of diabetes
52.6%
34.2%
45.4%
49.6%
50.2%
53.3%
56.5%
61.1%
61.3%
0% 10% 20% 30% 40% 50% 60% 70%
England
NHS West Lancashire CCG
NHS Greater Preston CCG
NHS Chorley And South Ribble CCG
NHS East Lancashire CCG
NHS Blackpool CCG
NHS Lancashire North CCG
NHS Fylde & Wyre CCG
NHS Blackburn With Darwen CCG
52.6%
34.2%
45.4%
49.6%
50.2%
53.3%
56.5%
61.1%
61.3%
0% 10% 20% 30% 40% 50% 60% 70%
England
NHS West Lancashire CCG
NHS Greater Preston CCG
NHS Chorley And South Ribble CCG
NHS East Lancashire CCG
NHS Blackpool CCG
NHS Lancashire North CCG
NHS Fylde & Wyre CCG
NHS Blackburn With Darwen CCG
47
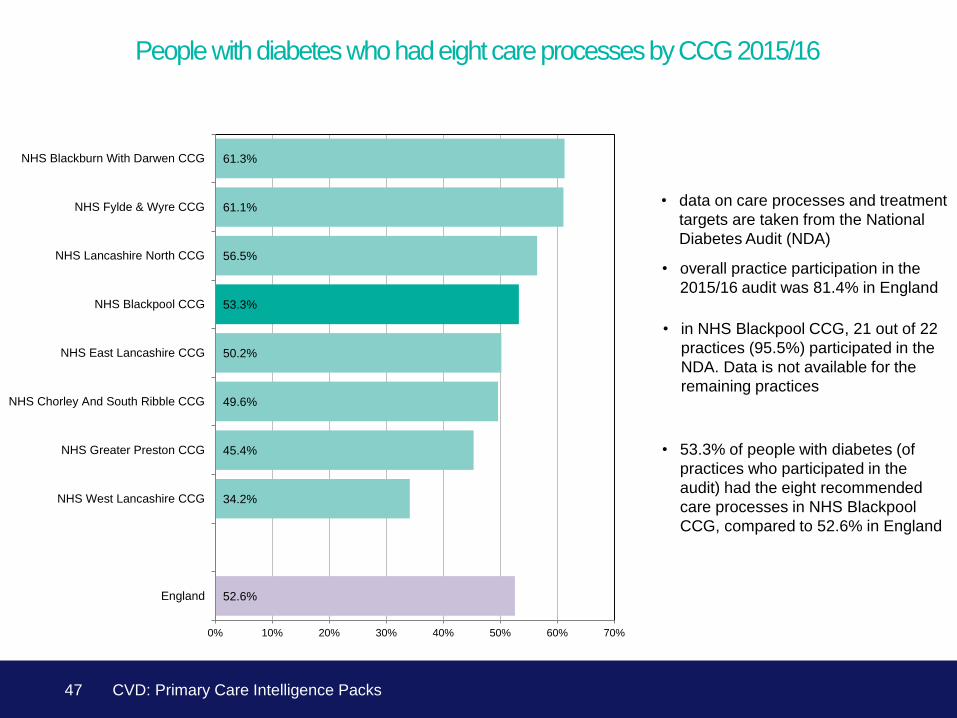
People with diabetes who had eight care processes by CCG 2015/16
• overall practice participation in the
2015/16 audit was 81.4% in England
• data on care processes and treatment
targets are taken from the National
Diabetes Audit (NDA)
• in NHS Blackpool CCG, 21 out of 22
practices (95.5%) participated in the
NDA. Data is not available for the
remaining practices
CVD: Primary Care Intelligence Packs
• 53.3% of people with diabetes (of
practices who participated in the
audit) had the eight recommended
care processes in NHS Blackpool
CCG, compared to 52.6% in England

21.5%
25.4%
32.7%
39.3%
42.4%
42.5%
45.1%
48.2%
49.7%
50.0%
52.0%
52.6%
54.3%
56.0%
58.9%
61.1%
64.9%
68.2%
69.1%
71.4%
100.0%
0% 10% 20% 30% 40% 50% 60% 70% 80% 90% 100%
ASHFIELD MEDICAL CENTRE P81722
MARTON MEDICAL PRACTICE P81054
VICARAGE LANE SURGERY P81754
SOUTH KING STREET MEDICAL CENTRE P81043
BLOOMFIELD MEDICAL CENTRE P81115
ARNOLD MEDICAL CENTRE P81081
ABBEY DALE MEDICAL CENTRE P81714
THE CRESCENT SURGERY P81092
GORTON MEDICAL CENTRE P81760
HARROWSIDE MEDICAL CENTRE P81684
GLENROYD MEDICAL CENTRE P81072
STONYHILL MEDICAL PRACTICE P81159
ELIZABETH STREET SURGERY P81004
ST PAULS MEDICAL CENTRE P81063
LAYTON MEDICAL CENTRE P81066
THE SURGERY DINMORE P81713
ADELAIDE STREET SURGERY P81042
WATERLOO MEDICAL CENTRE P81016
CLEVELEYS GROUP PRACTICE P81073
NEWTON DRIVE HEALTH CENTRE P81172
HIGHFIELD SURGERY P81074
NORTH SHORE SURGERY P81681
GP practice Average of practices in the CCG who participated in the audit
48
People with diabetes who had eight care processes by GP practice, 2015/16
CVD: Primary Care Intelligence Packs
• achievement - 8 care processes: in
practices who provided data via the
NDA, between 21.5% and 100.0% of
patients received all 8 care processes
• at least 4,619 people did not receive
the eight care processes
39.0%
39.5%
39.9%
41.6%
41.6%
43.2%
43.2%
44.0%
44.8%
0% 5% 10% 15% 20% 25% 30% 35% 40% 45% 50%
England
NHS East Lancashire CCG
NHS Blackburn With Darwen CCG
NHS Lancashire North CCG
NHS Fylde & Wyre CCG
NHS West Lancashire CCG
NHS Greater Preston CCG
NHS Blackpool CCG
NHS Chorley And South Ribble CCG
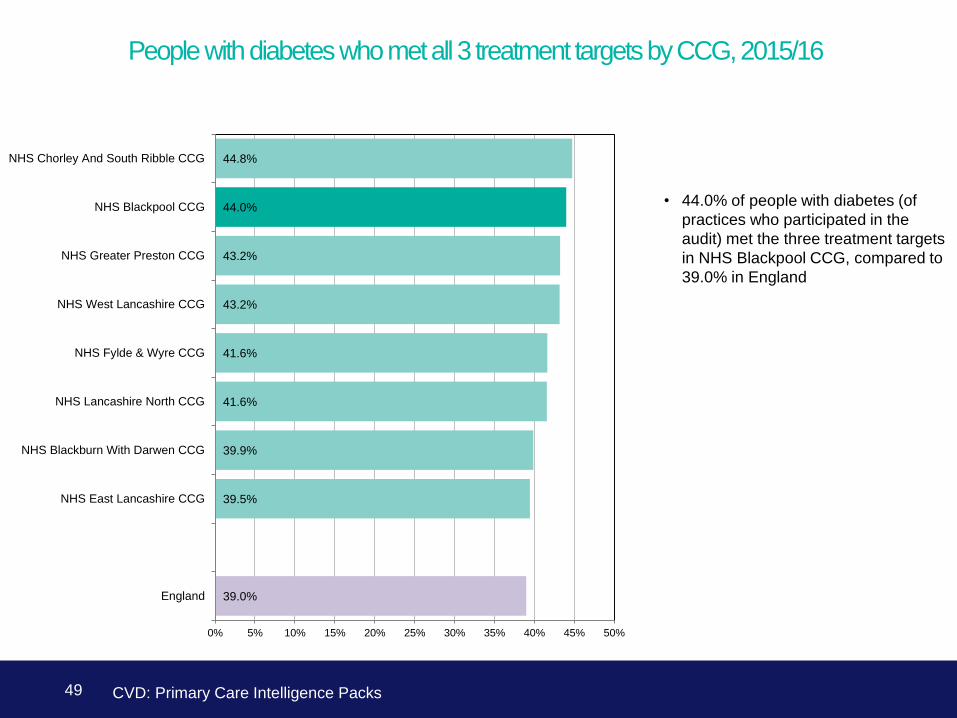
49
People with diabetes who met all 3 treatment targets by CCG, 2015/16
CVD: Primary Care Intelligence Packs
• 44.0% of people with diabetes (of
practices who participated in the
audit) met the three treatment targets
in NHS Blackpool CCG, compared to
39.0% in England
36.0%
36.7%
37.4%
37.6%
37.9%
37.9%
40.0%
41.3%
42.0%
42.2%
42.2%
43.2%
46.2%
46.9%
47.1%
47.6%
48.4%
50.0%
50.8%
54.0%
59.0%
0% 10% 20% 30% 40% 50% 60% 70% 80% 90% 100%
ASHFIELD MEDICAL CENTRE P81722
BLOOMFIELD MEDICAL CENTRE P81115
VICARAGE LANE SURGERY P81754
ABBEY DALE MEDICAL CENTRE P81714
SOUTH KING STREET MEDICAL CENTRE P81043
ST PAULS MEDICAL CENTRE P81063
NEWTON DRIVE HEALTH CENTRE P81172
GORTON MEDICAL CENTRE P81760
GLENROYD MEDICAL CENTRE P81072
LAYTON MEDICAL CENTRE P81066
ELIZABETH STREET SURGERY P81004
ADELAIDE STREET SURGERY P81042
HARROWSIDE MEDICAL CENTRE P81684
WATERLOO MEDICAL CENTRE P81016
STONYHILL MEDICAL PRACTICE P81159
THE CRESCENT SURGERY P81092
HIGHFIELD SURGERY P81074
ARNOLD MEDICAL CENTRE P81081
NORTH SHORE SURGERY P81681
MARTON MEDICAL PRACTICE P81054
CLEVELEYS GROUP PRACTICE P81073
THE SURGERY DINMORE P81713
GP practice Average of practices in the CCG who participated in the audit
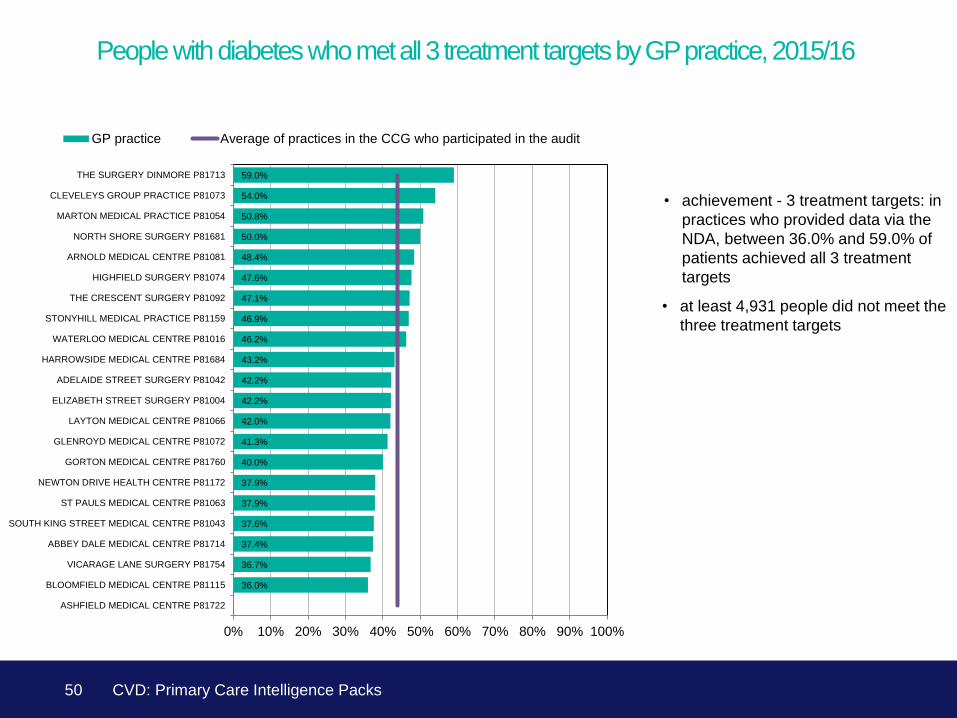
50
People with diabetes who met all 3 treatment targets by GP practice, 2015/16
CVD: Primary Care Intelligence Packs
• achievement - 3 treatment targets: in
practices who provided data via the
NDA, between 36.0% and 59.0% of
patients achieved all 3 treatment
targets
• at least 4,931 people did not meet the
three treatment targets
21
32
66
56
11
29
19
9
20
5
7
2
-15%-10%-5%0%5%10%15%
ABBEY DALE MEDICAL CENTRE
SOUTH KING STREET MEDICAL CENTRE
ST PAULS MEDICAL CENTRE
BLOOMFIELD MEDICAL CENTRE
VICARAGE LANE SURGERY
NEWTON DRIVE HEALTH CENTRE
LAYTON MEDICAL CENTRE
ELIZABETH STREET SURGERY
ADELAIDE STREET SURGERY
GORTON MEDICAL CENTRE
HARROWSIDE MEDICAL CENTRE
STONYHILL MEDICAL PRACTICE
WATERLOO MEDICAL CENTRE
ARNOLD MEDICAL CENTRE
THE CRESCENT SURGERY
MARTON MEDICAL PRACTICE
HIGHFIELD SURGERY
NORTH SHORE SURGERY
CLEVELEYS GROUP PRACTICE
THE SURGERY DINMORE
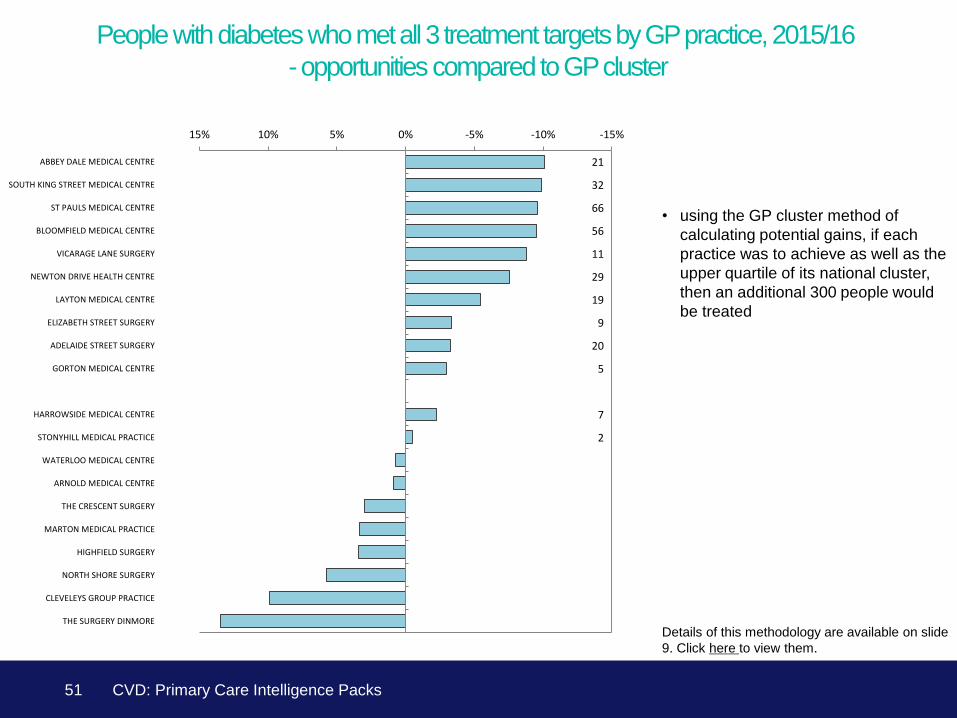
51
People with diabetes who met all 3 treatment targets by GP practice, 2015/16
- opportunities compared to GP cluster
CVD: Primary Care Intelligence Packs
• using the GP cluster method of
calculating potential gains, if each
practice was to achieve as well as the
upper quartile of its national cluster,
then an additional 300 people would
be treated
Details of this methodology are available on slide
9. Click here to view them.

Kidney
52 CVD: Primary Care Intelligence Packs
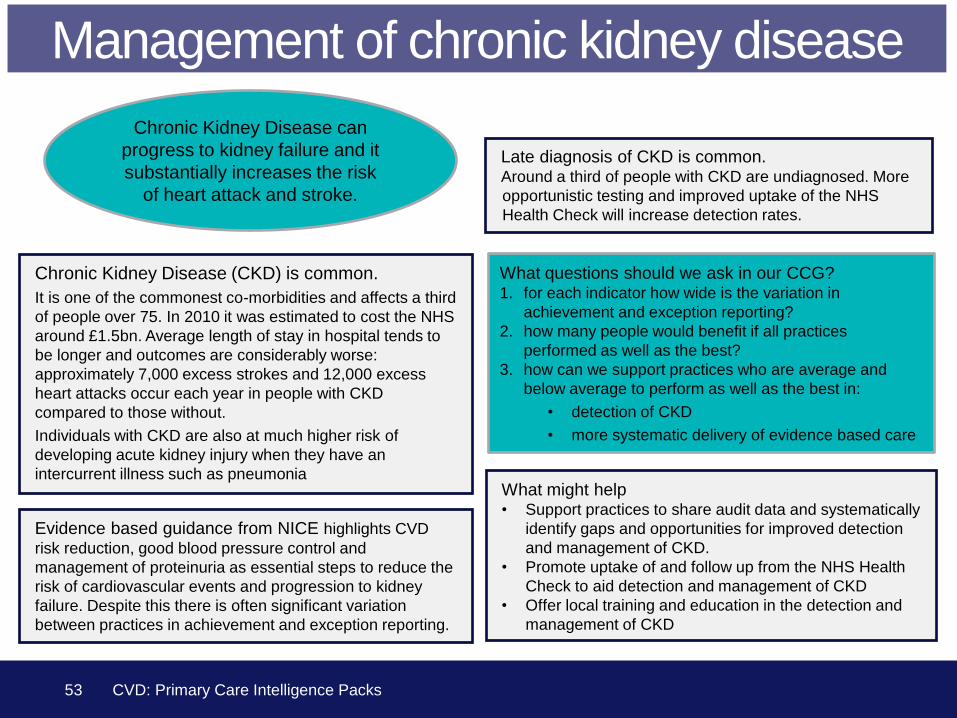
Chronic Kidney Disease can
progress to kidney failure and it
substantially increases the risk
of heart attack and stroke.
Chronic Kidney Disease (CKD) is common.
It is one of the commonest co-morbidities and affects a third
of people over 75. In 2010 it was estimated to cost the NHS
around £1.5bn. Average length of stay in hospital tends to
be longer and outcomes are considerably worse:
approximately 7,000 excess strokes and 12,000 excess
heart attacks occur each year in people with CKD
compared to those without.
Individuals with CKD are also at much higher risk of
developing acute kidney injury when they have an
intercurrent illness such as pneumonia What might help • Support practices to share audit data and systematically
identify gaps and opportunities for improved detection
and management of CKD.
• Promote uptake of and follow up from the NHS Health
Check to aid detection and management of CKD
• Offer local training and education in the detection and
management of CKD
What questions should we ask in our CCG? 1. for each indicator how wide is the variation in
achievement and exception reporting?
2. how many people would benefit if all practices
performed as well as the best?
3. how can we support practices who are average and
below average to perform as well as the best in:
• detection of CKD
• more systematic delivery of evidence based care
Late diagnosis of CKD is common. Around a third of people with CKD are undiagnosed. More
opportunistic testing and improved uptake of the NHS
Health Check will increase detection rates.
Evidence based guidance from NICE highlights CVD
risk reduction, good blood pressure control and
management of proteinuria as essential steps to reduce the
risk of cardiovascular events and progression to kidney
failure. Despite this there is often significant variation
between practices in achievement and exception reporting.
Management of chronic kidney disease
53 CVD: Primary Care Intelligence Packs
0.68
0.59
0.65
0.70
0.79
0.84
0.85
1.02
1.17
0.0 0.2 0.4 0.6 0.8 1.0 1.2 1.4
England
NHS East Lancashire CCG
NHS Blackburn With Darwen CCG
NHS West Lancashire CCG
NHS Lancashire North CCG
NHS Greater Preston CCG
NHS Fylde & Wyre CCG
NHS Chorley And South Ribble CCG
NHS Blackpool CCG
Ratio
0.68
0.59
0.65
0.70
0.79
0.84
0.85
1.02
1.17
0.0 0.2 0.4 0.6 0.8 1.0 1.2 1.4
England
NHS East Lancashire CCG
NHS Blackburn With Darwen CCG
NHS West Lancashire CCG
NHS Lancashire North CCG
NHS Greater Preston CCG
NHS Fylde & Wyre CCG
NHS Chorley And South Ribble CCG
NHS Blackpool CCG
Ratio
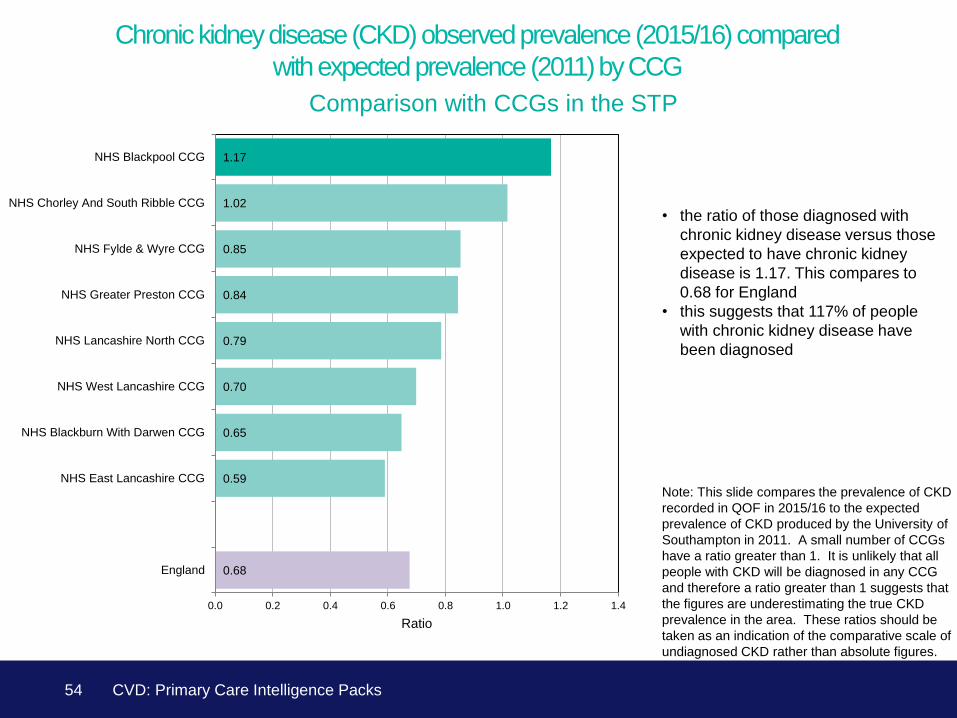
54
Chronic kidney disease (CKD) observed prevalence (2015/16) compared
with expected prevalence (2011) by CCG
Comparison with CCGs in the STP
Note: This slide compares the prevalence of CKD
recorded in QOF in 2015/16 to the expected
prevalence of CKD produced by the University of
Southampton in 2011. A small number of CCGs
have a ratio greater than 1. It is unlikely that all
people with CKD will be diagnosed in any CCG
and therefore a ratio greater than 1 suggests that
the figures are underestimating the true CKD
prevalence in the area. These ratios should be
taken as an indication of the comparative scale of
undiagnosed CKD rather than absolute figures.
• the ratio of those diagnosed with
chronic kidney disease versus those
expected to have chronic kidney
disease is 1.17. This compares to
0.68 for England
• this suggests that 117% of people
with chronic kidney disease have
been diagnosed
CVD: Primary Care Intelligence Packs
0.47
0.53
0.58
0.59
0.66
0.68
0.68
0.71
0.78
0.90
1.17
0.0 0.2 0.4 0.6 0.8 1.0 1.2 1.4
NHS Stockport CCG
NHS Southend CCG
NHS South Tyneside CCG
NHS South Tees CCG
NHS Stoke On Trent CCG
NHS St Helens CCG
NHS Sunderland CCG
NHS Wirral CCG
NHS Knowsley CCG
NHS South Sefton CCG
NHS Blackpool CCG
Ratio
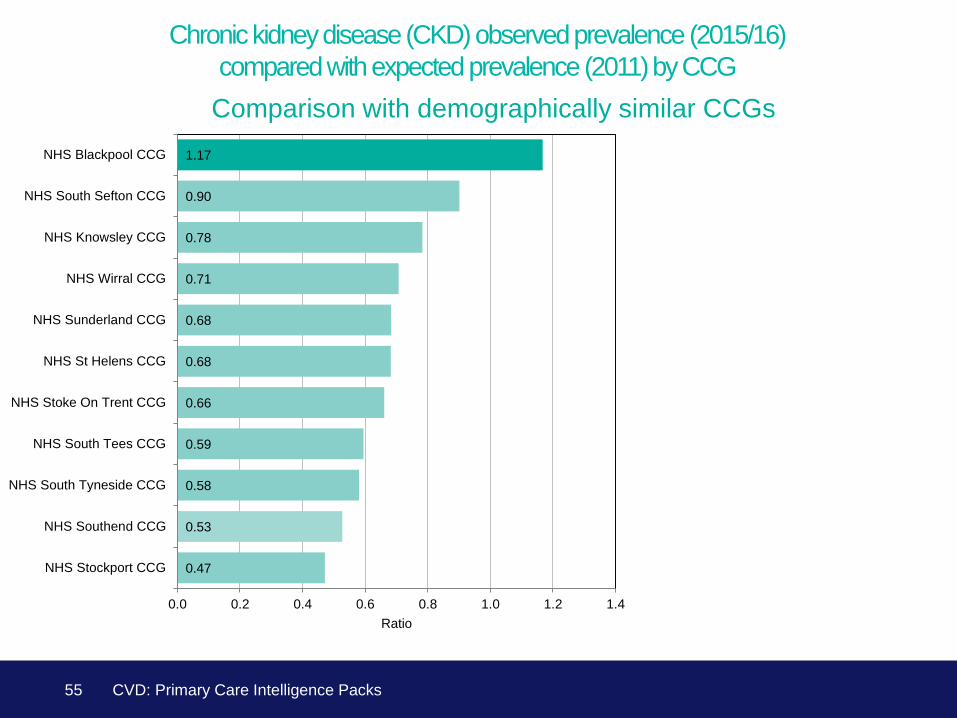
55
Chronic kidney disease (CKD) observed prevalence (2015/16)
compared with expected prevalence (2011) by CCG
Comparison with demographically similar CCGs
CVD: Primary Care Intelligence Packs
1.6%
2.7%
5.1%
5.4%
6.0%
6.1%
6.5%
6.8%
7.2%
7.3%
7.3%
7.6%
7.8%
8.1%
8.1%
8.6%
8.7%
8.9%
9.4%
9.6%
10.2%
10.5%
0% 2% 4% 6% 8% 10% 12%
ASHFIELD MEDICAL CENTRE P81722
GORTON MEDICAL CENTRE P81760
THE SURGERY DINMORE P81713
ST PAULS MEDICAL CENTRE P81063
ARNOLD MEDICAL CENTRE P81081
MARTON MEDICAL PRACTICE P81054
NEWTON DRIVE HEALTH CENTRE P81172
THE CRESCENT SURGERY P81092
SOUTH KING STREET MEDICAL CENTRE P81043
HIGHFIELD SURGERY P81074
BLOOMFIELD MEDICAL CENTRE P81115
ADELAIDE STREET SURGERY P81042
HARROWSIDE MEDICAL CENTRE P81684
VICARAGE LANE SURGERY P81754
STONYHILL MEDICAL PRACTICE P81159
ABBEY DALE MEDICAL CENTRE P81714
ELIZABETH STREET SURGERY P81004
LAYTON MEDICAL CENTRE P81066
WATERLOO MEDICAL CENTRE P81016
GLENROYD MEDICAL CENTRE P81072
CLEVELEYS GROUP PRACTICE P81073
NORTH SHORE SURGERY P81681
GP practice CCG
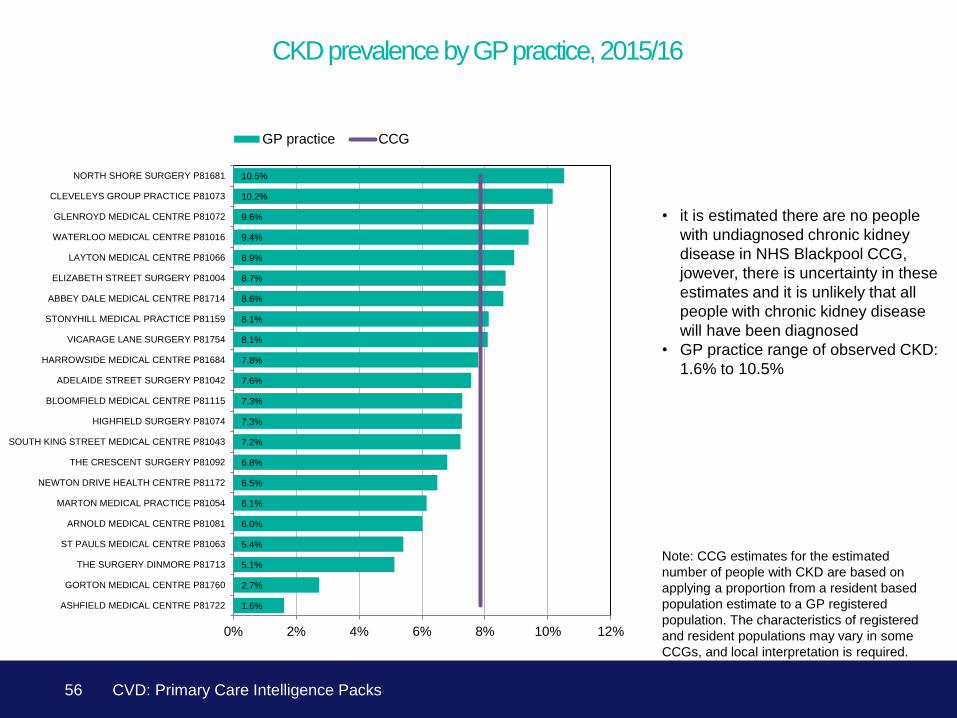
56
CKD prevalence by GP practice, 2015/16
Note: CCG estimates for the estimated
number of people with CKD are based on
applying a proportion from a resident based
population estimate to a GP registered
population. The characteristics of registered
and resident populations may vary in some
CCGs, and local interpretation is required.
• it is estimated there are no people
with undiagnosed chronic kidney
disease in NHS Blackpool CCG,
jowever, there is uncertainty in these
estimates and it is unlikely that all
people with chronic kidney disease
will have been diagnosed
• GP practice range of observed CKD:
1.6% to 10.5%
CVD: Primary Care Intelligence Packs

74.4%
74.4%
74.9%
76.8%
77.1%
77.2%
77.4%
77.9%
78.4%
0% 20% 40% 60% 80% 100%
England
NHS Lancashire North CCG
NHS Fylde & Wyre CCG
NHS Greater Preston CCG
NHS Blackpool CCG
NHS East Lancashire CCG
NHS Chorley And South Ribble CCG
NHS West Lancashire CCG
NHS Blackburn With Darwen CCG
Below 140/85 Not below 140/85 Exceptions reported
57
Percentage of patients on the CKD register whose last blood pressure reading (measured in
the preceding 12 months) is 140/85 mmHg or less by CCG, 2014/15
Comparison with CCGs in the STP
*Using the QOF clinical indicator CKD002
denominator plus exceptions. Note: as
the CKD002 indicator was removed from
the QOF in 15/16 this is historic data
taken from the 2014/15 QOF.
• 11,120 people with CKD (diagnosed*)
in NHS Blackpool CCG
• 8,569 (77.1%) people whose blood
pressure is <= 140 /85
• 975 (8.8%) people who are
exceptions
• 1,576 (14.2%) additional people
whose blood pressure is not <= 140 /
85
CVD: Primary Care Intelligence Packs
73.9%
74.6%
74.6%
75.6%
77.1%
78.2%
78.3%
78.4%
78.9%
79.4%
79.6%
0% 10% 20% 30% 40% 50% 60% 70% 80% 90% 100%
NHS South Tees CCG
NHS Southend CCG
NHS Sunderland CCG
NHS Wirral CCG
NHS Blackpool CCG
NHS South Tyneside CCG
NHS Stoke On Trent CCG
NHS South Sefton CCG
NHS St Helens CCG
NHS Stockport CCG
NHS Knowsley CCG
Below 140/85 Not below 140/85 Exceptions reported
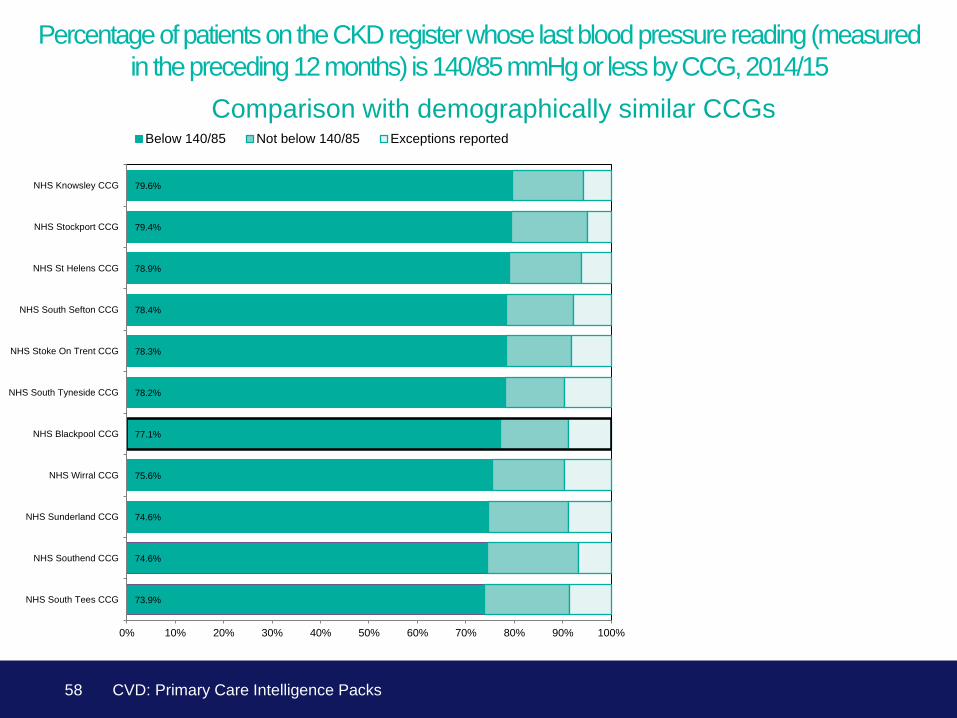
58
Percentage of patients on the CKD register whose last blood pressure reading (measured
in the preceding 12 months) is 140/85 mmHg or less by CCG, 2014/15
Comparison with demographically similar CCGs
CVD: Primary Care Intelligence Packs
7
39
138
86
90
89
10
28
75
177
52
132
105
118
148
98
273
192
45
220
341
88
0% 10% 20% 30% 40% 50% 60% 70% 80% 90% 100%
GORTON STREET PRACTICE P81760
ABBEY DALE MEDICAL CENTRE P81714
DR SE PRIESTLEY'S PRACTICE P81074
LAYTON MEDICAL CENTRE P81066
THE CRESCENT SURGERY P81092
MARTON MEDICAL PRACTICE P81054
DR G CELIKKOL'S PRACTICE P81713
ASHFIELD MEDICAL CENTRE P81722
ELIZABETH STREET SURGERY P81004
WATERLOO MEDICAL CENTRE P81016
DR SP SRIVASTAVA'S PRACTICE P81081
ADELAIDE STREET SURGERY P81042
NEWTON DRIVE SURGERY P81172
ST. PAULS MEDICAL CENTRE P81063
STONYHILL MEDICAL PRACTICE P81159
SOUTH KING STREET MEDICAL CENTRE P81043
DR PARR-BURMAN'S SURGERY P81681
BLOOMFIELD MEDICAL CENTRE P81115
VICARAGE LANE SURGERY P81754
CLEVELEYS GROUP PRACTICE P81073
GLENROYD MEDICAL CENTRE P81072
HARROWSIDE MEDICAL CENTRE P81684
Not below 140/85 Exceptions reported
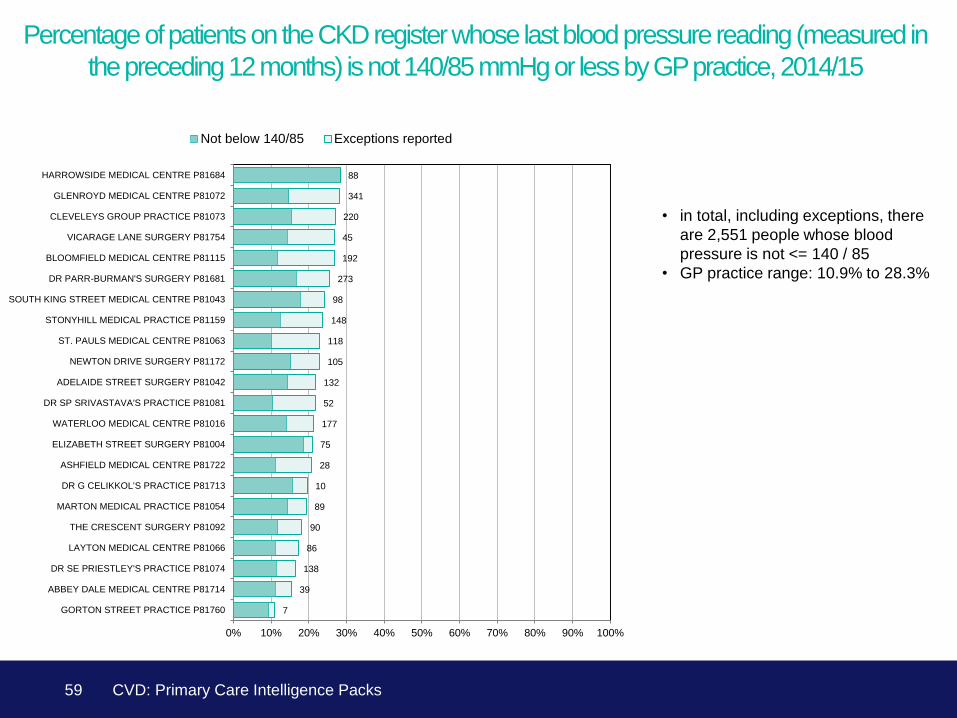
59
Percentage of patients on the CKD register whose last blood pressure reading (measured in
the preceding 12 months) is not 140/85 mmHg or less by GP practice, 2014/15
• in total, including exceptions, there
are 2,551 people whose blood
pressure is not <= 140 / 85
• GP practice range: 10.9% to 28.3%
CVD: Primary Care Intelligence Packs

32
17
71
29
81
42
50
27
30
30
37
15
43
1
11
1
-12%-10%-8%-6%-4%-2%0%2%4%6%
HARROWSIDE MEDICAL CENTRE
VICARAGE LANE SURGERY
BLOOMFIELD MEDICAL CENTRE
SOUTH KING STREET MEDICAL CENTRE
GLENROYD MEDICAL CENTRE
STONYHILL MEDICAL PRACTICE
CLEVELEYS GROUP PRACTICE
NEWTON DRIVE SURGERY
ST. PAULS MEDICAL CENTRE
ADELAIDE STREET SURGERY
WATERLOO MEDICAL CENTRE
ELIZABETH STREET SURGERY
DR PARR-BURMAN'S SURGERY
DR G CELIKKOL'S PRACTICE
MARTON MEDICAL PRACTICE
LAYTON MEDICAL CENTRE
ABBEY DALE MEDICAL CENTRE
THE CRESCENT SURGERY
GORTON STREET PRACTICE
DR SE PRIESTLEY'S PRACTICE
60
Percentage of patients on the CKD register whose last blood pressure reading (measured in the preceding
12 months) is not 140/85 mmHg or less by GP practice, 2014/15 – opportunities compared to GP cluster
• using the GP cluster method of
calculating potential gains, if each
practice was to achieve as well as the
upper quartile of its national cluster,
then an additional 528 people would
be treated
CVD: Primary Care Intelligence Packs
Details of this methodology are available on slide
9. Click here to view them.
75.4%
74.1%
75.7%
75.7%
76.4%
77.0%
77.1%
77.7%
81.0%
0% 20% 40% 60% 80% 100%
England
NHS Lancashire North CCG
NHS East Lancashire CCG
NHS Greater Preston CCG
NHS Fylde & Wyre CCG
NHS Blackburn With Darwen CCG
NHS Blackpool CCG
NHS West Lancashire CCG
NHS Chorley And South Ribble CCG
Recorded Not recorded Exceptions reported
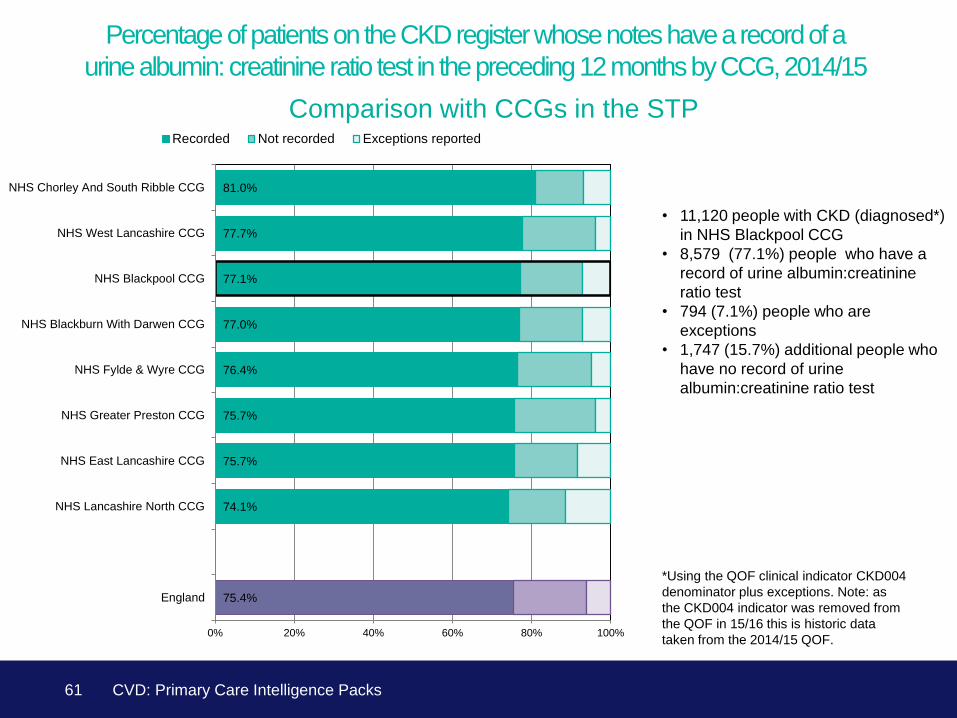
61
Percentage of patients on the CKD register whose notes have a record of a
urine albumin: creatinine ratio test in the preceding 12 months by CCG, 2014/15
Comparison with CCGs in the STP
• 11,120 people with CKD (diagnosed*)
in NHS Blackpool CCG
• 8,579 (77.1%) people who have a
record of urine albumin:creatinine
ratio test
• 794 (7.1%) people who are
exceptions
• 1,747 (15.7%) additional people who
have no record of urine
albumin:creatinine ratio test
*Using the QOF clinical indicator CKD004
denominator plus exceptions. Note: as
the CKD004 indicator was removed from
the QOF in 15/16 this is historic data
taken from the 2014/15 QOF.
CVD: Primary Care Intelligence Packs

67.8%
71.1%
74.7%
76.1%
76.7%
77.1%
77.8%
78.6%
79.2%
79.9%
80.9%
0% 10% 20% 30% 40% 50% 60% 70% 80% 90% 100%
NHS Southend CCG
NHS Wirral CCG
NHS Sunderland CCG
NHS South Tees CCG
NHS Knowsley CCG
NHS Blackpool CCG
NHS St Helens CCG
NHS South Sefton CCG
NHS Stoke On Trent CCG
NHS Stockport CCG
NHS South Tyneside CCG
Recorded Not recorded Exceptions reported
62
Percentage of patients on the CKD register whose notes have a record of a
urine albumin: creatinine ratio test in the preceding 12 months by CCG, 2014/15
Comparison with demographically similar CCGs
CVD: Primary Care Intelligence Packs
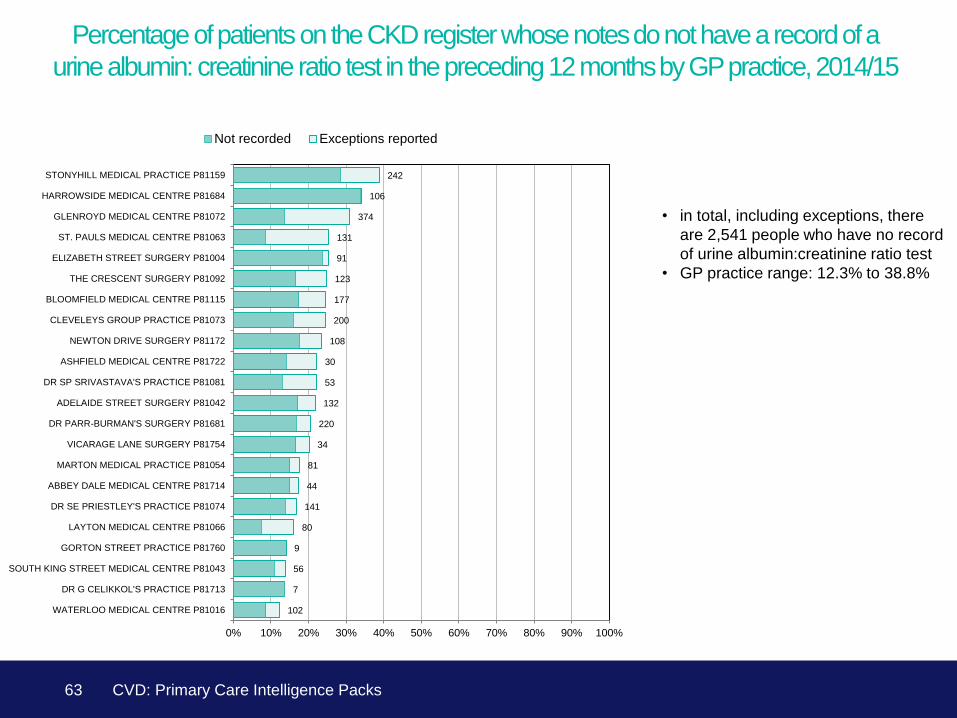
102
7
56
9
80
141
44
81
34
220
132
53
30
108
200
177
123
91
131
374
106
242
0% 10% 20% 30% 40% 50% 60% 70% 80% 90% 100%
WATERLOO MEDICAL CENTRE P81016
DR G CELIKKOL'S PRACTICE P81713
SOUTH KING STREET MEDICAL CENTRE P81043
GORTON STREET PRACTICE P81760
LAYTON MEDICAL CENTRE P81066
DR SE PRIESTLEY'S PRACTICE P81074
ABBEY DALE MEDICAL CENTRE P81714
MARTON MEDICAL PRACTICE P81054
VICARAGE LANE SURGERY P81754
DR PARR-BURMAN'S SURGERY P81681
ADELAIDE STREET SURGERY P81042
DR SP SRIVASTAVA'S PRACTICE P81081
ASHFIELD MEDICAL CENTRE P81722
NEWTON DRIVE SURGERY P81172
CLEVELEYS GROUP PRACTICE P81073
BLOOMFIELD MEDICAL CENTRE P81115
THE CRESCENT SURGERY P81092
ELIZABETH STREET SURGERY P81004
ST. PAULS MEDICAL CENTRE P81063
GLENROYD MEDICAL CENTRE P81072
HARROWSIDE MEDICAL CENTRE P81684
STONYHILL MEDICAL PRACTICE P81159
Not recorded Exceptions reported
63
Percentage of patients on the CKD register whose notes do not have a record of a
urine albumin: creatinine ratio test in the preceding 12 months by GP practice, 2014/15
• in total, including exceptions, there
are 2,541 people who have no record
of urine albumin:creatinine ratio test
• GP practice range: 12.3% to 38.8%
CVD: Primary Care Intelligence Packs

Heart
64 CVD: Primary Care Intelligence Packs

Coronary Heart Disease is one of the principal causes of
premature death and disability. The key elements of management for
an individual who has already had a heart attack or angina are
symptom control and secondary prevention of further cardiovascular
events and premature mortality. There is robust evidence to support the
use of anti-platelet treatment, statins, beta-blockers and angiotensin
converting enzyme inhibitors or angiotensin receptor blockers. There is
also robust evidence to support good control of blood pressure. Each of
these interventions is incentivised in QOF but variation in achievement
and exception reporting at practice level shows that there is often
considerable potential for improving management and outcomes.
What might help 1. roll out of GRASP-Heart Failure audit tool
that identifies people with heart failure who
are undiagnosed or under treated
2. education for health professionals to
promote evidence based management of
CHD and high quality measurement of
blood pressure
3. ensure access to rapid access diagnostic
clinics and specialist support for
management of angina and heart failure
4. ensure access to cardiac rehab for
individuals with CHD and heart failure
What questions should we ask in our CCG? 1. for each indicator how wide is the variation in
achievement and exception reporting?
2. how many people would benefit if all
practices performed as well as the best?
3. how can we support practices who are
average and below average to perform as
well as the best in:
• more systematic delivery of evidence
based care for people with CHD
• improved detection and management
of heart failure
Heart failure is a common and an important complication of
coronary heart disease and other conditions. Appropriate treatment
including up-titration of ace inhibitors and beta blockers in heart failure
due to LVSD can significantly improve symptom control and quality of
life, and improve outcomes for patients. Despite this, around a quarter
of people with heart failure are undetected and untreated. And amongst
those who are diagnosed, there is significant variation in the quality of
care.
Management of Heart Disease
65 CVD: Primary Care Intelligence Packs
Premature death and disability in people with
CHD can be reduced significantly by systematic
evidence based management in primary care
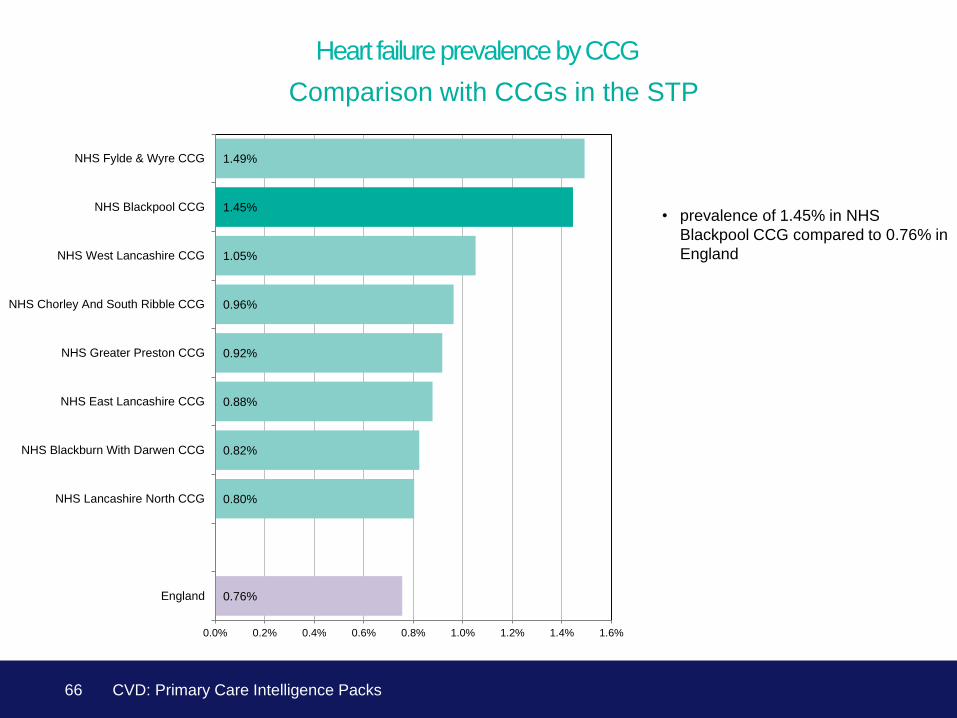
0.76%
0.80%
0.82%
0.88%
0.92%
0.96%
1.05%
1.45%
1.49%
0.0% 0.2% 0.4% 0.6% 0.8% 1.0% 1.2% 1.4% 1.6%
England
NHS Lancashire North CCG
NHS Blackburn With Darwen CCG
NHS East Lancashire CCG
NHS Greater Preston CCG
NHS Chorley And South Ribble CCG
NHS West Lancashire CCG
NHS Blackpool CCG
NHS Fylde & Wyre CCG
66
Heart failure prevalence by CCG
Comparison with CCGs in the STP
• prevalence of 1.45% in NHS
Blackpool CCG compared to 0.76% in
England
CVD: Primary Care Intelligence Packs
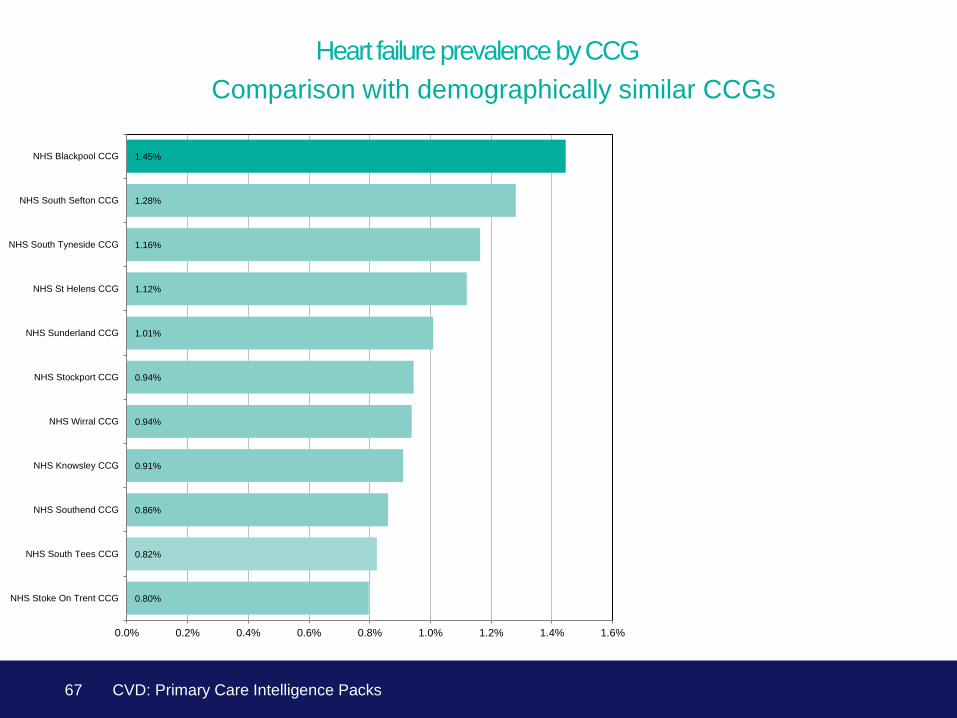
0.80%
0.82%
0.86%
0.91%
0.94%
0.94%
1.01%
1.12%
1.16%
1.28%
1.45%
0.0% 0.2% 0.4% 0.6% 0.8% 1.0% 1.2% 1.4% 1.6%
NHS Stoke On Trent CCG
NHS South Tees CCG
NHS Southend CCG
NHS Knowsley CCG
NHS Wirral CCG
NHS Stockport CCG
NHS Sunderland CCG
NHS St Helens CCG
NHS South Tyneside CCG
NHS South Sefton CCG
NHS Blackpool CCG
67
Heart failure prevalence by CCG
Comparison with demographically similar CCGs
CVD: Primary Care Intelligence Packs
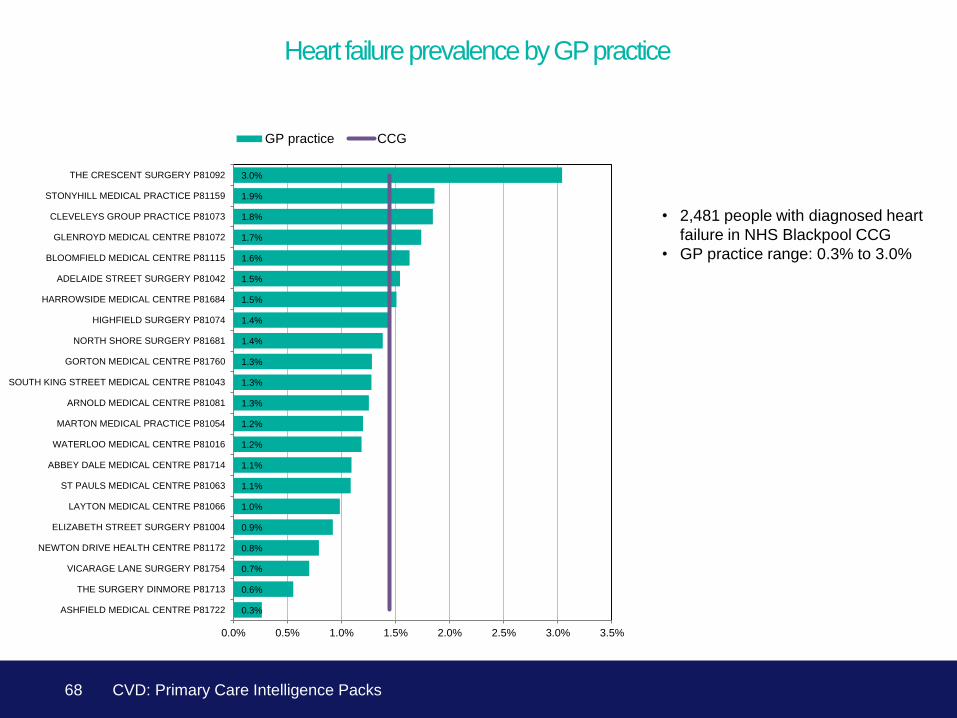
0.3%
0.6%
0.7%
0.8%
0.9%
1.0%
1.1%
1.1%
1.2%
1.2%
1.3%
1.3%
1.3%
1.4%
1.4%
1.5%
1.5%
1.6%
1.7%
1.8%
1.9%
3.0%
0.0% 0.5% 1.0% 1.5% 2.0% 2.5% 3.0% 3.5%
ASHFIELD MEDICAL CENTRE P81722
THE SURGERY DINMORE P81713
VICARAGE LANE SURGERY P81754
NEWTON DRIVE HEALTH CENTRE P81172
ELIZABETH STREET SURGERY P81004
LAYTON MEDICAL CENTRE P81066
ST PAULS MEDICAL CENTRE P81063
ABBEY DALE MEDICAL CENTRE P81714
WATERLOO MEDICAL CENTRE P81016
MARTON MEDICAL PRACTICE P81054
ARNOLD MEDICAL CENTRE P81081
SOUTH KING STREET MEDICAL CENTRE P81043
GORTON MEDICAL CENTRE P81760
NORTH SHORE SURGERY P81681
HIGHFIELD SURGERY P81074
HARROWSIDE MEDICAL CENTRE P81684
ADELAIDE STREET SURGERY P81042
BLOOMFIELD MEDICAL CENTRE P81115
GLENROYD MEDICAL CENTRE P81072
CLEVELEYS GROUP PRACTICE P81073
STONYHILL MEDICAL PRACTICE P81159
THE CRESCENT SURGERY P81092
GP practice CCG
68
Heart failure prevalence by GP practice
• 2,481 people with diagnosed heart
failure in NHS Blackpool CCG
• GP practice range: 0.3% to 3.0%
CVD: Primary Care Intelligence Packs
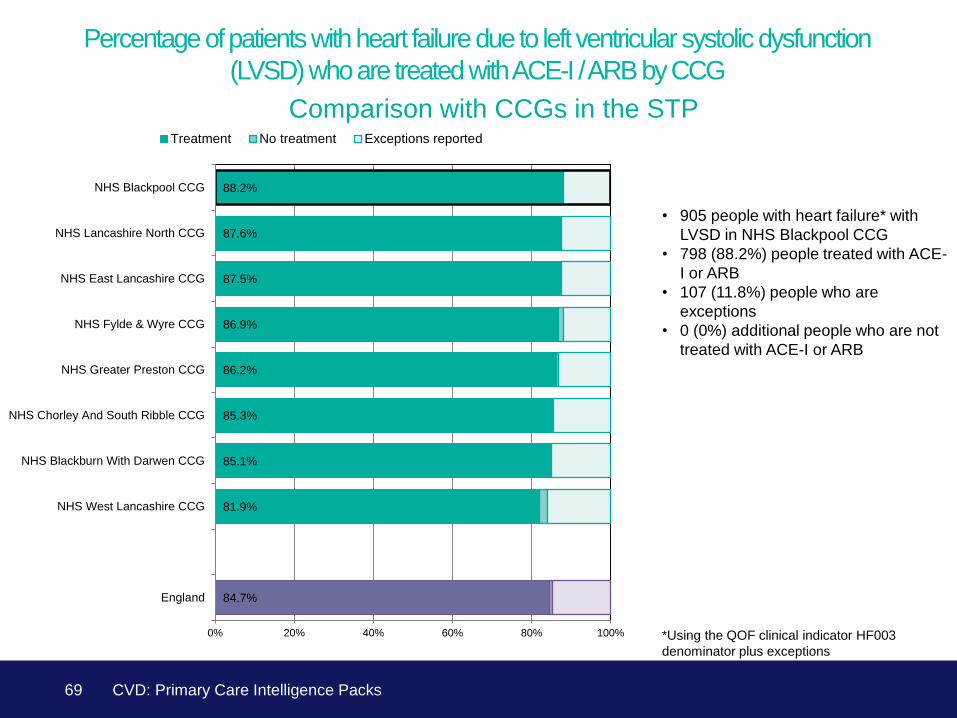
84.7%
81.9%
85.1%
85.3%
86.2%
86.9%
87.5%
87.6%
88.2%
0% 20% 40% 60% 80% 100%
England
NHS West Lancashire CCG
NHS Blackburn With Darwen CCG
NHS Chorley And South Ribble CCG
NHS Greater Preston CCG
NHS Fylde & Wyre CCG
NHS East Lancashire CCG
NHS Lancashire North CCG
NHS Blackpool CCG
Treatment No treatment Exceptions reported
69
Percentage of patients with heart failure due to left ventricular systolic dysfunction
(LVSD) who are treated with ACE-I / ARB by CCG
Comparison with CCGs in the STP
• 905 people with heart failure* with
LVSD in NHS Blackpool CCG
• 798 (88.2%) people treated with ACE-
I or ARB
• 107 (11.8%) people who are
exceptions
• 0 (0%) additional people who are not
treated with ACE-I or ARB
*Using the QOF clinical indicator HF003
denominator plus exceptions
CVD: Primary Care Intelligence Packs
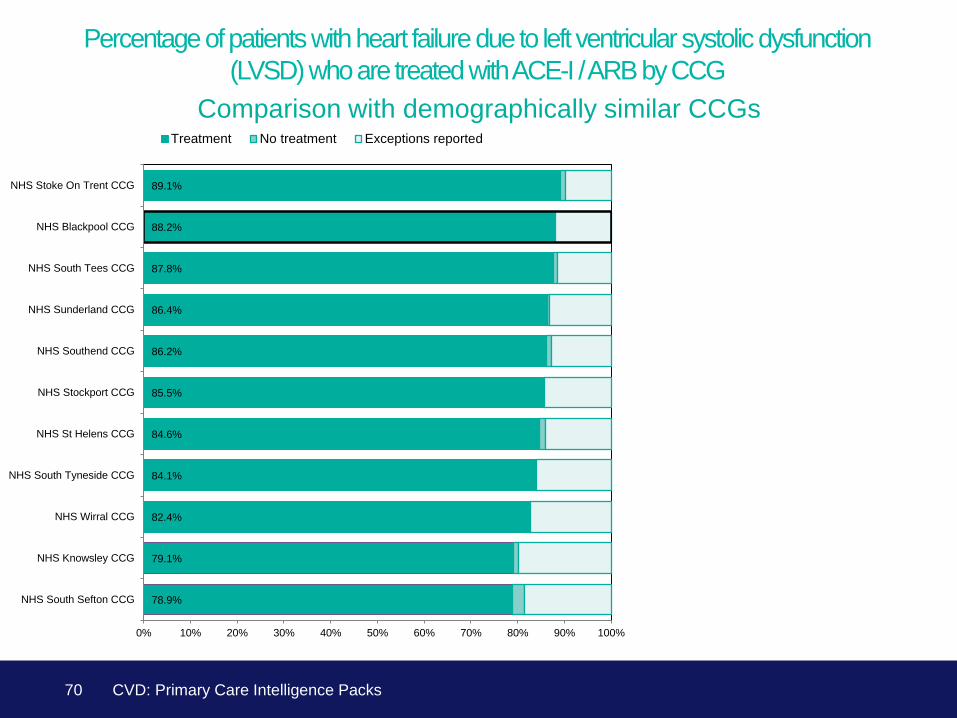
78.9%
79.1%
82.4%
84.1%
84.6%
85.5%
86.2%
86.4%
87.8%
88.2%
89.1%
0% 10% 20% 30% 40% 50% 60% 70% 80% 90% 100%
NHS South Sefton CCG
NHS Knowsley CCG
NHS Wirral CCG
NHS South Tyneside CCG
NHS St Helens CCG
NHS Stockport CCG
NHS Southend CCG
NHS Sunderland CCG
NHS South Tees CCG
NHS Blackpool CCG
NHS Stoke On Trent CCG
Treatment No treatment Exceptions reported
70
Percentage of patients with heart failure due to left ventricular systolic dysfunction
(LVSD) who are treated with ACE-I / ARB by CCG
Comparison with demographically similar CCGs
CVD: Primary Care Intelligence Packs

2
2
2
9
8
1
10
22
5
2
4
1
21
5
5
4
4
0% 10% 20% 30% 40% 50% 60% 70% 80% 90% 100%
ASHFIELD MEDICAL CENTRE P81722
THE SURGERY DINMORE P81713
ARNOLD MEDICAL CENTRE P81081
LAYTON MEDICAL CENTRE P81066
SOUTH KING STREET MEDICAL CENTRE P81043
ADELAIDE STREET SURGERY P81042
NORTH SHORE SURGERY P81681
GORTON MEDICAL CENTRE P81760
CLEVELEYS GROUP PRACTICE P81073
GLENROYD MEDICAL CENTRE P81072
VICARAGE LANE SURGERY P81754
HIGHFIELD SURGERY P81074
THE CRESCENT SURGERY P81092
ST PAULS MEDICAL CENTRE P81063
WATERLOO MEDICAL CENTRE P81016
ELIZABETH STREET SURGERY P81004
ABBEY DALE MEDICAL CENTRE P81714
BLOOMFIELD MEDICAL CENTRE P81115
STONYHILL MEDICAL PRACTICE P81159
MARTON MEDICAL PRACTICE P81054
NEWTON DRIVE HEALTH CENTRE P81172
HARROWSIDE MEDICAL CENTRE P81684
No treatment Exceptions reported
71
Percentage of patients with heart failure due to left ventricular systolic dysfunction
(LVSD) who are not treated with ACE-I / ARB by GP practice
• in total, including exceptions, there
are 107 people who are not treated
with ACE-I or ARB
• GP practice range: 0.0% to 36.4%
CVD: Primary Care Intelligence Packs
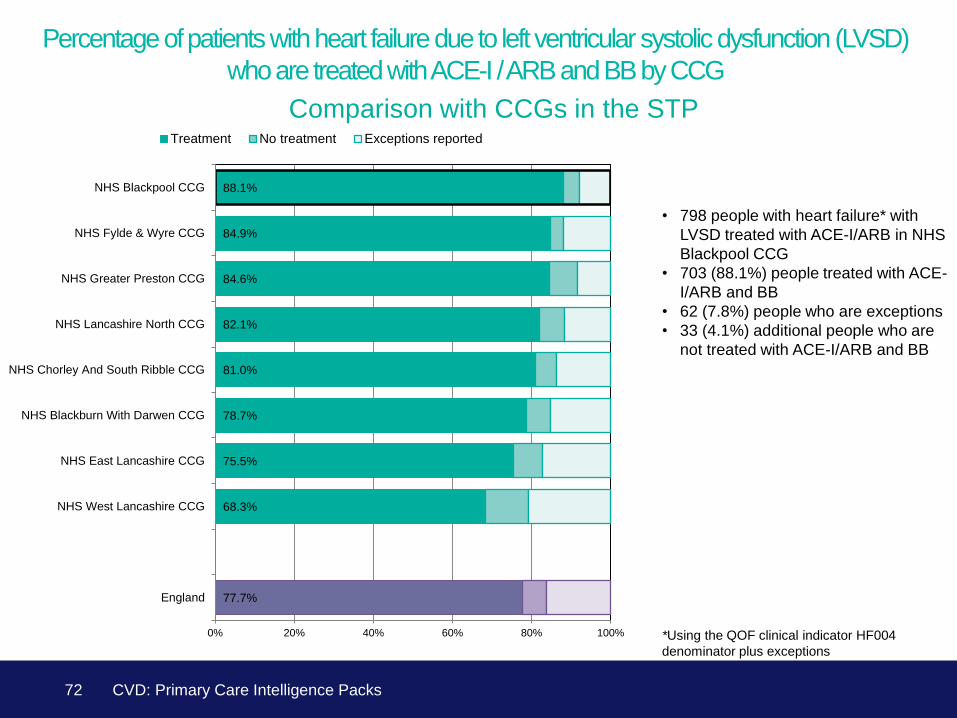
77.7%
68.3%
75.5%
78.7%
81.0%
82.1%
84.6%
84.9%
88.1%
0% 20% 40% 60% 80% 100%
England
NHS West Lancashire CCG
NHS East Lancashire CCG
NHS Blackburn With Darwen CCG
NHS Chorley And South Ribble CCG
NHS Lancashire North CCG
NHS Greater Preston CCG
NHS Fylde & Wyre CCG
NHS Blackpool CCG
Treatment No treatment Exceptions reported
72
Percentage of patients with heart failure due to left ventricular systolic dysfunction (LVSD)
who are treated with ACE-I / ARB and BB by CCG
Comparison with CCGs in the STP
• 798 people with heart failure* with
LVSD treated with ACE-I/ARB in NHS
Blackpool CCG
• 703 (88.1%) people treated with ACE-
I/ARB and BB
• 62 (7.8%) people who are exceptions
• 33 (4.1%) additional people who are
not treated with ACE-I/ARB and BB
*Using the QOF clinical indicator HF004
denominator plus exceptions
CVD: Primary Care Intelligence Packs
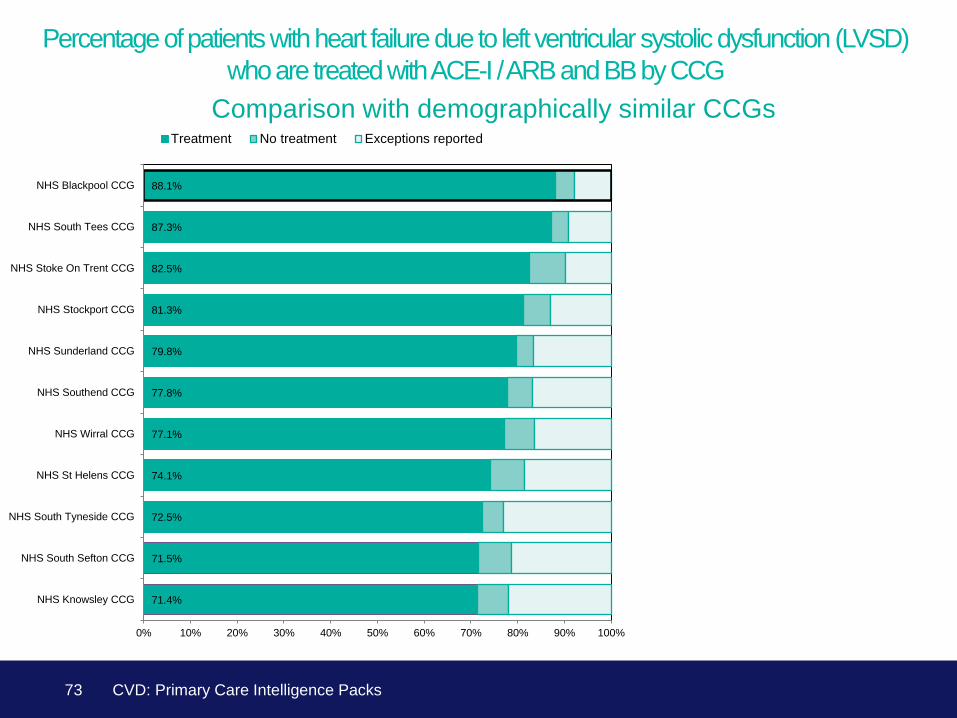
71.4%
71.5%
72.5%
74.1%
77.1%
77.8%
79.8%
81.3%
82.5%
87.3%
88.1%
0% 10% 20% 30% 40% 50% 60% 70% 80% 90% 100%
NHS Knowsley CCG
NHS South Sefton CCG
NHS South Tyneside CCG
NHS St Helens CCG
NHS Wirral CCG
NHS Southend CCG
NHS Sunderland CCG
NHS Stockport CCG
NHS Stoke On Trent CCG
NHS South Tees CCG
NHS Blackpool CCG
Treatment No treatment Exceptions reported
73
Percentage of patients with heart failure due to left ventricular systolic dysfunction (LVSD)
who are treated with ACE-I / ARB and BB by CCG
Comparison with demographically similar CCGs
CVD: Primary Care Intelligence Packs
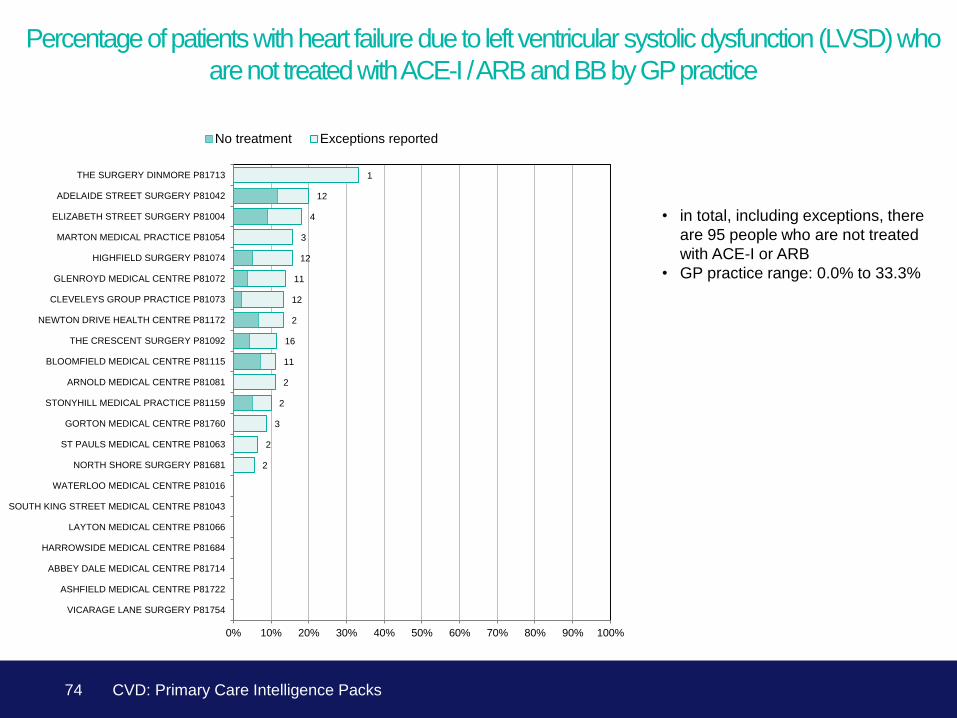
2
2
3
2
2
11
16
2
12
11
12
3
4
12
1
0% 10% 20% 30% 40% 50% 60% 70% 80% 90% 100%
VICARAGE LANE SURGERY P81754
ASHFIELD MEDICAL CENTRE P81722
ABBEY DALE MEDICAL CENTRE P81714
HARROWSIDE MEDICAL CENTRE P81684
LAYTON MEDICAL CENTRE P81066
SOUTH KING STREET MEDICAL CENTRE P81043
WATERLOO MEDICAL CENTRE P81016
NORTH SHORE SURGERY P81681
ST PAULS MEDICAL CENTRE P81063
GORTON MEDICAL CENTRE P81760
STONYHILL MEDICAL PRACTICE P81159
ARNOLD MEDICAL CENTRE P81081
BLOOMFIELD MEDICAL CENTRE P81115
THE CRESCENT SURGERY P81092
NEWTON DRIVE HEALTH CENTRE P81172
CLEVELEYS GROUP PRACTICE P81073
GLENROYD MEDICAL CENTRE P81072
HIGHFIELD SURGERY P81074
MARTON MEDICAL PRACTICE P81054
ELIZABETH STREET SURGERY P81004
ADELAIDE STREET SURGERY P81042
THE SURGERY DINMORE P81713
No treatment Exceptions reported
74
Percentage of patients with heart failure due to left ventricular systolic dysfunction (LVSD) who
are not treated with ACE-I / ARB and BB by GP practice
• in total, including exceptions, there
are 95 people who are not treated
with ACE-I or ARB
• GP practice range: 0.0% to 33.3%
CVD: Primary Care Intelligence Packs
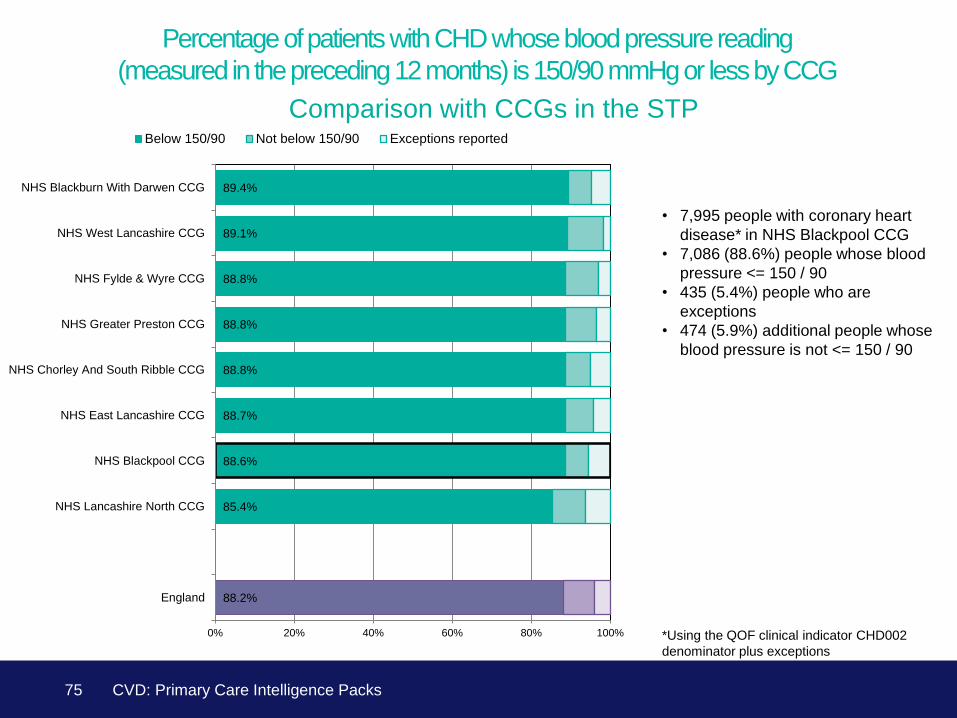
88.2%
85.4%
88.6%
88.7%
88.8%
88.8%
88.8%
89.1%
89.4%
0% 20% 40% 60% 80% 100%
England
NHS Lancashire North CCG
NHS Blackpool CCG
NHS East Lancashire CCG
NHS Chorley And South Ribble CCG
NHS Greater Preston CCG
NHS Fylde & Wyre CCG
NHS West Lancashire CCG
NHS Blackburn With Darwen CCG
Below 150/90 Not below 150/90 Exceptions reported
75
Percentage of patients with CHD whose blood pressure reading
(measured in the preceding 12 months) is 150/90 mmHg or less by CCG
Comparison with CCGs in the STP
*Using the QOF clinical indicator CHD002
denominator plus exceptions
• 7,995 people with coronary heart
disease* in NHS Blackpool CCG
• 7,086 (88.6%) people whose blood
pressure <= 150 / 90
• 435 (5.4%) people who are
exceptions
• 474 (5.9%) additional people whose
blood pressure is not <= 150 / 90
CVD: Primary Care Intelligence Packs

86.5%
86.8%
88.2%
88.2%
88.3%
88.6%
88.6%
89.7%
89.9%
89.9%
91.1%
0% 10% 20% 30% 40% 50% 60% 70% 80% 90% 100%
NHS Southend CCG
NHS South Sefton CCG
NHS Wirral CCG
NHS Sunderland CCG
NHS South Tyneside CCG
NHS Blackpool CCG
NHS South Tees CCG
NHS Knowsley CCG
NHS Stoke On Trent CCG
NHS St Helens CCG
NHS Stockport CCG
Below 150/90 Not below 150/90 Exceptions reported
76
Percentage of patients with CHD whose blood pressure reading
(measured in the preceding 12 months) is 150/90 mmHg or less by CCG
Comparison with demographically similar CCGs
CVD: Primary Care Intelligence Packs
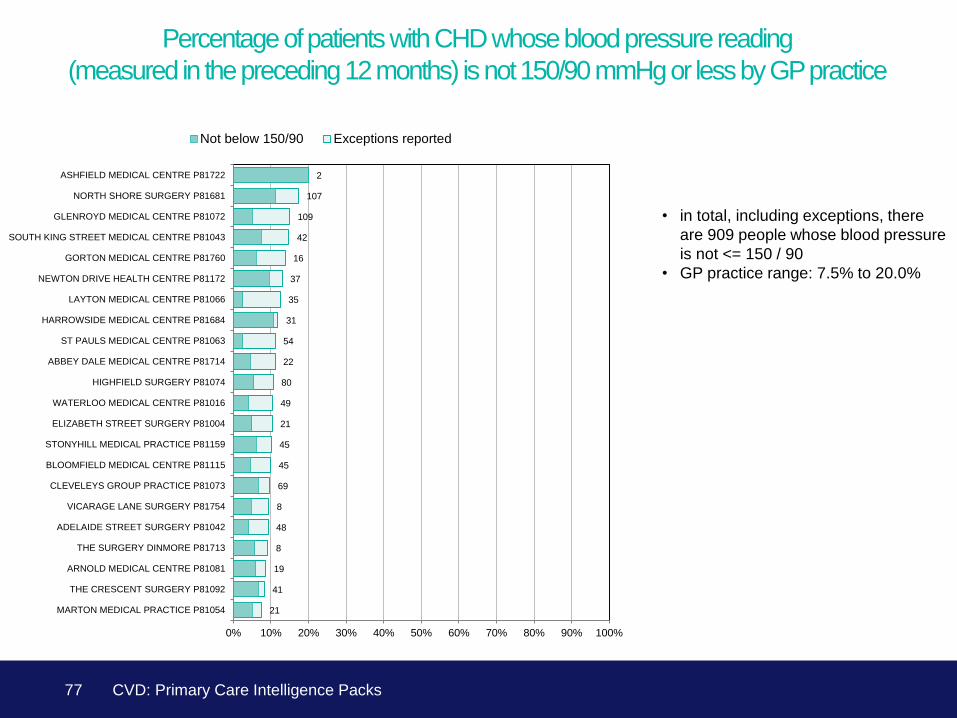
21
41
19
8
48
8
69
45
45
21
49
80
22
54
31
35
37
16
42
109
107
2
0% 10% 20% 30% 40% 50% 60% 70% 80% 90% 100%
MARTON MEDICAL PRACTICE P81054
THE CRESCENT SURGERY P81092
ARNOLD MEDICAL CENTRE P81081
THE SURGERY DINMORE P81713
ADELAIDE STREET SURGERY P81042
VICARAGE LANE SURGERY P81754
CLEVELEYS GROUP PRACTICE P81073
BLOOMFIELD MEDICAL CENTRE P81115
STONYHILL MEDICAL PRACTICE P81159
ELIZABETH STREET SURGERY P81004
WATERLOO MEDICAL CENTRE P81016
HIGHFIELD SURGERY P81074
ABBEY DALE MEDICAL CENTRE P81714
ST PAULS MEDICAL CENTRE P81063
HARROWSIDE MEDICAL CENTRE P81684
LAYTON MEDICAL CENTRE P81066
NEWTON DRIVE HEALTH CENTRE P81172
GORTON MEDICAL CENTRE P81760
SOUTH KING STREET MEDICAL CENTRE P81043
GLENROYD MEDICAL CENTRE P81072
NORTH SHORE SURGERY P81681
ASHFIELD MEDICAL CENTRE P81722
Not below 150/90 Exceptions reported
77
Percentage of patients with CHD whose blood pressure reading
(measured in the preceding 12 months) is not 150/90 mmHg or less by GP practice
• in total, including exceptions, there
are 909 people whose blood pressure
is not <= 150 / 90
• GP practice range: 7.5% to 20.0%
CVD: Primary Care Intelligence Packs

55
22
8
47
17
15
13
20
8
16
14
13
2
12
2
16
3
10
1
-10%-9%-8%-7%-6%-5%-4%-3%-2%-1%0%1%
NORTH SHORE SURGERY
SOUTH KING STREET MEDICAL CENTRE
GORTON MEDICAL CENTRE
GLENROYD MEDICAL CENTRE
NEWTON DRIVE HEALTH CENTRE
LAYTON MEDICAL CENTRE
HARROWSIDE MEDICAL CENTRE
ST PAULS MEDICAL CENTRE
ABBEY DALE MEDICAL CENTRE
WATERLOO MEDICAL CENTRE
STONYHILL MEDICAL PRACTICE
BLOOMFIELD MEDICAL CENTRE
VICARAGE LANE SURGERY
ADELAIDE STREET SURGERY
THE SURGERY DINMORE
HIGHFIELD SURGERY
ARNOLD MEDICAL CENTRE
CLEVELEYS GROUP PRACTICE
MARTON MEDICAL PRACTICE
THE CRESCENT SURGERY
78
Percentage of patients with CHD whose blood pressure reading (measured
in the preceding 12 months) is not 150/90 mmHg or less by GP practice –
opportunities compared to GP cluster
• using the GP cluster method of
calculating potential gains, if each
practice was to achieve as well as the
upper quartile of its national cluster,
then an additional 300 people would
be treated
CVD: Primary Care Intelligence Packs
Details of this methodology are available on slide
9. Click here to view them.
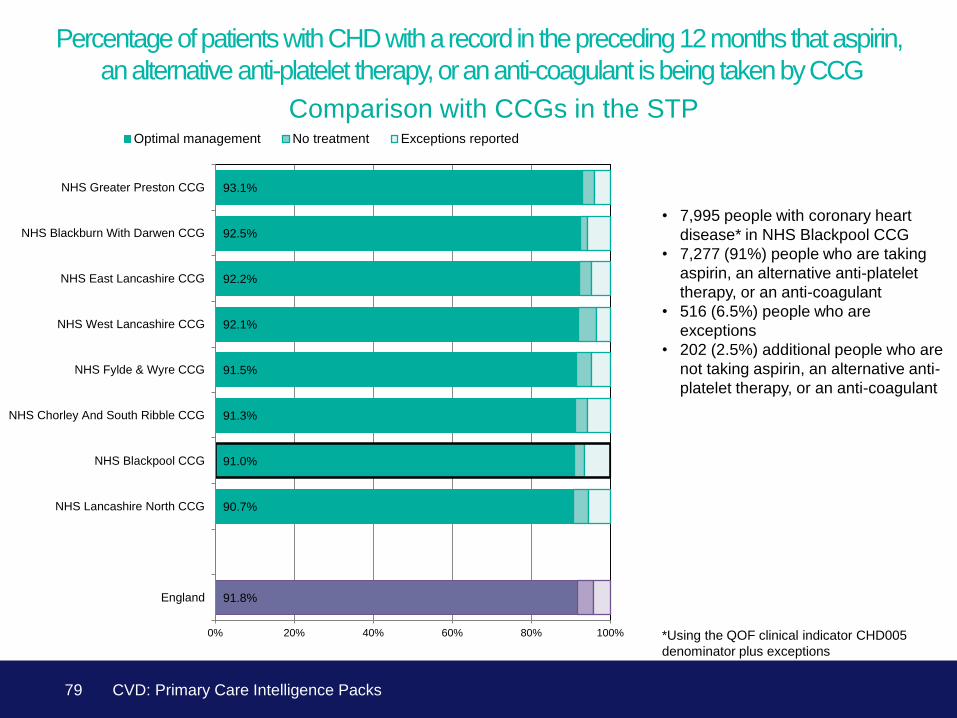
91.8%
90.7%
91.0%
91.3%
91.5%
92.1%
92.2%
92.5%
93.1%
0% 20% 40% 60% 80% 100%
England
NHS Lancashire North CCG
NHS Blackpool CCG
NHS Chorley And South Ribble CCG
NHS Fylde & Wyre CCG
NHS West Lancashire CCG
NHS East Lancashire CCG
NHS Blackburn With Darwen CCG
NHS Greater Preston CCG
Optimal management No treatment Exceptions reported
79
Percentage of patients with CHD with a record in the preceding 12 months that aspirin,
an alternative anti-platelet therapy, or an anti-coagulant is being taken by CCG
Comparison with CCGs in the STP
*Using the QOF clinical indicator CHD005
denominator plus exceptions
• 7,995 people with coronary heart
disease* in NHS Blackpool CCG
• 7,277 (91%) people who are taking
aspirin, an alternative anti-platelet
therapy, or an anti-coagulant
• 516 (6.5%) people who are
exceptions
• 202 (2.5%) additional people who are
not taking aspirin, an alternative anti-
platelet therapy, or an anti-coagulant
CVD: Primary Care Intelligence Packs

89.1%
89.6%
91.0%
91.1%
92.4%
92.5%
92.6%
93.0%
93.5%
93.6%
93.6%
0% 10% 20% 30% 40% 50% 60% 70% 80% 90% 100%
NHS Southend CCG
NHS Wirral CCG
NHS Blackpool CCG
NHS St Helens CCG
NHS South Sefton CCG
NHS South Tees CCG
NHS Stoke On Trent CCG
NHS Stockport CCG
NHS Knowsley CCG
NHS South Tyneside CCG
NHS Sunderland CCG
Optimal management No treatment Exceptions reported
80
Percentage of patients with CHD with a record in the preceding 12 months that aspirin,
an alternative anti-platelet therapy, or an anti-coagulant is being taken by CCG
Comparison with demographically similar CCGs
CVD: Primary Care Intelligence Packs
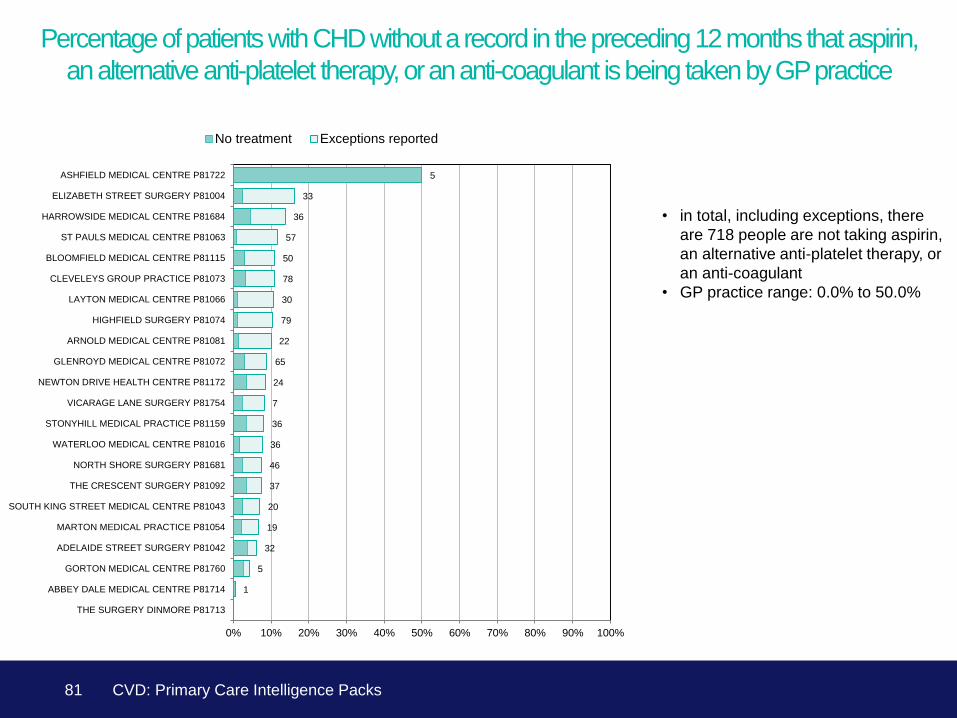
1
5
32
19
20
37
46
36
36
7
24
65
22
79
30
78
50
57
36
33
5
0% 10% 20% 30% 40% 50% 60% 70% 80% 90% 100%
THE SURGERY DINMORE P81713
ABBEY DALE MEDICAL CENTRE P81714
GORTON MEDICAL CENTRE P81760
ADELAIDE STREET SURGERY P81042
MARTON MEDICAL PRACTICE P81054
SOUTH KING STREET MEDICAL CENTRE P81043
THE CRESCENT SURGERY P81092
NORTH SHORE SURGERY P81681
WATERLOO MEDICAL CENTRE P81016
STONYHILL MEDICAL PRACTICE P81159
VICARAGE LANE SURGERY P81754
NEWTON DRIVE HEALTH CENTRE P81172
GLENROYD MEDICAL CENTRE P81072
ARNOLD MEDICAL CENTRE P81081
HIGHFIELD SURGERY P81074
LAYTON MEDICAL CENTRE P81066
CLEVELEYS GROUP PRACTICE P81073
BLOOMFIELD MEDICAL CENTRE P81115
ST PAULS MEDICAL CENTRE P81063
HARROWSIDE MEDICAL CENTRE P81684
ELIZABETH STREET SURGERY P81004
ASHFIELD MEDICAL CENTRE P81722
No treatment Exceptions reported
81
Percentage of patients with CHD without a record in the preceding 12 months that aspirin,
an alternative anti-platelet therapy, or an anti-coagulant is being taken by GP practice
• in total, including exceptions, there
are 718 people are not taking aspirin,
an alternative anti-platelet therapy, or
an anti-coagulant
• GP practice range: 0.0% to 50.0%
CVD: Primary Care Intelligence Packs
Some data on outcomes for people with
cardiovascular disease
82 CVD: Primary Care Intelligence Packs
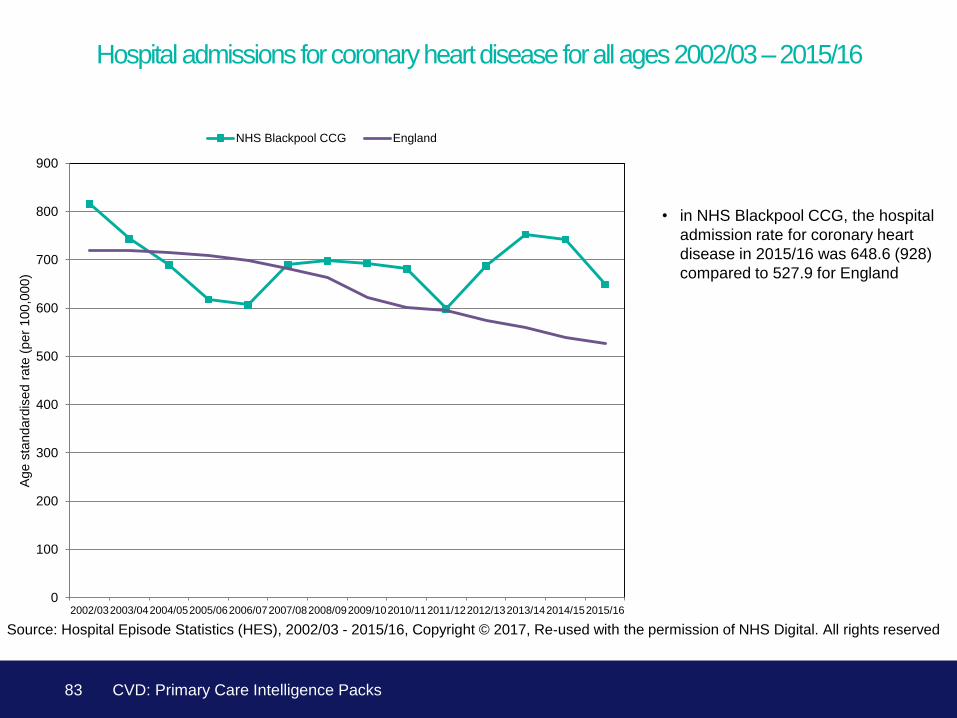
0
100
200
300
400
500
600
700
800
900
2002/032003/042004/052005/062006/072007/082008/092009/102010/112011/122012/132013/142014/152015/16
Ag
e s
tand
ard
ise
d r
ate
(p
er
100
,00
0)
NHS Blackpool CCG England
83
Hospital admissions for coronary heart disease for all ages 2002/03 – 2015/16
Source: Hospital Episode Statistics (HES), 2002/03 - 2015/16, Copyright © 2017, Re‐used with the permission of NHS Digital. All rights reserved
• in NHS Blackpool CCG, the hospital
admission rate for coronary heart
disease in 2015/16 was 648.6 (928)
compared to 527.9 for England
CVD: Primary Care Intelligence Packs
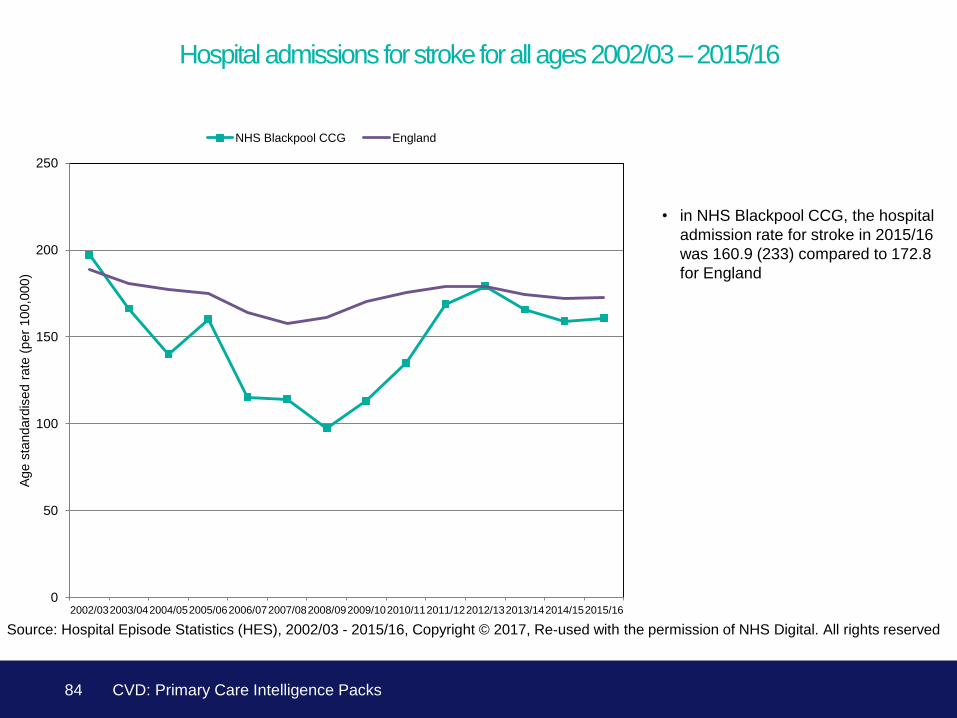
0
50
100
150
200
250
2002/032003/042004/052005/062006/072007/082008/092009/102010/112011/122012/132013/142014/152015/16
Age s
tandard
ised r
ate
(p
er
100,0
00)
NHS Blackpool CCG England
84
Hospital admissions for stroke for all ages 2002/03 – 2015/16
Source: Hospital Episode Statistics (HES), 2002/03 - 2015/16, Copyright © 2017, Re‐used with the permission of NHS Digital. All rights reserved
• in NHS Blackpool CCG, the hospital
admission rate for stroke in 2015/16
was 160.9 (233) compared to 172.8
for England
CVD: Primary Care Intelligence Packs
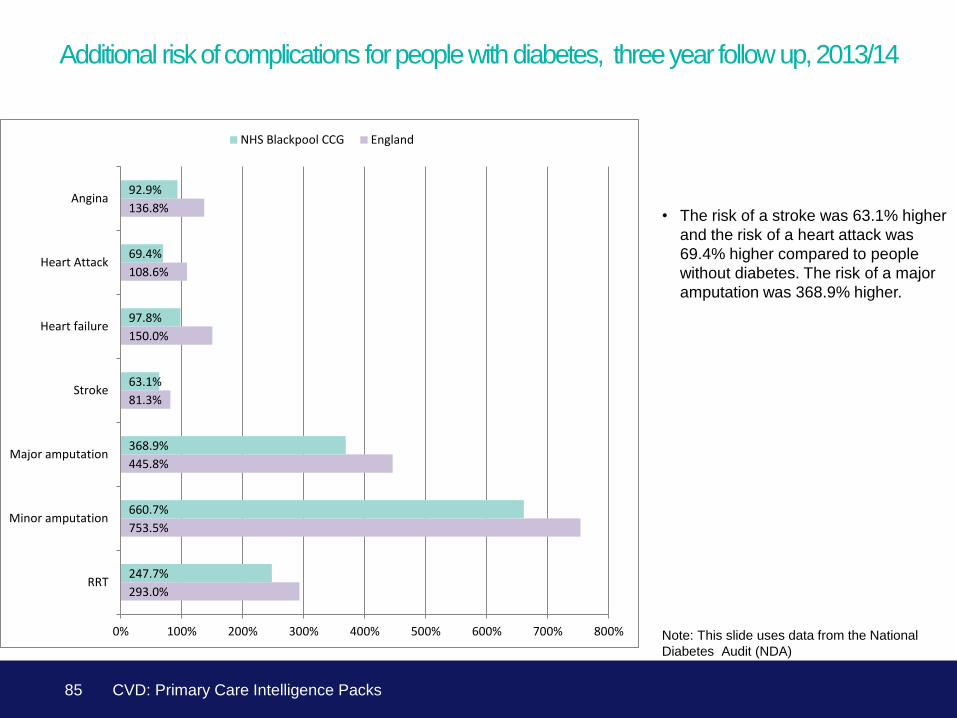
293.0%
753.5%
445.8%
81.3%
150.0%
108.6%
136.8%
247.7%
660.7%
368.9%
63.1%
97.8%
69.4%
92.9%
0% 100% 200% 300% 400% 500% 600% 700% 800%
RRT
Minor amputation
Major amputation
Stroke
Heart failure
Heart Attack
Angina
NHS Blackpool CCG England
85
Additional risk of complications for people with diabetes, three year follow up, 2013/14
Note: This slide uses data from the National
Diabetes Audit (NDA)
• The risk of a stroke was 63.1% higher
and the risk of a heart attack was
69.4% higher compared to people
without diabetes. The risk of a major
amputation was 368.9% higher.
CVD: Primary Care Intelligence Packs
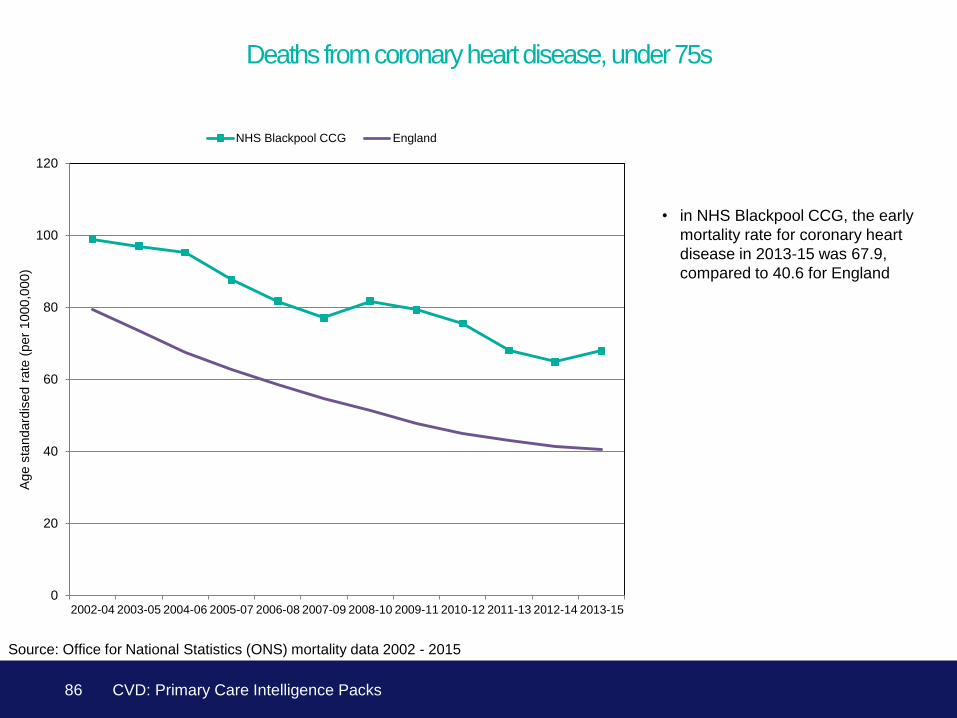
0
20
40
60
80
100
120
2002-04 2003-05 2004-06 2005-07 2006-08 2007-09 2008-10 2009-11 2010-12 2011-13 2012-14 2013-15
Ag
e s
tand
ard
ise
d r
ate
(p
er
100
0,0
00
)
NHS Blackpool CCG England
86
Deaths from coronary heart disease, under 75s
Source: Office for National Statistics (ONS) mortality data 2002 - 2015
• in NHS Blackpool CCG, the early
mortality rate for coronary heart
disease in 2013-15 was 67.9,
compared to 40.6 for England
CVD: Primary Care Intelligence Packs
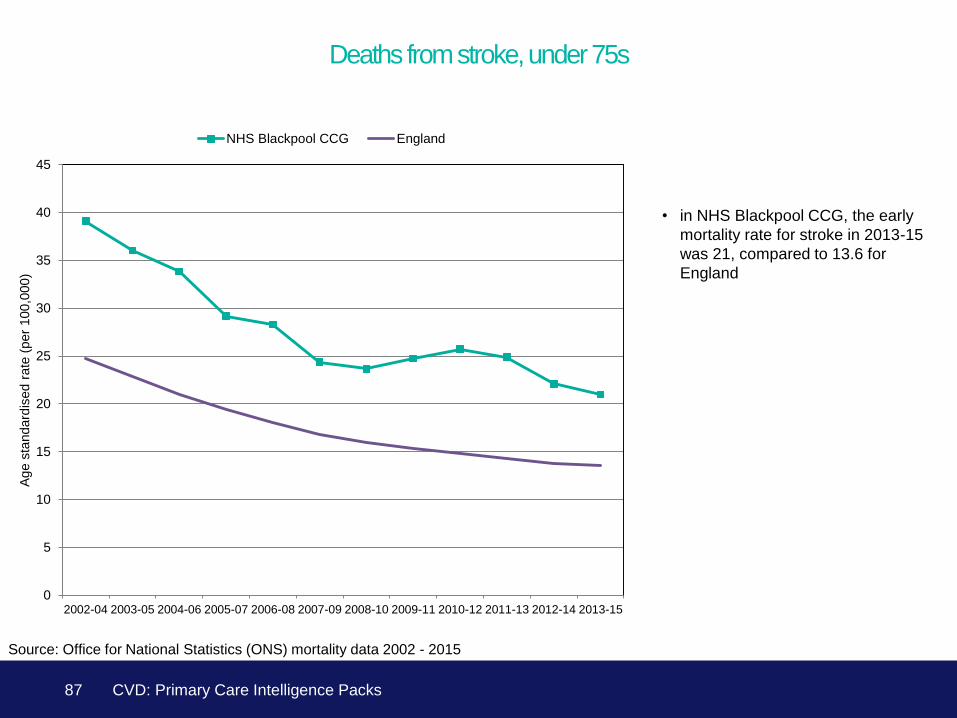
0
5
10
15
20
25
30
35
40
45
2002-04 2003-05 2004-06 2005-07 2006-08 2007-09 2008-10 2009-11 2010-12 2011-13 2012-14 2013-15
Ag
e s
tand
ard
ise
d r
ate
(p
er
100
,00
0)
NHS Blackpool CCG England
87
Deaths from stroke, under 75s
Source: Office for National Statistics (ONS) mortality data 2002 - 2015
• in NHS Blackpool CCG, the early
mortality rate for stroke in 2013-15
was 21, compared to 13.6 for
England
CVD: Primary Care Intelligence Packs
88
Appendix Data sources
• Quality and Outcomes Framework (QOF), 2015/16, Copyright © 2016, re-used with the permission of NHS Digital. All rights
reserved
• Non-diabetic hyperglycaemia prevalence estimates, NCVIN, PHE: https://www.gov.uk/government/publications/nhs-diabetes-
prevention-programme-non-diabetic-hyperglycaemia
• Diabetes prevalence estimates, NCVIN, PHE: https://www.gov.uk/government/publications/diabetes-prevalence-estimates-for-
local-populations
• CKD Prevalence model, G.Aitken, University of Southampton , 2014 https://www.gov.uk/government/publications/ckd-
prevalence-estimates-for-local-and-regional-populations
• Hypertension prevalence estimates for local CCG populations. Created using data from: QOF hypertension registers 2014/15
and; Undiagnosed hypertension estimates for adults 16 years and older. 2014. Department of Primary Care & Public Health,
Imperial College London https://www.gov.uk/government/publications/hypertension-prevalence-estimates-for-local-populations
• NHS Stop smoking services Copyright © 2014, NHS Digital
• Norberg J, Bäckström S , Jansson J-H, Johansson L. Estimating the prevalence of atrial fibrillation in a general population
using validated electronic health data. Clin Epidemiol 2013 ; 5 475 – 81.
• National Diabetes Audit, 2013/14 and 2015/16, Copyright © 2016, re-used with the permission of NHS Digital. All rights
reserved
• Hospital Episode Statistics (HES), 2002/03 - 2015/16, Copyright © 2017, Re‐used with the permission of NHS Digital. All rights
reserved
• Office for National Statistics (ONS) mortality data 2002 – 2015, Copyright © 2017, Re-used with the permission of the Office for
National Statistics. All rights reserved
CVD: Primary Care Intelligence Packs
89
Public Health England exists to protect and improve the nation’s health and wellbeing, and reduce health inequalities.
We do this through world-class science, knowledge and intelligence, advocacy, partnerships and the delivery of
specialist public health services. We are an executive agency of the Department of Health, and are a distinct delivery
organisation with operational autonomy to advise and support government, local authorities and the NHS in a
professionally independent manner.
Public Health England
Wellington House
133-155 Waterloo Road
London SE1 8UG
Tel: 020 7654 8000
www.gov.uk/phe
Twitter: @PHE_uk
Facebook: www.facebook.com/PublicHealthEngland
© Crown copyright 2017
You may re-use this information (excluding logos) free of charge in any format or medium, under the terms of the Open
Government Licence v3.0. To view this licence, visit OGL or email [email protected]. Where we have
identified any third party copyright information you will need to obtain permission from the copyright holders concerned.
Published June 2017
Gateway number 2017095
About Public Health England


