CVEEN 4410 Hydrology Homework 1 Spring 2013 Page 1 Problem 1: Rainfall Averaging (8 pts) Using the following watershed and gage precipitation depths, find the average rainfall over the entire watershed. Use the following methods: A. averaging (1 pt) B. Thiessen polygon (3 pts) C. Isohyetal (3 pts). Which method is likely the most accurate? (1 pt) SOLUTION Averaging Gage Depth (in) B 2.02 C 2.10 D 2.88 E 2.94 average 2.49 Thiessen Gage Depth (in) Area area/total area Area Frac * Precip A 1.49 8 0.03 0.04 B 2.02 47 0.18 0.36 C 2.10 75 0.28 0.59 D 2.88 37 0.14 0.40 E 2.94 96 0.36 1.06 Gage Depth (in) A 1.49 B 2.02 C 2.10 D 2.88 E 2.94 F 4.21 If the student used all of the rain gages, it is acceptable.
Transcript
CVEEN 4410 Hydrology Homework 1
Spring 2013 Page 1
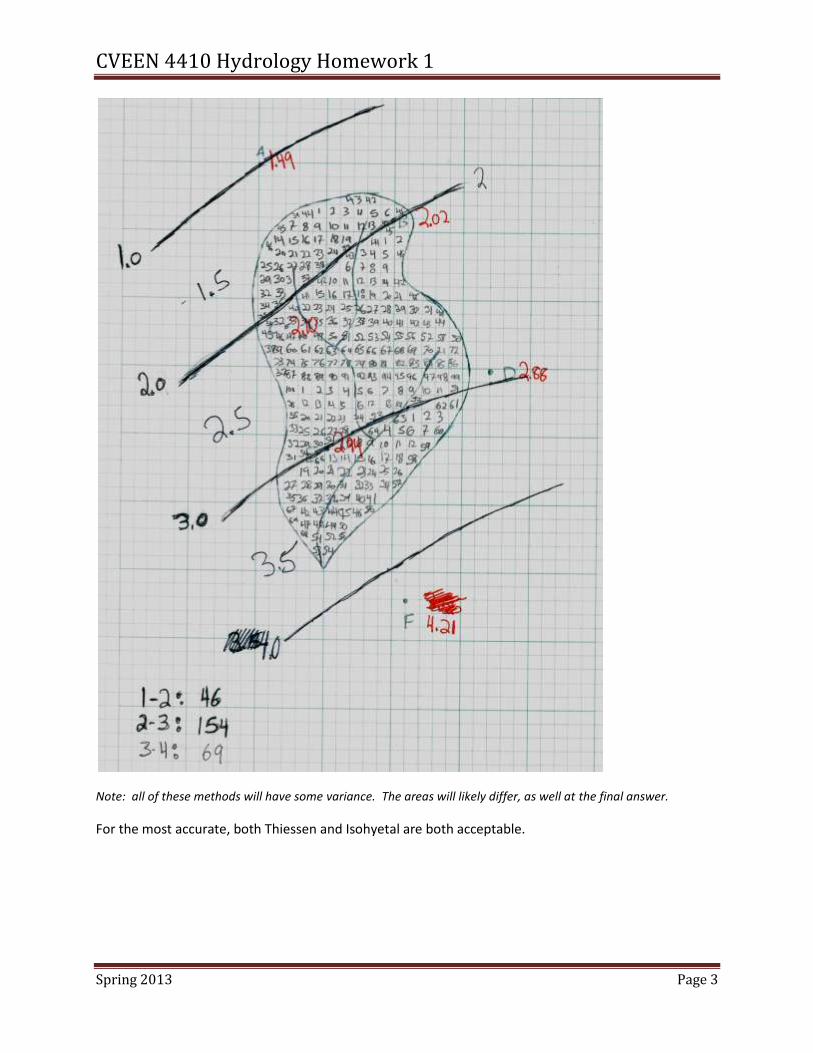
Problem 1: Rainfall Averaging (8 pts) Using the following watershed and gage precipitation depths, find the average rainfall over the entire
watershed. Use the following methods:
A. averaging (1 pt)
B. Thiessen polygon (3 pts)
C. Isohyetal (3 pts).
Which method is likely the most accurate? (1 pt)
SOLUTION
Averaging
Gage Depth (in)
B 2.02
C 2.10
D 2.88
E 2.94
average 2.49
Thiessen
Gage Depth (in) Area area/total area
Area Frac * Precip
A 1.49 8 0.03 0.04
B 2.02 47 0.18 0.36
C 2.10 75 0.28 0.59
D 2.88 37 0.14 0.40
E 2.94 96 0.36 1.06
Gage Depth (in)
A 1.49
B 2.02
C 2.10
D 2.88
E 2.94
F 4.21
If the student used all of
the rain gages, it is
acceptable.
CVEEN 4410 Hydrology Homework 1
Spring 2013 Page 2
F 4.21 3 0.01 0.05
Total 266 1.00 2.50
Isohyetal
depth area area/total area
Area Frac * Precip
1.5 46 0.17 0.26
2.5 154 0.57 1.43
3.5 69 0.26 0.90
269 1.00 2.59
CVEEN 4410 Hydrology Homework 1
Spring 2013 Page 3
Note: all of these methods will have some variance. The areas will likely differ, as well at the final answer.
For the most accurate, both Thiessen and Isohyetal are both acceptable.
CVEEN 4410 Hydrology Homework 1
Spring 2013 Page 4
Problem 2: Moisture Relationships Related to Precipitation (8 pts) Use the saturation vapor pressure equation listed below to complete the following exercises:
Make a plot of saturation vapor pressure versus temperature, for temperatures ranging from -30°C –
50°C. Use the plot (2 pts) to answer the following questions.
A. Which of the following samples of air are saturated? (2 pts)
a. T = 20°C, P = 10 mb
b. T = 20°C, P = 25 mb
c. T = 37°C, P = 60 mb
d. T = 15°C, P = 18 mb
B. Given a sample of air at T = 30°C and P = 20 mb, what are the: (2 pts)
a. Dew Point
b. Saturation Vapor Pressure
C. Repeat part B for the following sample of air: T = 10°, P = 20 mb (2 pts)
SOLUTION
Part A:
0
20
40
60
80
100
120
140
-40 -30 -20 -10 0 10 20 30 40 50 60
e(s
) =W
ate
r V
apo
r P
ress
ure
(m
b)
Temp (C)
Saturation Vapor Pressure vs. Temp temp C e(s)
-30 0.509021
-20 1.255143
-10 2.86402
0 6.105834
10 12.26035
20 23.34634
30 42.40596
40 73.84191
50 123.8013
CVEEN 4410 Hydrology Homework 1
Spring 2013 Page 5
For Parts A-C see the plot below with annotations.
All points below the line are un-saturated, the points on the line are saturated, and points above the line
are over-saturated.
Saturated samples are: b & d
Part B:
Dew Point ~= 18°C; Sat vapor pressure = 42.4 mb
Part C:
Dew Point ~= 18°C; Sat vapor pressure = 12.3 mb
Problem 3: Reading IDF curves (10 pts) Use NOAA Atlas 14 to find the following rainfall intensities: (4 pts)
A. Utah, Hogle Zoo, 10 year, 12 hour
B. Utah, Manti, 2 year, 2 hour
C. Utah, Price, 100 year, 24 hour
CVEEN 4410 Hydrology Homework 1
Spring 2013 Page 6
D. Utah, Moab, 2 year, 15 minute
Which of the above storms could be used as a SCS design storm? (1 pt)
What would be the storms total volume of rain for the Moab storm above? (1 pt)
Use TP-40 to find the rainfall depth for the following storms: (4 pts)
A. Texas, Houston, 50 year, 1 hour
B. Texas Houston, 1 year, 3 hour
C. Maine, Augusta, 100 year, 24 hour
D. Maine, Augusta, 1 year, 30 minute
SOLUTION
Intensities:
A. 0.153 in/hr
B. 0.264 in/hr
CVEEN 4410 Hydrology Homework 1
Spring 2013 Page 7
C. 0.097 in/hr
D. 1.02 in/hr
The Price 24 hour storm could be used for SCS.
Total volume rain for Moab = 1.02 in/hr(15/60 hr) = 0.255 in
Depths
A. ~4.3 in
B. ~2.7 in
CVEEN 4410 Hydrology Homework 1
Spring 2013 Page 8
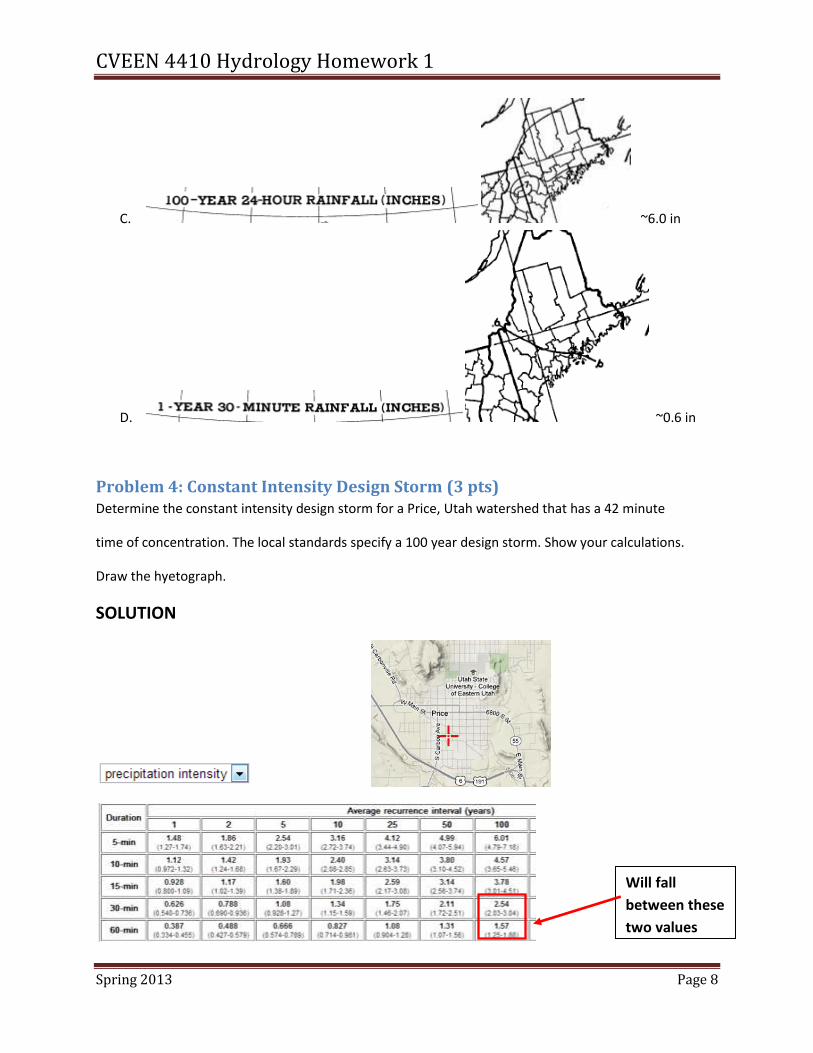
C. ~6.0 in
D. ~0.6 in
Problem 4: Constant Intensity Design Storm (3 pts) Determine the constant intensity design storm for a Price, Utah watershed that has a 42 minute
time of concentration. The local standards specify a 100 year design storm. Show your calculations.
Draw the hyetograph.
SOLUTION
Will fall
between these
two values
CVEEN 4410 Hydrology Homework 1
Spring 2013 Page 9
Intensity ~= 2.0 in/hr
Problem 5: SCS Design Storm (5 pts) Determine the 8 hour, 50 year design storm using the SCS dimensionless hyetograph procedure for a
detention basin design project in St George. Use the Type 2 storm hyetograph shown below. Turn in
your table (3 pts) and hyetograph (2 pts). Use a bar plot for the hyetograph.
Time Type II Time Type II Time Type II Time Type II Time Type II


![Power system planning & operation [eceg 4410]](https://static.documents.pub/doc/80x56/55956e6c1a28ab800c8b464a/power-system-planning-operation-eceg-4410.jpg)


