toxins Article Cyanobacterial Abundance and Microcystin Profiles in Two Southern British Lakes: The Importance of Abiotic and Biotic Interactions David M. Hartnell 1,2, *, Ian J. Chapman 2,3 , Nick G. H. Taylor 1 , Genoveva F. Esteban 2 , Andrew D. Turner 1 and Daniel J. Franklin 2 1 The Centre for Environment, Fisheries and Aquaculture Science (Cefas), The Nothe, Barrack Road, Weymouth, Dorset DT4 8UB, UK; [email protected] (N.G.H.T.); [email protected] (A.D.T.) 2 Centre for Ecology, Environment and Sustainability, Faculty of Science & Technology, Bournemouth University, Fern Barrow, Poole, Dorset BH12 5BB, UK; [email protected] (I.J.C.); [email protected] (G.F.E.); [email protected] (D.J.F.) 3 New South Wales Shellfish Program, NSW Food Authority, Taree 2430, Australia * Correspondence: [email protected]; Tel.: +44-1305-206600 Received: 5 June 2020; Accepted: 30 July 2020; Published: 5 August 2020 Abstract: Freshwater cyanobacteria blooms represent a risk to ecological and human health through induction of anoxia and release of potent toxins; both conditions require water management to mitigate risks. Many cyanobacteria taxa may produce microcystins, a group of toxic cyclic heptapeptides. Understanding the relationships between the abiotic drivers of microcystins and their occurrence would assist in the implementation of targeted, cost-effective solutions to maintain safe drinking and recreational waters. Cyanobacteria and microcystins were measured by flow cytometry and liquid chromatography coupled to tandem mass spectrometry in two interconnected reservoirs varying in age and management regimes, in southern Britain over a 12-month period. Microcystins were detected in both reservoirs, with significantly higher concentrations in the southern lake (maximum concentration >7 μgL -1 ). Elevated microcystin concentrations were not positively correlated with numbers of cyanobacterial cells, but multiple linear regression analysis suggested temperature and dissolved oxygen explained a significant amount of the variability in microcystin across both reservoirs. The presence of a managed fishery in one lake was associated with decreased microcystin levels, suggestive of top down control on cyanobacterial populations. This study supports the need to develop inclusive, multifactor holistic water management strategies to control cyanobacterial risks in freshwater bodies. Keywords: flow cytometry; liquid chromatography coupled to tandem mass spectrometry (LC-MS/MS); cyanotoxins; risk assessment; management strategies; modelling Key Contribution: In two similar lakes, microcystin levels and cyanobacterial communities were significantly different; one interesting observation was the introduced omnivorous fish, which appeared to reduce toxin levels in one lake. 1. Introduction Cyanobacteria blooms are a global problem in freshwater ecosystems [1–3]. A range of factors have been reported to influence the abundance and likelihood of bloom formation in freshwater systems, notably increased temperature, and nutrient enrichment [4–7]. A proportion estimated as between 40–70%, of cyanobacteria blooms are reported to occur concomitantly with elevated levels of cyanobacterial toxins (microcystins) [8–10]. Microcystins are known to be responsible for toxic events Toxins 2020, 12, 503; doi:10.3390/toxins12080503 www.mdpi.com/journal/toxins
Transcript
toxins
Article
Cyanobacterial Abundance and Microcystin Profilesin Two Southern British Lakes: The Importance ofAbiotic and Biotic Interactions
David M. Hartnell 1,2,*, Ian J. Chapman 2,3, Nick G. H. Taylor 1, Genoveva F. Esteban 2,Andrew D. Turner 1 and Daniel J. Franklin 2
1 The Centre for Environment, Fisheries and Aquaculture Science (Cefas), The Nothe, Barrack Road,Weymouth, Dorset DT4 8UB, UK; [email protected] (N.G.H.T.); [email protected] (A.D.T.)
2 Centre for Ecology, Environment and Sustainability, Faculty of Science & Technology, BournemouthUniversity, Fern Barrow, Poole, Dorset BH12 5BB, UK; [email protected] (I.J.C.);[email protected] (G.F.E.); [email protected] (D.J.F.)
3 New South Wales Shellfish Program, NSW Food Authority, Taree 2430, Australia* Correspondence: [email protected]; Tel.: +44-1305-206600
Received: 5 June 2020; Accepted: 30 July 2020; Published: 5 August 2020�����������������
Abstract: Freshwater cyanobacteria blooms represent a risk to ecological and human health throughinduction of anoxia and release of potent toxins; both conditions require water management to mitigaterisks. Many cyanobacteria taxa may produce microcystins, a group of toxic cyclic heptapeptides.Understanding the relationships between the abiotic drivers of microcystins and their occurrencewould assist in the implementation of targeted, cost-effective solutions to maintain safe drinking andrecreational waters. Cyanobacteria and microcystins were measured by flow cytometry and liquidchromatography coupled to tandem mass spectrometry in two interconnected reservoirs varyingin age and management regimes, in southern Britain over a 12-month period. Microcystins weredetected in both reservoirs, with significantly higher concentrations in the southern lake (maximumconcentration >7 µg L−1). Elevated microcystin concentrations were not positively correlated withnumbers of cyanobacterial cells, but multiple linear regression analysis suggested temperatureand dissolved oxygen explained a significant amount of the variability in microcystin across bothreservoirs. The presence of a managed fishery in one lake was associated with decreased microcystinlevels, suggestive of top down control on cyanobacterial populations. This study supports the needto develop inclusive, multifactor holistic water management strategies to control cyanobacterial risksin freshwater bodies.
Keywords: flow cytometry; liquid chromatography coupled to tandem mass spectrometry (LC-MS/MS);cyanotoxins; risk assessment; management strategies; modelling
Key Contribution: In two similar lakes, microcystin levels and cyanobacterial communitieswere significantly different; one interesting observation was the introduced omnivorous fish,which appeared to reduce toxin levels in one lake.
1. Introduction
Cyanobacteria blooms are a global problem in freshwater ecosystems [1–3]. A range of factorshave been reported to influence the abundance and likelihood of bloom formation in freshwatersystems, notably increased temperature, and nutrient enrichment [4–7]. A proportion estimated asbetween 40–70%, of cyanobacteria blooms are reported to occur concomitantly with elevated levels ofcyanobacterial toxins (microcystins) [8–10]. Microcystins are known to be responsible for toxic events
globally, most frequently reported are wild animal, livestock, and pet deaths with numerous accountsin the literature, from both more and less economically developed nations [8,11–14].
In most countries, control plans for public health risks associated with exposure to cyanobacterialtoxins are based on assessments of cyanobacterial cell presence and density in the event of bloomformation. In the United Kingdom, assessments and management recommendations are made bynational agencies (the Environment Agency (EA) in England and the Scottish Environmental ProtectionAgency (SEPA) in Scotland). In both administrations, samples are collected reactively from the watercolumn in response to visual bloom occurrence and cyanobacterial are identified to genus level andcells are counted microscopically to determine the cell density in terms of number of cells per millilitreof water. Samples containing >20,000 cells mL−1 trigger actions such as preventative closures orrestrictions on usage. The presence of cyanobacterial scums on the water surface automatically indicatesthe need for responsive action, as scum formation is known to increase the likelihood of adverse healtheffects by factors of up to 1000 [15] and, in the UK, would typically result in measures to preventexposure of humans and animals [16]. Systematic, or risk-based routine monitoring of water bodiesfor cyanobacteria is not undertaken in the UK; consequently the incidence, intensity and seasonalityof cyanobacterial blooms is not well known [10,17]. Furthermore, whilst the presence of elevatedcyanobacterial cells enables identification of potential risks, toxin production during blooms formationis not certain [8,15]. Turner et al. [10] found that only 18% of samples containing cyanobacterial cellsexceeding action state thresholds contained microcystins above the WHO medium health criterionof 20 µg L−1 in freshwater bodies in England. Therefore, management actions driven by elevatedcyanobacterial cell counts may be unnecessary when blooms are formed from non-toxic species andmay have unnecessary detrimental economic impacts. Figure 1 shows the occurrence and magnitudedata combined with that of Turner et al. [10]; all data were collected in 2016.
Figure 1. Occurrence and magnitude of total microcystins recorded from England and Wales in 2016.(red: >100 µg/L; orange: 20–100 µg/L; yellow: 2–20 µg/L; green: <2 µg/L). Insert, microcystin data andlocation of the study site, Longham Lakes, Bournemouth, Dorset, UK. (adapted from Turner et al. [10]).
Few studies have examined the prevalence and levels of microcystin toxins and variants globally.In the European Multi-Lake Survey, toxin profile data from 26 European countries from lakes with
Toxins 2020, 12, 503 3 of 15
a history of eutrophication were analysed, together with environmental parameters. The authorsreported direct and indirect effect of temperature on toxin concentrations and profiles, concluding thatwhilst few geographical patterns could be discerned, increasing lake temperatures could drive changesin the distribution of cyanobacterial toxins, possibly selecting for a few toxic species [18]. In a studyon the array of microcystins during cyanobacterial blooms in Lake Victoria, Tanzania, East Africa,Miles et al. [19] reported a distinctive, complex toxin profile signature during bloom events whichhas also been confirmed in Ugandan and Kenyan regions of Lake Victoria [19,20]. In a systematicstudy to assess microcystins in freshwater lakes in England, Turner et al. [10] revealed complextoxin profiles with occurrence of toxin clusters unrelated to cyanobacterial species and no correlationwith environmental parameters. These data are suggestive of complex ecosystems, with levels andsignatures of microcystin and variants potentially influenced by geographical range but with theimpact of environmental factors unclear.
It has been reported that light intensity, temperature, nutrients, and hydrodynamics influencethe occurrence and density of cyanobacterial blooms [8,21]. Several studies have attempted to modelcyanobacterial concentrations using meteorological, hydrological, and environmental parameters [21–25].In most studies, the predictive ability of models with respect to risk management has been limitednot least because the relationship between the presence and increase in cyanobacterial cells is notalways correlated with an increase in the occurrence of toxins [10,26,27]. Notwithstanding this,Carvalho et al. [24] demonstrated that statistical models applied to phytoplankton data from 134 lakesin the UK could be used to describe lakes that may be susceptible to cyanobacterial blooms events. It isevident that understanding the key environmental drivers that favour cyanobacterial abundance andpotentially toxic events would facilitate proactive rather than reactive monitoring and managementstrategies to reduce the public and animal health risks.
In this study, two freshwater reservoirs were routinely monitored by light microscopy,flow cytometry, and liquid chromatography coupled to tandem mass spectrometry over a 12-monthperiod. Measurements of cyanobacterial cells and a range of biological and chemical factors wereexamined to explore the potential of providing a predictive tool for water management.
2. Results
Water measurements and samples were collected and analysed from the May 16, 2016 until May31, 2017. As stratification was not observed, the data from each depth were combined to produce anaverage for each measurement at the time of sampling, except for turbidity (NTU), where the lakebottom measurement was disregarded due to sediment disturbance from the horizontal sampler.
2.1. Study Site
Longham Lakes consists of two freshwater reservoirs, used as a nature reserve and recreationalfishery within the borough boundaries of Bournemouth (Figures 1 and 2). The two lakes located atnational grid reference SZ 06237 98079 are man-made, fed by the River Stour and provide an auxiliarywater supply to the Bournemouth-Poole conurbation. The northern lake was completed in 2003, has aperimeter of 1400 m, and an area of 97,000 m2. The southern lake is connected to the northern lake;it was completed in 2010, has a perimeter of 2050 m, and an area of 250,000 m2. The maximum depthfor both lakes is approximately 14 m and they both have an average depth of 2.9 m. Longham Lakesis managed by Bournemouth Water, which is part of South West Water. Lake water chemistry andphytoplankton are constantly monitored, and weekly water samples are taken.
2.2. Chemical and Biological Parameters
Table 1 shows data collected over the 12-month study period, mean, medium, maxima and minimafor total microcystins, Microcystis cells, phycocyanin fluorescence, temperature, turbidity, dissolvedoxygen, pH, chlorophyll a, b and total carotenoids are given for the two lakes. A null hypothesis thatno differences between biological and chemical measurements were observable between the two lakes
Toxins 2020, 12, 503 4 of 15
was tested at the p = 0.05 significance level using a series of Student’s t-tests. No significant differencesbetween temperature, pH, or turbidity were observed between the two lakes over the study period(p > 0.05); however, significant and highly significant differences between the two lakes across thesampling period were observed for dissolved oxygen (p < 0.001), chlorophyll a and b levels (p < 0.01,p < 0.001), and carotenoids (p < 0.001) with dissolved oxygen demonstrating the most differencebetween lakes.
Figure 2. Aerial view of Longham Lakes with sampling point marked by arrows in Lake 1 (northern)and Lake 2 (southern).
Table 1. Biological and chemical measurements from Longham Lakes 1 and 2, between 16 May 2016and 31 May 2017.
Parameter Lake 1 (Northern) Lake 2 (Southern) Student
Chlorophyll a (mg mL−1) 0.44 3.821 2.398 15.373 0.042 1.315 0.969 4.056 p < 0.01Chlorophyll b (mg mL−1) 0.41 2.296 2.206 6.752 nd 1.294 1.143 4.367 p < 0.001
Total Carotenoids (mg mL−1) nd 1.200 0.676 6.295 nd 0.260 0.135 1.467 p < 0.0011 Limit of detection (LOD) for MC-LR = 0.0013 ± 0.0011 ng mL−1 [10].
Toxins 2020, 12, 503 5 of 15
2.3. Identification and Enumeration of Phytoplankton by Light Microscopy
A wide range of phytoplankton genera were identified in both lakes between August 2016 andMay 2017, a number of chlorophytes and diatoms were only identified to the class level. Microcystis cellswere recorded in both lakes, maximum >7000 (lake 1) & >8000 cells mL−1 (lake 2); other cyanobacteriaincluded Anabaena, maximum >34,000 (lake 1) & >21,000 cells mL−1 (lake 2), Aphanizomenon, maximum>2500 (lake 1) & >20,000 cells mL−1 (lake 2), and Oscillatoria, maximum >6000 cells mL−1 (lake 1 & 2).The non-cyanobacteria identified were Asterionella, Euglena, Pediastrum, Scenedesmus, Tabellaria, andVolvox (Figure 3). No correlation was found between cyanobacteria identified and counted by eitherlight microscopy or flow cytometry with microcystins detected (data not shown).
Figure 3. Stacked bar chart showing the date, number, and taxa of phytoplankton identified in LonghamLakes 1 & 2 by light microscope.
2.4. Comparison of Counts of Microcystis Cells by Flow Cytometry and Microscopic Method
In both lakes, counts of Microcystis cells by flow cytometry were consistently higher and no zerocounts were registered as compared to counts by light microscope (Figure 4). A strong correlationbetween the two methods was observed in lake 1 when tested with a Pearson product momentcorrelation (PC = 0.763, p = 0.001), but correlation was not observed between the two methods in lake 2(PC = −0.048, p = 0.864).
2.5. Determination of Microcystis Cells and Microcystin Concentrations
Figure 5 shows the Microcystis cells and total microcystins measured over the study period at bothlakes. Microcystis cells were detected in both lakes by flow cytometry throughout the sampling period,increasing in July/August in lake 1 and in August in lake 2. An order of magnitude more Microcystiscells were detected in lake 1 than lake 2. Mean Microcystis cells in lake 1 were 6874 mL−1 with a medianof 2826 and range of 251 (23 May2016) to 51,384 mL−1 (14 July2016). In Lake 2, mean Microcystis
Toxins 2020, 12, 503 6 of 15
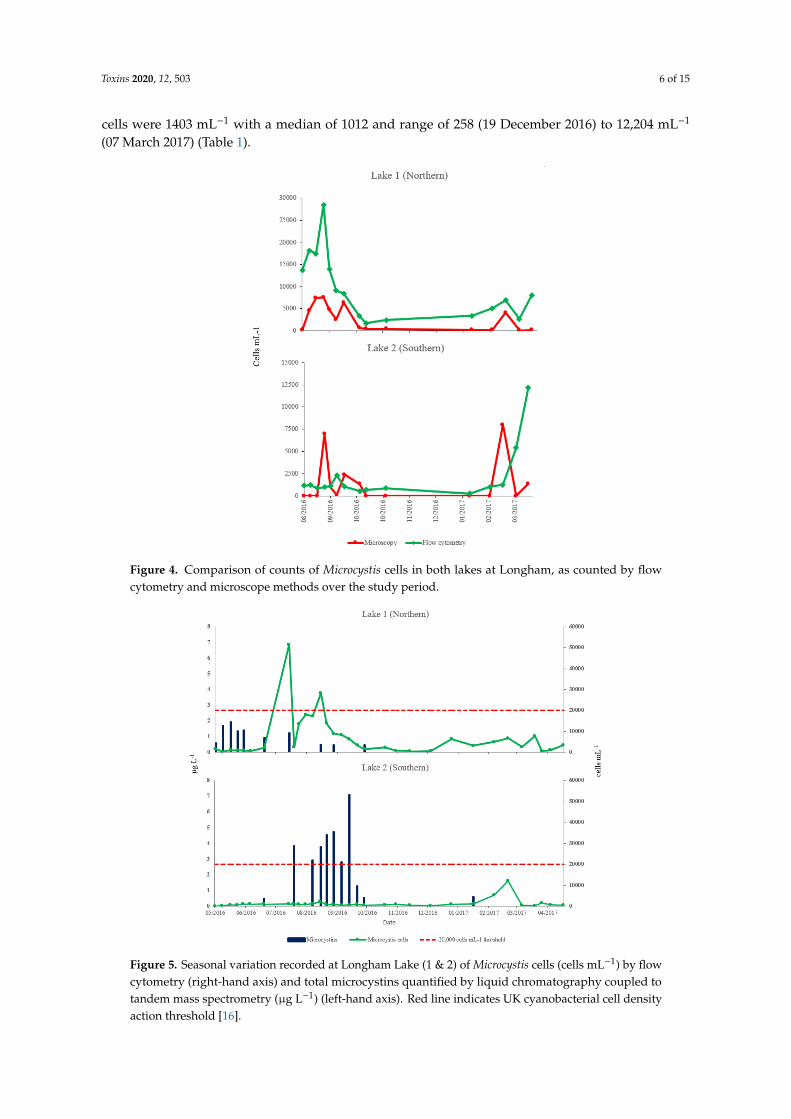
cells were 1403 mL−1 with a median of 1012 and range of 258 (19 December 2016) to 12,204 mL−1
(07 March 2017) (Table 1).
Figure 4. Comparison of counts of Microcystis cells in both lakes at Longham, as counted by flowcytometry and microscope methods over the study period.
Figure 5. Seasonal variation recorded at Longham Lake (1 & 2) of Microcystis cells (cells mL−1) by flowcytometry (right-hand axis) and total microcystins quantified by liquid chromatography coupled totandem mass spectrometry (µg L−1) (left-hand axis). Red line indicates UK cyanobacterial cell densityaction threshold [16].
Toxins 2020, 12, 503 7 of 15
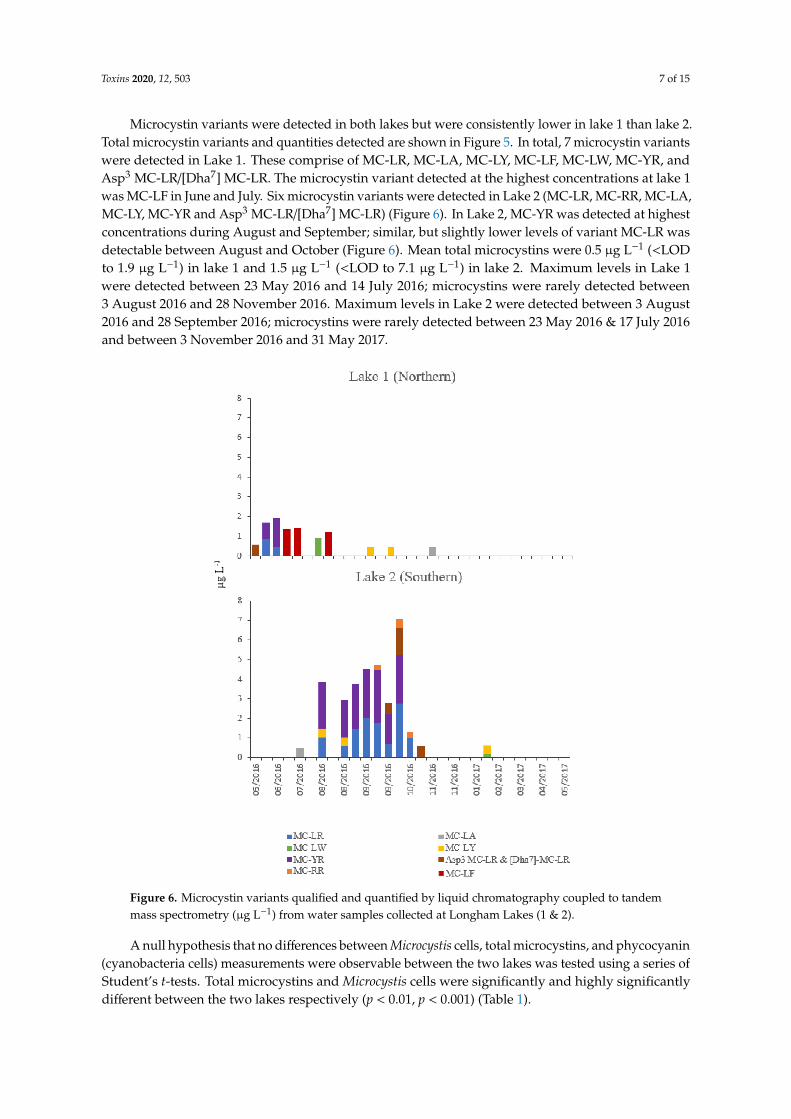
Microcystin variants were detected in both lakes but were consistently lower in lake 1 than lake 2.Total microcystin variants and quantities detected are shown in Figure 5. In total, 7 microcystin variantswere detected in Lake 1. These comprise of MC-LR, MC-LA, MC-LY, MC-LF, MC-LW, MC-YR, andAsp3 MC-LR/[Dha7] MC-LR. The microcystin variant detected at the highest concentrations at lake 1was MC-LF in June and July. Six microcystin variants were detected in Lake 2 (MC-LR, MC-RR, MC-LA,MC-LY, MC-YR and Asp3 MC-LR/[Dha7] MC-LR) (Figure 6). In Lake 2, MC-YR was detected at highestconcentrations during August and September; similar, but slightly lower levels of variant MC-LR wasdetectable between August and October (Figure 6). Mean total microcystins were 0.5 µg L−1 (<LODto 1.9 µg L−1) in lake 1 and 1.5 µg L−1 (<LOD to 7.1 µg L−1) in lake 2. Maximum levels in Lake 1were detected between 23 May 2016 and 14 July 2016; microcystins were rarely detected between3 August 2016 and 28 November 2016. Maximum levels in Lake 2 were detected between 3 August2016 and 28 September 2016; microcystins were rarely detected between 23 May 2016 & 17 July 2016and between 3 November 2016 and 31 May 2017.
Figure 6. Microcystin variants qualified and quantified by liquid chromatography coupled to tandemmass spectrometry (µg L−1) from water samples collected at Longham Lakes (1 & 2).
A null hypothesis that no differences between Microcystis cells, total microcystins, and phycocyanin(cyanobacteria cells) measurements were observable between the two lakes was tested using a series ofStudent’s t-tests. Total microcystins and Microcystis cells were significantly and highly significantlydifferent between the two lakes respectively (p < 0.01, p < 0.001) (Table 1).
Toxins 2020, 12, 503 8 of 15
2.6. The Ability of Chemical and Biological Parameters to Predict Presence of Microcystins
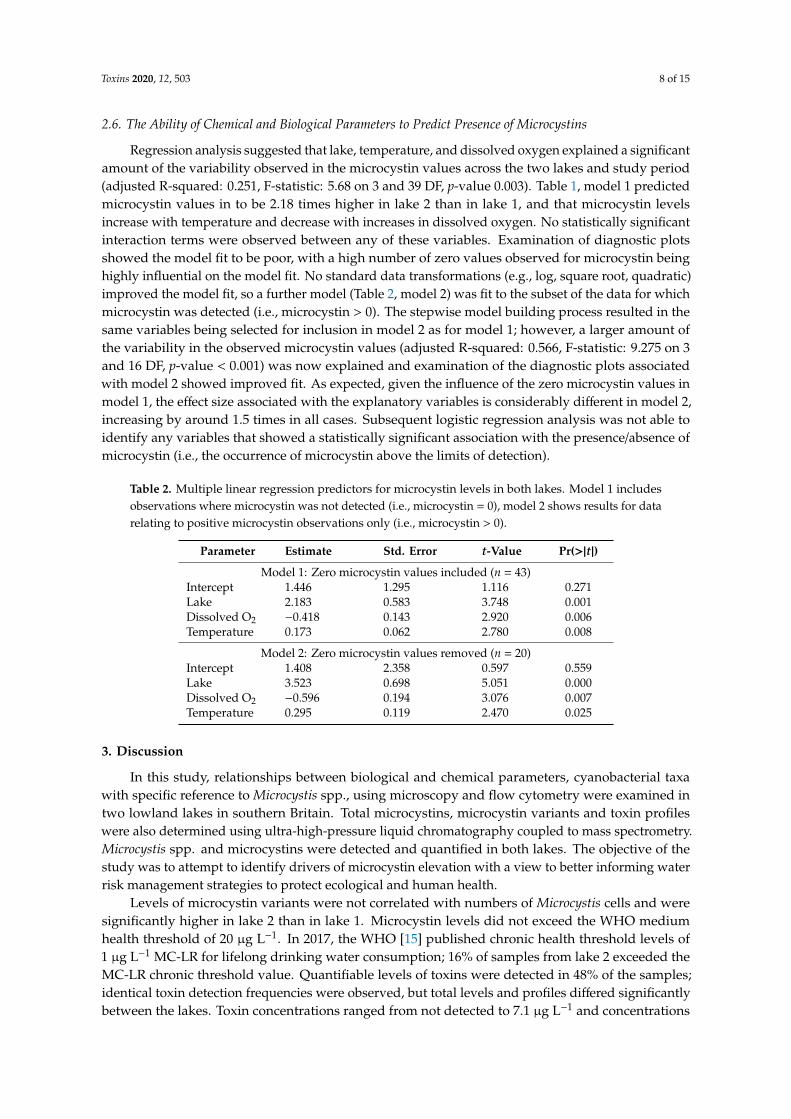
Regression analysis suggested that lake, temperature, and dissolved oxygen explained a significantamount of the variability observed in the microcystin values across the two lakes and study period(adjusted R-squared: 0.251, F-statistic: 5.68 on 3 and 39 DF, p-value 0.003). Table 1, model 1 predictedmicrocystin values in to be 2.18 times higher in lake 2 than in lake 1, and that microcystin levelsincrease with temperature and decrease with increases in dissolved oxygen. No statistically significantinteraction terms were observed between any of these variables. Examination of diagnostic plotsshowed the model fit to be poor, with a high number of zero values observed for microcystin beinghighly influential on the model fit. No standard data transformations (e.g., log, square root, quadratic)improved the model fit, so a further model (Table 2, model 2) was fit to the subset of the data for whichmicrocystin was detected (i.e., microcystin > 0). The stepwise model building process resulted in thesame variables being selected for inclusion in model 2 as for model 1; however, a larger amount ofthe variability in the observed microcystin values (adjusted R-squared: 0.566, F-statistic: 9.275 on 3and 16 DF, p-value < 0.001) was now explained and examination of the diagnostic plots associatedwith model 2 showed improved fit. As expected, given the influence of the zero microcystin values inmodel 1, the effect size associated with the explanatory variables is considerably different in model 2,increasing by around 1.5 times in all cases. Subsequent logistic regression analysis was not able toidentify any variables that showed a statistically significant association with the presence/absence ofmicrocystin (i.e., the occurrence of microcystin above the limits of detection).
Table 2. Multiple linear regression predictors for microcystin levels in both lakes. Model 1 includesobservations where microcystin was not detected (i.e., microcystin = 0), model 2 shows results for datarelating to positive microcystin observations only (i.e., microcystin > 0).
Parameter Estimate Std. Error t-Value Pr(>|t|)
Model 1: Zero microcystin values included (n = 43)Intercept 1.446 1.295 1.116 0.271Lake 2.183 0.583 3.748 0.001Dissolved O2 −0.418 0.143 2.920 0.006Temperature 0.173 0.062 2.780 0.008
In this study, relationships between biological and chemical parameters, cyanobacterial taxawith specific reference to Microcystis spp., using microscopy and flow cytometry were examined intwo lowland lakes in southern Britain. Total microcystins, microcystin variants and toxin profileswere also determined using ultra-high-pressure liquid chromatography coupled to mass spectrometry.Microcystis spp. and microcystins were detected and quantified in both lakes. The objective of thestudy was to attempt to identify drivers of microcystin elevation with a view to better informing waterrisk management strategies to protect ecological and human health.
Levels of microcystin variants were not correlated with numbers of Microcystis cells and weresignificantly higher in lake 2 than in lake 1. Microcystin levels did not exceed the WHO mediumhealth threshold of 20 µg L−1. In 2017, the WHO [15] published chronic health threshold levels of1 µg L−1 MC-LR for lifelong drinking water consumption; 16% of samples from lake 2 exceeded theMC-LR chronic threshold value. Quantifiable levels of toxins were detected in 48% of the samples;identical toxin detection frequencies were observed, but total levels and profiles differed significantlybetween the lakes. Toxin concentrations ranged from not detected to 7.1 µg L−1 and concentrations
Toxins 2020, 12, 503 9 of 15
were similar to those reported by several authors for waterbodies in the absence of scums in the LowerGreat Lakes [28], England, and Wales [10] and selected European water bodies [18].
In lake 1, total microcystins were approximately an order of magnitude lower than in lake 2,despite proportionally higher isolation frequencies and levels of Microcystis cells (lake 1, maximumdensity 51,384 cells mL−1). Microcystis cells did not exceed 8000 cells mL−1 in lake 2 and constituted arelatively minor fraction of the total estimates of cyanobacteria. It is probable that Microcystis cells atboth lakes were non-toxin producing strains and that toxins detected in this study were produced byspecies other than Microcystis. It is well documented that the Microcystis blooms vary in their toxinprofiles [10,15,29]. The ability for microcystin production in Microcystis spp. and other cyanobacterialspecies is genetically determined [30,31]. Several studies have reported that strains isolated fromgeographically and temporally distinct Microcystis spp. populations are clonal and therefore likelyto be either microcystin producers or non-producers [5,32]. The hypothesis that species other thanMicrocystis spp. were responsible for toxin production in the study lakes is supported by the presenceof other cyanobacteria, e.g., Anabaena spp., Aphanizomenon spp., and Oscillatoria spp. at elevated levelsparticularly in lake 2. At lake 2, on the 3 occasions where the UK threshold action limits were exceeded,less than 8.5% of the estimated cyanobacterial populations comprised Microcystis cells. In a reviewof cyanobacterial bloom taxa in the UK, Howard et al. [33] recorded that the dominant species inaddition to Microcystis spp., were Oscillatoria, Planktothrix, Anabaena, Pseudanabaena, and Gomphosphaeria.The dominance of these species amongst phytoplankton communities in samples from natural lakesand reservoirs has been subsequently confirmed in England and Wales [10,34] and Scotland [17].Anabaena spp., Aphanizomenon spp., and Oscillatoria spp., are well known as toxin-producing speciesand common members of phytoplanktonic communities [29].
Maximum total microcystin level recorded was in lake 2 (7.1 µg L−1), with mean levels in lake 1 of0.497 µg L−1 and 1.524 µg L−1 in lake 2. Total microcystins and Microcystis cells were significantly andhighly significantly different between the two lakes, respectively (total microcystins higher in lake 2;Microcystis spp. cells higher in lake 1). Of the multiple microcystin variants described, MC-LR hasbeen most extensively studied and is reported to be between 3 and 10 times more toxic than othermicrocystin congeners [28]. Analysis of the microcystin toxin profiles between the two study lakesindicated differences in variants, both in terms of variants, proportions, and levels. In lake 1, whererelatively low levels of microcystins were determined, MC-LR was detected at low levels (<1 µg L−1)and the dominant variant was the more hydrophobic MC-LF. This finding is in accordance with Turneret al. [10], who reported MC-LF as the highest mean proportion of profiles from Aphanizomenon sp.and Oscillatoria sp. in analyses of freshwater bodies in England and Wales. This adds some support tothe premise that Microcystis cells present in lake 1 were non-toxin producers. In lake 2, MC-YR was thedominant congener closely followed by MC-LR, with MC-RR and Asp3-MC-LR appearing towards theend of the period of toxin prevalence. Microcystin profiles determined in samples taken from weeklymonitoring during August and September were similar in relative proportions, indicating potentiallythat clonal or semi-clonal populations were responsible for toxin production. Similar data have beengenerated from studies in Greece [35], throughout Europe via the European Multi Lake Survey [18]and Finland [36], the latter associated with toxins produced by species of Anabaena. Whilst data on therelative proportions of microcystin variants as measured by LC-MS/MS are relatively sparse, levelsand variants of microcystins presented here are consistent with the recorded literature and can help tounravel the structure and function of cyanobacterial populations.
In recent years, many authors have studied the drivers for elevated cyanotoxin levels and/oroccurrence of cyanobacterial blooms in natural lakes, reservoirs [18,37–39], and aquaculture systems [40].In a large-scale study assessing the continental scale distribution of cyanotoxins across Europe,Mantzouki et al. [18] demonstrated that temperature (rather than nutrient availability or euphoticdepth) was generally responsible for distributional characteristics of cyanotoxins. Likewise, concordantobservations with respect to temperature were recorded by Elliot [39] in an assessment of climatechange on pelagic freshwater cyanobacteria. The author demonstrated increased relative cyanobacteria
Toxins 2020, 12, 503 10 of 15
abundance concurrently with increased water temperature, together with decreased flushing rates andincreased nutrient loading. Similarly, Sinden and Sinang [40] identified temperature, in combinationwith elevated water pH, as key environmental factors influencing proliferation of cyanobacteria andtoxicity in Malaysian aquaculture ponds. In the present study, the presence of correlations between arange of biological and chemical parameters were tested against presence of microcystins. Perhaps notsurprisingly given the low levels of microcystins detected in lake 1, no correlations were observed.For lake 2, where moderate levels of microcystins were present during the summer and autumn, watertemperatures did not correlate; however, a decrease in dissolved oxygen was closely associated withpresence and levels of microcystins. A decrease in dissolved oxygen concurrent with decomposition ofcyanobacterial blooms has been reported previously [6,41] and thus has the potential to indicate onsetof toxicity derived from lysed cells within a rapidly blooming population. Perturbations in dissolvedoxygen are frequently used as an indicator of water quality and eutrophication [42]. Conversely,with respect to the correlations of microcystin production, in a comprehensive review of biologicaland chemical factors, Dai et al. [42] postulated that light intensity and temperature were the mostimportant physical factors with nitrogen and phosphorus as the critical chemical drivers of harmfulalgal blooms and microcystins. The authors also noted the complex interactions with biotic factors,suggesting that predator-prey relationships in phytoplanktonic communities may promote microcystinproduction and release [42].
To explain the strength of the association between the measured parameters and their potentialfuture ability to inform predictive models for microcystin events, stepwise multiple linear regressionanalysis was applied to all chemical and biological parameters. Across both lakes, microcystinsincreased with temperature and decreased with dissolved oxygen. Using a similar statistical approachas a precursor to the development of empirical predictive models for cyanobacterial, Beaulieu et al. [43]showed that total nitrogen and water temperature provided the best model and explained 25% ofcyanobacterial biomass. Using these explanatory variables, the authors developed competing pathmodels, which showed that both nitrogen and temperature were indirectly (and directly) linked tocyanobacteria by interactions with total algal biomass. Model outputs predicted an average doubling ofcyanobacterial biomass with a 3.3 ◦C rise in water temperature. In contrast, Carvalho et al. [24] showedthat significant explanatory variables were dissolved organic carbon and pH, and that furthermorenutrient concentrations were not a primary explanatory variable. In this study the relatively highlevels of variability explained by combined biological and chemical parameters via regression analysisindicated promise and areas for future investigation.
Although in this study, no single variable could be considered predictive of microcystin productionnor could all the variability between the lakes be explained by combinations of measurements, themajor identifiable difference between the two water bodies was the presence of a managed fishery atlake 1. Omnivorous fishes; common carp (Cyprinus carpio), bream (Abramis brama), tench (Tinca tinca)and pike (Esox lucius), and substantial natural populations of roach (Rutilus rutilus), and rudd(Scardinius erythrophthalmus) were present in lake 1, whereas no managed fishery or introductions offish species operated at lake 2. Larval, fry, and fingerlings of stocked species favour zooplankton, withcertain high nutrient species (rotifers etc.) making up a substantial component of adult fish’s foodsupply. Larval stages and young age classes of R. rutilus and S. erythrophthalmus, numerous duringsummer months are almost exclusively zooplanktoniverous, with a feeding preference for rotifers [44].Rotifers and other small zooplankton, such as cyclopoid copepods and cladocerans, are selectivegrazers that can coexist with bloom forming cyanobacteria and are reported to periodically exhibittop-down control [45]. Interestingly, several authors have suggested that Microcystis spp. represent aless attractive foodstuff for zooplankton due inter alia to colony formation [45–47], which together witha reduction in grazing pressure on other cyanobacterial taxa may have created a competitive advantagefor the non-toxic Microcystis-like cell populations, such as unknown species of picoplankton in lake 1.R. rutilus abundance has previously been implicated in ichthyo-eutrophication of reservoirs in the CzechRepublic [44]; this has been attributed to a range of factors but may also include reduction in grazing
Toxins 2020, 12, 503 11 of 15
rates by zooplankton, which in turn create advantageous conditions for blooms [48]. Furthermore,eutrophication can change microbial loops and therefore may inhibit antagonistic microorganisms(viruses, bacteria, microalgae, microfungal, and amoeboid taxa) present within Microcystis colonies inthe operation of bottom-up controls [45].
Environmental drivers for toxin production from cyanobacterial taxa are complex and intricaciesof phytoplankton communities, cryptic ecological interactions, and the presence of non-toxin producingcyanobacterial strains make this a challenging area of risk management. This study demonstratedthat no single variable could be used to predict microcystin levels but supported the use of multiplemeasurements in the development of more holistic predictive models. In this study, multiplemeasurements were dissolved oxygen, turbidity, phycocyanin, temperature pH, chlorophyll a, b, andtotal carotenoids. The potential for enhanced fish stocks to exert top down control on toxic cyanobacterialpopulations was an interesting observation and is indicative of wider multifaceted trophic relationshipsinfluencing cyanobacterial population dynamics and toxin production. Whilst challenging at anenvironmentally relevant scale [21], improved predictive ability and modelling will provide moreefficient, proactive management of water bodies impacted by toxic cyanobacteria and in turn havepositive ecological, public, and animal health benefits.
4. Materials and Methods
4.1. Sample Collection and Water Parameter Measurements
Water samples were collected with chemical and biological measurements between May 16 2016and May 31 2017, from both northern and southern lakes at points A & B (Figure 2). The lakes weresampled weekly in the spring, summer, and autumn, with sampling frequency dropping to every threeweeks in the winter. Measurements of dissolved oxygen, turbidity, phycocyanin, temperature, pH,and salinity, were made by multiparameter probe (6600 V2, YSI, Xylem Analytics, Singapore) fromthe surface and at 1 m intervals to the bottom. Water samples for flow cytometer and toxin analysiswere collected from the same depths using a 2.2 L horizontal sampler. Water samples for microscopeanalysis were collected from the surface of each lake only. Water samples were in put in opaque bottlesand stored in a cool box for return to the laboratory.
4.2. Cell Discrimination by Flow Cytometry
Water samples were analysed for using a flow cytometer (C6, BD Accuri, San Jose, CA, USA),samples were aliquoted (≈2 mL) into a 5 mL sample tube, and homogenised by vortex. A 5-min customfluidic setting was selected of 25 µm core and 100 µL/min, with a threshold of 80,000 au on forwardscatter (FSC) signal. Unicellular Microcystis cells were resolved by size and three auto-florescencechannels. Following Chapman [49], side scatter (SSC) signal was used as an indicator cell size andverified by calibration beads (PPS-6K, Spherotech, Lake Forest, IL, USA), gated between 75,000 to700,000 au. Yellow auto-florescence (FL2) was used as an indicator of phycoerythrin and carotenoids,gated at 40 to 2000 au. Red auto-florescence (FL3) was used as an indicator of chlorophyll, gated between180,000 to 2,200,000 au. Finally, far-red auto-florescence was used as an indicator of phycocyanin,gated between 11,000 to 500,000 au. The method was optomised using 6 Microcystis, 2 non-Microcystiscyanobacteria, and 2 eukaryotic algal reference strains.
4.3. Toxin Analysis by Liquid Chromatography Coupled to Tandem Mass Spectrometry
In triplicate, 200 mL of water sample was filtered (CFC, Whatman, Maidstone, UK), filterpapers were wrapped individually in aluminium foil and preserved at −80 ◦C. On analysis, filterpapers were subjected to three cycles of freeze-thawing before submersion in 10 mL of 80% aqueousmethanol. Samples were left in the dark at 4–6 ◦C for 24 h, before ~0.5 mL was aliquoted into aLCMS certified vial. Toxin analysis was carried by ultra-high-performance liquid chromatography(UHPLC) (Acquity, Waters, Manchester, UK) coupled to a tandem quadruple mass spectrometer
Toxins 2020, 12, 503 12 of 15
(Xevo TQ, Waters, Manchester, UK). All instrument solvents and chemicals were of LC-MS-grade(Fisher Optima, Thermo Fisher, Manchester, UK). Reference toxins used for the detection methodincluded the microcystin analogues MC-RR, MC-LA, MC-LY, MC-LF, MC-LW, MC-YR, MC-WR,MC-HilR, MC-HtyR, MC-LR & Asp3-MC-LR (Enzo Life Sciences, Exeter, UK) and [Dha7]-MC-LR andmatrix reference material of blue-green algae (RM-BGA, Lot 201301) containing a range of microcystins(Institute of Biotoxin Metrology, National Research Council Canada). Analysis of microcystins wasconducted following the method by Turner et al. [50].
4.4. Identification and Enumeration of Phytoplankton by Light Microscopy
Surface water samples were aliquoted into a 15 mL centrifuge tube; the full tube was sealedthen inverted and the lid struck on the bench several times to burst any gas flotation vesicles withincells. Centrifuge tubes were then placed upright and stored at 4–6 ◦C in the dark for two days forthe phytoplankton to settle out. The top 14 mL was carefully removed by pipette to not disturb thesedimented phytoplankton; the remaining 1 mL was vortexed and transferred to a Sedgwick-raftercounting chamber. The phytoplankton in a minimum of 10 of the 1000 grid squares were identifiedand enumerated by light microscope (BX51, Olympus, Tokyo, Japan) at 40× and 100×magnification.
4.5. Multiple Linear Regression Model
Relationships between the presence and level of microcystin and potential predictor variableswere explored visually using plot functions and the strength of these relationships assessed usingmultiple linear regression models after making appropriate transformations data (if required) to ensureits distribution met the test assumptions. A logistic regression model (GLM assuming a binomialdistribution and log link function) was also applied to determine whether any of the environmentalvariables measured were able to reliably predict the presence/absence of microcystin rather than itslevels. For both the linear and logistic regression analysis, univariable analysis was first performedand then a multivariable model was built using a forward stepwise approach in which variables andcombinations that led to statistically significantly reductions (p ≤ 0.05) in the Akaike informationcriteria (AIC) were retained in the model. The presence of two-way interaction effects was explored forall variable combinations but were only retained if their inclusion resulted in a significant reduction inAIC. All analysis and data visualisations were conducted in R version 4.0.2 [51].
Author Contributions: D.M.H., I.J.C., G.F.E., A.D.T., and D.J.F. designed and conceived the study, D.M.H., andI.J.C. performed the field and laboratory work, N.G.H.T. provided formal analysis G.F.E., D.J.F., and A.D.T.provided supervision, D.M.H. prepared the original draft, D.M.H., I.J.C., G.F.E., A.D.T., and D.J.F. reviewed thepaper, and D.M.H. and N.G.H.T. wrote the revised drafts. All authors have read and agreed to the publishedversion of the manuscript.
Funding: This research was funded by Bournemouth University post graduate studentships. Analytical chemicalmethods were funded by Cefas Seedcorn (Contract DP305).
Acknowledgments: The authors would like to thank Lewis Coates for preparing Figure 1, and BournemouthWater, especially Ian Hayward the bailiff at Longham Lakes. D.M.H. would like to thank Rachel Hartnell forreviewing the original draft of this manuscript.
Conflicts of Interest: The authors declare no conflict of interest.
References
1. Codd, G.A. Cyanobacterial toxins, the perception of water quality, and the prioritisation of eutrophicationcontrol. Ecol. Eng. 2000, 16, 51–60. [CrossRef]
2. Paerl, H.W.; Fulton, R.S.; Moisander, P.H.; Dyble, J. Harmful freshwater algal blooms, with an emphasis oncyanobacteria. Sci. World J. 2001, 1, 76–113. [CrossRef] [PubMed]
3. Paerl, H.W.; Paul, V.J. Climate change: Links to global expansion of harmful cyanobacteria. Water Res. 2012,46, 1349–1363.
4. Robarts, R.D.; Zohary, T. Temperature effects on photosynthetic capacity, respiration and growth rates ofbloom-forming cyanobacteria. New Zealand J. Mar. Fresh. 1987, 12, 391–399. [CrossRef]
5. Paerl, H.W.; Huisman, J. Blooms like it hot. Science 2008, 320, 57–58. [CrossRef] [PubMed]6. O’Neil, J.M.; Davis, T.W.; Burford, M.A.; Gobler, C.J. The rise of harmful cyanobacteria blooms: The potential
roles of eutrophication and climate change. Harmful Algae 2012, 14, 313–334. [CrossRef]7. Rigosi, A.; Carey, C.C.; Ibelings, B.W.; Brookes, J.D. The interaction between climate warming
and eutrophication to promote cyanobacteria is dependent on trophic state and varies among taxa.Limnol. Oceanogr. 2014, 59, 99–114. [CrossRef]
8. Lawton, L.A.; Codd, G.A. Cyanobacterial (blue-green algal) toxins and their significance in UK and Europeanwaters. Water Environ. J. 1991, 5, 460–465. [CrossRef]
9. Chorus, I. Cyanotoxin occurrence in freshwaters—A summary of survey results from different countries.In Cyanotoxins—Occurrence, Causes, Consequences; Chorus, I., Ed.; Springer: Berlin, Germany, 2001; pp. 75–78.
10. Turner, A.D.; Dhanji-Rapkova, M.; O’Neill, A.; Coates, L.; Lewis, A.; Lewis, K. Analysis of Microcystins inCyanobacterial Blooms from Freshwater Bodies in England. Toxins 2018, 10, 39. [CrossRef]
11. Kuiper-Goodman, T.; Falconer, I.O.M.; Fitzgerald, J. Human health aspects. In Toxic Cyanobacteria in Water: AGuide to Their Public Health Consequences, Monitoring and Management; Chorus, I., Bartram, J., Eds.; E & F NSpon: London, UK, 1999; pp. 125–160.
12. Van Ginkel, C.E. Toxic Algal Incident in the Grootdraai Dam; Institute for Water Quality Studies, Department ofWater Affairs and Forestry: Pretoria, South Africa, 2011.
13. Alonso-Andicoberry, C.; García-Viliada, L.; Lopez-Rodas, V.; Costas, E. Catastrophic mortality of flamingosin a Spanish national park caused by cyanobacteria. Vet. Rec. 2002, 151, 706–707.
14. Qin, B.; Zhu, G.; Gao, G.; Zhang, Y.; Li, W.; Paerl, H.W.; Carmichael, W.W. A drinking water crisis in LakeTaihu, China: Linkage to climatic variability and lake management. J. Environ. Manage 2010, 45, 105–112.[CrossRef]
15. World Health Organization (WHO). Guidelines for Drinking-Water Quality: Fourth Edition Incorporating theFirst Addendum; WHO: Geneva, Switzerland, 2017.
16. Water UK. Water UK Technical Briefing Note: Blue Green Algal Toxins in Drinking Water; Water UK PositionPaper; Water UK: London, UK, 2006.
17. Krokowski, J.T.; Lang, P.; Bell, A.; Broad, N.; Clayton, J.; Milne, I.; Nicolson, M.; Ross, A.; Ross, N. A reviewof the incidence of cyanobacteria (blue-green algae) in surface eaters in Scotland including potential effectsof climate change, with a list of the common species and new records from the Scottish EnvironmentalProtection Agency. Glasg. Nat. 2012, 25, 99–104.
18. Mantzouki, E.; Lürling, M.; Fastner, J.; de Senerpont Domis, L. Temperature effects explain continental scaledistribution of cyanobacterial toxins. Toxins 2018, 10, 156. [CrossRef]
19. Miles, C.O.; Sandvik, M.; Nonga, H.E.; Rundberget, T.; Wilkins, A.L.; Rise, F.; Ballot, A. Thiol derivatizationfor LC-MS identification of microcystins in complex matrices. J. Environ. Sci. Technol. 2012, 46, 8937–8944.[CrossRef]
20. Okello, W.; Ostermaier, V.; Portmann, C.; Gademann, K.; Kurmayer, R. Spatial isolation favours the divergencein microcystin net production by Microcystis in Ugandan freshwater lakes. Wat. Res. 2010, 44, 2803–2814.[CrossRef]
21. Oliver, R.L.; Hamilton, D.P.; Brookes, J.D.; Ganf, G.G. Physiology, blooms and prediction of planktoniccyanobacteria. In Ecology of Cyanobacteria II; Whitton, B.A., Ed.; Springer: Dordrecht, Germany, 2012;pp. 155–194.
22. Downing, J.A.; Watson, S.B.; McCauley, E. Predicting cyanobacteria dominance in lakes. Can. J. Fish. Aquat.Sci. 2001, 58, 1905–1908. [CrossRef]
23. Howard, A.; Easthope, M.P. Application of a model to predict cyanobacterial growth patterns in response toclimatic change at Farmoor Reservoir, Oxfordshire, UK. Sci. Total Environ. 2002, 282, 459–469. [CrossRef]
24. Carvalho, L.; Miller, C.A.; Scott, E.M.; Codd, G.A.; Davies, P.S.; Tyler, A.N. Cyanobacterial blooms: Statisticalmodels describing risk factors for national-scale lake assessment and lake management. Sci. Total Environ.2011, 409, 5353–5358. [CrossRef]
25. Rigosi, A.; Hanson, P.; Hamilton, D.P.; Hipsey, M.; Rusak, J.A.; Bois, J.; Sparber, K.; Chorus, I.; Watkinson, A.J.;Qin, B.; et al. Determining the probability of cyanobacterial blooms: The application of Bayesian networks inmultiple lake systems. Ecol. Appl. 2015, 25, 186–199. [CrossRef] [PubMed]
26. Sivonen, K.; Jones, G. Cyanobacterial toxins. In Toxic Cyanobacteria in Water: A Guide to Public HealthSignificance, Monitoring and Management; Chorus, I., Bartram, J., Eds.; E & F N Spon: London, UK, 1999;pp. 41–111.
27. Mekebri, A.; Blondina, G.J.; Crane, D.B. Method validation of microcystins in water and tissue by enhancedliquid chromatography tandem mass spectrometry. J. Chromatogr. A 2009, 1216, 3147–3155. [CrossRef] [PubMed]
28. Dyble, J.; Fahnenstiel, G.L.; Litaker, R.W.; Millie, D.F.; Tester, P.A. Microcystin concentrations and geneticdiversity of Microcystis in the lower Great Lakes. Environ. Toxicol. 2008, 23, 507–516. [CrossRef] [PubMed]
29. Sivonen, K. Cyanobacterial toxins. In Encyclopedia of Microbiology, 3rd ed.; Schaechter, M., Ed.; AcademicPress: London, UK, 2009; pp. 290–307.
30. Janse, I.; Kardinaal, W.E.A.; Meima, M.; Fastner, J.; Visser, P.M.; Zwart, G. Toxic and nontoxic Microcystiscolonies in natural populations can be differentiated on the basis of rRNA gene internal transcribed spacerdiversity. Appl. Environ. Microbiol. 2004, 70, 3979–3987. [CrossRef] [PubMed]
31. Meyer, K.A.; Davis, T.W.; Watson, S.B.; Denef, V.J.; Berry, M.A.; Dick, G.J. Genome sequences of lower GreatLakes Microcystis sp. reveal strain-specific genes that are present and expressed in western Lake Erie blooms.PLoS ONE 2017, 12, e0183859. [CrossRef] [PubMed]
32. Tillett, D.; Parker, D.L.; Neilan, B.A. Detection of toxigenicity by a probe for the microcystin synthetase A gene(mcyA) of the cyanobacterial genus Microcystis: Comparison of toxicities with 16S rRNA and phycocyaninoperon (phycocyanin intergenic spacer) phylogenies. Appl. Environ. Microbiol. 2001, 67, 2810–2818. [CrossRef]
33. Howard, A.; McDonald, A.T.; Kneale, P.E.; Whitehead, P.G. Cyanobacterial (blue-green algal) blooms in theUK: A review of the current situation and potential management options. Prog. Physic. Geograp. 1996, 20,53–61. [CrossRef]
34. Krokowski, J.T.; Jamieson, J. A decade of monitoring and management of freshwater algae, in particularcyanobacteria in England and Wales. Freshwat. Forum 2002, 18, 3–12.
35. Zervou, S.K.; Christophoridis, C.; Kaloudis, T.; Triantis, T.M.; Hiskia, A. New SPE-LC-MS/MS method forsimultaneous determination of multi-class cyanobacterial and algal toxins. J. Hazard. Mater. 2017, 323, 56–66.[CrossRef]
36. Halinen, K.; Jokela, J.; Fewer, D.P.; Wahlsten, M.; Sivonen, K. Direct evidence for production of microcystinsby Anabaena strains from the Baltic Sea. Appl. Environ. Microbiol. 2007, 73, 6543–6550. [CrossRef]
38. Ferguson, C.A.; Carvalho, L.; Scott, E.M.; Bowman, A.W.; Kirika, A. Assessing ecological responses toenvironmental change using statistical models. J. Appl. Ecol. 2008, 45, 193–203. [CrossRef]
39. Elliott, J.A. Is the future blue-green? A review of the current model predictions of how climate change couldaffect pelagic freshwater cyanobacteria. Wat. Res. 2012, 46, 1364–1371. [CrossRef] [PubMed]
40. Sinden, A.; Sinang, S.C. Cyanobacteria in aquaculture systems: Linking the occurrence, abundance andtoxicity with rising temperatures. Int. J. Environ. Sci. Technol. 2016, 13, 2855–2862. [CrossRef]
41. Paerl, H.W.; Otten, T.G. Blooms bite the hand that feeds them. Science 2013, 342, 433–434. [CrossRef]42. Dai, R.; Wang, P.; Jia, P.; Zhang, Y.; Chu, X.; Wang, Y. A review on factors affecting microcystins production
by algae in aquatic environments. World J. Microbiol. Biotechnol. 2016, 32, 51. [CrossRef] [PubMed]43. Beaulieu, M.; Pick, F.; Gregory-Eaves, I. Nutrients and water temperature are significant predictors of
cyanobacterial biomass in a 1147 lakes data set. Limnol. Oceanogr. 2013, 58, 1736–1746. [CrossRef]44. Zapletal, T.; Mares, J.; Jurajda, P.; Vseticková, L. The food of roach, Rutilus rutilus (Actinopterygii:
Cypriniformes: Cyprinidae), in a biomanipulated water supply reservoir. Acta Ichthyol. Piscat. 2014, 44, 15.[CrossRef]
45. Van Wichelen, J.; Vanormelingen, P.; Codd, G.A.; Vyverman, W. The common bloom-forming cyanobacteriumMicrocystis is prone to a wide array of microbial antagonists. Harmful Algae 2016, 55, 97–111. [CrossRef]
46. Rohrlack, T.; Dittmann, E.; Börner, T.; Christoffersen, K. Effects of cell-bound microcystins on survival andfeeding of Daphnia spp. Appl. Environ. Microbiol. 2001, 67, 3523–3529. [CrossRef]
47. Lotocka, M. Toxic effect of cyanobacterial blooms on the grazing activity of Daphnia magna Straus. Oceanologia2001, 43, 441–453.
48. Zurawell, R.W.; Chen, H.; Burke, J.M.; Prepas, E.E. Hepatotoxic cyanobacteria: A review of the biologicalimportance of microcystins in freshwater environments. J. Toxicol. Environ. Health Part B 2005, 8, 1–37.[CrossRef]
49. Chapman, I.J. Developing Pioneering New Tools to Detect and Control the Toxic Alga Microcystis in Lakesand Reservoirs. Ph.D. Thesis, Bournemouth University, Poole, UK, 2016.
50. Turner, A.D.; Waack, J.; Lewis, A.; Edwards, C.; Lawton, L. Development and single-laboratory validation ofa UHPLC-MS/MS method for quantitation of microcystins and nodularin in natural water, cyanobacteria,shellfish and algal supplement tablet powders. J. Chromatogr. B 2018, 1074, 111–123. [CrossRef] [PubMed]
51. R Core Team. R: A Language and Environment for Statistical Computing; R Foundation for Statistical Computing:Vienna, Austria, 2020; Available online: https://www.R-project.org/ (accessed on 14 July 2020).