Cyanobacterial Blooms: Toxins, Tastes, and Odors USGS Kansas Water Science Center Algal Toxin Team Jennifer L. Graham, Keith A. Loftin, Michael T. Meyer, and Andrew C. Ziegler USDA-CSREES National Water Conference February 4, 2008
Transcript
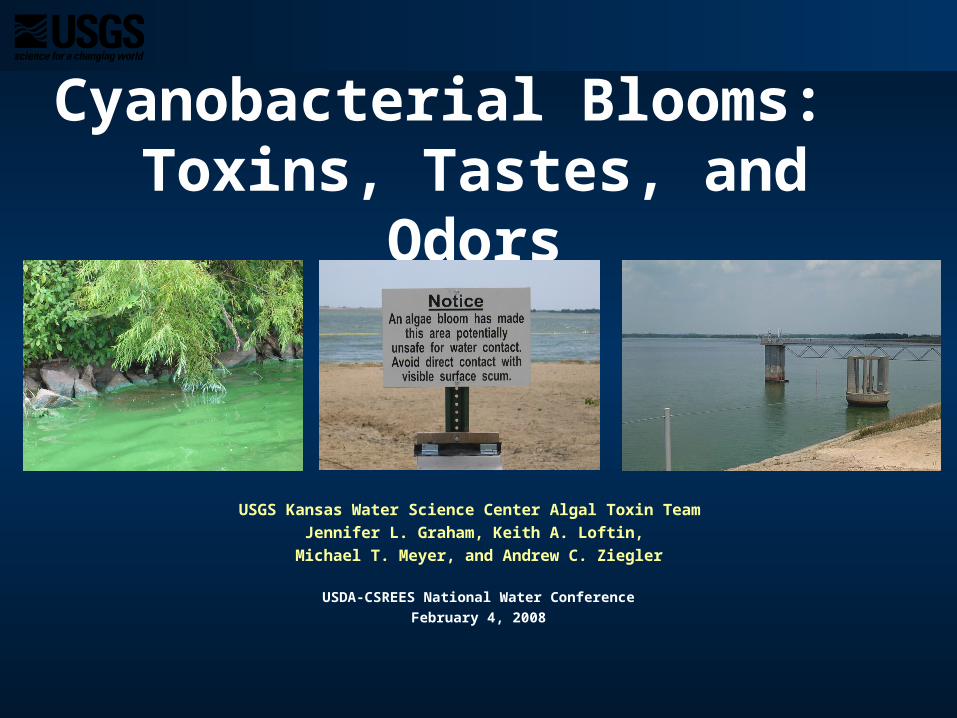
Cyanobacterial Blooms: Toxins, Tastes, and Odors
USGS Kansas Water Science Center Algal Toxin Team
Jennifer L. Graham, Keith A. Loftin,
Michael T. Meyer, and Andrew C. Ziegler
USDA-CSREES National Water Conference
February 4, 2008
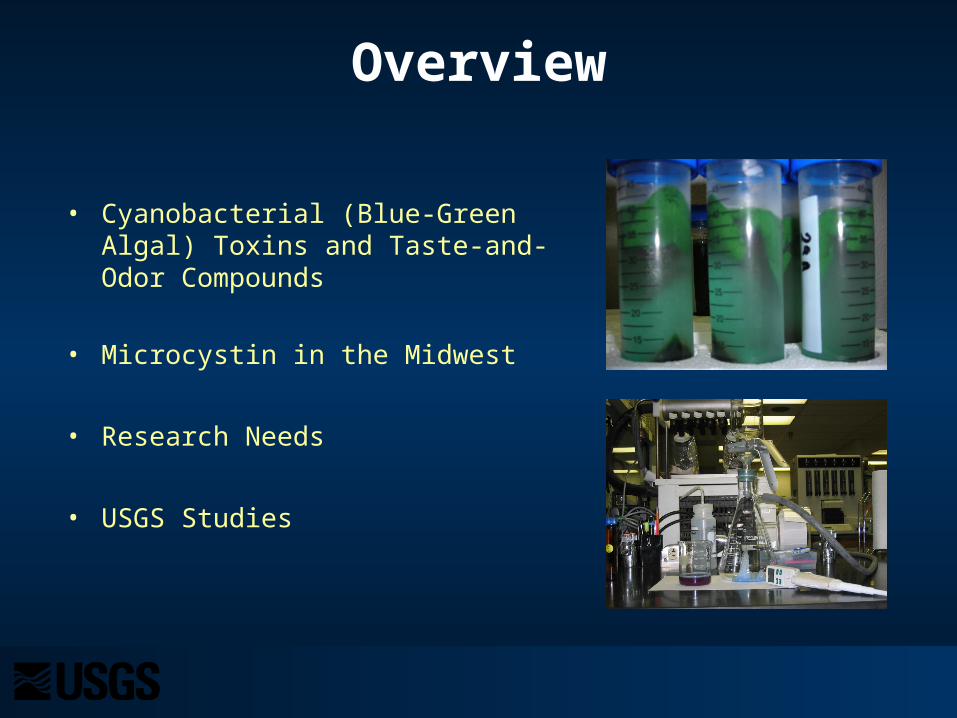
Overview
• Cyanobacterial (Blue-Green Algal) Toxins and Taste-and-Odor Compounds
• Microcystin in the Midwest
• Research Needs
• USGS Studies
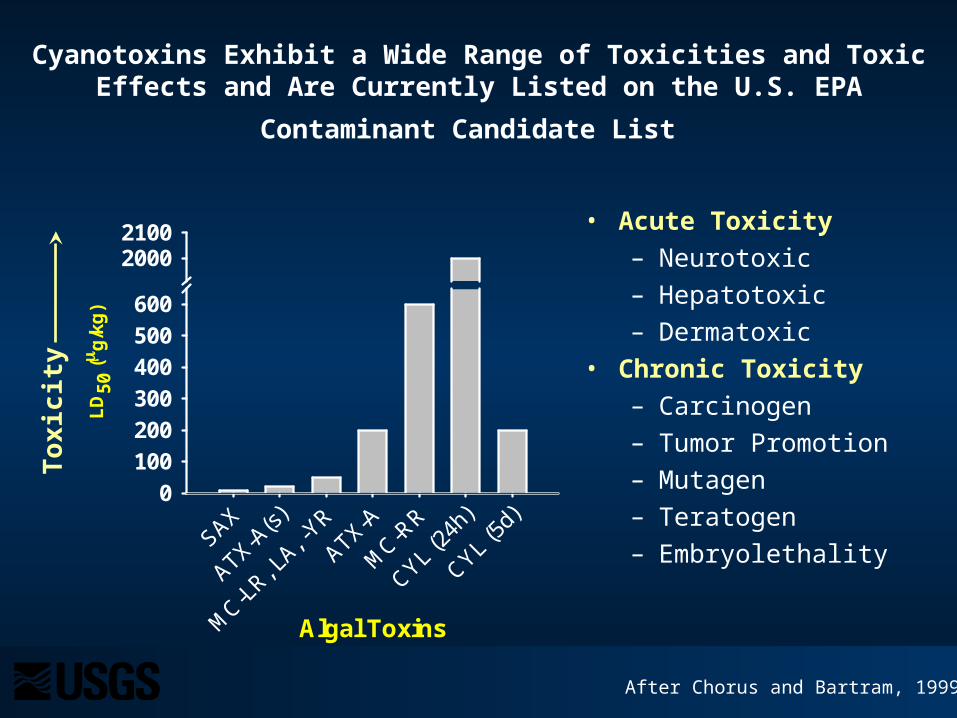
Cyanobacterial toxins are “…anthropogenically amplified, but basically a natural phenomenon…”
I. Chorus, 1993
Binder Lake, IA Aug 2006
Thomas Lake, NE May 2006
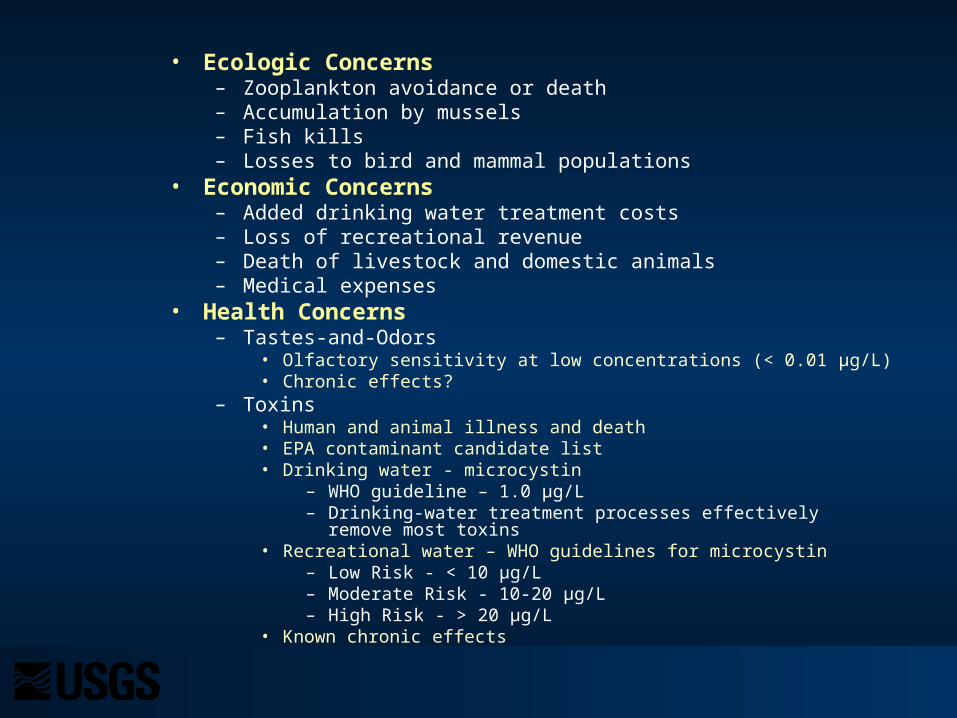
• Ecologic Concerns– Zooplankton avoidance or death– Accumulation by mussels– Fish kills– Losses to bird and mammal populations
• Economic Concerns– Added drinking water treatment costs– Loss of recreational revenue– Death of livestock and domestic animals– Medical expenses
Cyanobacteria Made the News in at Least 21 U.S. States During 2006
= news report
After Graham, 2006 USGS FS-2006-3147
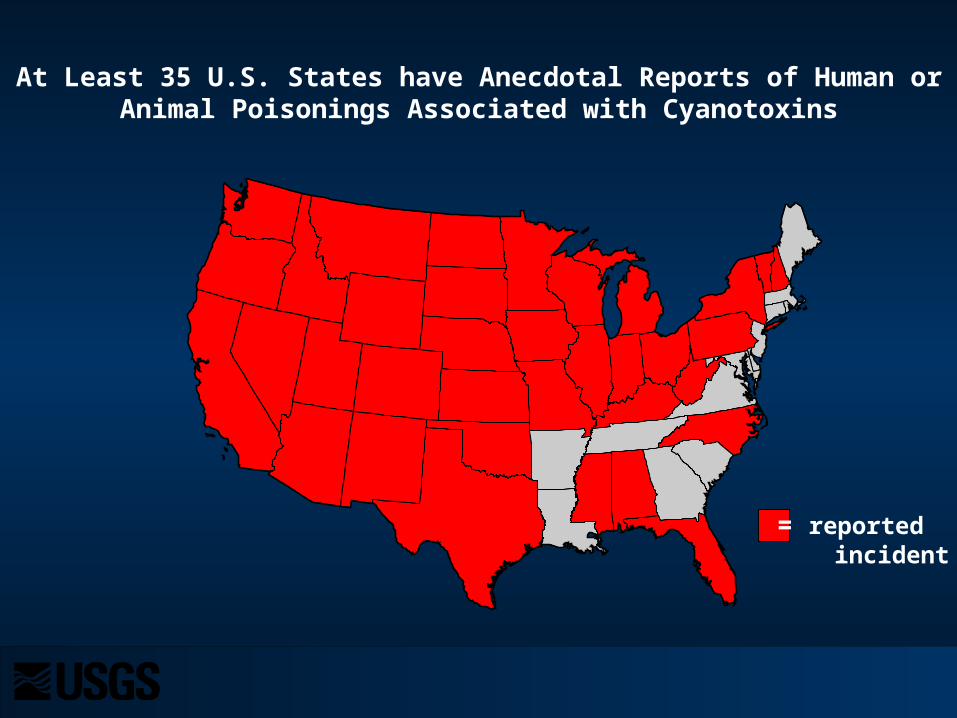
At Least 35 U.S. States have Anecdotal Reports of Human or Animal Poisonings Associated with Cyanotoxins
= reported incident
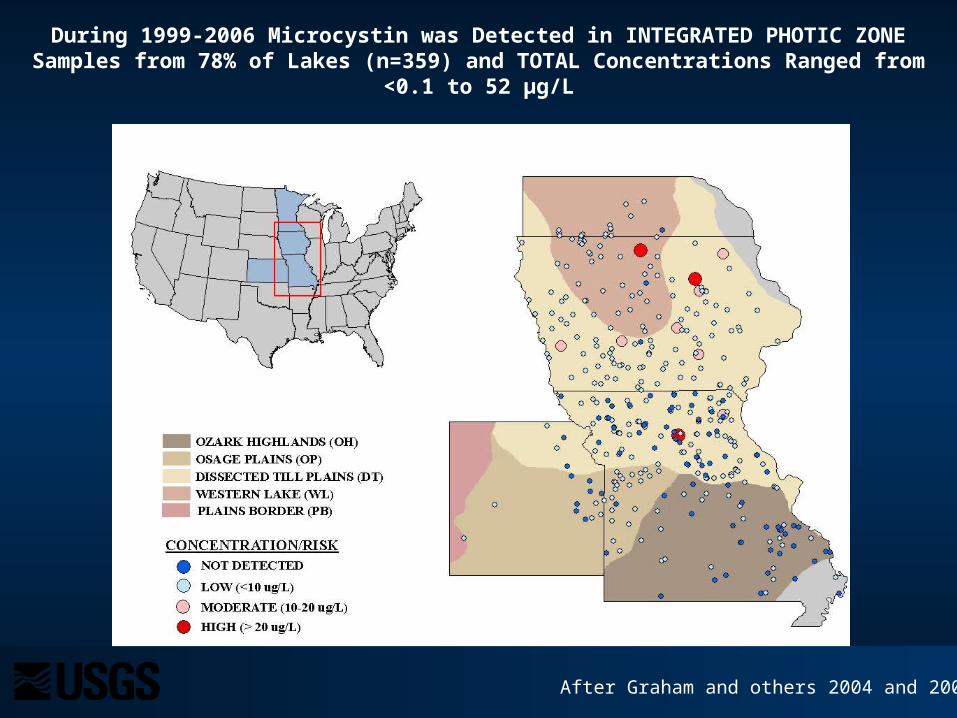
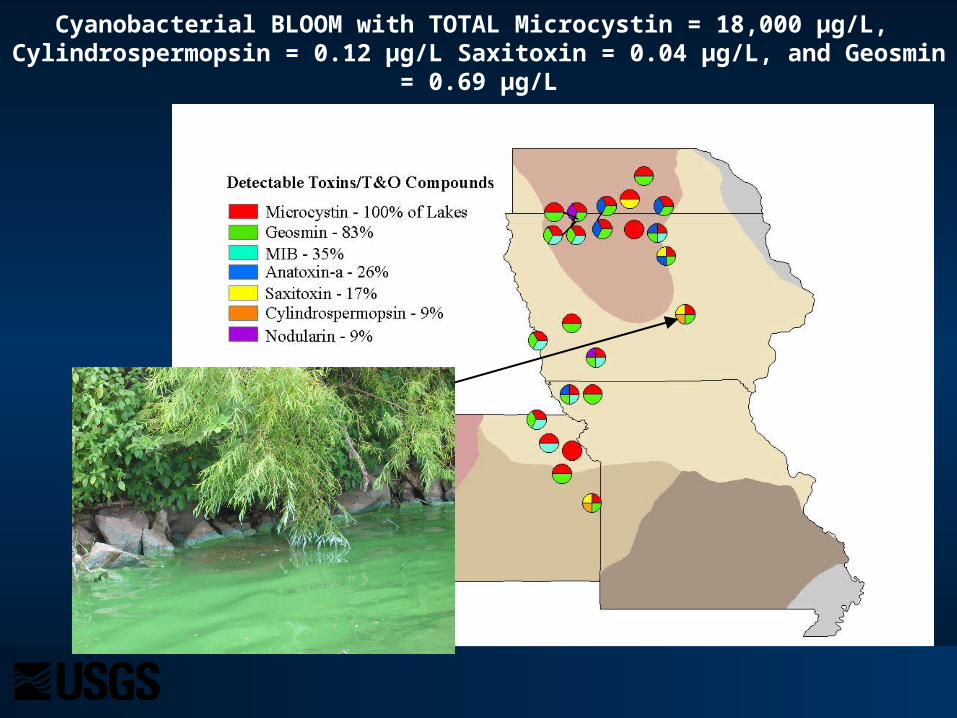
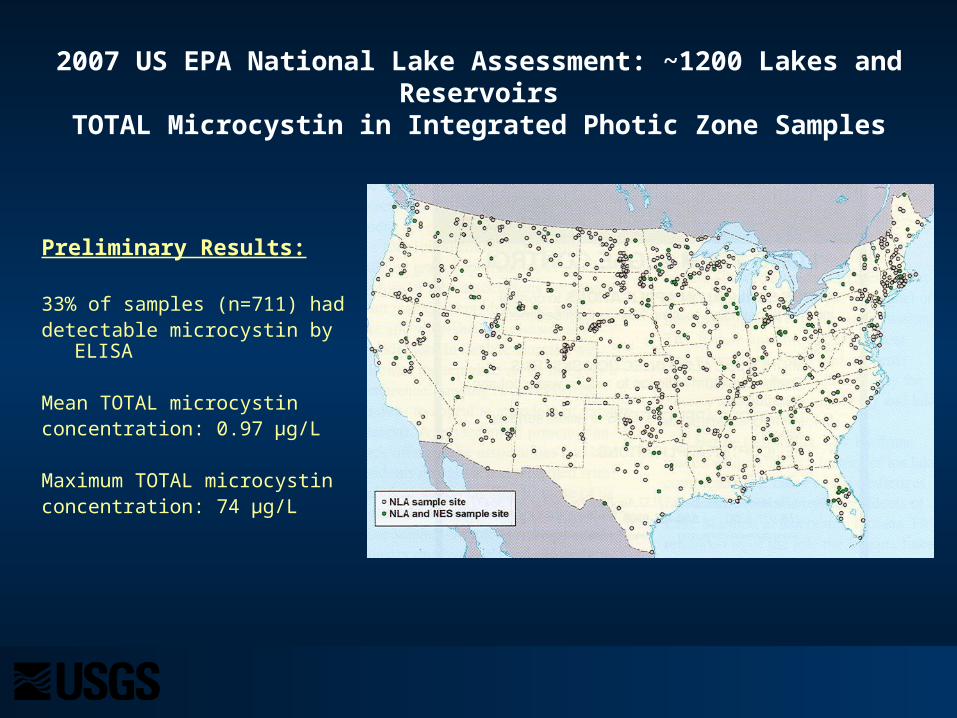
During 1999-2006 Microcystin was Detected in INTEGRATED PHOTIC ZONE Samples from 78% of Lakes (n=359) and TOTAL Concentrations Ranged from <0.1 to 52 µg/L
After Graham and others 2004 and 2006
Trophic Gradient
Mean and Maximum TOTAL Microcystin Concentrations Significantly Increased Along the Natural Trophic Gradient in the Study Region
OH OP DT WL
Mic
rocy
stin
( g
/L)
0
1
2
3
4
5
30405060
a
a, b
b
cn=2546p<0.01
After Graham and others 2004 and 2006
maxima
a, b, and c indicate significant differencesin mean concentration
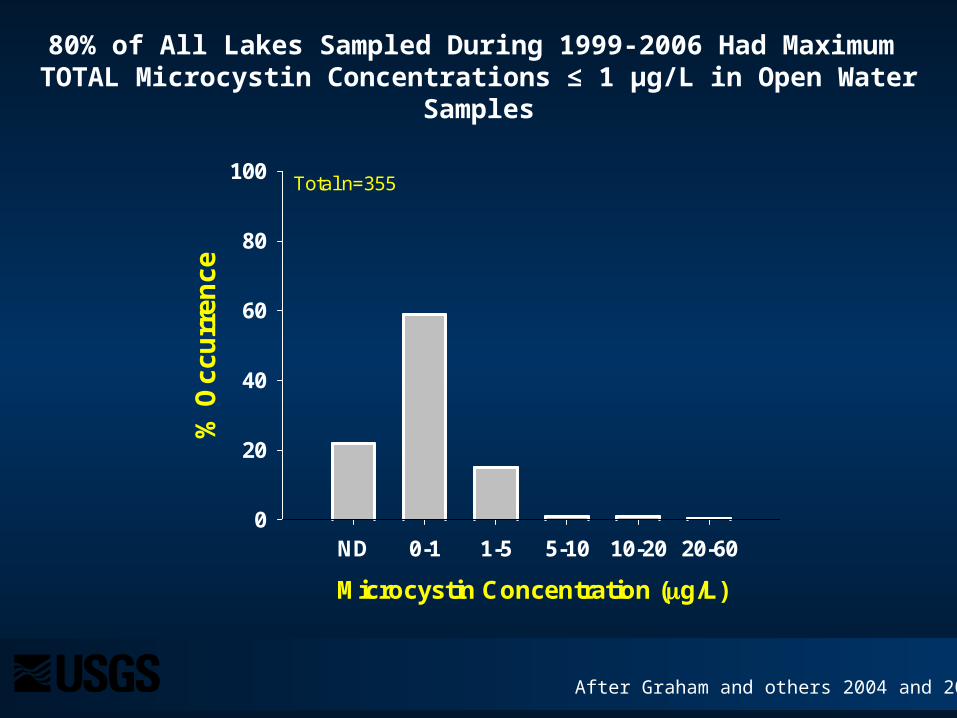
80% of All Lakes Sampled During 1999-2006 Had Maximum TOTAL Microcystin Concentrations ≤ 1 µg/L in Open Water Samples
After Graham and others 2004 and 2006
Microcystin Concentration (g/L)
ND 0-1 1-5 5-10 10-20 20-60
% O
cc
urr
en
ce
0
20
40
60
80
100Total n=355
61% of Lakes Sampled During 3-6 Years Always Had Detectable Microcystin During Summer, and Microcystin Maxima Were Greatest in These Lakes
Ma
xm
imu
m M
icro
cys
tin
C
on
cen
tra
tio
n ( g
/L)
Always Detected
OccassionallyDetected
n=101
n=65
100
1
0.1
0.01
0.001
10
After Graham and others 2004 and 2006
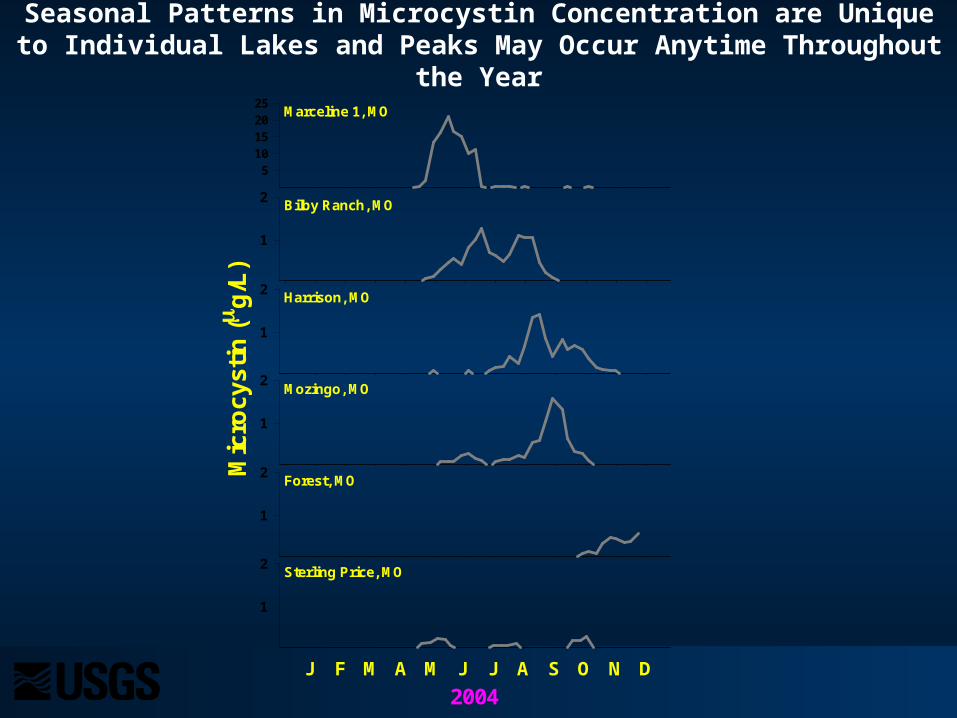
Seasonal Patterns in Microcystin Concentration are Unique to Individual Lakes and Peaks May Occur Anytime Throughout the Year
Marceline 1, MO
Mic
rocy
stin
( g
/L)
510152025
Bilby Ranch, MO
1
2
Harrison, MO
1
2
Mozingo, MO
1
2
Forest, MO
1
2
Sterling Price, MO
2004J F M A M J J A S O N D
1
2
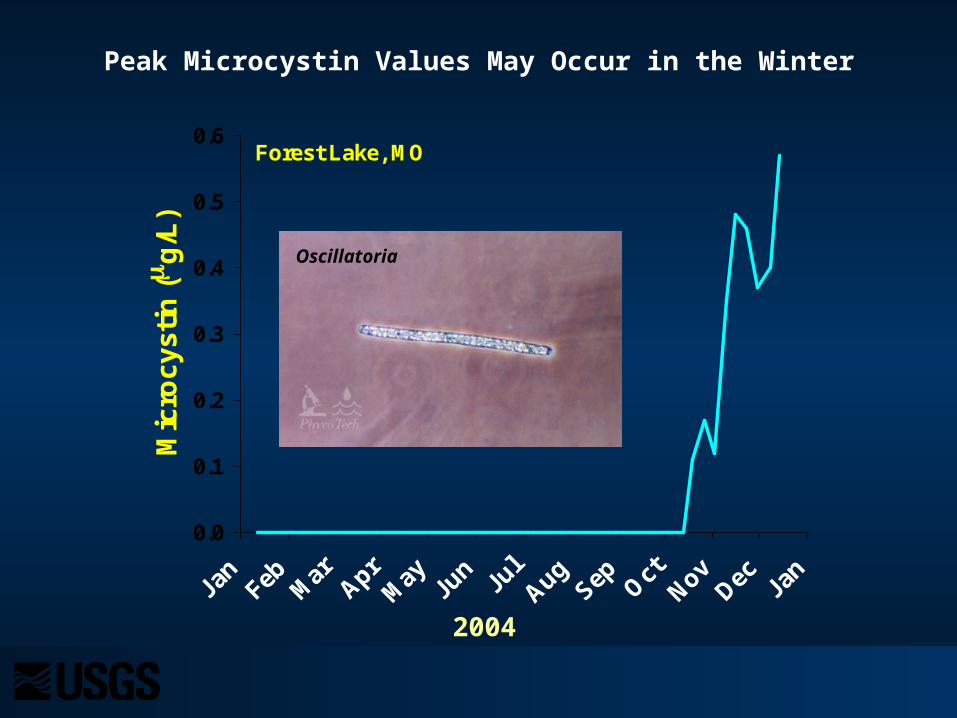
Forest Lake, MO
Jan
Feb
Mar
Apr
May
Jun
Jul
Aug
Sep
Oct
Nov
Dec
Jan
Mic
rocy
stin
( g
/L)
0.0
0.1
0.2
0.3
0.4
0.5
0.6
Peak Microcystin Values May Occur in the Winter
Oscillatoria
2004
Seasonal Patterns Were Relatively Consistent Between Years in Some Lakes
Mozingo Lake, MO
Jan
Feb
Mar
Ap
r
May
Jun
Jul
Aug
Sep Oct
Nov
Dec
Jan
Mic
rocy
stin
( g
/L)
0.0
0.5
1.0
1.5
2.0
2.5
3.020042001
After Graham and Jones, 2006
Regionally, Microcystin Was Significantly Correlated With Factors That Affect Cyanobacterial Growth
Variable rs p-value n
Latitude 0.66 <0.01 800
Total Nitrogen (TN) 0.58 <0.01 795
Total Phosphorus (TP) 0.46 <0.01 795
Secchi -0.27 <0.01 796
pH 0.17 <0.01 507
Alkalinity 0.15 <0.01 432
TN:TP -0.15 <0.01 791
After Graham and others 2004
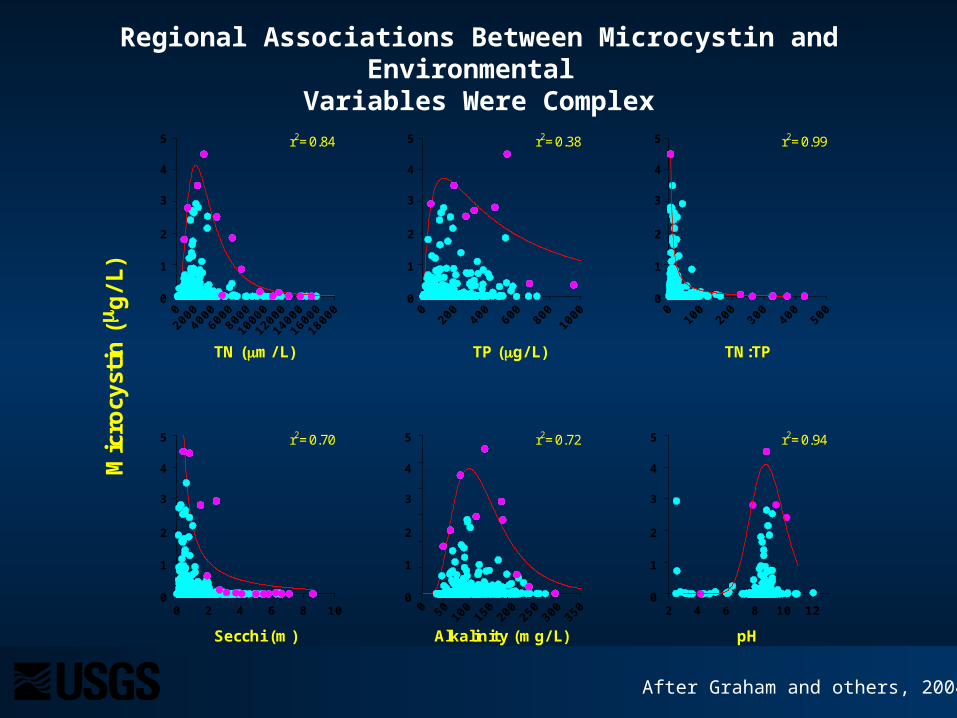
Regional Associations Between Microcystin and Environmental Variables Were Complex
TN:TP
010
020
030
040
050
0
TP (g/ L)
020
040
060
080
010
00
TN (m/ L)
020
0040
0060
0080
00
1000
0
1200
0
1400
0
1600
0
1800
0
Mic
rocy
stin
( g
/L)
pH
2 4 6 8 10 12
Secchi (m)
0 2 4 6 8 10
Alkalinity (mg/ L)
0 50 100
150
200
250
300
350
r2=0.84
r2=0.70
r2=0.38 r2=0.99
r2=0.72 r2=0.94
5
0
1
2
3
4
5
0
1
2
3
4
5
0
1
2
3
4
5
0
1
2
3
4
5
0
1
2
3
4
5
0
1
2
3
4
After Graham and others, 2004
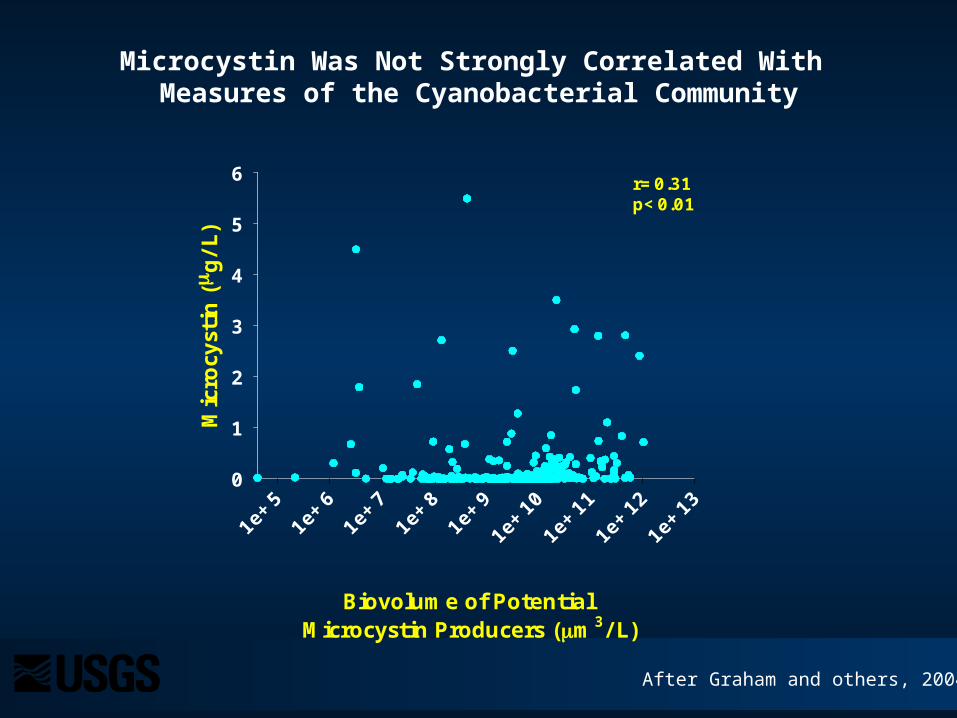
Microcystin Was Not Strongly Correlated With Measures of the Cyanobacterial Community
After Graham and others, 2004
Biovolume of Potential Microcystin Producers (m3/ L)
1e+5
1e+6
1e+7
1e+8
1e+9
1e+10
1e+11
1e+12
1e+13
Mic
rocy
stin
( g
/L)
0
1
2
3
4
5
6 r=0.31p<0.01
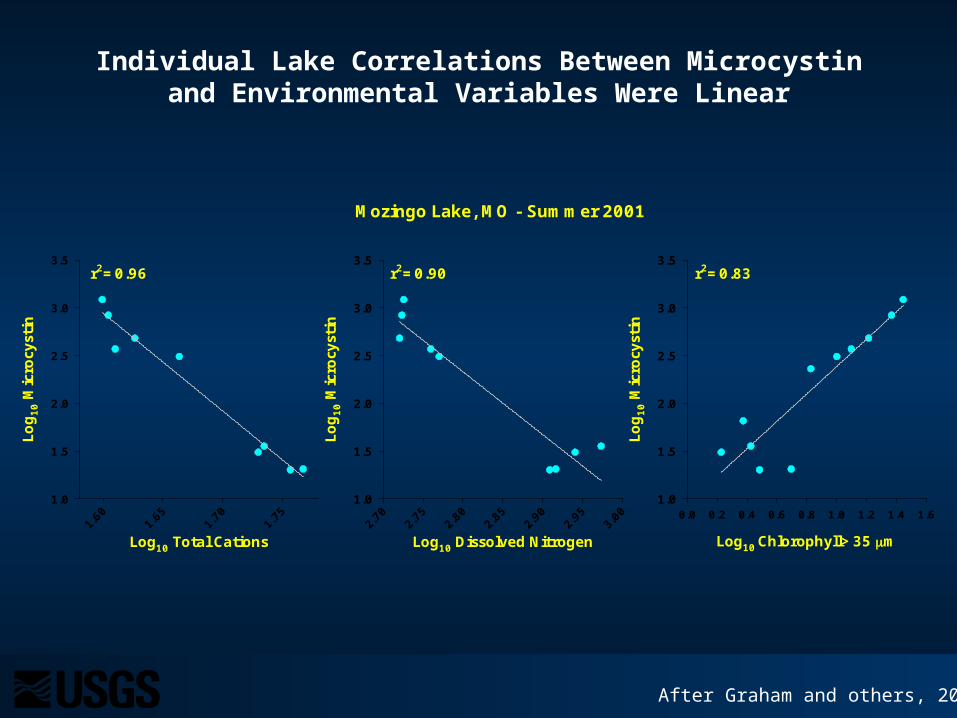
r2=0.96 r2=0.90 r2=0.83
Mozingo Lake, MO - Summer 2001
Log10 Dissolved Nitrogen2.70
2.75
2.80
2.85
2.90
2.95
3.00
Log
10 M
icro
cyst
in
1.0
1.5
2.0
2.5
3.0
3.5
Log10 Total Cations1.60
1.65
1.70
1.75
Log
10 M
icro
cyst
in
1.0
1.5
2.0
2.5
3.0
3.5
Log10 Chlorophyll>35 m
0.0 0.2 0.4 0.6 0.8 1.0 1.2 1.4 1.6
Log
10 M
icro
cyst
in
1.0
1.5
2.0
2.5
3.0
3.5
Individual Lake Correlations Between Microcystin and Environmental Variables Were Linear
After Graham and others, 2006
Seasonal Patterns in Individual Lakes are Coupled with Seasonal Lake Processes, Including Stratification and Nutrient Loss from the Epilimnion
Epilimnion of Mozingo Lake, MO - Summer 2001
May June July Aug Sept
Dis
solv
ed N
itro
gen (
g/L)
500
550
600
650
700
750
800
850
900
Mic
rocy
stin
(ng/L)
0
100
200
300
400
500
600
700
800
900
1000
Net
Chlo
rophyll (
g/L)
0
5
10
15
20
25
30
35
Tota
l Cati
ons
(mg/L)
38
40
42
44
46
48
50
52
54
56
58
NetChlorophyll
Microcystin
Nitrogen
Cations
After Graham and others, 2006
Factors Most Strongly Correlated With Microcystin Vary Among Lakes and Years
Mozingo Lake, MO
Chlorophyll > 35 m (g/ L)
0 10 20 30 40 50
Mic
rocy
stin
( g
/L)
0.0
0.2
0.4
0.6
0.8
1.0
1.2
1.4
1.6
1.8 r2=0.30p<0.01
Forest Lake, MO
Chlorophyll > 35 m (g/ L)
0 2 4 6 8 10 12
Mic
rocy
stin
( g
/L)
0.0
0.1
0.2
0.3
0.4
0.5
0.6 r2=0.90p<0.01
Marceline 1, MO
Chlorophyll > 35 m (g/ L)
0 10 20 30 40 50 60
Mic
rocy
stin
( g
/L)
0
5
10
15
20
25 r2=0.17p<0.01
Microcystin in Midwestern Lakes - Conclusions
• Microcystin is common in the Midwest and may reach levels that can cause health concerns
• Seasonal patterns in microcystin are unique to individual lakes and maxima may occur in any season
• Regional relations between microcystin and environmental variables are complex
• Microcystin and environmental variables may be tightly coupled in individual lakes, but relations vary among lakes and years
Binder Lake, IA Aug 2006
Elysian Lake, MN Aug 2006
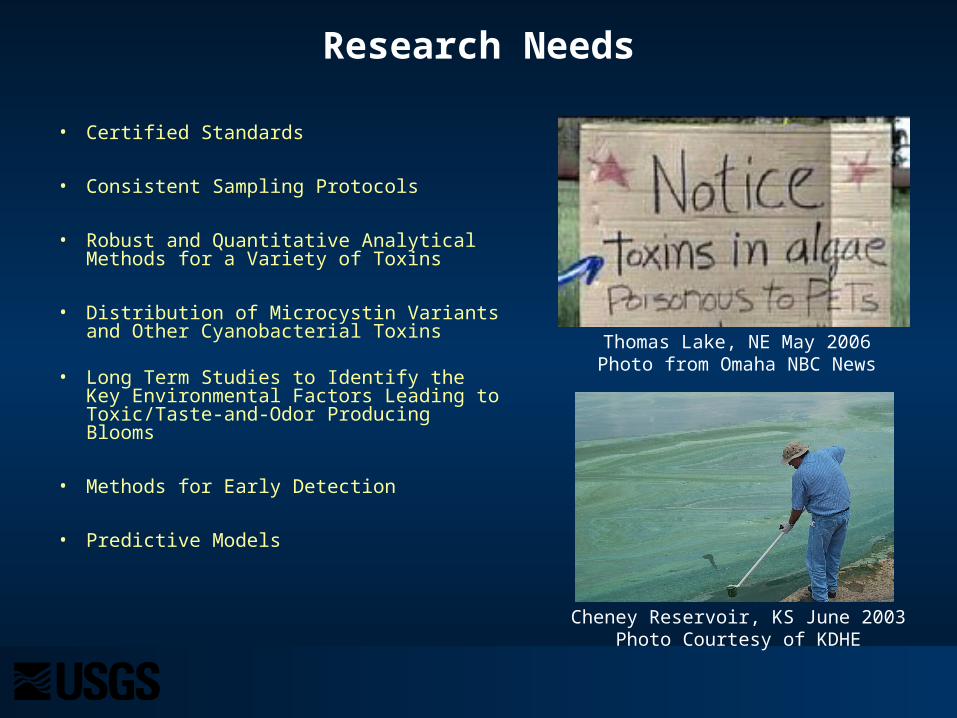
Research Needs
• Certified Standards
• Consistent Sampling Protocols
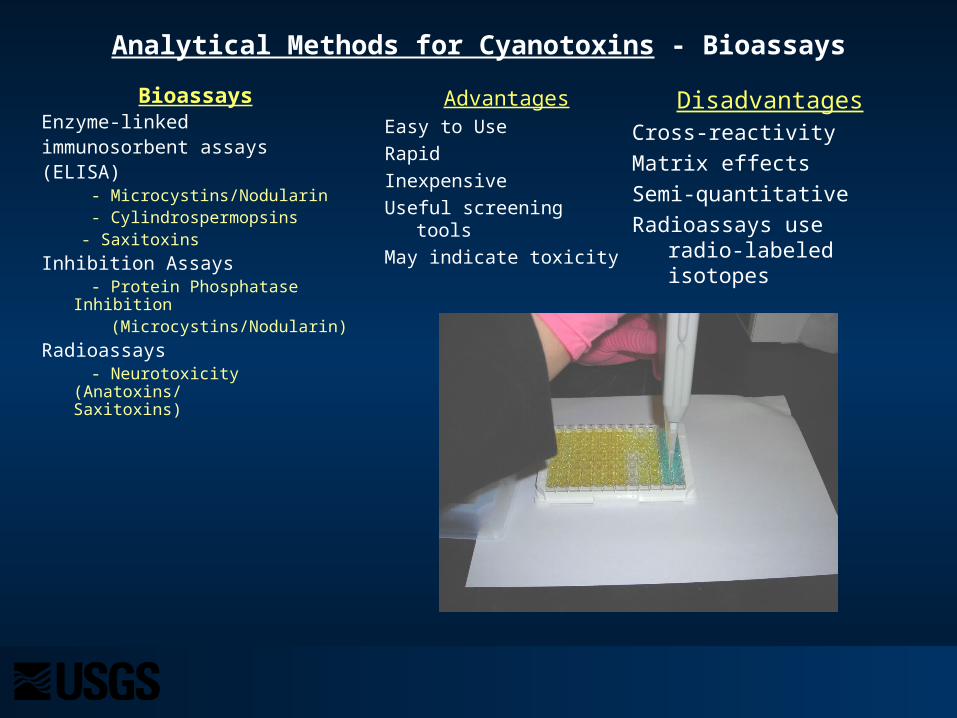
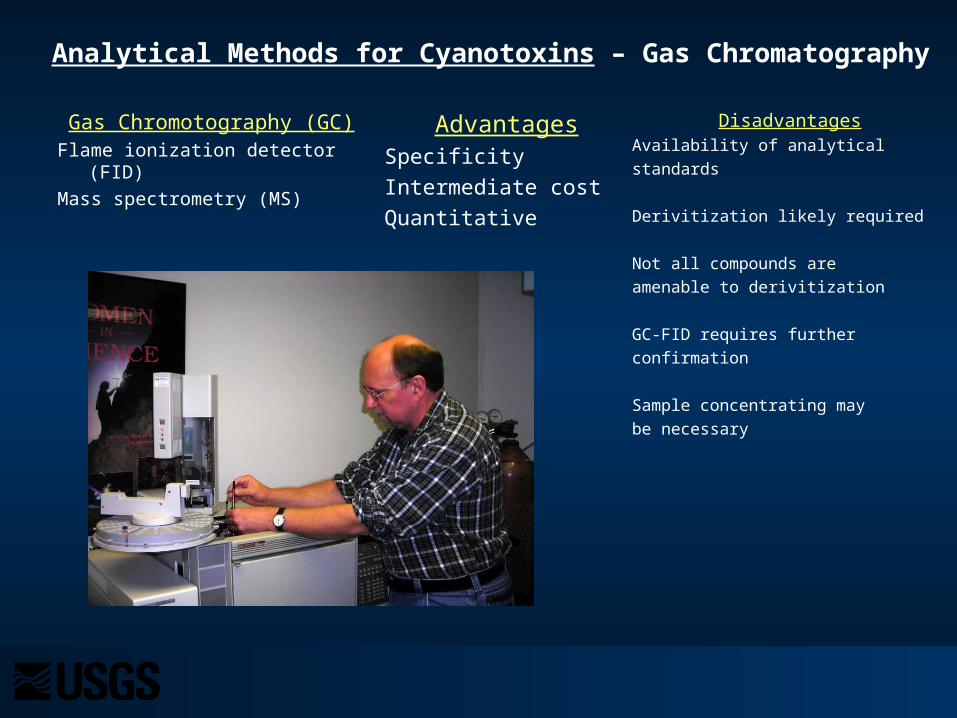
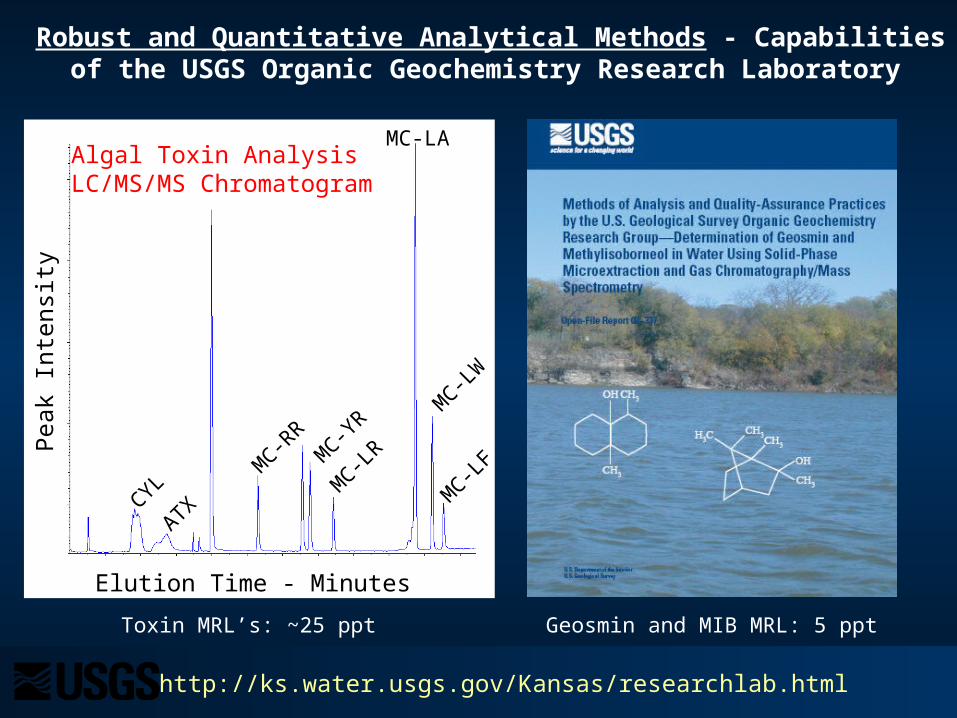
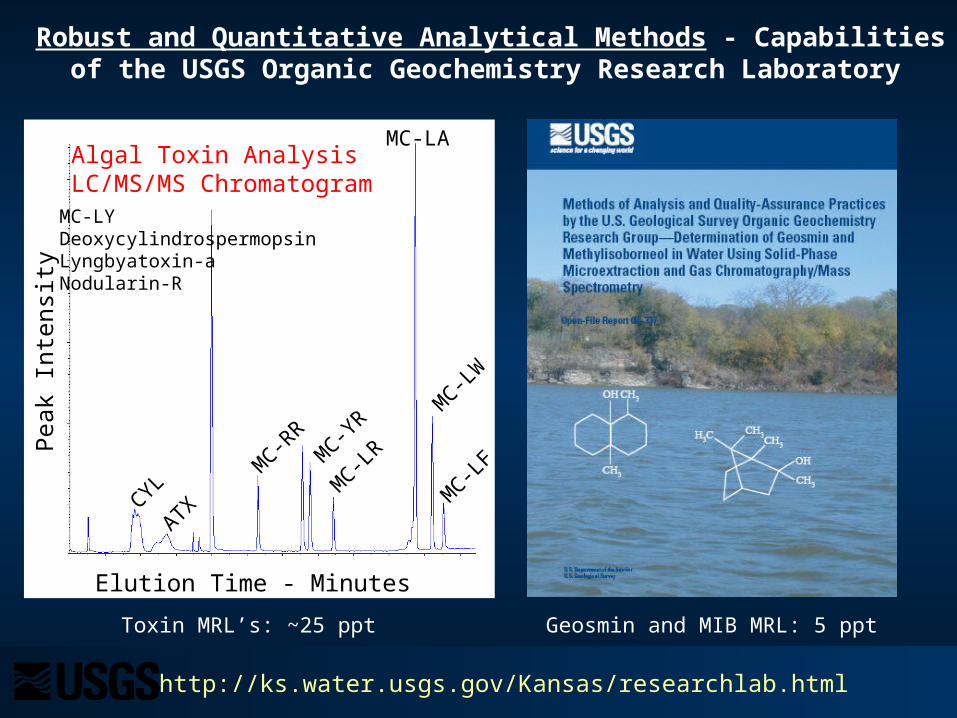
• Robust and Quantitative Analytical Methods for a Variety of Toxins
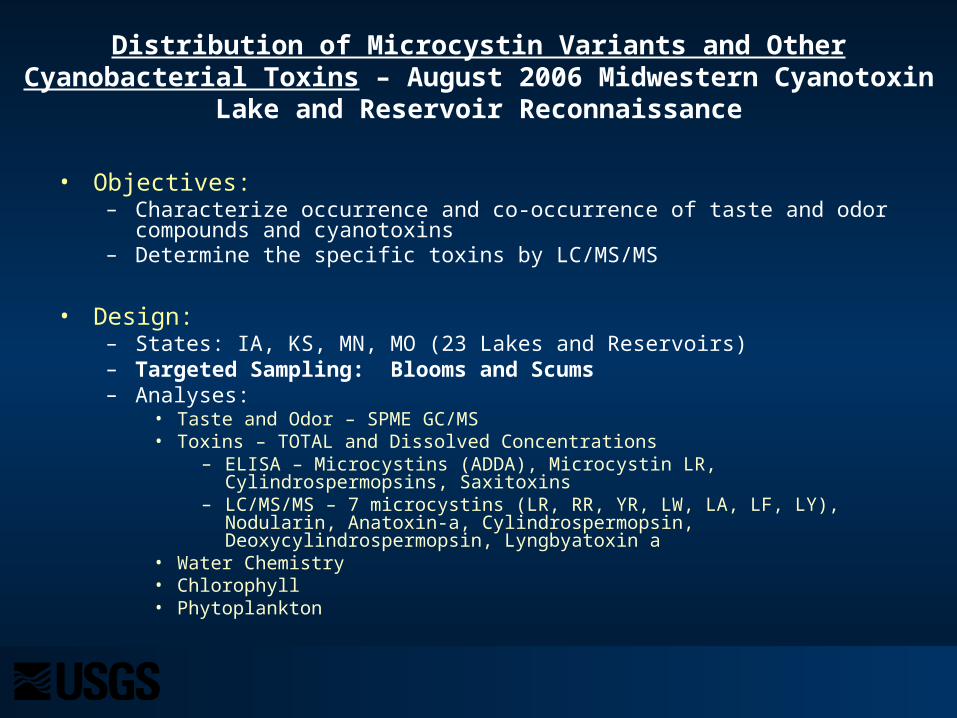
• Distribution of Microcystin Variants and Other Cyanobacterial Toxins
• Long Term Studies to Identify the Key Environmental Factors Leading to Toxic/Taste-and-Odor Producing Blooms
• Methods for Early Detection
• Predictive Models
Cheney Reservoir, KS June 2003Photo Courtesy of KDHE
Thomas Lake, NE May 2006Photo from Omaha NBC News
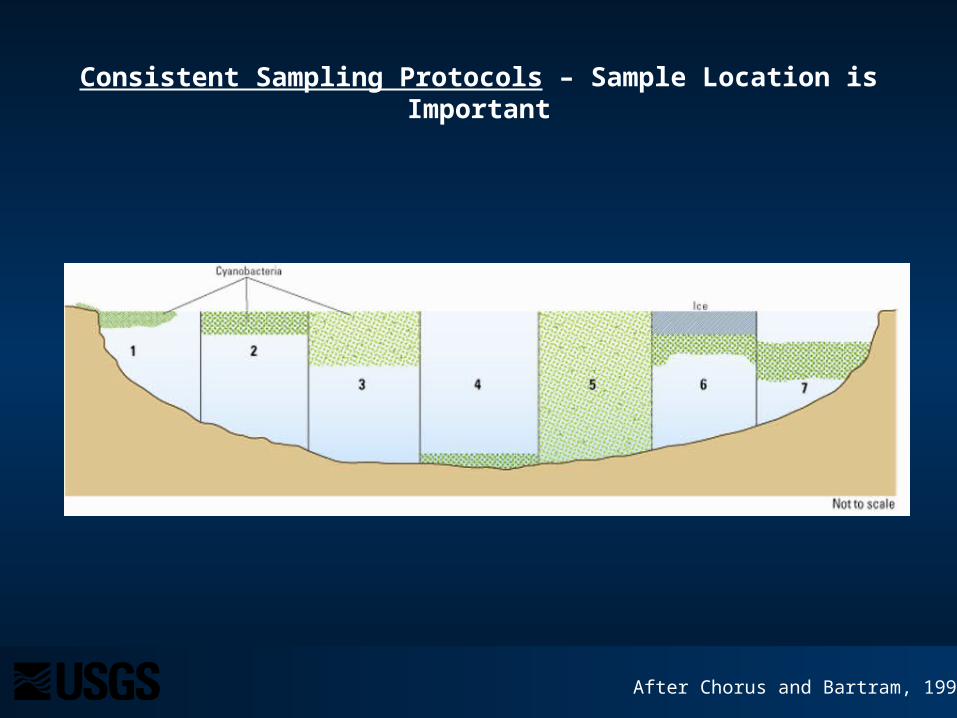
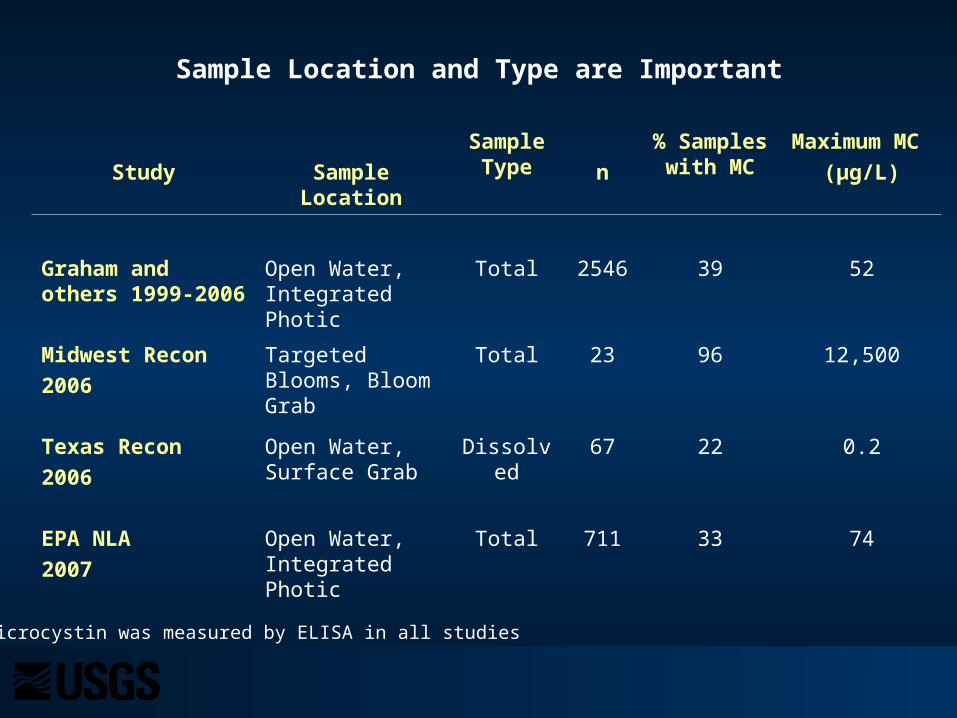
Consistent Sampling Protocols – Sample Location is Important
After Chorus and Bartram, 1999
Concentrations of Toxins and Taste-and-Odor Compounds May Vary by Orders of Magnitude at Different Sample Locations Within a Lake
Cheney Reservoir, KS September 2006
Microcystin: 13 µg/LGeosmin: 0.25 µg/L
Microcystin: 4 µg/LGeosmin: Not Detected
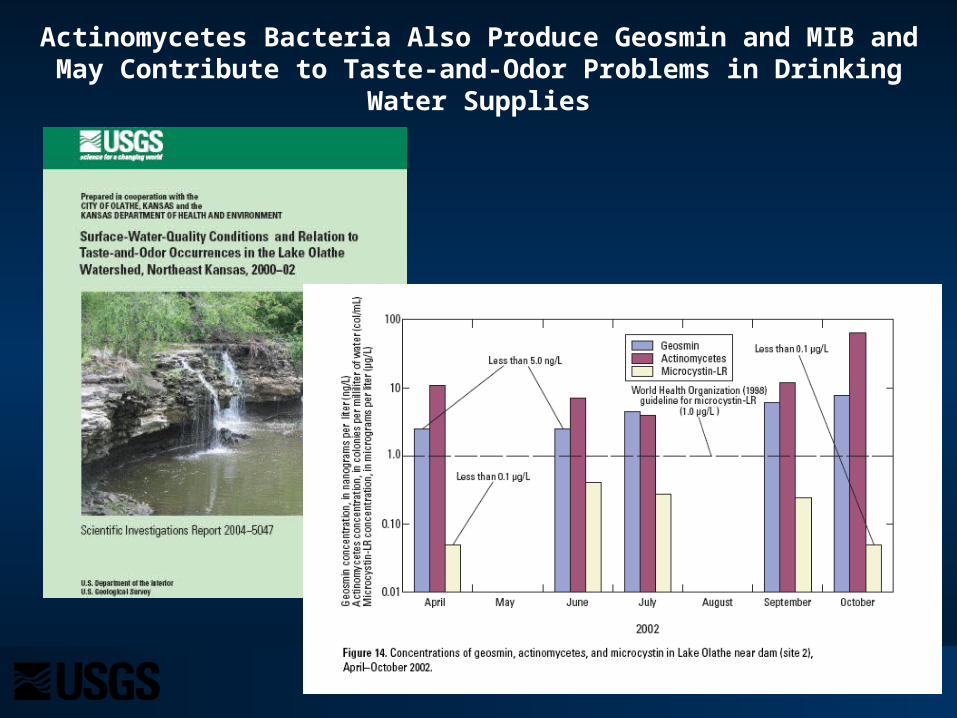
Actinomycetes Bacteria Also Produce Geosmin and MIB and May Contribute to Taste-and-Odor Problems in Drinking Water Supplies
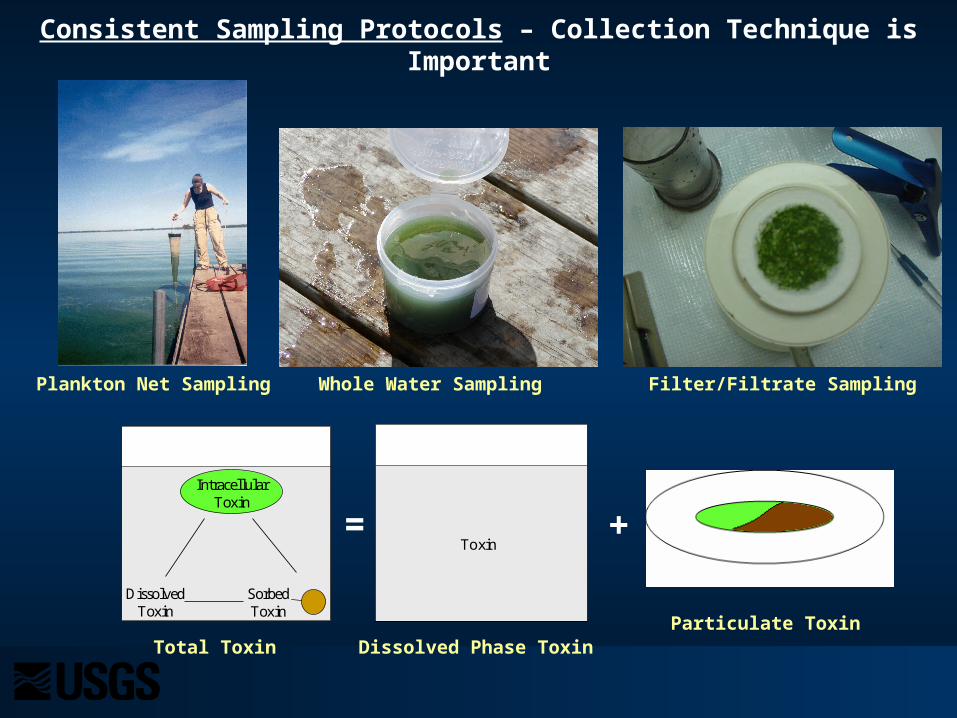
Consistent Sampling Protocols – Collection Technique is Important
ToxinToxin
IntracellularToxin
DissolvedToxin
SorbedToxin
IntracellularToxin
DissolvedToxin
SorbedToxin
Total Toxin Dissolved Phase Toxin
= +
Particulate Toxin
Plankton Net Sampling Whole Water Sampling Filter/Filtrate Sampling
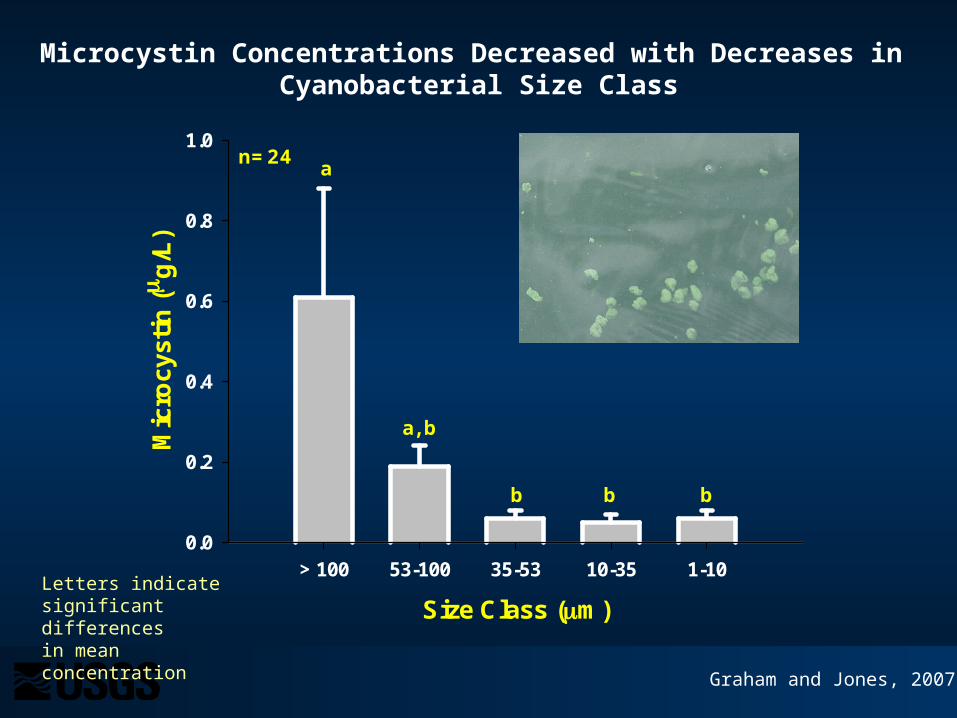
Microcystin Concentrations Decreased with Decreases in Cyanobacterial Size Class
Size Class (m)
> 100 53-100 35-53 10-35 1-10
Mic
rocy
stin
( g
/L)
0.0
0.2
0.4
0.6
0.8
1.0
a
a, b
bbb
n=24
Graham and Jones, 2007
Letters indicate significant differencesin mean concentration
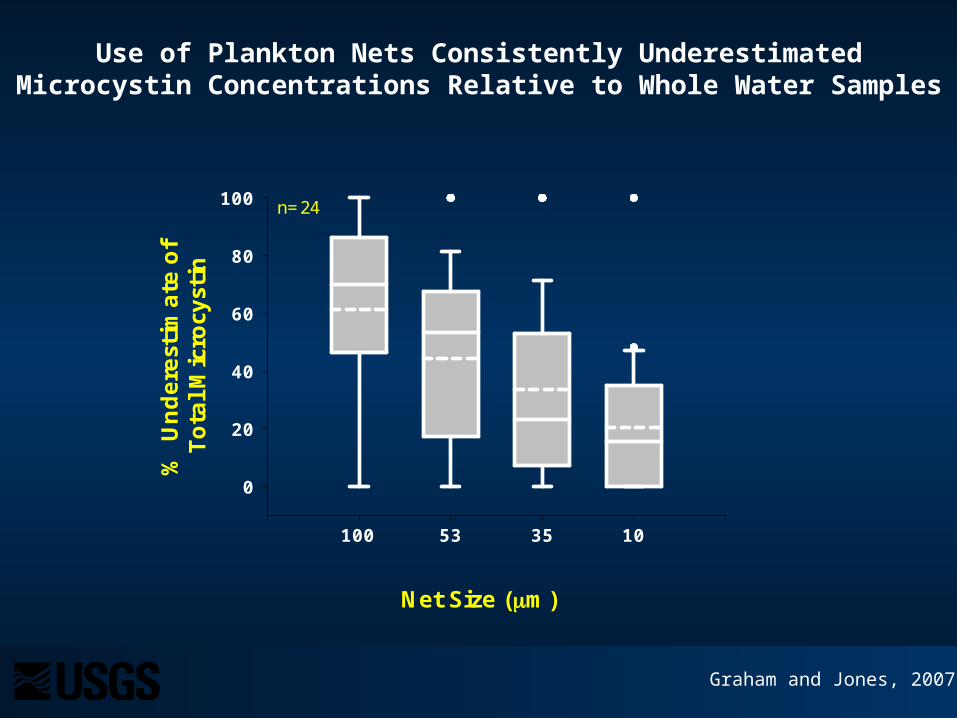
Net Size (m)
% U
ndere
stim
ate
of
Tota
l M
icro
cyst
in
0
20
40
60
80
100
100 53 35 10
n=24
Use of Plankton Nets Consistently Underestimated Microcystin Concentrations Relative to Whole Water Samples
Graham and Jones, 2007
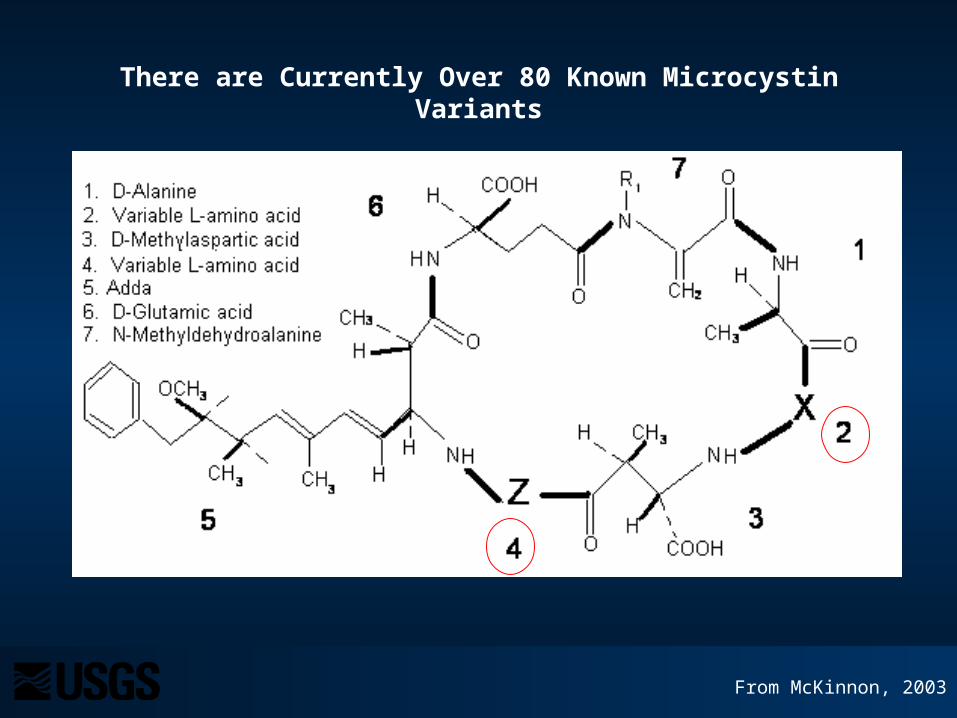
There are Currently Over 80 Known Microcystin Variants