86
CYANOBACTERIAL PEPTIDE TOXINS

CYANOBACTERIAL PEPTIDE TOXINS


–329–
CYANOBACTERIAL PEPTIDE TOXINS
1. Exposure data
1.1 Introduction
Cyanobacteria, also known as blue-green algae, are widely distributed in fresh,
brackish and marine environments, in soil and on moist surfaces. They are an ancient
group of prokaryotic organisms that are found all over the world in environments as
diverse as Antarctic soils and volcanic hot springs, often where no other vegetation can
exist (Knoll, 2008). Cyanobacteria are considered to be the organisms responsible for the
early accumulation of oxygen in the earth’s atmosphere (Knoll, 2008). The name ‘blue-
green’ algae derives from the fact that these organisms contain a specific pigment,
phycocyanin, which gives many species a slightly blue-green appearance.
Cyanobacterial metabolites can be lethally toxic to wildlife, domestic livestock and
even humans. Cyanotoxins fall into three broad groups of chemical structure: cyclic
peptides, alkaloids and lipopolysaccharides. Table 1.1 gives an overview of the specific
toxic substances within these broad groups that are produced by different genera of
cyanobacteria together, with their primary target organs in mammals. However, not all
cyanobacterial blooms are toxic and neither are all strains within one species. Toxic and
non-toxic strains show no predictable difference in appearance and, therefore,
physicochemical, biochemical and biological methods are essential for the detection of
cyanobacterial toxins.
The most frequently reported cyanobacterial toxins are cyclic heptapeptide toxins
known as microcystins which can be isolated from several species of the freshwater
genera Microcystis, Planktothrix (Oscillatoria), Anabaena and Nostoc. More than
70 structural variants of microcystins are known. A structurally very similar class of
cyanobacterial toxins is nodularins (< 10 structural variants), which are cyclic
pentapeptide hepatotoxins that are found in the brackish-water cyanobacterium
Nodularia.

330 IARC MONOGRAPHS VOLUME 94
Table 1.1. General features of the cyanotoxins
Toxin groupa Primary target organ in mammals
Cyanobacterial generab
Cyclic peptides
Microcystins Liver Microcystis, Anabaena,
Planktothrix (Oscillatoria),
Nostoc, Hapalosiphon,
Anabaenopsis
Nodularin Liver Nodularia
Alkaloids
Anatoxin-a Nerve synapse Anabaena, Planktothrix
(Oscillatoria), Aphanizomenon
Aplysiatoxins Skin Lyngbya, Schizothrix,
Planktothrix (Oscillatoria)
Cylindrospermopsins Liverc Cylindrospermopsis,
Aphanizomenon, Umekazia
Lyngbyatoxin-a Skin, gastrointestinal tract Lyngbya
Saxitoxins Nerve axons Anabaena, Aphanizomenon,
Lyngbya, Cylindrospermopsis
Lipopolysaccharides Potential irritant; affects any
exposed tissue
All
From Sivonen & Jones 1999 a Many structural variants may be known for each toxin group. b Not all species of the particular genus produce toxins. c Whole cells of toxic species elicit widespread tissue damage, including damage to kidney and lymphoid tissue.
1.2 Chemical and physical properties
Cyclic peptides are comparatively large natural products that have a molecular weight
in the range of 800–1100 but are relatively small compared with many other cell
oligopeptides and polypeptides (proteins) (molecular weight, > 10 000). Nodularins and
microcystins contain either five (nodularins) or seven (microcystins) amino acids; the two
terminal amino acids of the linear peptide are condensed (joined) to form a cyclic
compound.
The common structure of microcystins is cyclo(D-alanyl–L-X–D-erythro-β-
methylaspartyl(iso-linkage)-L-Z-ADDA–D-glutamyl(iso-linkage)-N-methyldehydroalanyl)
where ADDA stands for the β-amino acid, 3-amino-9-methoxy-2,6,8-trimethyl-10-
phenyldeca-4(E),6(E)-dienoic acid, which is unique to microcystins and nodularins. The

CYANOBACTERIAL PEPTIDE TOXINS 331
main structural variation in microcystins is observed in the L-amino acid residues 2 (X)
and 4 (Z), which are indicated by a two-letter suffix; for example, the common
microcystin-LR contains leucine (L) in position 2 and arginine (R) in position 4
(Carmichael et al., 1988a; Falconer, 2005).
The ADDA side chain is a key structural element that is necessary for biological
activity. Separation of the ADDA component from the cyclic peptide renders both
components non-toxic (Carmichael, 1992). L Amino acids vary among toxins and a large
number of combinations can be formed. To date, more than 70 microcystins have been
discovered including non-toxic geometric isomers of microcystins-LR and -RR (Sivonen
et al., 1992; Sivonen & Jones, 1999; Codd et al., 2005). Microcystins are stable at high
temperatures for extended periods and are not denatured by boiling. They are non-
volatile, resistant to changes in pH and are soluble in water, ethanol and acetone.
The common structure of nodularins is cyclo(D-methylaspartyl1-L-arginine2-ADDA3-
D-glutamate4-Mdhb5), in which Mdhb is 2-(methylamino)-2-dehydrobutyric acid. A few
naturally occurring variations of nodularin have been found: two demethylated variants,
one with D-aspartyl1 instead of D-methylaspartyl1 and the other with DMADDA3 instead
of ADDA3, and the non-toxic nodularin which has the 6(Z)-stereoisomer of ADDA3
(Namikoshi et al., 1994; Chorus & Bartram, 1999). The key difference between
microcystins and nodularins is that the former usually occur as a mixture of several
structural variants, whereas the variants of nodularins (i.e. demethylated or with modified
ADDA) are rarely found.
1.2.1 Nomenclature
Microcystins
Nomenclature, Chemical Abstracts Service Registry (CAS) number and synonyms of
the individual microcystins including microcystin-LR are listed in Table 1.2.
Nodularin
Chem. Abst. Serv. Reg. No.: 118399–22–7
CAS Name: Cyclo[(2S,3S,4E,6E,8S,9S)-3-amino-9-methoxy-2,6,8-trimethyl-10-
phenyl-4,6-decadienoyl-D-γ-glutamyl-(2Z)-2-(methylamino)-2-butenoyl-(3S)-3-methyl-
D-β-aspartyl-L-arginyl]
Synonyms: Cyclo[(Z)-2,3-didehydro-N-methyl-2-aminobutanoyl-erythro-3-methyl-D-
β-aspartyl-L-arginyl-(2S,3S,4E,6E,8S,9S)-4,5,6,7-tetradehydro-9-methoxy-2,6,8-trimethyl-
10-phenyl-3-aminodecanoyl-D-γ-glutamyl]; nodularin R; 1,4,8,11,15-pentaazacyclo-nona-
decane, cyclic peptide derivative

332 IARC MONOGRAPHS VOLUME 94
Table 1.2. Nomenclature of individual microcystins including microcystin-LR
CAS Name CAS Registry number Synonyms
Microcystin-LR 101043-37-2
Deleted CAS numbers: 847664-11-3;
128657-50-1
5-l-Arginine-microcystin LA;
cyanoginosin-LA, 5-l-arginine; cyanoginosin LR; cyclo[2,3-didehydro-N-Me-ala-d-ala-l-leu-erythro-
3-Me-d-β-asp-l-arg-(2S,3S,4E,6E,8S,9S)-4,5,6,7-tetradehydro-9-methoxy-2,6,8-trimethyl-10-phenyl-
3-aminodecanoyl-d-γ-glu]; Toxin I (Microcystis aeruginosa); Toxin T17 (Microcystis aeruginosa)
Microcystin 77238-392 Cyanoginosin; Fast-Death Factor
Microcystin-LA 96180-79-9 Cyanoginosin-LA; Toxin BE 4
Microcystin-YM 101043-35-0 Cyanoginosin-LA, 3-l-tyr-5-l-met; cyclo(ala-tyr-Me-asp-met-ADDA-glu-MDHA); cyclo(ala-tyr-
Me-asp-met-3-methoxy-2,6,8-trimethyl-10-phenyldeca-4,6-dienoic acid-glu-
methyldehydrolanyl)
Microcystin-YR 101064-48-6 Cyanoginosin-LA, 3-l-tyrosine-5-l-arginine
Microcystin-RR 111755-37-4 Cyanoginosin-LA, 3-l-arginine-5-l-arginine
Microcystin-FR 111982-70-8 Cyanoginosin-LA, 3-l-phenylalanine-5-l-arginine
Toxin III (Microcystis aeruginosa)
118389-26-7 Cyanoginosin-LA, 3-l-arginine-4-d-β-aspartic acid-5-l-arginine; 3-desmethylmicrocystin RR;
microcystin D
Toxin II (Microcystis
aeruginosa)
120011-66-7 Cyanoginosin-LA, 4-d-β-aspartic acid-5-l-arginine;
cyclo-ala-leu-isoasp-arg-ADDA-isoglu-N-MDHA; 3-desmethylmicrocystin LR; microcystin-A; toxin
T16 (Microcystis aeruginosa)
Microcystin-LY 123304-10-9 Cyanoginosin-LA, 5-l-tyr
Microcystin-WR 138234-58-9 Cyanoginosin-LA, 3-l-tryptophan-5-l-arginine
Microcystin-AR 138258-91-0 Cyanoginosin-LA, 3-l-alanine-5-l-arginine
Microcystin-LL 154037-67-9 Cyanoginosin-LA, 5-l-leucine
Microcystin-LF 154037-70-4 Cyanoginosin-LA, 5-l-phenylalanine
Microcystin-LW 157622-02-1 Cyanoginosin-LA, 5-l-tryptophan
ADDA, β-amino acid, 3-amino-9-methoxy-2,6,8-trimethyl-10-phenyldeca-4(E),6(E)-dienoic acid; ala,
alanyl; arg,arginyl; asp, aspartyl; CAS, Chemical Abstracts Services; glu, glutamyl; leu, leucyl; met, methionine; MDHA, methyldehydroalanyl ; Me, methyl; tyr, tyrosine

CYANOBACTERIAL PEPTIDE TOXINS 333
1.2.2 Structural and molecular formulae
Microcystin-LR
NH
O
N
O
N
CH2
N
CH3 N
NH
N
O
O
CH3
CH3 H3C
O OHCH3 O
HH
O
H CH3 H
O
HN NH2
OHO
N
OH
CH3
CH3
CH3
C49H74N10O12
Nodularin
NHH
N
H
N
CH3
O
N
N
OOHO
OCH3
CH3
H
OHOO
NH
HN NH2
OCH3CH3
OCH3 H3C
C41H60N8O10

334 IARC MONOGRAPHS VOLUME 94
1.3 Analysis
A wide range of laboratory methods have been used to detect and identify
cyanotoxins in water and solid matrices (including biomass); there is no single method
that will provide adequate monitoring for all cyanotoxins.
Methods for determining microcystins and nodularins include: (a) physicochemical
analysis by chromatographic separation (high-performance liquid chromatography
[HPLC], gas chromatography, liquid chromatography) and detection either by ultraviolet
absorbance (photodiode array detector) or mass spectrometry; (b) an immunoassay
(enzyme-linked immunosorbent assay [ELISA]) for which several kits are commercially
available; and (c) an enzyme assay that uses inhibition of protein phosphatase (Falconer,
2005).
An International Standards Organization (2005) method for the analysis of
microcystin by HPLC is available, although currently no certified standard microcystins
are available (McElhiney & Lawton, 2005). While chemical analysis differentiates
between the structural variants of microcystin, immuno- and enzyme assays detect the
sum of all microcystins in a sample. The systematic errors that are associated with the
immuno- and enzyme assays are due to differences in reactivity between variants, but
these assays are usually more rapid, require less elaborate equipment and may be cheaper
when large numbers of samples are analysed (Falconer, 2005; McElhiney & Lawton,
2005).
ELISAs are widely used for the detection of microcystins and nodularins because of
the ease of the procedure and the fact that they only require equipment that is readily
available. Because of the many variants of microcystins and nodularins and the possible
presence of metabolites and toxin covalently bound to protein phosphatases, antibodies
give different results according to their respective affinities. This complicates the
interpretation of quantitative data. ELISAs are therefore best used on simple well-defined
samples. Many investigators have raised antibodies to microcystins and nodularins and
have developed immunoassays that are more or less specific and vary largely in their
reactivities to the different microcystin and nodularin variants or in their capabilities to
detect non-cyclic degradation products (Chu et al., 1989; An & Carmichael, 1994;
Bourne et al., 1996; Nagata et al., 1999; Baier et al., 2000; Fischer et al., 2001; Mikhailov
et al., 2001; Zeck et al., 2001; McElhiney et al., 2002; Hilborn et al., 2005).
Inhibition of protein phosphatase measures free microcystins and nodularins and any
metabolites that may still retain inhibitory activity. Conversely the method cannot detect
or measure any microcystin that is covalently bound to cellular protein phosphatase or
any metabolite that is not active. It is an assay that requires specific care, particularly in
complex matrices such as cell or tissue extracts (Tencalla & Dietrich, 1997; Runnegar et
al., 1999).
Other ways of determining toxicity are by bioassays in mice or other whole animals
or in cells (Falconer, 2005).
CYANOBACTERIAL PEPTIDE TOXINS 335
HPLC or more advanced combinations of liquid chromatography and mass
spectrometry may require complex steps of cleaning and concentrating but are best for the
identification of microcystin and nodularin variants and the quantitation of toxins and
metabolites. The disadvantage is that they require sophisticated equipment and expertise
for reliable results (Azevedo et al., 2002; Hilborn et al., 2005).
1.4 Occurrence
Cyanobacteria are ubiquitous in water bodies with a great range of salinity and
temperature, and occur in and on the soil as well as on rocks and in their fissures. In
general, they are most abundant in nutrient-rich waters. Their growth is particularly
favoured in lakes or water reservoirs where eutrophication occurs. Lake ‘ageing’ or
eutrophication occurs primarily as a result of an increase in nutrients, in biological activity
(productivity) and in sediments and organic matter from the watershed that fill the water
basin. It is now accepted that human activities (e.g. domestic, industrial and agricultural
wastes) play a significant role in the eutrophication or ageing process of the world’s water
bodies. In the seasonal cycle of freshwater phytoplankton that occur in temperate lakes,
the appearance of cyanobacteria is probably due to the increased light and temperature at
the end of spring. In water bodies that have a eutrophic to hypereutrophic nutrient status,
the intensity and duration of cyanobacterial blooms are increased (Carmichael, 1996).
In addition to their wide range of social, economic and environmental impacts,
cyanobacterial waterblooms which produce biotoxins are of particular concern for animal
and human health; the more commonly occurring hepatotoxic biotoxins are microcystins
and nodularins (Carmichael, 1996). In aquatic environments, these toxins usually remain
contained within the cyanobacterial cells and are only released in substantial amounts
during cell lysis or after cell death. This may occur naturally, although such events are
short-lived, or through water treatment, e.g. by the application of copper sulfate to
reservoirs to kill algae and cyanobacterial mass development. Release during some
processes of drinking-water treatment may also be of concern (Falconer et al., 1983).
Together with the high chemical stability and water solubility of microcystins, this
containment has important implications for their environmental persistence in bodies of
surface water and consequent human exposure (Sivonen & Jones, 1999).
1.4.1 Concentrations of microcystin and nodularin in water bodies
An increasing number of surveys worldwide have addressed the frequency of
occurrence and the concentrations at which microcystins are found. Compilations of data
(e.g. Sivonen & Jones, 1999; Fastner et al., 2001; Kardinaal & Visser, 2005) as well as
overviews of case reports (e.g. Chorus, 2001) have been published, which cover a wide
range of geographical regions and types of water body. More recently, survey results have
also emerged from tropical settings (e.g. Morocco, Oudra et al., 2001; Kenya, Ballot et
al., 2003; Bangladesh, Welker et al., 2005), most of which found that microcystins were
336 IARC MONOGRAPHS VOLUME 94
present in more than half of the samples tested, and that both the likelihood of the
occurrence of microcystins and their concentrations increase with the abundance of
cyanobacterial taxa.
Fewer data are available on the occurrence of nodularins. Results have focused on the
Baltic Sea (e.g. Sivonen et al., 1989) and the Australian and New Zealand coastal areas
(e.g. Carmichael et al., 1988b; Jones & Orr, 1994).
Table 1.3 (adapted from Sivonen & Jones, 1999) gives examples of concentrations of
microcystin and nodularin reported in cyanobacterial bloom and water samples
worldwide. Microcystin concentrations range from non-detectable to several milligrams
per litre, and extremes of 10–25 mg microcystin-LR equivalents per litre have been
reported in scum samples. Concentrations of micrograms per litre are often found,
particularly when Microcystis spp. or Planktothrix spp. (syn. Oscillatoria) proliferate.
Even in the absence of scum formation, these can cause levels of around 100 µg/L when
both population density and toxin content per cell are high. For example, in a survey of
Bangladeshi ponds in 2002 (Welker et al., 2005), microcystins were found in
39/79 ponds, 26 of which contained more than 10 µg/L and 18 more than 100 µg/L.
Where cells accumulate, particularly in surface scums of Microcystis spp., concentrations
in the range of milligrams per litre are not uncommon. With very few exceptions, these
findings relate to cell-bound microcystin and, when the fraction dissolved in water was
measured, it was usually very low (from < 1 to 5% of cell-bound microcystin; see Fastner
et al., 2001 for a compilation of data from five studies).
Some structural microcystin variants are typically produced by certain genera or
species, and the profile of microcystin variants can be quite typical for a given population
of—for example—P. agardhii or Microcystis spp. (Fastner et al., 1999a). However, there
is also overlap between taxa of microcystins; different strains of the same species show
somewhat different microcystin profiles, and specific microcystin variants cannot be
allocated unambiguously to certain cyanobacterial species.
In contrast, the production of nodularins appears to be species-specific. Laamanen et
al. (2001) tested 345 single filaments from six different locations in the Baltic Sea using
molecular methods for the allele to indicate nodularin production, and the results
suggested that nearly all planktonic Nodularia (97%) in the Baltic sea produce this toxin.
Interestingly, a close correlation was reported between the biomass concentration of
N. spumigena and the concentration of nodularin which indicated a genetically very stable
population of Nodularia that produces constant levels of nodularin (Chorus, 2001). In
several Australian localities, Bolch et al. (1999) demonstrated that nodularin blooms
within a water body tend to be clonal, which confirms the stability of toxin production.
Furthermore, the data of Laamanen et al. (2001) in the Baltic Sea suggest that
N. baltica and N. litorea may both belong to the species N. spumigena, which may
produce different morphotypes. If these results can be generalized and also hold true for
other ecoregions, this would mean that nodularin is produced by only one species and that
the large majority of strains of this species produce the toxin.

CYANOBACTERIAL PEPTIDE TOXINS 337
Table 1.3. Concentrations of toxin reported in cyanobacterial bloom or water samples worldwide
Location Period of study
No. of positive samples
(total no. of samples)
Toxins identified Range of total concentrations (µg/g dry weight,
unless otherwise indicated)
Microcystins
Australia 1991 4 Microcystins, 24 unidentified 2100–4100a
Canada, Alberta 1990 37 (50) Microcystin-LR 4–610 Canada, Alberta (3 lakes) 1990–93 168 (226) Microcystin-LR 1–1550
China 1988 5 (10) Microcystin-RR,-LR 200–7300 Czech and Slovak Republic 1995–96 (63) Microcystin-LR 4–6835
Denmark 1992–94 Microcystin-RR,-LR 3–2800 Denmark 1993–95 198 (296) Microcystins 5–1900
Finland 1994–95 17 (20) Microcystin-LR >10–800 France 1994 16 (22) Microcystins 70–3970
France, Lake Grand-Lieu 1994 19 (30) Microcystins 30–230 Germany 1992 8 (15) Microcystin-LR 36–360
Germany 1993 17 (18) Microcystins 0.15–36a,b Germany 1995–96 385 (533) Microcystins 1–5000
Germany 1997 34 Microcystins, several 1–25 000b
Japan 1990 12 (14) Microcystin-RR, -YR, -LR 160–950
Japan 1988–92 11 (19) Microcystin-RR, -YR, -LR 70–1610 Japan, Lake Suwa 1980–91 13 Microcystin-RR, -YR, -LR 30–2100
Japan 1986–88 4 (4) Microcystin-RR, -YR, -LR 100–860 Japan 1992–95 18 (22) Microcystin-RR, -YR, -LR 0.04–480b
Japan 1993–95 46 (57) Microcystins 0.05–1300a,b Japan 1993–94 12 (17) Microcystins 0.06–94a,b
300–15 600a,b Japan 1989–94 10 (10) Microcystins 330–19 500a,b
Portugal 1989–92 12 (12) Microcystin-LR plus six known and three unidentified
microcystins
1000–7100
Portugal 1994–95 28 (29) Microcystins 0.1–37a,b
South Africa 1985–86 Microcystin-FR, -LR, -YR, -LA, -YA
5–420
South Africa 1988–89 9 (9) Microcystin-YR, -LR, -FR, -YA, -LA
40–630
United Kingdom 1992 3 (3) Microcystins 17–131a,b USA, Wisconsin 1993 9 Microcystins 1900–12 800a
Nodularins
Australia, Tasmania,
Orielton Lagoon Baltic Sea
1992–93
1985–87
7 (9)
17 (23)
Nodularin
Nodularin
2000–3500
<100–2400
Baltic Sea 1990–91 6 (16) Nodularin 300–18 000
Adapted from Sivonen & Jones (1999) a Microcystin-LR b Given as µg/L

338 IARC MONOGRAPHS VOLUME 94
Concentration per unit biomass of nodularin appears to be higher than that reported
for microcystins: up to 18 mg/g dry weight of biomass were found in the Baltic Sea
(Sivonen et al. 1989; Sivonen & Jones, 1999). While scum accumulations of Nodularia
are likely to contain high concentrations of nodularin, concentrations in the open sea are
rarely above a few micrograms per litre (e.g. Repka et al., 2004), merely because
Nodularia filaments are less likely to accumulate.
In summary, microcystins are most liable to occur where cyanobacteria of the genera
Microcystis or Planktothrix are found, and field populations of these genera that do not
produce microcystins are rarely found. Nodularin is most liable to occur where
N. spumigena is found. Microcystins are also found in populations of Anabaena spp.,
although less regularly (Fastner et al., 1999b), but have been reported less frequently in
populations of other microcystin-producing taxa. However, it is currently unclear whether
this is because such populations occur less frequently at sufficiently high levels to cause
concern or whether they are less likely to contain microcystins. Some mat-forming
cyanobacteria (e.g. Phormidium spp.) may contain microcystins, and, since such mats
may become detached, exposure to microcystins may occur through this phenomenon
(Mohamed et al., 2006). Microcystins and nodularins mainly occur as cell-bound entities.
Extracellular concentrations greater than 1–5% of the intracellular concentrations have
rarely been reported and are observed only under conditions that are detrimental for cell
survival which trigger cell lysis and thus release microcystin. The consequences for risk
assessment are that exposure is highest when cells are ingested or aspired.
Microcystins are very stable chemically (Harada et al., 1996). Although their
photodegradation has been demonstrated (Tsuji et al., 1995; Welker & Steinberg, 1999),
this process is usually of minor relevance, because water bodies that typically contain
elevated concentrations of microcystin are usually quite eutrophic and consequently rather
turbid. Microbial degradation of microcystins dissolved in water can be rapid (Jones et
al., 1994). Lag phases are sometimes observed before degradation occurs, probably
because bacteria that can degrade microcystins are not always present in sufficient
numbers or need to adapt. However, once degradation begins, half-lives have been
reported to be in the range of a few days and often only 1–2 days (Welker & Steinberg,
1999).
1.4.2 Factors that influence concentrations of microcystin and nodularin
The initial data obtained in molecular and physiological studies suggested that
environmental factors as well as composition and dynamics of the cyanobacterial
population are involved in the total concentration of the toxins in the water bodies.
Clearly, however, more field experiments need to be conducted to assess fully the real
impact of these two factors and to elaborate efficient water management (Dittmann &
Börner, 2005).

CYANOBACTERIAL PEPTIDE TOXINS 339
(a) Population composition
Microcystins are produced by bloom-forming species of Microcystis, Anabaena,
Oscillatoria (Planktothrix) and Nostoc (see Table 1.1), by a species of Anabaenopsis and
by a soil isolate of Haphalosiphon hibernicus.
Nodularins have been found, with the exception of the marine sponge Theonella, only
in N. spumigena (Table 1.1).
Cyanobacterial populations may be dominated by a single species or be composed of
a variety of species, some of which may be not toxic. Even within a single-species bloom,
there may be a mixture of toxic and non-toxic strains. Some strains are much more toxic
than others, sometimes by more than three orders of magnitude. This means that one
highly toxic strain, even when it occurs in small amounts among larger numbers of non-
toxic strains, may render the bloom sample toxic (Sivonen & Jones, 1999; Janse et al.,
2005).
Whether or not a strain produces the peptide toxins depends on its possession of the
gene cluster that encodes for the multienzyme complex which is necessary for
microcystin production (Kurmayer et al., 2003; Via-Ordorika et al., 2004). Strains both
with and without these genes have been found for all potentially peptide-producing taxa
known to date. Field populations of microcystins typically consist of a mixture of
genotypes, i.e. with and without genes for microcystin production. The relative
distribution of these genotypes, as well as the microcystin content of the respective
clones, are major determinants of the concentrations of microcystin caused by a given
cyanobacterial population. Gene probes are available to assess whether or not a given
culture strain has the potential to produce microcystin (Tillett et al., 2000).
In contrast, for nodularins, populations of N. spumigena may contain only producer
genotypes.
(b) Physiological responses
Numerous laboratory experiments with microcystin- or nodularin-producing strains of
different cyanobacterial taxa have addressed the extent to which their net microcystin or
nodularin production is affected by environmental conditions, i.e. availability of light,
concentrations of nutrients and temperature (reviewed in Sivonen & Jones, 1999;
Kardinaal & Visser, 2005). Contrary to earlier working hypotheses, levels of
cyanobacterial toxins in field populations are not determined primarily by variations in
environmental conditions that impact on the production rates of the cells but depend
directly on the population sizes of cyanobacterial species and the relative distribution of
genotypes with or without genes for microcystin production.
In some water bodies, the ratios of microcystins to biomass appear to vary rather
rapidly, and there is some indication that levels of Microcystis spp. are higher at the
beginning of the growing season (Kardinaal & Visser, 2005). In some water bodies,
particularly those dominated by P. agardhii, the ratios remain stable throughout most of a
growing season or even for several years (Janse et al., 2005). This may also be the case

340 IARC MONOGRAPHS VOLUME 94
for nodularin and Nodularia. Once this has been established for a given water body and
particularly where cyanobacteria dominate the phytoplankton or form blooms, biomass
estimates of the microcystin-producing cyanobacterial taxa may be useful site-specific
surrogates for the approximation of concentrations of microcystin (Kardinaal & Visser,
2005).
1.5 Human exposure
Pathways of exposure to microcystins and nodularin in most settings are largely
through water. In deriving its provisional guideline value for microcystin-LR, WHO
(2003a) assumed an allocation factor of 80% to water as an exposure pathway. However,
in specific settings, other pathways may gain major significance or be dominant.
Therefore, to assess human health risks from microcystins, all potential exposure
pathways should be considered. These include: recreational exposure, particularly to
scums and in situations of high turbidity due to dispersed cyanobacterial cells, drinking-
water, particularly in settings where particle removal is poor, haemodialysis during which
surface water is used and treatment fails, occupational exposure to aerosols when surface
water that contains cyanobacterial cells is used, e.g. in irrigation or for cooling water,
‘health food’ or dietary supplement tablets produced from cyanobacteria, and fish and
mussels.
An important aspect of pathways of human exposure is that microcystins and
nodularins do not appear to enter the human body through dermal exposure but chiefly
through active transport mechanisms (see Section 4.1). Consequently, exposure requires
ingestion or aspiration of water or food that contains cyanobacterial cells that have these
peptides and/or dissolved cyanopeptides.
It is probable that the same human populations are exposed repeatedly to microcystins
as a result of on-going contamination of freshwater sources, e.g. by M. aeruginosa,
P. agardhii or P. rubescens, or brackish water sources that contain N. spumigena. Natural
lakes and drinking-water reservoirs that are affected by these organisms regularly develop
seasonal or perennial water blooms. Rural and less developed country populations that
use surface water without treatment are also vulnerable to exposure. However, few studies
on chronic exposure have been carried out either experimentally in animals or
epidemiologically in human populations (WHO, 2003a).
1.5.1 Recreational exposure
Recreational exposure is the most probable pathway for ingestion of a high dose of
microcystins or nodularins. Any water sport that involves immersion of the head
invariably leads to some oral uptake or aspiration. Swimmers—if alerted to the hazard—
might control their action to reduce ingestion and aspiration. Activities such as
sailboarding, sailing in bad weather conditions or water skiing may lead to substantial
uptake of water, and aerosol uptake through the spray generated by coastal wave action
CYANOBACTERIAL PEPTIDE TOXINS 341
may lead to exposure to nodularin. Children who play in shallow bays in which
cyanobacterial scums tend to accumulate are particularly liable to swallow water.
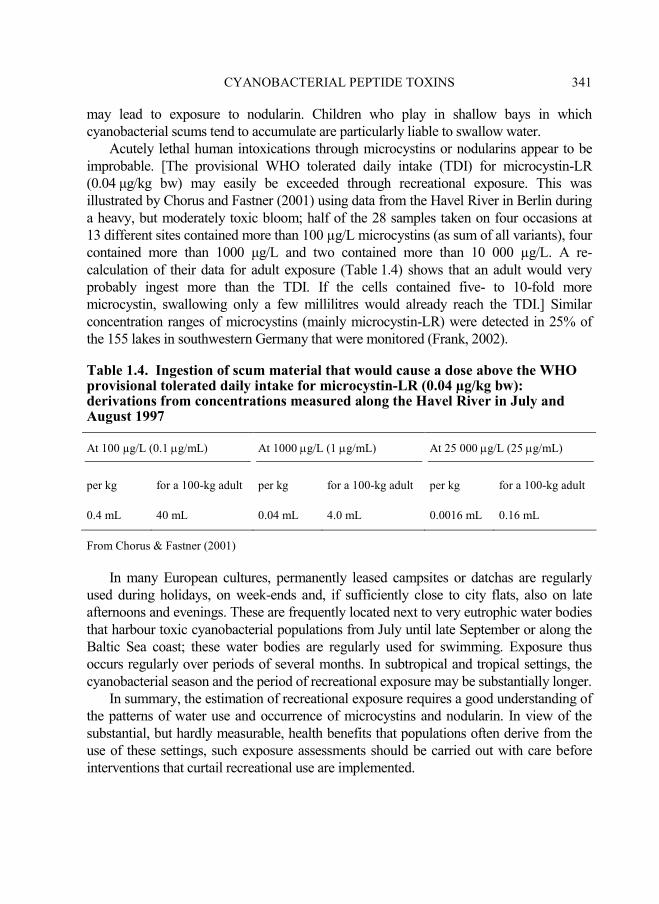
Acutely lethal human intoxications through microcystins or nodularins appear to be
improbable. [The provisional WHO tolerated daily intake (TDI) for microcystin-LR
(0.04 µg/kg bw) may easily be exceeded through recreational exposure. This was
illustrated by Chorus and Fastner (2001) using data from the Havel River in Berlin during
a heavy, but moderately toxic bloom; half of the 28 samples taken on four occasions at
13 different sites contained more than 100 µg/L microcystins (as sum of all variants), four
contained more than 1000 µg/L and two contained more than 10 000 µg/L. A re-
calculation of their data for adult exposure (Table 1.4) shows that an adult would very
probably ingest more than the TDI. If the cells contained five- to 10-fold more
microcystin, swallowing only a few millilitres would already reach the TDI.] Similar
concentration ranges of microcystins (mainly microcystin-LR) were detected in 25% of
the 155 lakes in southwestern Germany that were monitored (Frank, 2002).
Table 1.4. Ingestion of scum material that would cause a dose above the WHO provisional tolerated daily intake for microcystin-LR (0.04 µg/kg bw): derivations from concentrations measured along the Havel River in July and August 1997
At 100 µg/L (0.1 µg/mL) At 1000 µg/L (1 µg/mL) At 25 000 µg/L (25 µg/mL)
per kg for a 100-kg adult per kg for a 100-kg adult per kg for a 100-kg adult
0.4 mL 40 mL 0.04 mL 4.0 mL 0.0016 mL 0.16 mL
From Chorus & Fastner (2001)
In many European cultures, permanently leased campsites or datchas are regularly
used during holidays, on week-ends and, if sufficiently close to city flats, also on late
afternoons and evenings. These are frequently located next to very eutrophic water bodies
that harbour toxic cyanobacterial populations from July until late September or along the
Baltic Sea coast; these water bodies are regularly used for swimming. Exposure thus
occurs regularly over periods of several months. In subtropical and tropical settings, the
cyanobacterial season and the period of recreational exposure may be substantially longer.
In summary, the estimation of recreational exposure requires a good understanding of
the patterns of water use and occurrence of microcystins and nodularin. In view of the
substantial, but hardly measurable, health benefits that populations often derive from the
use of these settings, such exposure assessments should be carried out with care before
interventions that curtail recreational use are implemented.

342 IARC MONOGRAPHS VOLUME 94
1.5.2 Exposure through drinking-water and haemodialysis
If the water is not treated to remove cyanobacterial cells, exposure scenarios for
drinking-water can be similar to those outlined under Section 1.5.1 for recreational use.
Disinfection in such situations probably does not degrade microcystins sufficiently, as
chlorine is consumed by the high level of organic material. Such settings exist in many
parts of the world, and a recent published example is ponds used in Bangladesh (Welker
et al., 2005).
Where drinking-water is treated to remove particles, some break-through of
microcystins may occur, although most of the microcystins are removed with the cells.
When drinking-water is treated by initial oxidation (e.g. chlorine or ozone), microcystins
are released from cells the process but may not be sufficient to oxidize all of the liberated
microcystin (Hoeger et al., 2005). Examples of concentrations of cyanobacteria and
toxins reported in drinking-water plants worldwide (Table 1.5) show that cyanobacterial
toxin levels are usually well below 1 µg/L and rarely substantially above a few
micrograms per litre.
Overall, exposure to microcystin through drinking-water can be assumed to be
significant in settings where poorly treated surface water sources are used, whereas it is
probably low or at least usually within the range of the provisional WHO guideline value
in communities that are served by larger utilities that perform well-managed particle and
organic contaminant maintenance, particularly when followed by an oxidation step.
Exposure through haemodialysis involves much larger amounts of water, i.e.
approximately 120 L per treatment, which are effectively equivalent to an intravenous
dose. This explains the severe impact of cyanotoxins on haemodialysis patients in
Caruaru, Brazil, (Jochimsen et al., 1998), and highlights the importance of both the choice
of the water source as well as excellent treatment of the water used in dialysis clinics.
1.5.3 Occupational exposure
Very few published data exist to demonstrate occupational exposure. However,
scenarios can be estimated from the understanding of pathways of uptake and occurrence
in surface waters. These would include any situation that leads to substantial ingestion or
inhalation. Anecdotal evidence has been proposed from spray irrigation in agriculture and
from aerosols produced by cooling the water used for mine drilling. Exposure would
appear to be probable during large-scale and commercial harvesting and processing of
cyanobacteria (e.g. for food supplements—see Section 1.5.4—and production of
cosmetics). Estimates of uptake are hampered by the difficulty of estimating the volumes
of water inhaled with such aerosols.
1.5.4 Exposure through cyanobacterial dietary supplements
Several regions in the world, e.g. Mexico, northern Africa and China, have a
documented history of use of blue-green algae (Spirulina and Nostoc spp.) as a food source

C
YA
NO
BA
CT
ER
IAL
PE
PT
IDE
TO
XIN
S
34
3
Table 1.5. Examples of concentrations of cyanobacteria and/or cyanobacterial toxins in drinking-water before and after
treatment in water plants worldwide
Location and source Water treatment Cyanobacteria Raw water Final water
Argentina, Bahía
Blanca
NR Anabaena/Microcystis 48×103
–84×103
cells/ mL 276–2.5×10³
cells/ mL
Australia, Queensland,
reservoir
Flocculation/sedimentation,
particulate activated carbon, slow
filtration, chlorination
Anabaena, Microcystis <2.200×10³
cells/ mL
<8 µg/L (microcystins)
<11×103
cells/ mL
0–0.5 µg/L (microcystins)
Bangladesh, lakes,
ponds, reservoirs
NR Microcystis Samples positive for microcystins samples positive for
microcystins
Brazil, Itaparica Dam Copper sulfate Anabaena, Microcystis NR NR
Canada, Alberta,
Camrose plant
Flocculation/sedimentation, slow
filtration, chlorination, particulate
activated carbon
NR 0.15–0.87 µg/L 0.09–0.18 µg/L
Canada, Alberta,
Ferintosh plant
Flocculation/sedimentation, slow
filtration, chlorination, granular
activated carbon
NR 0.27–2.28 µg/L 0.05–0.12 µg/L
Czech Republic NR NR ≤8.7 µg/L 0–7.79 µg/L
China NR NR 0.28–35.3 µg/L ≤1.4 µg/L
Finland Bank filtration
Particulate activated carbon
Planktothrix/Oscillatoria
NR
0.1–1.9 µg/L
NR
0.01–0.1 µg/L
≤0.001 µg/L
France, Saint-Caprais
reservoir
Particulate activated carbon
Particulate activated carbon
Aphanizomenon
NR
NR
63 µg/L
NR
NR
NR
33.2 ± 8.0 ng/L
≤0.001 µg/L
France, Lake Bourget Ozonation, slow filtration Planktothrix/Oscillatoria <18×103
cells/ mL
<5 µg/L
<6×10³
cells/ mL
<1 µg/L

34
4
IAR
C M
ON
OG
RA
PH
S V
OL
UM
E 9
4
Table 1.5 (contd)
Location and source Water treatment Cyanobacteria Raw water Final water
Germany, Dörtendorf,
Weida Reservoir
Microsieve,
flocculation/sedimentation, slow
filtration
Planktothrix/Oscillatoria 7.5–10 µg/L 0–0.1 µg/L
Germany, Rostock,
Warnow River
Ozonation,
flocculation/sedimentation, slow
filtration
Ozonation, activated carbon filtration
Microcystis
Planktothrix/Oscillatoria
10–28 µg/L
0.4–8.0 µg/L
0–0.2 µg/L
0.07–0.11 µg/L
Germany, Radeburg
Reservoir
Bank filtration Aphanizomenon/Microcystis 2–19 µg/L ≤0.06 µg/L
Israel, Lake Kinneret Flocculation/sedimentation,
chlorination
Aphanizomenon ≤150×103
cells/ mL NR
Italy, Lake Simbirizzi,
Lake Flumendosa, Lake
Mulargia
NR Planktothrix/Oscillatoria 480 and 220 µg/g dry weight NR
Korea, Republic of,
Lakes and reservoirs
Mostly only rapid sand filtration Microcystis (60%),
Anabaena (30%),
Planktothrix/Oscillatoria (10%)
0.6–171 µg/L NR
Latvia, Baltezers, Lake
Mazais
Slow filtration/bank filtration Aphanizomenon, Anabaena,
Microcystis
19–1229 µg/g dry weight;
lake: ≤0.63 µg/L;
infiltration basin: ≤0.25 µg/L
≤1.47 µg/L
Poland, Sulejόw
Reservoir
Flocculation/sedimentation,
particulate activated carbon, rapid
sand filtration, ozonation,
chlorination
Microcystis 2.1–2.3 µg/L 0.5–0.8 µg/L

C
YA
NO
BA
CT
ER
IAL
PE
PT
IDE
TO
XIN
S
34
5
Table 1.5 (contd)
Location and source Water treatment Cyanobacteria Raw water Final water
Portugal, Crestuma-
Lever reservoir
NR Aphanizomenon,
Microcystis
≤12×103
cells/ mL (Microcystis)
4.7 µg/g dry weight
(Aphanizomenon)
NR
Thailand Partly without treatment Anabaena, Cylindrospermopsis,
Microcystis
NR <1.0 µg/L
USA, Florida NR Cylindrospermopsis, Microcystis NR ≤90 µg/L
Adapted from Hoeger et al. (2005); data come from field studies between 1980 and 2003
NR, not reported

346 IARC MONOGRAPHS VOLUME 94
(Carmichael et al., 2000; Jensen et al., 2001). In the twentieth century, blue-green algae
supplements, which were primarily products that consisted entirely or partially of
Aphanizomenon flos-aquae and Spirulina spp., represented an important economic
activity (Carmichael et al., 2000), and were sold mainly in industrialized countries.
Blue-green algae supplements that consist of A. flos-aquae are specifically marketed
and consumed for their putative beneficial health effects, e.g. increased alertness,
increased energy, ‘detoxification’, elevated mood and weight loss (Jensen et al., 2001).
More importantly, these supplements are marketed in some instances as a replacement for
or alternative to the pharmacological therapy of ‘attention deficit hyperactivity disorder’
(Lindermann, 1995), and thus directly target the parents whose children present this
disorder, providing a highly specific route of exposure to microcystins in small children.
Although producers and retailers of blue-green algae supplements maintain that
batches that contain levels of microcystins above 1 µg/g dry weight are not marketed
(Carmichael et al., 2000), independent investigations of microcystin contamination in
these publicly available products have demonstrated toxin concentrations of up to 35 µg
microcystin-LR equivalents/g dry weight. Although samples with toxin contamination
greater than 10 µg microcystin-LR equivalents/g dry weight are the exception, several
independent analyses detected more than 1 µg microcystin-LR equivalents/g dry weight
in 50–100% of the blue-green algae products tested (Gilroy et al., 2000; Fischer et al.,
2001; Lawrence et al., 2001; Dietrich & Hoeger, 2005; Bruno et al., 2006). Several
studies (Lawrence et al., 2001; Bruno et al., 2006) have shown differences in detectable
amounts of toxin when different detection methods were used. These differences appear
primarily to stem from differences in the cross-reactivity of the microcystin congener of
some of the ELISAs used but are also attributed to the lack of certified standards for five
to 10 of the microcystin congeners that are commonly detected in blue-green algae
supplements. Despite the latter findings, not all of these products contain high levels of
microcystin (above 1 µg microcystin-LR equivalents/g dry weight). However, the levels
of microcystin in a given brand can vary extensively from batch to batch (Gilroy et al.,
2000) which does not allow for a proper assessment of human exposure, and specifically
that of children, to microcystins.
Gilroy et al. (2000) calculated a TDI of 0.04 µg microcystin-LR equivalents/kg body
weight (bw) per day based on a no-observed-adverse-effect level for microcystin-LR in
mice of 40 µg/kg bw per day that was defined by Fawell et al. (1999); the application of a
total 1000-fold uncertainty factor resulted in a provisional tolerable level for microcystins
in blue-green algae supplements of 1 µg microcystin-LR equivalents/g dry weight. This
level was adopted by the Oregon Health Division as a provisional regulatory standard for
these products in 1997. This safe level translates into 2 µg microcystin-LR equivalents per
adult per day. However, extrapolation of these daily doses to children (5–20 kg bw)
shows that they would actually be exposed to three- to 12-fold higher daily doses than
adults (Dietrich & Hoeger, 2005). Moreover, when assuming the worst case, i.e. blue-
green algae supplements contaminated with 35 µg microcystin-LR equivalents/g dry

CYANOBACTERIAL PEPTIDE TOXINS 347
weight, the actual daily exposure of children could exceed the TDI by a factor 88–350,
based on a maximum daily consumption of 2 g per day.
Contrary to the situation for food or water intake, in which a natural limitation of
consumption can be assumed, daily consumption of blue-green algae supplements is
largely dependent on the individual. Thus, overzealous parents may potentially severely
increase the daily exposure of their child (Dietrich & Hoeger, 2005). The latter scenario is
not improbable, as consumption of up to 20 g per day has been reported in the case of an
adult (Schaeffer et al., 1999; Gilroy et al., 2000). Furthermore, contrary to water and food
that are usually consumed together, e.g. during a meal, supplements are more probably
treated as pharmaceuticals and are thus ingested on an empty stomach which may lead to
higher potential uptake of microcystins from the gastrointestinal tract. Thus, the uptake
from blue-green algae supplements should be treated entirely differently from the usual
risk calculations for food and water.
1.5.5 Exposure through food
The order of importance of the individual food sources of exposure to microcystins
varies between countries and largely depends on factors such as climatic conditions and
irrigation practices, conditions for and traditions in agriculture and aquaculture (e.g.
availability of cyanobacteria-free versus contaminated surface water), eating habits of the
local population and, most of all, the affluence of the population in question. Indeed, a
lack of regular income and the consequent discontinuity of sustenance forces poorer
families to consume cyanobacteria-contaminated shellfish, crayfish or fish due to the
inability to afford better quality food. Microcystins (and other cyanobacterial toxins, e.g.
nodularin) accumulate in fish, crayfish and shellfish (Vasconcelos, 1999; Magalhães et
al., 2001, 2003; Mohamed et al., 2003) at maximum concentrations of 300 µg/kg in the
edible parts of fish, 2700 µg/kg in crayfish and 16 000 µg/kg in mussels (for discussions,
see Falconer, 2005).
Microcystins have been reported to be taken up by commercially cultivated plants
such as lettuce (Lactuca sativa) (Codd et al., 1999) and common beans (Phaseolus
vulgaris) (Abe et al., 1996) when the toxins are present in the irrigation water or the
growth media. The central leaves of lettuce were contaminated with 2.5 microcystin-LR
equivalents/g dry weight that were not removable by washing, but no data were available
on the actual level of contamination of beans with microcystins, as only inhibition of
photosynthesis was determined following spray irrigation with microcystin-contaminated
water. As some cyanobacteria fix nitrogen from the atmosphere and provide a valuable
source of nitrogen to growing rice plants, cyanobacteria are welcome in rice fields
(Rahman et al., 1996). However, although some of these cyanobacteria are presumably
producers of microcystin, little is known about the mechanism(s) of uptake of
microcystins into plants or the concentration of toxic cyanobacterial compounds in rice
fields.

348 IARC MONOGRAPHS VOLUME 94
Few data are available on the accumulation of microcystins in livestock (e.g. cattle,
swine, sheep), although these animals may frequently be exposed to microcystins and
other cyanobacterial toxins through consumption of water contaminated with
cyanobacteria (Beasley et al., 1983, 1989a,b). No carry-over of microcystins into milk
(Orr et al., 2001) or meat (Orr et al., 2003) was observed in cows following
administration of toxic M. aeruginosa in the drinking-water.
The actual exposure of humans (adults and children) to microcystins from food is
difficult to estimate, especially since there is no general rule as to how much fish,
shellfish, salad or rice is consumed daily per ‘international adult or child’. It is possible
that, in some regions of the world, children consume more than 0.1 kg fish or shellfish per
day (Mohamed et al., 2003), especially when local populations are largely dependent on
one type of food source (e.g. fish, shellfish or crustaceans, rice). Using the data from
actual contamination of fish and shellfish reported by Vasconcelos (1999), Magalhães et
al. (2001, 2003) and Mohamed et al. (2003) of up to 300 µg/kg edible fish, 2700 µg/kg
crayfish and 16000 µg/kg mussels, there is a distinct possibility that exposure (subacute
and chronic) of children occurs through microcystins in fish and shellfish (Dietrich &
Hoeger, 2005). Daily consumption of 200 g fish contaminated with 300 µg microcystin-
LR equivalents/kg edible fish by a 20-kg child would result in a total exposure of 60 µg
microcystin-LR equivalents per day or 3 µg microcystin-LR equivalents/kg bw per day.
Such an exposure would exceed the TDI of 0.04 µg microcystin-LR equivalents/kg bw
per day proposed by the WHO by a factor of 75. In the worst case of highly contaminated
mussels (16 000 µg microcystin-LR equivalents/kg mussel) and assuming the same daily
consumption of 200 g, the TDI in a child would be exceeded by a factor 4000. Both of the
latter calculations are, however, based on the assumption that all of the microcystin in the
fish and shellfish is biologically and thus also systemically available to the exposed child.
1.6 Regulations, guidelines and preventive measures
1.6.1 Drinking-water
In 1997, WHO derived a provisional guideline value for microcystin-LR in drinking-
water of 1 µg/L, based on a TDI of 0.04 µg/kg bw (WHO, 2004). The guideline is
provisional because of the limitations of the database, particularly with regard to studies
on long-term exposure and carcinogenicity. Moreover, it is limited to only one of several
structural variants that occur as frequently in the same concentration range or even
exclusively. In a supporting document to the WHO Guidelines for Drinking-water Quality
(Chorus & Bartram, 1999), Falconer et al. (1999) recommended the use of concentration
equivalents that include the other variants. An increasing number of countries are
converting this WHO guideline into national regulations. Their approaches vary in
dealing with the problem of the numerous microcystin variants that are typically found as
mixtures in samples. While some (e.g. Canada) explicitly set the level to accommodate

CYANOBACTERIAL PEPTIDE TOXINS 349
for the presence of microcystins on the basis of general assumptions on their occurrence,
others (e.g. Spain) simply refer to ‘microcystin’ without further specification.
In the third edition of the WHO Guidelines for Drinking-water Quality (WHO, 2004),
the 1998 provisional guideline value for microcystin-LR was not changed, but is relevant
to any hazard with emphasis on the need to consider national and regional conditions
when converting any WHO guideline values into national standards and regulations.
These may include issues of implementation, such as institutional capacity, and in
particular the importance of a hazard for public health in relation to other prevalent
hazards.
The publication of the WHO provisional guideline value for microcystin-LR in 1998
has led to national regulations on microcystins in drinking-water in several countries,
and—in line with WHO’s explicit emphasis on the need to use WHO guideline values in
a nationally and locally adequate way to optimize the protection of public health—some
countries have adapted their standard. Table 1.6 provides examples of national regulations
and guidelines. In 2003, the European Union began discussions on whether microcystin-
LR should be included in the forthcoming revision of its Drinking-water Directive.
Explicit guidelines for nodularin in drinking-water are known only for Australia. The
Australian Government (2004) states that, due to the lack of adequate data, no guideline
value is set for concentrations of nodularin. However, given the known toxicity of
nodularin, the relevant health authority should be advised immediately if blooms of
N. spumigena are detected in sources of drinking-water. Since there are some similarities
between the toxicity of nodularin and microcystins, the guideline for microcystins could
be used to derive cell numbers of N. spumigena that represent a preliminary indication of
the potential hazard. It is recommended that notification and further assessment be made
when cell numbers of N. spumigena exceed 40 000 cells/mL.
Table 1.6. Examples of regulatory approaches to cyanobacteria and
microcystins in drinking-water
Country Regulatory approach
Approaches motivated by compliance to a standard or guideline value
Australia
Federal Drinking-water Guideline for total microcystins of 1.3 µg/L, expressed as microcystin-LR equivalents.
Brazil
Monthly monitoring of cyanobacteria in drinking-water resources; if cell counts exceed 10 000 cells/mL or biovolumes (determined from cell counts) exceed 1 mm³ cell volume,
weekly monitoring and analyses of toxins or toxicity testing are required; standard value for microcystins (variants not specified), 1 µg/L.
Canada
Maximum acceptable concentration for microcystin-LR in drinking-water, 1.5 µg/L; intended to be protective of human health against exposure to other microcystins that
may also be present.

350 IARC MONOGRAPHS VOLUME 94
Table 1.6 (contd)
Country Regulatory approach
Czech
Republic
Mandatory monitoring of tap-water for microcystin-LR; limits, 1 µg/L; an update of the
ordinance will include alternatives to analysis of microcystins such as quantification of cyanobacterial biomass in raw water or bioassays in conjunction with cell counts, and
analyses of toxins only if thresholds for cyanobacterial biomass are exceeded.
France Drinking-water Decree maximum limit is 1 µg/L microcystin-LR; analyses required if cyanobacteria proliferate in raw water.
Poland Limit of 1 µg/L for microcystin-LR in drinking-water
Spain Drinking-water Decree includes a limit for ‘microcystin’ (variants not specified) of
1 µg/L; sampling regimes specified in relation to size of population served; to be reviewed at 5-year intervals.
USA In February 2005, the Environmental Protection Agency included cyanobacteria, other freshwater algae and their toxins on its ‘contaminant candidate list’ of unregulated
contaminants, for which research is to be prioritized and data collected to determine whether regulation is necessary.
Indirect or implicit inclusion in drinking-water regulations
Germany National Drinking-water Ordinance stipulates drinking-water should contain no
substances at concentrations that may be harmful to health, and the provisional WHO value for microcystin-LR defines such concentrations. The prerequisite for this approach
is that drinking-water suppliers that use surface water usually monitor and acknowledge the phytoplankton in their resource and have effective treatment in place (as part of best
practice and technical rules) and thus are aware of the cyanotoxin hazard.
Italy No limit value has been implemented, but the national Drinking-water Decree considers
‘algae’ as an accessory parameter to be monitored when local authorities suspect a risk to human health; the provisional WHO Guideline of 1 µg/L for microcystin-LR is used as
the basis for this assessment.
Hungary The national Decree on Drinking-water Quality and the ordinance on monitoring include
the number of cyanobacteria cells as a biological parameter to be monitored by microscopy, although no limit is given for cyanotoxins.
‘Risk-based’ approaches in regulations
Australia Fact sheets for each of the four cyanotoxins (microcystins, nodularin, saxitoxins and
cylindrospermopsin) include the guideline value of 1.3 µg/L for the sum of all microcystin variants or a cell density of 6500 cells/mL for a highly toxic population of
Microcystis aeruginosa. These values are not mandatory legally enforceable standards, but guidelines within a framework for analysing hazards and assessing risks for
individual water supply systems and are being adopted by water authorities as agreed quality targets or as contract conditions for water supply, e.g. as targets and performance
indicators for audits of process performance.
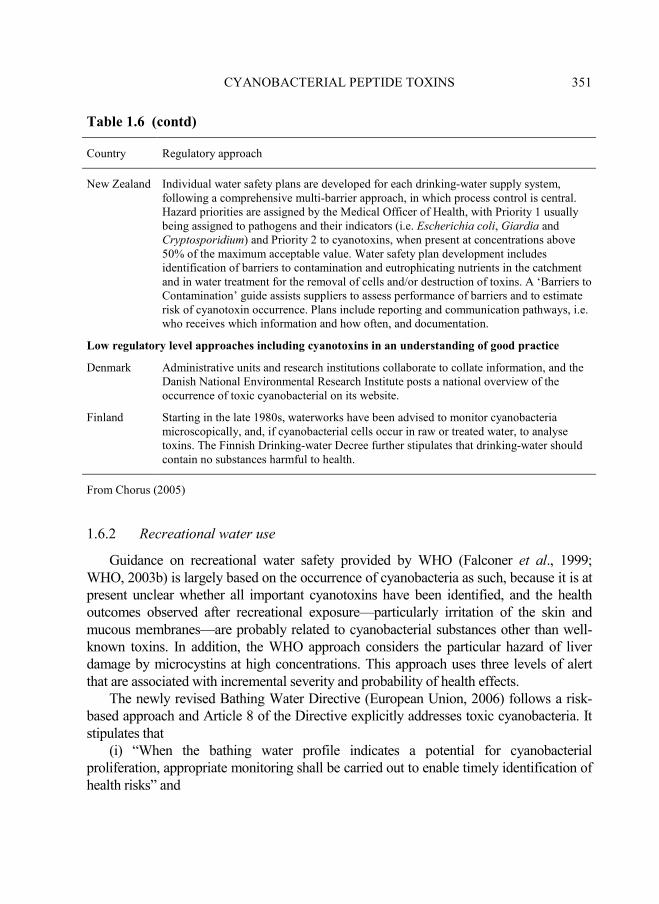
CYANOBACTERIAL PEPTIDE TOXINS 351
Table 1.6 (contd)
Country Regulatory approach
New Zealand Individual water safety plans are developed for each drinking-water supply system,
following a comprehensive multi-barrier approach, in which process control is central. Hazard priorities are assigned by the Medical Officer of Health, with Priority 1 usually
being assigned to pathogens and their indicators (i.e. Escherichia coli, Giardia and Cryptosporidium) and Priority 2 to cyanotoxins, when present at concentrations above
50% of the maximum acceptable value. Water safety plan development includes identification of barriers to contamination and eutrophicating nutrients in the catchment
and in water treatment for the removal of cells and/or destruction of toxins. A ‘Barriers to Contamination’ guide assists suppliers to assess performance of barriers and to estimate
risk of cyanotoxin occurrence. Plans include reporting and communication pathways, i.e. who receives which information and how often, and documentation.
Low regulatory level approaches including cyanotoxins in an understanding of good practice
Denmark Administrative units and research institutions collaborate to collate information, and the Danish National Environmental Research Institute posts a national overview of the
occurrence of toxic cyanobacterial on its website.
Finland Starting in the late 1980s, waterworks have been advised to monitor cyanobacteria
microscopically, and, if cyanobacterial cells occur in raw or treated water, to analyse toxins. The Finnish Drinking-water Decree further stipulates that drinking-water should
contain no substances harmful to health.
From Chorus (2005)
1.6.2 Recreational water use
Guidance on recreational water safety provided by WHO (Falconer et al., 1999;
WHO, 2003b) is largely based on the occurrence of cyanobacteria as such, because it is at
present unclear whether all important cyanotoxins have been identified, and the health
outcomes observed after recreational exposure—particularly irritation of the skin and
mucous membranes—are probably related to cyanobacterial substances other than well-
known toxins. In addition, the WHO approach considers the particular hazard of liver
damage by microcystins at high concentrations. This approach uses three levels of alert
that are associated with incremental severity and probability of health effects.
The newly revised Bathing Water Directive (European Union, 2006) follows a risk-
based approach and Article 8 of the Directive explicitly addresses toxic cyanobacteria. It
stipulates that
(i) “When the bathing water profile indicates a potential for cyanobacterial
proliferation, appropriate monitoring shall be carried out to enable timely identification of
health risks” and

352 IARC MONOGRAPHS VOLUME 94
(ii) “When cyanobacterial proliferation occurs and a health risk has been identified or
presumed, adequate management measures shall be taken immediately to prevent
exposure, including information to the public”.
The Bathing Water Profile describes the risk of pollution and explicitly includes an
assessment of the potential for proliferation of cyanobacteria. Actions and frequency of
monitoring should be related to the history and classification of the bathing water and to
regional climatic conditions, and emphasis placed on bathing waters where risks may
occur.
Several countries have regulations or guidelines that address cyanobacteria and/or
cyanotoxins at recreational sites, and some include approaches to address the capacity of a
water body to sustain large cyanobacterial populations. Examples of national regulations
and guidance are included in Table 1.7.
Table 1.7. Examples of regulatory approaches to cyanobacteria and
microcystins in water for recreational use
Country Recreational sites
Australia The monitoring of cell densities is often preferred to toxin limits because cell counting
is widely available, cost-effective and is performed rapidly. The Federal Recreational
Water Guideline provides values for three different parameters: 10 µg/L total
microcystins or ≥ 50 000 cells/mL toxic M. aeruginosa; biovolume equivalent of ≥ 4
mm3/L for the combined total of all cyanobacteria where a known toxin producer is
dominant in the total biovolume; or 10 mm3/L for total biovolume of all cyanobacterial
material where known toxins are not present. A new approach is to assess the
susceptibility for cyanobacterial growth from general monitoring data and historical
information, including the scoring of water bodies as ‘good, fair or poor’.
Denmark Bathing Water Instruction requires when massive blooms occur that the material is
investigated, the risk assessed and the authority alarm groups trigger posting of
warning signs at the waterfront as well as dissemination of information particularly to
local water body-user groups.
Finland Health authorities were provided with guidelines in the late 1980s; a cost-effective
monitoring network of nuisance algae occurrence is based on long-term data on
occurrence collected since 1967, and now also includes the involvement of private
citizens for visual monitoring.
France Three levels of cyanobacterial cell density trigger management responses up to
prohibition of water contact sports. Information on cell numbers is published on the
internet within not more than 5 days of sampling.
Germany Three-step guideline based on visual inspection and assessment of the nutrient capacity
for blooms and assessment of cyanobacterial biomass, with thresholds for warning or
closure. Sites may remain open if microcystin levels are low even when cyanobacterial
levels are high.
Hungary Addresses cyanobacterial blooms indirectly through a limit for chlorophyll-a.

CYANOBACTERIAL PEPTIDE TOXINS 353
Table 1.7 (contd)
Country Recreational sites
Italy Decree on Quality of Bathing Water addresses cyanobacteria indirectly: derogations
above its limit for dissolved oxygen is granted only if not due to excessive proliferation
of toxic algae. In 1998, the Ministry of Health provided a list of toxic algae and
cyanobacteria of concern and analytical methodologies, and recommended a limit
value of 5×10⁶ cells/L for toxic algae species as a safe level for bathing activities.
Netherlands Guideline of: 10 µg/L for issuing warnings; and 20 µg/L and scums for closure of
bathing sites and continued monitoring
From Chorus (2005), Australian Government (2008)
1.6.3 Measures to control human exposure
The prevention of cyanobacterial proliferation in the water source is largely achieved
through the reduction or prevention eutrophication, i.e. ‘fertilization’ of water bodies with
plant nutrients, in most cases phosphorus and in some settings also nitrogen. It may
require substantial reductions of concentrations within the water body and, where multiple
and diffuse sources contribute to the total nutrient load of a water body, success may be
slow. In such situations, other water-body management approaches that render growth
conditions less favourable for cyanobacteria may be useful. These largely include
physical measures, i.e. changes in the thermal mixing regime or flushing rate of the water
body, and are possible only in some settings. When cyanobacterial proliferation cannot be
prevented, other barriers against human exposure are necessary (see Chorus & Bartram,
1999, for a more detailed overview).
For drinking-water and dialysis units, control measures include offtake strategy and
treatment: offtakes may be located away from surface scums or deeper horizons where
cells may accumulate, or may occur through banks drilled close to the river, using the
subsurface as a filter (bank filtration). Other commonly used particle removal techniques
have often proven very successful and include flocculation combined with sedimentation
and rapid filtration, dissolved air flotation, microfiltration and slow sand filtration (see
Table 1.5). For some of these techniques, it is important that cells accumulated on filters
be removed before they lyse and release their toxin content. When elevated
concentrations of dissolved microcystins occur, these can be removed by oxidation
(ozone or chlorination) and treatment with activated carbon. Comprehensive overviews of
the state of the art of microcystin removal may be found in Falconer (2005).
For recreational exposure, no further barriers other than the prevention of
cyanobacterial proliferation are available and keeping people out of the water under high-
354 IARC MONOGRAPHS VOLUME 94
risk conditions. Effective surveillance and public information strategies are key to
achieving this (see Section 1.6.2).
For dietary supplements, tight monitoring of contamination with microcystins may be
required, e.g. by the State of Oregon in the USA and the Food and Health Authorities of
Switzerland. However, this cannot rule out the occurrence of other bioactive and
potentially harmful cyanobacterial metabolites or other contaminants when cell material is
harvested from scums on water bodies and pressed into tablets.
For occupational exposure through aerosols, either filtration of the water before use or
application techniques to avoid generation of the aerosol may prevent exposure.
1.7 References
Abe T, Lawson T, Weyers JDB, Codd GA (1996). Microcystin-LR inhibits photosynthesis of
Phaseolus vulgaris primary leaves: implications for current spray irrigation practice. New
Phytol, 133:651–658. doi:10.1111/j.1469-8137.1996.tb01934.x.
An JS, Carmichael WW (1994). Use of a colorimetric protein phosphatase inhibition assay and
enzyme linked immunosorbent assay for the study of microcystins and nodularins. Toxicon,
32:1495–1507. doi:10.1016/0041-0101(94)90308-5. PMID:7725318
Australian Government (2004). Australian Drinking Water Guidelines — 2004, Canberra,
National Health and Medical Research Council.
Australian Government (2008). Guidelines for Managing Risks in Recreational Water,
Canberra, National Health and Medical Research Council.
Azevedo SM, Carmichael WW, Jochimsen EM et al. (2002). Human intoxication by microcystins
during renal dialysis treatment in Caruaru-Brazil. Toxicol, 181–182:441–446.
doi:10.1016/S0300-483X(02)00491-2.
Baier W, Loleit M, Fischer B et al. (2000). Generation of antibodies directed against the low-
immunogenic peptide-toxins microcystin-LR/RR and nodularin. Int J Immunopharmacol,
22:339–353. doi:10.1016/S0192-0561(99)00086-7. PMID:10708882
Ballot A, Pflugmacher S, Wiegand C et al. (2003). Cyanobacterial toxins in Lake Baringo, Kenya.
Limnologica, 33:2–9.
Beasley VR, Coppock RW, Simon J et al. (1983). Apparent blue-green algae poisoning in swine
subsequent to ingestion of a bloom dominated by Anabaena spiroides. J Am Vet Med Assoc,
182:413–414. PMID:6403497
Beasley VR, Cook WO, Dahlem AM et al. (1989a). Algae intoxication in livestock and waterfowl.
Vet Clin North Am Food Anim Pract, 5:345–361. PMID:2503241
Beasley VR, Dahlem AM, Cook WO et al. (1989b). Diagnostic and clinically important aspects of
cyanobacterial (blue-green algae) toxicoses. J Vet Diagn Invest, 1:359–365. PMID:2518710
Bolch CJS, Orr PT, Jones GJ, Blackburn SI (1999). Genetic, morphological, and toxicological
variation among globally distributed strains of Nodularia (Cyanobacteria). J Phycol, 35:339–
355. doi:10.1046/j.1529-8817.1999.3520339.x.
Bourne DG, Jones GJ, Blakeley RL et al. (1996). Enzymatic pathway for the bacterial degradation
of the cyanobacterial cyclic peptide toxin microcystin LR. Appl Environ Microbiol, 61:4086–
4094.

CYANOBACTERIAL PEPTIDE TOXINS 355
Bruno M, Fiori M, Mattei D et al. (2006). ELISA and LC-MS/MS methods for determining
cyanobacterial toxins in blue-green algae food supplements. Nat Prod Res, 20:827–834.
doi:10.1080/14786410500410859. PMID:16753920
Carmichael WW (1992). Cyanobacteria secondary metabolites—The cyanotoxins. J Appl
Bacteriol, 72:445–459.
Carmichael WW (1996). Toxic microcystis and the environment. In: Watanabe MF, Harada KI,
Carmichael WW, Fujiki H, eds, Toxic Microcystis, Boca Raton, London: CRC Press, pp. 1–12.
Carmichael WW, Beasley V, Bunner DL et al. (1988a). Naming of cyclic heptapeptide toxins of
cyanobacteria (blue-green algae). Toxicon, 26:971–973. doi:10.1016/0041-0101(88)90195-X.
PMID:3149803
Carmichael WW, Eschedor JT, Patterson GM, Moore RE (1988b). Toxicity and partial structure
of a hepatotoxic peptide produced by the cyanobacterium Nodularia spumigena Mertens
emend. L575 from New Zealand. Appl Environ Microbiol, 54:2257–2263. PMID:3142356
Carmichael WW, Drapeau C, Anderson DM (2000). Harvesting of Aphanizomenon flos-aquae
Ralfs ex Born. & Flah. var. flos-aquae (cyanobacteria) from Klamath Lake for human dietary
use. J Appl Phycol, 12:585–595. doi:10.1023/A:1026506713560.
Chorus I, ed (2001). Cyanotoxins: Occurence, Causes, Consequences, Springer-Verlag,
Heidelberg.
Chorus I, ed (2005). Current Approaches to Cyanotoxin Risk Assessment, Risk Management
and Regulations in Different Countries (WaBoLu 02/05), Dessau, Umweltbundesamt.
Chorus I, Bartram J, ed (1999). Toxic Cyanobacteria in Water: A Guide to Public Health
Significance, Monitoring and Management, London, E&FN Spon.
Chorus I, Fastner J (2001). Recreational exposure to cyanotoxins. In: Chorus I, ed,
Cyanotoxins: Occurrence, Causes, Consequences, Heidelberg, Springer-Verlag, pp. 190–
199.
Chu FS, Huang X, Wei RD, Carmichael WW (1989). Production and characterization of
antibodies against microcystins. Appl Environ Microbiol, 55:1928–1933. PMID:2506810
Codd GA, Metcalf JS, Beattie KA (1999). Retention of Microcystis aeruginosa and microcystin by
salad lettuce (Lactuca sativa) after spray irrigation with water containing cyanobacteria.
Toxicon, 37:1181–1185. doi:10.1016/S0041-0101(98)00244-X. PMID:10400301
Codd GA, Lindsay J, Young FM et al. (2005). Harmful cyanobacteria: from mass mortalities to
management measures. In: Huisman J, Matthijs HCP, Vissler PM, eds, Harmful Cyanobacteria,
Dordrecht, Springer, pp. 1–23.
Dietrich DR, Hoeger S (2005). Guidance values for microcystins in water and cyanobacterial
supplement products (blue-green algal supplements): a reasonable or misguided approach?
Toxicol Appl Pharmacol, 203:273–289. doi:10.1016/j.taap.2004.09.005. PMID:15737681
Dittmann E, Börner T (2005). Genetic contributions to the risk assessment of microcystin in the
environment. Toxicol Appl Pharmacol, 203:192–200. doi:10.1016/j.taap.2004.06.008.
PMID:15737674
European Union (2006). Directive 2006/7/EC of the European Parliament and of the Council of
15 Febuary 2006 Concerning the Management of Bathing Water Quality and Repealing
Directive 76/160/EEC, Brussels.
Falconer IR (2005) Cyanobacterial Toxins of Drinking Water Supplies: Cylindrospermopsins
and Microcystins, Boca Raton, FL, CRC Press.

356 IARC MONOGRAPHS VOLUME 94
Falconer IR, Beresford AM, Runnegar MT (1983). Evidence of liver damage by toxin from a
bloom of the blue-green alga, Microcystis aeruginosa. Med J Aust, 1:511–514. PMID:6405136
Falconer IR, Bartram J, Chorus I et al. (1999). Safe levels and safe practices. In: Chorus I,
Bartram J, eds, Toxic Cyanobacteria in Water: A Guide to Their Public Health Consequences,
Monitoring and Management, London, Spon Press, pp. 155–178.
Fastner J, Erhard M, Carmichael WW et al. (1999a). Characterization and diversity of
mircrocystins in natural blooms and strains of the genera Microcystis and Planktothrix from
German freshwaters. Arch Hydrobiol, 145:147–163.
Fastner J, Neumann U, Wirsing B et al. (1999b). Microcystins (hepatotoxic heptapeptides) in
German fresh water bodies. Environ Toxicol, 14 Suppl.;13–22. doi:10.1002/(SICI)1522-
7278(199902)14:1<13::AID-TOX4>3.0.CO;2-D.
Fastner J, Wirsing B, Wiedner C et al. (2001). Microcystins and hepatocyte toxicity. In: Chorus
I, ed, Cyanotoxins: Occurrence, Causes, Consequences, Berlin, Springer Verlag, pp. 22–37.
Fawell JK, Mitchell RE, Everett DJ, Hill RE (1999). The toxicity of cyanobacterial toxins in the
mouse: I. Microcystin-LR. Hum Exp Toxicol, 18:162–167. doi:10.1191/096032799678839842.
PMID:10215106
Fischer WJ, Garthwaite I, Miles CO et al. (2001). Congener-independent immunoassay for
microcystins and nodularins. Environ Sci Technol, 35:4849–4856. doi:10.1021/es011182f.
PMID:11775161
Frank CA (2002). Microcystin-producing cyanobacteria in recreational waters in southwestern
Germany. Environ Toxicol, 17:361–366. doi:10.1002/tox.10068. PMID:12203958
Gilroy DJ, Kauffman KW, Hall RA et al. (2000). Assessing potential health risks from
microcystin toxins in blue-green algae dietary supplements. Environ Health Perspect,
108:435–439. doi:10.2307/3454384. PMID:10811570
Harada K-I, Tsuji K, Watanabe MF, Kondo F (1996). Stability of microcystins from cyanobacteria:
III. Effect of pH and temperature. Phycologia, 35:83–88.
Hilborn ED, Carmichael WW, Yuan M, Azevedo SMFO (2005). A simple colorimetric method to
detect biological evidence of human exposure to microcystins. Toxicon, 46:218–221.
doi:10.1016/j.toxicon.2005.04.009. PMID:15963544
Hoeger SJ, Hitzfeld BC, Dietrich DR (2005). Occurrence and elimination of cyanobacterial toxins
in drinking water treatment plants. Toxicol Appl Pharmacol, 203:231–242.
International Standards Organization (2005). Water Quality — Determination of Microcystins —
Method using Solid Phase Extraction (SPE) and High Performance Liquid Chromatography
(HPLC) with Ultraviolet (UV) Detection (ISO 20179:2005[E]), Geneva: The Organization
Janse I, Kardinaal WE, Agterveld MK et al. (2005). Contrasting microcystin production and
cyanobacterial population dynamics in two Planktothrix-dominated freshwater lakes. Environ
Microbiol, 7:1514–1524. doi:10.1111/j.1462-2920.2005.00858.x. PMID:16156725
Jensen GS, Ginsberg DI, Drapeau C (2001). Blue-green algae as an immuno-enhancer and
biomodulator. JANA, 3:24–30.
Jochimsen EM, Carmichael WW, An JS et al. (1998). Liver failure and death after exposure to
microcystins at a hemodialysis center in Brazil. N Engl J Med, 338:873–878.
Jones GJ, Orr PT (1994). Release and degradation of microcystin following algicide treatment of a
Microcystis aeruginosa bloom in a recreational lake, as determined by HPLC and protein
phosphatase inhibition assay. Water Res, 28:871–876. doi:10.1016/0043-1354(94)90093-0.

CYANOBACTERIAL PEPTIDE TOXINS 357
Jones GJ, Bourne DG, Blakeley RL, Doelle H (1994). Degradation of the cyanobacterial
hepatotoxin microcystin by aquatic bacteria. Nat Toxins, 2:228–235. doi:10.1002/nt.2620020412.
PMID:7952948
Kardinaal WEA, Visser PM (2005). Dynamics of cyanobacterial toxins. Sources of variability
in microcystin concentrations. In: Huisman J, Matthijs HCP, Visser PM, eds, Harmful
Cyanobacteria, Dordrecht, Springer, pp. 41–63.
Knoll A (2008). Cyanobacteria and earth history. In: Herrero A, Flores E, eds, The
Cyanobacteria: Molecular Biology Genomics and Evolution, Norfolk, UK, Caister
Academic Press, pp.1–20.
Kurmayer R, Christiansen G, Chorus I (2003). The abundance of microcystin-producing
genotypes correlates positively with colony size in Microcystis and determines its microcystin
net production in Lake Wannsee. Appl Environ Microbiol, 69 Suppl.;787–795.
Laamanen MJ, Gugger MF, Lehtimäki JM et al. (2001). Diversity of toxic and nontoxic nodularia
isolates (cyanobacteria) and filaments from the Baltic Sea. Appl Environ Microbiol, 67:4638–
4647. doi:10.1128/AEM.67.10.4638-4647.2001. PMID:11571167
Lawrence JF, Niedzwiadek B, Menard C et al. (2001). Comparison of liquid chromatography/mass
spectrometry, ELISA, and phosphatase assay for the determination of microcystins in blue-
green algae products. J AOAC Int, 84:1035–1044. PMID:11501902
Lindermann B (1995) Complicated Child? Simple Options, Ramona, CA, Ransom Hill Press.
Magalhães VF, Soares RM, Azevedo SM (2001). Microcystin contamination in fish from the
Jacarepaguá Lagoon (Rio de Janeiro, Brazil): ecological implication and human health risk.
Toxicon, 39:1077–1085. doi:10.1016/S0041-0101(00)00251-8. PMID:11223098
Magalhães VF, Marinho MM, Domingos P et al. (2003). Microcystins (cyanobacteria
hepatotoxins) bioaccumulation in fish and crustaceans from Sepetiba Bay (Brasil, RJ).
Toxicon, 42:289–295. doi:10.1016/S0041-0101(03)00144-2. PMID:14559080
McElhiney J, Lawton LA (2005). Detection of the cyanobacterial hepatotoxins microcystins.
Toxicol Appl Pharmacol, 203:219–230. doi:10.1016/j.taap.2004.06.002. PMID:15737676
McElhiney J, Drever M, Lawton LA, Porter AJ (2002). Rapid isolation of a single-chain antibody
against the cyanobacterial toxin microcystin-LR by phage display and its use in the
immunoaffinity concentration of microcystins from water. Appl Environ Microbiol, 68:5288–
5295. doi:10.1128/AEM.68.11.5288-5295.2002. PMID:12406716
Mikhailov A, Härmälä-Braskén AS, Meriluoto J et al. (2001). Production and specificity of mono
and polyclonal antibodies against microcystins conjugated through N-methyldehydroalanine.
Toxicon, 39:477–483. doi:10.1016/S0041-0101(00)00148-3. PMID:11024487
Mohamed ZA, Carmichael WW, Hussein AA (2003). Estimation of microcystins in the freshwater
fish Oreochromis niloticus in an Egyptian fish farm containing a Microcystis bloom. Environ
Toxicol, 18:137–141. doi:10.1002/tox.10111. PMID:12635102
Mohamed ZA, el-Sharouny HM, Ali WS (2006). Microcystin production in benthic mats of
cyanobacteria in the Nile River and irrigation canals, Egypt. Toxicon, 47:584–590.
doi:10.1016/j.toxicon.2006.01.029. PMID:16564062
Nagata S, Tsutsumi T, Yoshida F, Ueno Y (1999). A new type sandwich immunoassay for
microcystin: production of monoclonal antibodies specific to the immune complex formed by
microcystin and an anti-microcystin monoclonal antibody. Nat Toxins, 7:49–55.
doi:10.1002/(SICI)1522-7189(199903/04)7:2<49::AID-NT43>3.0.CO;2-7. PMID:10495466

358 IARC MONOGRAPHS VOLUME 94
Namikoshi M, Choi BW, Sakai R et al. (1994). New nodularins: a general method for structure
assignment. J Org Chem, 59:2349–2357. doi:10.1021/jo00088a014.
Orr PT, Jones GJ, Hunter RA et al. (2001). Ingestion of toxic Microcystis aeruginosa by dairy
cattle and the implications for microcystin contamination of milk. Toxicon, 39:1847–1854.
doi:10.1016/S0041-0101(01)00166-0. PMID:11600147
Orr PT, Jones GJ, Hunter RA, Berger K (2003). Exposure of beef cattle to sub-clinical doses of
Microcystis aeruginosa: toxin bioaccumulation, physiological effects and human health risk
assessment. Toxicon, 41:613–620. doi:10.1016/S0041-0101(03)00006-0. PMID:12676440
Oudra B, Loudiki M, Sbiyyaa B et al. (2001). Isolation, characterization and quantification of
microcystins (heptapeptides hepatotoxins) in Microcystis aeruginosa dominated bloom of
Lalla Takerkoust lake-reservoir (Morocco). Toxicon, 39:1375–1381. doi:10.1016/S0041-
0101(01)00093-9. PMID:11384726
Rahman M, Podder AK, Van Hove C et al. (1996). Biological Nitrogen Fixation Associated
with Rice Production, Dordrecht, Kluwer Academic Publisher.
Repka S, Meyerhöfer M, von Bröckel K, Sivonen K (2004). Associations of cyanobacterial toxin,
nodularin, with environmental factors and zooplankton in the Baltic Sea. Microb Ecol,
47:350–358. PMID:14681737 doi:10.1007/s00248-003-2010-y
Runnegar MT, Seward DJ, Ballatori N et al. (1999). Hepatic toxicity and persistence of ser/thr
protein phosphatase inhibition by microcystin in the little skate Raja erinacea. Toxicol Appl
Pharmacol, 161:40–49. doi:10.1006/taap.1999.8783. PMID:10558922
Schaeffer DJ, Malpas PB, Barton LL (1999) Risk assessment of microcystin in dietary
Aphanizomenon flos-aquae. Ecotoxicol environ Saf, 44:73–80.
Sivonen K, Jones G (1999). Cyanobacterial toxins. In: Chorus I, Bartram J, eds, Toxic
Cyanobacteria in Water: A Guide to Their Public Health Consequences, Monitoring and
Management, London, Spon Press, pp. 41–111.
Sivonen K, Kononen K, Carmichael WW et al. (1989). Occurrence of the hepatotoxic
cyanobacterium Nodularia spumigena in the Baltic Sea and structure of the toxin. Appl
Environ Microbiol, 55:1990–1995. PMID:2506812
Sivonen K, Namikoshi M, Evans WR et al. (1992) Isolation and structures of five microcystins
from a Russian Microcystis aeruginosa strain CALU 972. Toxicon, 30:1481–1485.
Tencalla F, Dietrich D (1997). Biochemical characterization of microcystin toxicity in rainbow
trout (Oncorhynchus mykiss). Toxicon, 35:583–595. doi:10.1016/S0041-0101(96)00153-5.
PMID:9133713
Tillett D, Dittmann E, Erhard M et al. (2000). Structural organization of microcystin biosynthesis
in Microcystis aeruginosa PCC7806: an integrated peptide-polyketide synthetase system.
Chem Biol, 7:753–764. doi:10.1016/S1074-5521(00)00021-1. PMID:11033079
Tsuji K, Watanuki T, Kondo F et al. (1995). Stability of microcystins from cyanobacteria–II.
Effect of UV light on decomposition and isomerization. Toxicon, 33:1619–1631.
doi:10.1016/0041-0101(95)00101-8. PMID:8866619
Vasconcelos VM (1999). Cyanobacterial toxins in Portugal: effects on aquatic animals and risk for
human health. Braz J Med Biol Res, 32:249–254. doi:10.1590/S0100-879X1999000300001.
PMID:10347780
Via-Ordorika L, Fastner J, Kurmayer R et al. (2004). Distribution of microcystin-producing and
non-microcystin-producing Microcystis sp. in European freshwater bodies: detection of

CYANOBACTERIAL PEPTIDE TOXINS 359
microcystins and microcystin genes in individual colonies. Syst Appl Microbiol, 27
Suppl.;592–602. doi:10.1078/0723202041748163. PMID:15490561
Welker M, Steinberg C (1999) Indirect photolysis of cyanotoxins: one possible mechanism for
their low persistence. Water Res., 33:1159-1164
Welker M, Khan S, Haque MM et al. (2005). Microcystins (cyanobacterial toxins) in surface
waters of rural Bangladesh: pilot study. J Water Health, 3:325–337. PMID:16459839
WHO (2003a) Cyanobacterial Toxins: Microcystin-LR in Drinking-water. Background
Document for Development of WHO Guidelines for Drinking-water Quality
(WHO/SDE/WSH/ 03.04/57), Geneva.
WHO (2003b) Guidelines for Safe Recreational Water Environments, Vol. 1. Coastal and
Fresh Waters, Geneva.
WHO (2004) Guidelines for Drinking-water Quality, 3rd Ed., Vol. 1, Recommendations,
Geneva, pp. 407–408.
Zeck A, Weller MG, Bursill D, Niessner R (2001). Generic microcystin immunoassay based on
monoclonal antibodies against ADDA. Analyst, 126:2002–2007. doi:10.1039/b105064h.

360 IARC MONOGRAPHS VOLUME 94
2. Studies of Cancer in Humans
The incidence of hepatocellular carcinoma (HCC) in Southeast China is among the
highest in the world, with annual rates in some counties reaching over 100/100 000
(Ferlay et al., 2004). Risk factors in this region include infection with hepatitis B and C
viruses and intake of aflatoxin B1 from food items such as corn. Several epidemiological
investigations have also suggested a role for cyanobacterial toxins, in particular
microcystin, as a contributor to the overall risk for HCC. Three types of study have been
conducted to evaluate the relationship between HCC and microcystin: comparisons of
HCC mortality rates among groups who have different types of water source (ecological
studies), cohort studies and case–control studies. In addition to studies of HCC, the
incidence of colorectal cancer was investigated in an ecological study. Certain studies that
the Working Group evaluated provided some data on levels of microcystins, and reported
relative risks among persons who consumed water from sources that had elevated levels
compared with those who consumed low levels. In other studies, the contrast used to
calculate relative risk was between persons who had different types of water source,
typically water from ponds, ditches or small rivers compared with well-water, that was
sometimes characterized as being from deep or shallow wells. The Working Group did
not have access to original publications of many studies of HCC, and only those studies
for which summary information was available are reported here (see Section 5.2).
2.1 Hepatocellular carcinoma
2.1.1 Ecological studies
In a review, Yu (1995) presented a summary of findings from several studies. In
Qidong County of Jiangsu Province, China, an endemic area for primary liver cancer,
mortality rates of less than 20 deaths per 100 000 were observed in some districts
compared with more than 60 deaths per 100 000 in adjacent locations. Mortality rates
were higher in areas where drinking-water was drawn from ponds and ditches compared
with rates in areas with deep wells. Six studies in Nantong City by different authors were
cited. All showed that people who consumed water from ponds or ditches had higher rates
of mortality from HCC (approximately 100 deaths/100 000) than people who drank well-
or deep well-water (mortality rate, < 20 deaths/100 000). Yu (1995) also tabulated results
from six evaluations of mortality from HCC, four from Qidong County for overlapping
periods during 1972–83, one from Haimen County (1968–72) and one from Nanhui
County (1981–84). Mortality rates for consumers of pond and ditch water were higher
(range, approximately 60–140/100 000/year) than those for well-water users (range,
approximately 0–15/100 000/year). In this Province, microcystin-producing cyanobacteria
are abundant in surface waters, and significant amounts of microcystin were detected in

CYANOBACTERIAL PEPTIDE TOXINS 361
pond-ditch waters whereas no detectable levels were found in deep well-water; this
provides supportive evidence that microcystins in drinking-water were partially
responsible for the higher incidence of HCC (Chen et al., 1996).
In a Chinese county that displayed high mortality from primary liver cancer,
consumption of pond water with low microcystin concentrations (160 ng/L; n = 27) was
correlated with a higher mortality rate than consumption of deep well-water with no
detectable levels of microcystin (< 50 ng/L; n = 25) (P < 0.01 for deep well- in relation to
pond or river water) (mortality rate, 115.05/100 000 for pond water versus 20.00/100 000
for deep well-water; P < 0.01) (Ling, 2000).
2.1.2 Cohort studies
In a cohort study of 77 682 persons in Nanhui County, who were followed from 1986
to 1991 (Yu et al., 1995), a total of 202 deaths from HCC yielded relative risks of 1.16
(95% confidence interval [CI], 1.02–1.32) for consumption of pond and ditch water and
1.25 (95% CI, 1.09–1.43) for consumption of river water, using a case–cohort approach.
The relative risk for history of hepatitis was 1.03 (95% CI, 1.02–1.04). The consumption
of shallow and deep well-water (including tap-water) was protective and gave relative
risks of 0.65 (95% CI, 0.59–0.73) and 0.20 (95% CI, 0.16–0.25), respectively. [The
Working Group noted that the relative risk for surface water was approximately five times
that for deep well-/tap-water].
A cohort study reported in the review by Yu et al. (1995) found rates of mortality
from HCC of 121.96/100 000 for consumers of pond-ditch water (12 299 person–years),
77.81 for consumers of river water (5141 person–years) and 0 for consumers of well-
water (1333 person–years) (Yu & Chen, 1994).
2.1.3 Case–control studies
Zhao et al. (1994) conducted a pooled analysis of 10 Chinese case–control studies of
HCC, six from southern China and four from northern China, with a total of 920 cases
and 920 controls. Water source (drinking pond-ditch water) was a risk factor in the pooled
studies from southern China, but not in those from northern China. Additive and
multiplicative models were used to evaluate risk and test for interaction of risk factors. In
analyses of the data from southern China, the adjusted odds ratio was 1.60 (95% CI, 1.19–
2.13) for consumption of pond water (multiplicative model), with similar findings from
the additive model. Among users of non-pond water, the odds ratio for hepatitis antigen-
positivity was 10.68 (95% CI, 7.94–14.37). The odds ratio for persons who used pond
water and were positive for the hepatitis antigen was 17.04 (95% CI, 12.75–22.77). [A P-
value for the interaction between HCC and pond water was not provided.]
A population-based case–control study of 99 incident cases of HCC diagnosed
between October 1988 and October 1989 and 99 age- and sex-matched controls was
undertaken in Fusui County, Guangxi Autonomous Region, China, using data from

362 IARC MONOGRAPHS VOLUME 94
interviews of study subjects (Zhang, 1993). Conditional logistic regression showed
associations with drinking pond-ditch water (odds ratio, 3.70; 95% CI, 1.25–10.96)
continuously for more than four decades relative to never-users of pond water. The
findings were adjusted for ever having had a hepatitis B virus infection. [The authors did
not present measurements or estimates of microcystins in the drinking-water.]
In the review by Yu et al. (1995), several case–control studies were mentioned. In
Haimen County, the odds ratio for drinking pond-ditch water was 1.91 (95% CI, 1.01–
4.74). Microcystin was found in several ponds and ditches of the high-endemic areas for
HCC at levels of 0.061±0.086 µg/L; levels in well-water were 0.036±0.022 µg/L. [The
Working Group noted that the levels of microcystin were relatively low.]
Yu et al. (2001) performed a meta-analysis of six case–control studies and calculated
an odds ratio of 2.46 (95% CI, 1.69–2.59) for primary liver cancer following consumption
of pond-ditch water, with a population-attributable risk of 30.39% (95% CI, 23.30–
37.47%). In this study, much higher levels of microcystins were observed in pond-ditch
water than in well-water.
2.2 Colorectal cancer
Four hundred and eight colon and rectal carcinomas diagnosed from 1977 to 1996 in
eight townships were identified from the cancer registry of Haining City of Zhejiang
Province, China. The type of drinking-water consumed by each patient was ascertained
by interview with each case or a family member if the case was deceased. In addition, in
June to September 1997, 640 samples were taken from the four types of water source in
each of the eight townships and were analysed for levels of microcystins. The incidence
of colorectal cancer was significantly higher among people who drank river water
(relative risk, 7.94; 95% CI, 6.11–10.31) or pond water (relative risk, 7.70; 95% CI, 5.75–
10.30) than among those who consumed well-or tap-water. The maximum levels of
microcystins measured in well-, tap-, river and pond water were 9.13 ng/L, 11.34 ng/L,
1083.43 ng/L and 1937.94 ng/L, respectively (P < 0.01 for the contrast in levels of
microcystins in river or pond water versus those in well-and tap-water). The incidence of
colon cancer in each of the eight townships showed a significant positive correlation
(r = 0.881; P < 0.01 Spearman rank) with the average concentration of microcystins in the
township. The authors mentioned that findings for men and women were similar (Zhou et
al., 2000). [Cancer incidence was ascertained for the 20-year period of 1977–96 and the
survey of concentrations of microcystins was conducted in 1997, after the period of
diagnosis. Although this may lead to some misclassification of exposure, it was the
opinion of the Working Group that levels of microcystins in 1997 were probably
generally representative of levels over the previous 20-year period. The authors did not
describe how they estimated denominators of population size for calculating the water
source-specific estimates, and it was not stated whether incidence rates of colorectal
cancer by township were sex- or age-adjusted.]

CYANOBACTERIAL PEPTIDE TOXINS 363
2.3 References
Chen G, Yu S, Wei G (1996). [Studies on microcystin contents in different drinking water in highly
endemic area of liver cancer]. Zhonghua Yu Fang Yi Xue Za Zhi, 30:6–9. PMID:8758860
Ferlay J, Bray F, Pisani P, Parkin DM (2004). GLOBOCAN 2002: Cancer Incidence, Mortality and
Prevalence Worldwide. (IARC Cancer Base No. 5 Version 2.0), Lyon, IARC.
Ling B (2000). Health impairments arising from drinking water polluted with domestic sewage and
excreta in China. Schriftenr Ver Wasser Boden Lufthyg, 105:43–46. PMID:10842792
Yu SZ (1995). Primary prevention of hepatocellular carcinoma. J Gastroenterol Hepatol, 10:674–
682 doi:10.1111/j.1440-1746.1995.tb01370.x. PMID:8580413
Yu SZ, Chen G (1994). Blue-green algae toxins and liver cancer. Chin J Cancer Res, 6:6–17.
Yu SZ, Chen W, Li J (1995). [The prospective research of risk factors of primary liver cancer in
Nanhui County, Shanghai]. Zhonghua Liu Xing Bing Xue Za Zhi, 16:22–24. PMID:7767921
Yu SZ, Zhao N, Zi X (2001). [The relationship between cyanotoxin (microcystin, MC) in pond-
ditch water and primary liver cancer in China]. Zhonghua Zhong Liu Za Zhi, 23:96–99.
PMID:11783030
Zhang MD (1993). [A population-based case–control study of primary liver cancer in Fusui].
Zhonghua Liu Xing Bing Xue Za Zhi, 14:14–18. PMID:8504447
Zhao N, Yu SZ, Sun WM (1994). [Modelling the general relative risk models in case–control
studies of primary hepatocellular carcinoma]. Zhonghua Zhong Liu Za Zhi, 16:331–336.
PMID:7895581
Zhou L, Yu D, Yu H et al. (2000). [Drinking water types, microcystins and colorectal cancer].
Zhonghua Yu Fang Yi Xue Za Zhi, 34:224–226. PMID:11860936

364 IARC MONOGRAPHS VOLUME 94
3. Studies of Cancer in Experimental Animals
3.1 Pure microcystin-LR (see Table 3.1)
3.1.1 Mouse
A group of 13 male ICR mice, 5 weeks of age, received 100 intraperitoneal injections
of 20 µg/kg bw microcystin-LR (five times a week) over 20 weeks and were killed after
the end of the treatment (five mice) or after a 2-month withdrawal period (eight mice).
Three non-treated mice were used as controls. Liver foci which were, according to the
authors, probably benign tumours were induced in all 13 treated mice (Ito et al., 1997).
[The Working Group noted the small number of animals, the use of a single dose
exposure regimen, inadequacies of statistical evaluations and the lack of results for the
control animals.]
3.1.2 Rat
Groups of 10–16 male Fischer 344 rats, 7 weeks of age, were given a single
intraperitoneal injection of 0 or 200 mg/kg bw N-nitrosodiethylamine (NDEA) in saline
followed 2 weeks later by intraperitoneal injections of 0, 1 or 10 µg/kg bw pure
microcystin-LR twice a week for 6 weeks and partial hepatectomy at the end of week 3.
Phenobarbital (0.05%) was used as a positive control. In a second experiment, groups of
14–19 rats were initiated with NDEA followed 2 weeks later by two intraperitoneal
injections of 0 or 10 µg/kg bw pure microcystin-LR, partial hepatectomy at the end of
week 3 and intraperitoneal injections of 10, 25 of 50 µg/kg bw microcystin-LR twice a
week for 5 weeks. The tumour-promoting activity was estimated by induction of
glutathione S-transferase placental form-positive (GST-P) foci in rat liver. In the first
experiment, rats treated with NDEA plus 10 µg/kg bw microcystin-LR had an increased
incidence of GST-P foci per liver compared with NDEA-treated rats (26.0±8.1 versus
16.5±3.9/cm2; P < 0.005). In the second experiment, the three groups of rats treated with
NDEA plus 10 and 10 µg/kg bw microcystin-LR, NDEA plus 10 and 25 µg/kg bw
microcystin-LR or NDEA plus 10 and 50 µg/kg bw microcystin-LR had an increased
incidence of GST-P foci per liver compared with NDEA-treated rats (17.4±3.8 (P < 0.01),
32.7±11.1 (P < 0.01) and 44.4±10.3 (P < 0.001) versus 13.4±4.2/cm2,respectively)
(Nishiwaki-Matsushima et al., 1992).
Groups of male Fischer 344 rats [initial number unspecified], 7 weeks of age,
received a single intraperitoneal injection of 0 or 200 mg/kg bw NDEA in saline followed
2 weeks later by intraperitoneal injections of 0 or 25 µg/kg bw microcystin-LR. The
tumour-promoting activity of microcystin-LR was evaluated on the basis of an increase in

C
YA
NO
BA
CT
ER
IAL
PE
PT
IDE
TO
XIN
S
36
5
Table 3.1. Summary of the liver tumour-promoting activity and/or carcinogenicity of intraperitoneal injection of
microcystin-LR
Initiator Microcystin-LR
(µg/kg × times)
Species Partial
hepatectomy
Biomarker Estimation Reference
– 20 × 100 times Male ICR mice – Neoplastic
nodules
Weak carcinogen Ito et al. (1997)
NDEA 10 × 12 times Male Fischer 344
rats
+ GST-P foci Tumour promoter Nishiwaki-Matsushima
et al. (1992)
NDEA 10–50 × 12 times Male Fischer 344 rats
+ GST-P foci Tumour promoter Nishiwaki-Matsushima et al. (1992)
NDEA 25 × 20 times Male Fischer 344
rats
– GST-P foci Tumour promoter Ohta et al. (1994)
NDEA + aflatoxin B1 10 × 12 times Male Fischer 344 rats
+ GST-P foci Tumour promoter Sekijima et al. (1999)
Aflatoxin B1 10 × 12 times Male Fischer 344 rats
+ GST-P foci Tumour promoter Sekijima et al. (1999)
GST-P, glutathione S-transferase placental form-positive; NDEA, N-nitrosodiethylamine

366 IARC MONOGRAPHS VOLUME 94
three parameters: the number of GST-P-positive foci per liver (no./cm2), the area of foci
per liver (mm2/cm2) and the volume of foci per liver (v/v%) (see Table 3.2; Ohta et al.,
1994).
Groups of male Fischer 344 rats, 6 weeks of age, received an intraperitoneal injection
of 0 or 200 mg/kg bw NDEA in saline 2 weeks before intraperitoneal injections of 0, 1 or
10 µg/kg bw microcystin-LR twice a week for 6 weeks. Other groups were also treated
with aflatoxin B1 (0.5 mg/kg bw) and NDEA, or aflatoxin B1 alone, followed by partial
hepatectomy (for dosing regimes and results, see Table 3.3; Sekijima et al., 1999).
Table 3.2. Induction of liver GST-P foci by intraperitoneal administration of microcystin-LR or nodularin to rats initiated with NDEA
NDEA Toxin (µg/kg)
20 times
Effective
no. of rats
No. of
foci/liver (no./cm2)a
Area of
foci/liver (mm2/cm2)a
Volume of
foci/liver (v/v %)a
+ – 20 10.0±2.9 0.18±0.07 0.37±0.18
– – 5 0 0 0
+ Microcystin-LR (25) 18 95.7±27.9* 4.74±2.23* 8.55±4.04*
– Microcystin-LR (25) 17 1.6±1.4 0.02±0.02 0.04±0.03
+ Nodularin (25) 20 106.0±22.6* 39.87±10.51* 71.75±18.78*
– Nodularin (25) 16 6.3±7.3 0.49±0.89 0.92±1.58
From Ohta et al. (1994)
GST-P, glutathione S-transferase placental form-positive; NDEA N-nitrosodiethylamine; a Mean±standard deviation
* P < 0.005 versus NDEA control
Table 3.3. Induction of liver GST-P foci by microcystin-LR in rats initiated
with NDEA and/or aflatoxin B1
NDEA Aflatoxin B1 Microcystin-LR No. of rats No. of foci/livera Area foci/livera
+ – – 5 2.46±1.86 0.39±0.29
+ + – 15 8.34 ± 3.60* 1.69±0.79*
+ + 1 µg/kg bw 13 10.72±6.74* 2.26±1.75*
+ + 10 µg/kg bw 13 9.16±4.70 1.96±1.03**
– + – 10 1.61±0.74 0.76±0.51
– + 1 µg/kg bw 16 3.46±1.14*** 2.24±1.35***
– + 10 µg/kg bw 16 3.50±1.74 2.75±2.86
From Sekijima et al. (1999) GST-P, glutathione S-transferase placental form-positive; NDEA, N-nitrosodiethylamine a Mean±standard deviation *P <0.01 versus NDEA control
**P <0.001 versus NDEA control ***P <0.01 versus aflatoxin B1 control

CYANOBACTERIAL PEPTIDE TOXINS 367
3.2 Microcystis extracts
Mouse
Groups of five male and five female Swiss mice, 3 weeks of age, were given extracts
of Microcystis aeruginosa (1/4, 1/8 and 1/16 dilutions; equivalent to 28.3, 14.1 and 7 µg
microcystin/mL) in the drinking-water or drinking-water alone (controls) for periods up to
1 year, during which mice were killed at various intervals. The incidence of tumours in
mice was: 4/71 (one abdominal carcinoma, two lung carcinomas and one thoracic
lymphosarcoma) in the high-dose exposure group, 0/150 for the mid- and low-dose
exposure groups, and 2/73 (one uterine adenocarcinoma and one thoracic
lymphosarcoma) in the control group (Falconer et al., 1988). [The Working Group noted
that details about examination of tumours was not reported.]
Groups of 20 female Swiss mice, 3 months of age, received a single dermal
application of 0 or 500 µg 7,12-dimethylbenz[a]anthracene (DMBA) in acetone onto the
shaved skin and, 1 week later, were given extracts of Microcystis (1/2 dilution; equivalent
to 40 µg microcystin/mL) in the drinking-water or drinking-water alone. After 52 days of
exposure, a significant increase (P < 0.05) in the weight of skin papillomas/mouse was
reported [DMBA plus extract, 16 mg/mouse; DMBA, 2 mg/mouse; read from Figure].
No tumours were reported in the groups treated with the extract only or drinking-water
alone [2.5 tumours/mouse and four tumours/mouse were reported in the groups treated
with DMBA and DMBA plus extract, respectively; numbers of tumours were not
significantly different] (Falconer & Buckley, 1989; Falconer, 1991). [The Working Group
noted that the number of animals was not given.]
The possibility of promotion of growth of tumours initiated by two doses of 40 mg/kg
bw N-methyl-N-nitrosourea at 1-week intervals was investigated in 115 C57 black mice
[sex and age unspecified] exposed to 0, 10 or 40 µg/mL Microcystis toxins in the
drinking-water (0, 29 or 89 µg/day/mouse). After 154 days, tumours of the duodenum,
liver and lymphoid system were assessed. No effect of exposure to microcystin on the
growth of these tumours was observed (Falconer & Humpage, 1996). [The Working
Group noted the absence of a group treated with microcystins alone.]
To investigate the possibility that microcystin promotes colon tumours, a total of
176 male C57Bl/6 mice, 13 weeks of age, were given three weekly intraperitoneal
injections of 0 (n = 20) or 5 mg/kg bw azoxymethane (n = 156) in saline. Three weeks
later, azoxymethane-treated mice were exposed for 212 days to 0 (n = 61), 6 (n = 53) or
12 (n = 42) mg microcystin-LR equivalents/L (0, 382 or 693 µg/kg bw per day) in the
drinking-water. Mice from each group were killed at 13, 22, 28 or 36 weeks after the first
azoxymethane treatment. Examination of hypertrophic crypts in the colon showed a dose-
dependent increase in the area of aberrant crypt foci after exposure to microcystin. Results
were as follows: azoxymethane-only group (291 foci/57 mice), 25 × 103 µm2; azoxy-
methane plus low-dose microcystin (280 foci/49 mice), 26 × 103 µm2; azoxymethane plus
high-dose microcystin (195 foci/38 mice), 29 × 103 µm2 (P < 0.05). Only 1/16 untreated

368 IARC MONOGRAPHS VOLUME 94
mice had one foci and the rest had none (Humpage et al., 2000). [The Working Group
noted the absence of a group treated with microcystin alone.]
3.3 Nodularin
Rat
Groups of male Fischer 344 rats [initial number unspecified], 7 weeks of age,
received an intraperitoneal injection of 0 or 200 mg/kg bw NDEA in saline followed
2 weeks later by intraperitoneal injections of 10 or 25 µg/kg bw nodularin twice a week
for 10 weeks. Saline was injected into control animals. Nodularin showed strong tumour-
promoting activity in rat liver on the basis of parameters such as the number of GST-P
foci per liver (no./cm2), the area of foci per liver (mm2/cm2) and the volume of foci per
liver (v/v%). Treatment with NDEA followed by 25 µg/kg bw nodularin (20 rats) induced
106±22.6 foci per liver (P < 0.005), 39.87±10.51 mm2/cm2 foci per liver (P < 0.005) and
71.75±18.78% volume of foci per liver (P < 0.005) compared with 10.0±2.9 foci per
liver, 0.18±0.07 mm2/cm2 foci per liver and 0.37±0.18% volume of foci per liver in
NDEA alone-treated animals (20 rats). Treatment with NDEA followed by 10 µg/kg bw
nodularin (19 rats) induced 0.25±0.09 mm2/cm2 foci per liver (P < 0.025). Treatment with
25 µg/kg bw nodularin alone (16 rats) induced GST-P foci at the same potency as NDEA
alone (6.3±7.3 foci per liver, 0.49±0.89 mm2/cm2 foci per liver and 0.92±1.58% volume
of foci per liver; statistically non-significant). The results suggest that nodularin is a
stronger tumour promoter than microcystin-LR and has initiating activity equal to that of
NDEA (Ohta et al., 1994).
The tumour-promoting activity of nodularin was confirmed in groups of male Fischer
344 rats [initial number unspecified], 7 weeks of age, that received a single intraperitoneal
injection of 0 or 200 mg/kg bw NDEA in saline and received intraperitoneal injections
2 weeks later of 0 or 25 µg/kg bw nodularin twice a week for 10 weeks. Animals were
maintained up to experimental week 22 but were killed periodically. Results are presented
in Table 3.4. GST-P foci decreased significantly after the cessation of intraperitoneal
injections of nodularin. Following treatment with NDEA plus nodularin, GST-P foci
displayed two types of hyperplastic nodules: homogenously stained dense nodules and
heterogeneously stained pale nodules. The results suggest that nodularin is a promotor
that induces hepatocyte proliferation (Song et al., 1999).

CYANOBACTERIAL PEPTIDE TOXINS 369
Table 3.4. Induction of liver GST-P foci by nodularin in rats initiated with NDEA
GST-P foci (no./cm3)a Duration of the experiment
Nodularin only NDEA only NDEA + nodularin
Dense nodules Pale nodules
Untreated, 8 weeks 0 0 0 0
8 weeks 6.4±2.0 11.4±2.0 71.0±43.0 0
10 weeks 6.8±2.0 10.0±2.1 87.8±16.2 0 12 weeks 8.5±2.4 9.5±2.0 124.5±38.3 0
15 weeks 7.5±1.8 6.9±0.9 83.7±6.8 14.5±2.9 18 weeks 5.2±1.0 6.4±1.8 60.0±11.4 13.2±4.5
22 weeks 7.2±3.6 7.6±2.2 59.4±17.8 18.0±4.5
From Song et al. (1999) GST-P, glutathione S-transferase placental form-positive; NDEA, N-nitrosodiethylamine a Mean±standard deviation
3.4 References
Falconer IR (1991). Tumor promotion and liver injury caused by oral consumption of cyanobacteria. Environ Toxicol Water Qual, 6:177–184. doi:10.1002/tox.2530060207.
Falconer IR, Buckley TH (1989). Tumour promotion by Microcystis sp., a blue-green alga occurring in water supplies. Med J Aust, 150:351. PMID:2497311
Falconer IR, Humpage AR (1996). Tumour promotion by cyanobacterial toxins. Phycologia, 35:74–79.
Falconer IR, Smith JV, Jackson ARB et al. (1988). Oral toxicity of a bloom of the cyanobacterium Microcystis aeruginosa administered to mice over periods up to 1 year. J Toxicol Environ Health, 24:291–305. doi:10.1080/15287398809531163. PMID:3135416
Humpage AR, Hardy SJ, Moore EJ et al. (2000). Microcystins (cyanobacterial toxins) in drinking water enhance the growth of aberrant crypt foci in the mouse colon. J Toxicol Environ Health, 61:155–165. doi:10.1080/00984100050131305. PMID: 11036504
Ito E, Kondo F, Terao K, Harada K-I (1997). Neoplastic nodular formation in mouse liver induced by repeated intraperitoneal injections of microcystin-LR. Toxicon, 35:1453–1457. doi:10.1016/S0041-0101(97)00026-3. PMID:9403968
Nishiwaki-Matsushima R, Ohta T, Nishiwaki S et al. (1992). Liver tumor promotion by the cyanobacterial cyclic peptide toxin microcystin-LR. J Cancer Res Clin Oncol, 118:420–424. doi:10.1007/BF01629424. PMID:1618889
Ohta T, Sueoka E, Iida N et al. (1994). Nodularin, a potent inhibitor of protein phosphatases 1 and 2A, is a new environmental carcinogen in male F344 rat liver. Cancer Res, 54:6402–6406. PMID:7527297
Sekijima M, Tsutsumi T, Yoshida T et al. (1999). Enhancement of glutathione S-transferase placental-form positive liver cell foci development by microcystin-LR in aflatoxin B1-initiated rats. Carcinogenesis, 20:161–165 doi:10.1093/carcin/20.1.161. PMID:9934864
Song KY, Lim IK, Park SC et al. (1999). Effect of nodularin on the expression of glutathione S-transferase placental form and proliferating cell nuclear antigen in N-nitrosodiethylamine initiated hepatocarcinogenesis in the male Fischer 344 rat. Carcinogenesis, 20:1541–1548. doi:10.1093/carcin/20.8.1541. PMID:10426804

370 IARC MONOGRAPHS VOLUME 94
4. Mechanistic and Other Relevant Data
A number of reviews that deal with various aspects of the toxicity of microcystins and
nodularin have been published (Metcalf & Codd, 2004; Falconer & Humpage, 2005;
Dietrich & Hoeger, 2005).
Over 70 variants of microcystins have been identified; most studies have used
microcystin-LR, -RR, -YR and -YM, for which toxicity data are summarized in Section
4.4 (Gupta et al., 2003).
Most work on nodularin has been carried out with the arginine pentapeptide, although
the best structural work has been performed with motuporin (a more hydrophobic
congener in which Arg is replaced by Val) (Bagu et al., 1995; Goldberg et al., 1995;
Maynes et al., 2006).
4.1 Absorption, distribution, metabolism and excretion
4.1.1 Humans
There are only two reports in which the absorption of microcystin was documented
by direct measurement of its association to tissues. Both reports referred to the same
accident that occurred in Brazil, in patients who underwent haemodialysis in 1996 (see
Section 4.4) (Pouria et al., 1998; Carmichael et al., 2001).
There are really no quantitative data on tissue distribution, metabolism or excretion in
humans. A common finding in agreement with most animal studies is the accumulation
and persistence of microcystins in the liver (Azevedo et al., 2002; Soares et al., 2006).
Although concentrated in the liver, microcystin was also detected in the sera of patients
up to 2 months or longer after exposure (Hilborn et al., 2005; Soares et al., 2006).
Little is known about the metabolism of microcystins; indirectly, it probably occurs
but nothing is known about any intermediates or products. The finding of unidentified
peaks by mass spectrometry analysis could represent metabolic products of microcystins
(Soares et al., 2006).
The mode and extent of excretion in humans is not known either. It is unlikely to
occur through the kidneys; many animal studies have shown that secretion in urine, when
it occurs, is very limited.
There are no published records that directly and unequivocally link absorption of
nodularin and its toxicity in humans. Many different animals are susceptible to the
toxicity of nodularin (see Section 4.1.2); it is therefore most probably toxic in humans and
this toxicity may be similar to that found in animals. In addition, nodularin shares some
properties with the microcystins. Since microcystins have caused death in haemodialysis
patients exposed to microcystin-contaminated water (Jochimsen et al., 1998), nodularin is
probably toxic to humans.

CYANOBACTERIAL PEPTIDE TOXINS 371
In a recent publication, Fischer et al. (2005) showed uptake of radiolabelled
[3H]dihydromicrocystin-LR in frog (Xenopus laevis) oocytes that express the human
organic anion transporters polypeptides (OATPs) OATP1B1, OATP1B3 and OATP1A2,
whereas no uptake was obtained in cells that express OATP2B1. All of these transporters
are found in the liver and brain. [From calculations, the radioactivity taken up was very
small] (Fischer et al. 2005). [If this pattern of differential species-specific uptake holds,
then uptake of microcystin by the brain would be a property of this toxin that is peculiar
to humans. This needs to be investigated in order to validate extrapolations between
experimental models and humans.]
The uptake of nodularin has not been investigated (Fischer et al., 2005).
4.1.2 Experimental systems
(a) Absorption and distribution
(i) Whole animals
Microcystins
Administration of microcystins to many species including mice, rats, cattle, sheep,
swine and fish results in liver toxicity (Jackson et al., 1984; Falconer et al., 1986;
Runnegar et al., 1986; Brooks & Codd, 1987; Galey et al., 1987; Robinson et al., 1989,
1991; Williams et al., 1995; Stotts et al., 1997a,b; Tencalla & Dietrich, 1997). Most
studies to investigate the uptake and tissue distribution of microcystins have used the
intraperitoneal or intravenous routes, although a few have used oral administration.
Numerous studies used radiolabelled peptides but, depending on the radioactive
labelling method used for microcystins or nodularin, the results may vary since the
labelled products obtained may present different characteristics with both advantages and
disadvantages (Table 4.1). A disadvantage of using different preparations with widely
varying specific activities is that it is difficult to deduce whether or not variations between
studies result in part from the choice of the labelled toxin. On the positive side, it
reinforces any common findings that result from experiments that used these differently
labelled tools.
Kinetic studies on the absorption and distribution of microcystin are described in
Table 4.2.
In studies that used intravenous or intraperitoneal administration in different
experimental models, with different protocols and variously labelled microcystins, the one
common finding in almost all of them was the accumulation of microcystin in the liver
and low concentrations in the kidney in animals as diverse as salmon, pigs and rodents.
The intestinal concentration of microcystin was much more varied and probably reflects
the different dosing and degrees of metabolism and secretion.
Not unexpectedly, the oral dose required to induce microcystin toxicity is higher than
the intravenous or intraperitoneal dose. In most oral studies, microcystin is found in the
liver. The pathology following oral administration of microcystin parallels broadly that

37
2
IAR
C M
ON
OG
RA
PH
S V
OL
UM
E 9
4
Table 4.1. Advantages and disadvantages of the different radioactive labelling methods for microcystins (MC) and
nodularin (NOD)
Isotope Toxin Method Advantages
Disadvantages Specific
activity
(mCi/mmol)
Reference
14C MC-LR Biosynthesis with 14[C]NaHCO3
• Most stable labelled
product
• Structure closest to
native peptide
• Time consuming
labelling method
• Low specific activity
of the labelled product
2.6
1.38
> 0.9
0.08
Brooks & Codd (1987)
Williams et al. (1997)
Craig et al. (1996)
Pflugmacher et al. (1998)
3H MC-LA
MC-LR
Exchange with 3H2O • The two isomers
obtained retain toxicity of the native
peptide
• Dihydromicrocystins
unable to form covalent bond to PP1
and PP2A • Potential differences
of interaction,
stability and
metabolic properties with the native
peptide
NR
194
Botes et al. (1984)
Robinson et al. (1989)
3H MC-LR
Reduction with 3[H]NaBH4
• The two isomers
obtained retain toxicity of the native
peptide
• Dihydromicrocystins
unable to form covalent bond to PP1
and PP2A • Potential differences
of interaction, stability and
metabolic properties with the native
peptide
170–310
22 700 32.6
1039 247
Meriluoto et al. (1990)
Nishiwaki et al. (1994) Williams et al. (1995)
Stotts et al. (1997a,b) Bury et al. (1998)

C
YA
NO
BA
CT
ER
IAL
PE
PT
IDE
TO
XIN
S
37
3
Table 4.1 (contd)
Isotope Toxin Method Advantages Disadvantages Specific activity
(mCi/mmol)
Reference
125I MC-YM MC-YM
MC-YR
Na125I with lactoperoxidase/H2O2
Na125I with lactoperoxidase/H2O2
Iodogen
• Easy labelling procedure
• High specific activity
• Retain toxicity of the
native peptide
• Limited to variants that contain tyrosine
NR NR
NR
Falconer et al. (1986) Runnegar et al. (1986)
Moorhead et al. (1994)
3H NOD Reduction with 3[H]NaBH4
• Retain toxicity of the
native peptide
669–678 Spoof et al. (2003)
Adapted from Spoof et al. (2003) H2O2, hydrogen peroxide; MC, microcystin; NaBH4, sodium borohydride; NaHCO3, sodium bicarbonate; NOD, nodularin; NR, not reported; PP1, protein phosphatase 1; PP2A, protein phosphatase 2A
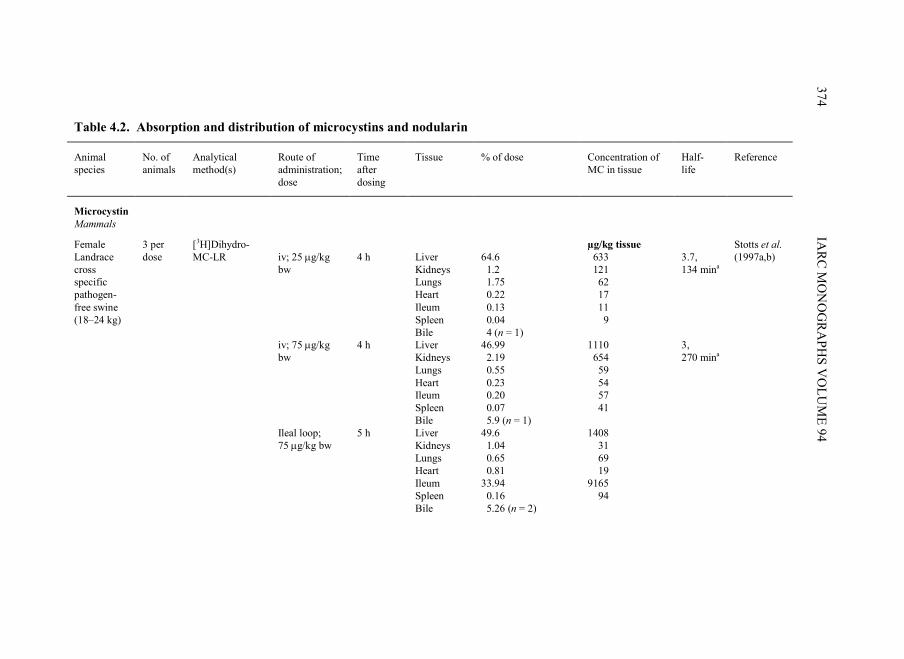
37
4
IAR
C M
ON
OG
RA
PH
S V
OL
UM
E 9
4
Table 4.2. Absorption and distribution of microcystins and nodularin
Animal
species
No. of
animals
Analytical
method(s)
Route of
administration;
dose
Time
after
dosing
Tissue % of dose Concentration of
MC in tissue
Half-
life
Reference
Microcystin
Mammals
Female
Landrace
cross
specific
pathogen-
free swine
(18–24 kg)
3 per
dose
[3H]Dihydro-
MC-LR
iv; 25 µg/kg
bw
iv; 75 µg/kg
bw
Ileal loop;
75 µg/kg bw
4 h
4 h
5 h
Liver
Kidneys
Lungs
Heart
Ileum
Spleen
Bile
Liver
Kidneys
Lungs
Heart
Ileum
Spleen
Bile
Liver
Kidneys
Lungs
Heart
Ileum
Spleen
Bile
64.6
1.2
1.75
0.22
0.13
0.04
4 (n = 1)
46.99
2.19
0.55
0.23
0.20
0.07
5.9 (n = 1)
49.6
1.04
0.65
0.81
33.94
0.16
5.26 (n = 2)
µg/kg tissue
633
121
62
17
11
9
1110
654
59
54
57
41
1408
31
69
19
9165
94
3.7,
134 mina
3,
270 mina
Stotts et al.
(1997a,b)

C
YA
NO
BA
CT
ER
IAL
PE
PT
IDE
TO
XIN
S
37
5
Table 4.2 (contd)
Animal species
No. of animals
Analytical method(s)
Route of administration;
dose
Time after
dosing
Tissue % of dose Concentration of MC in tissue
Half- life
Reference
Female
albino rats
(207–249 g)
10 (5
per time
interval)
[125I]MC-YM iv; ~10 µg/kg
bw
30 min
120 min
Liver
Gut
contents
Kidney
Urine
(total)
Liver
Gut
contents
Kidney
Urine
(total)
21.7±1.1
7.0±0.3
5.6±0.2
0.9±0.5
19.2±0.3
9.4±1.1
5.3±0.4
1.9±0.2
2.1,
42 mina
Falconer et
al. (1986)
Male Swiss
Webster
mice
(25–37 g)
25 (1–3
per
dose)
[125I]MC-YM
mono- and di-
iodinated
peptides, results
here for
[125I]MC-YM
similar to
[125I]2MC-YM
ip; ~80–240b
µg/kg bw
At death
(2–15 h)
(lethal
dose)
(24 h)
(sublethal
dose)
Liver
Kidney
Liver
Kidney
43–63
1–2
24–57
0.5–3
Runnegar et
al. (1986)

37
6
IAR
C M
ON
OG
RA
PH
S V
OL
UM
E 9
4
Table 4.2 (contd)
Animal
species
No. of
animals
Analytical
method(s)
Route of
administration;
dose
Time
after
dosing
Tissue % of dose Concentration of
MC in tissue
Half-
life
Reference
Male
Han:NMRI
mice
(30±2 g)
4 [3H]dihydroMC-
LR epimers
iv; 15 µg/kg
bw
(0.5 µg/mouse)
45 min
Liver
Intestine
Kidney
Spleen
Muscle
Brain Plasma
Relative
concentration in
counts (min ××××
mass unit)
plasma = 1
35
7
5
1.5
1
1 1
Meriluoto
et al.
(1990)
Male
VAF/plus
CD-1 mice (19–25 g)
5 per
time
interval
[3H]MC-LR ip; 45–101
µg/kg bw
At death
or 6 h
(surviving mice)
Liver
Intestine
Carcass Kidney
Heart,
spleen,
lung,
skeletal
muscle
>50
~10
~10 ~1
All <1
Robinson et
al. (1989)
[3H]MC-LR ip; 70 µg/kg
bw
60 min Liver
Kidney
Intestine
60
1
9
29 min

C
YA
NO
BA
CT
ER
IAL
PE
PT
IDE
TO
XIN
S
37
7
Table 4.2 (contd)
Animal
species
No. of
animals
Analytical
method(s)
Route of
administration;
dose
Time
after
dosing
Tissue % of dose Concentration of
MC in tissue
Half-
life
Reference
Male
VAF/plus
CD-1 mice
(20–27 g)
6 [3H]MC-LR iv; 35 µg/kg
bw
1 min
60 min
Liver
Kidney
Intestine
Carcass
Plasma
Liver
Kidney
Intestine
Carcass Plasma
23±5
2.0±0.2
5.2±0.9
30±3
25±4
67±4
0.8±0.1
8.6±0.7
6±2 Trace
Robinson et
al. (1991)
Female ICR
mice
2–3
mice
per time
interval
[3H]dihydroMC-
LR
ip; ~80 mg/kg
bwc
5 min
15 min
30 min
60 min
60 min
Liver
Small
intestine
Large
intestine
Kidney
Gall
bladder
Lungs
Stomach
17±4.1
38.0±7.1
57.3±4.1
71.5±6.9
1.4
0.5
0.5
0.5
0.4
0.3
Nishiwaki
et al.
(1994)
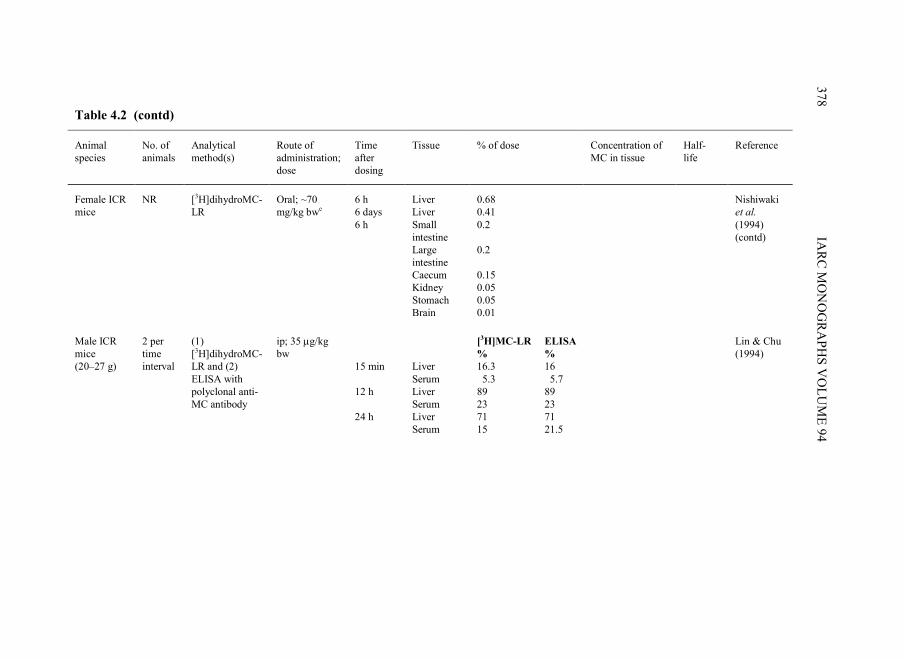
37
8
IAR
C M
ON
OG
RA
PH
S V
OL
UM
E 9
4
Table 4.2 (contd)
Animal
species
No. of
animals
Analytical
method(s)
Route of
administration;
dose
Time
after
dosing
Tissue % of dose Concentration of
MC in tissue
Half-
life
Reference
Female ICR
mice
NR [3H]dihydroMC-
LR
Oral; ~70
mg/kg bwe
6 h
6 days
6 h
Liver
Liver
Small
intestine
Large
intestine
Caecum
Kidney
Stomach
Brain
0.68
0.41
0.2
0.2
0.15
0.05
0.05
0.01
Nishiwaki
et al.
(1994)
(contd)
Male ICR
mice
(20–27 g)
2 per
time
interval
(1)
[3H]dihydroMC-
LR and (2)
ELISA with
polyclonal anti-
MC antibody
ip; 35 µg/kg
bw
15 min
12 h
24 h
Liver
Serum
Liver
Serum
Liver
Serum
[3H]MC-LR
%
16.3
5.3
89
23
71
15
ELISA
%
16
5.7
89
23
71
21.5
Lin & Chu
(1994)

C
YA
NO
BA
CT
ER
IAL
PE
PT
IDE
TO
XIN
S
37
9
Table 4.2 (contd)
Animal
species
No. of
animals
Analytical
method(s)
Route of
administration;
dose
Time
after
dosing
Tissue % of dose Concentration of
MC in tissue
Half-
life
Reference
Fish
Atlantic
salmon
(80–160 g)
4 per
time
interval,
only 1
at 46 h
[3H]dihydroMC-
LR
ip; 1 mg/kg bw
2 h
5 h
22 h
46 h
2 h
5 h
22 h
46 h
Liver
Muscle
Muscle
Muscle
Muscle
2.8±0.4
4.9±0.4
4.2±0.6
2.4
µg/g tissue
3.5
5.3
4.4
2.5
0.1 or less
0.1 or less
0.3
0.1 or less
Williams et
al. (1995)
Atlantic
salmon (100–
130 g)
4 per
time
interval
[14C]MC-LR ip; 1 mg/kg bw
2 h
5 h
24 h
43.5 h
2 h
5 h
24 h
43.5 h
2 h
5 h
24 h
43.5 h
Liver
Muscle
Carcass
11.93±0.17
16.55±0.85
6.53±0.54
2.70±0.31
40.7±3.5
39.3±3.0
13.2±1.5
6.1±0.7
µg/g tissue
9.29±0.06
9.84±0.56
4.35±0.34
2.15±0.24
0.15±0.02
0.26±0.04
NR
0.24±0.04
0.43±0.04
0.42±0.03
0.14±0.02
0.07±0.01
Williams et
al. (1997)

38
0
IAR
C M
ON
OG
RA
PH
S V
OL
UM
E 9
4
Table 4.2 (contd)
Animal
species
No. of
animals
Analytical
method(s)
Route of
administration; dose
Time
after dosing
Tissue % of dose Concentration of
MC in tissue
Half-
life
Reference
Rainbow
trout (60 g)
3 per
time
interval
(1) PP activity
inhibition and
(2) extractable
MC-LR by PP
activity
inhibition
Gavage;
freeze-dried
cyanobacteria
equivalent to
5700 µg/kg bw
MC-LR*; dose
toxic at 96 h
1 h
3 h
12 h
24 h
48 h
72 h
Liver
Plasma
Liver
Plasma
Liver
Plasma
Liver
Plasma
Liver
Plasma
Liver
Plasma
PP inhibition
(% of control)
60
4
20
42
41
52
Extractable MC-
LR (ng/g liver,
ng/mL plasma)
144
24
524
520
226
180
51
62
40
0
44
0
3.3 h Tencalla &
Dietrich
(1997);
Fischer et
al. (2000)
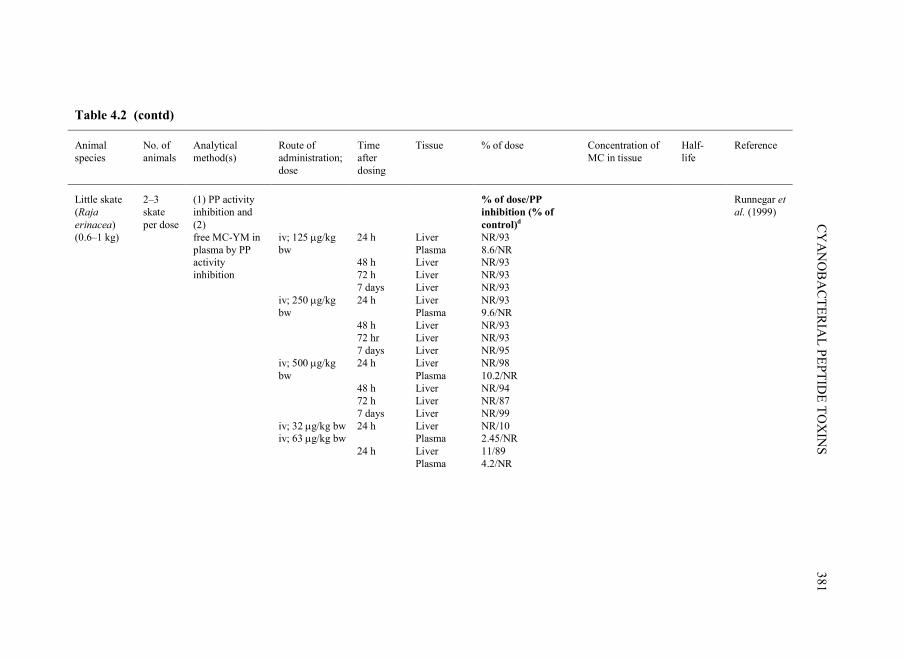
C
YA
NO
BA
CT
ER
IAL
PE
PT
IDE
TO
XIN
S
38
1
Table 4.2 (contd)
Animal
species
No. of
animals
Analytical
method(s)
Route of
administration;
dose
Time
after
dosing
Tissue % of dose Concentration of
MC in tissue
Half-
life
Reference
Little skate
(Raja
erinacea)
(0.6–1 kg)
2–3
skate
per dose
(1) PP activity
inhibition and
(2)
free MC-YM in
plasma by PP activity
inhibition
iv; 125 µg/kg
bw
iv; 250 µg/kg
bw
iv; 500 µg/kg
bw
iv; 32 µg/kg bw iv; 63 µg/kg bw
24 h
48 h
72 h
7 days
24 h
48 h
72 hr
7 days
24 h
48 h
72 h
7 days
24 h
24 h
Liver
Plasma Liver
Liver
Liver
Liver
Plasma
Liver
Liver
Liver
Liver
Plasma
Liver
Liver
Liver
Liver Plasma
Liver
Plasma
% of dose/PP
inhibition (% of
control)d
NR/93
8.6/NR NR/93
NR/93
NR/93
NR/93
9.6/NR
NR/93
NR/93
NR/95
NR/98
10.2/NR
NR/94
NR/87
NR/99
NR/10 2.45/NR
11/89
4.2/NR
Runnegar et
al. (1999)

38
2
IAR
C M
ON
OG
RA
PH
S V
OL
UM
E 9
4
Table 4.2 (contd)
Animal
species
No. of
animals
Analytical
method(s)
Route of
administration;
dose
Time
after
dosing
Tissue % of dose Concentration of
MC in tissue
Half-
life
Reference
Nodularin
BALB/c
mice
(20–25 g)
8 [3H]dihydro-
NOD
iv; 20 µg/kg
bw
2 h
Liver
Blood
Intestine
Kidney Spleen
Bone
Brain
Muscle
Lung
[1.6]e
[0.5]
[0.5]
[0.1]
cpm/mg
~15
~5
~5
~1 trace
trace
trace
trace
trace
Spoof et al.
(2003)
ELISA, enzyme-linked immunosorbent assay; ip, intraperitoneal; iv, intravenous; LD50,dose that is lethal to 50 % of animals; MC, microcystin; MC-LR*: corresponds
to a conformational variant of microcystin-LR which is equally toxic; NOD, nodularin; NR, not reported; PP, protein phosphatase a Biphasic disappearance curve of blood radioactivity b Note: the LD50 of the peptide was 110 µg/kg for male mice in this study c The doses given in the original article were: 2.4 µmol/mouse [~80 mg/ kg bw] and 2.1 µmol/mouse [~70 mg/ kg bw]. The Working Group noted that these reported
doses are in great excess of the LD50 of [3H]dihydromicrocystin-LR for mice (~110 µg/ kg bw). It is reasonable to deduce that the unit was misreported and that the real
doses were 1000 times lower.
d > 90% inhibition of PP activity considered to be fully inhibited e % of dose calculated by the Working Group

CYANOBACTERIAL PEPTIDE TOXINS 383
found after intravenous or intraperitoneal administration, although the amount of
microcystin or microcystin-containing bloom that is needed for oral toxicity varies with
species and on whether or not the animal is fasted. For fasted mice, the ratio between the
oral and intraperitoneal dose required is ~30; for sheep, it is ~150; and for chickens, it is
~125 (Jackson et al., 1984). In BALB/c mice, Yoshida et al. (1997) found that the
intraperitoneal LD50 (dose that is lethal to 50% of animals) of microcystin-LR was
65.4 µg/kg bw and the oral LD50 was 10.9 mg/kg bw. In many of these studies, uptake of
microcystin or microcystin-containing bloom was inferred by the resulting toxicity. The
accumulation of microcystin in the liver can be very fast, within minutes after injection as
was shown in mice (Robinson et al., 1991; Nishiwaki et al., 1994; Lin & Chu, 1994) and
can last several hours and even several days as shown in salmon (Williams et al., 1995,
1997).
Nodularin
A number of studies have demonstrated the toxicity of nodularin and, by inference, its
absorption, both in field cases and in laboratory animals. In field cases, nodularin is taken
up as cyanobacterial bloom that contains toxic strains of Nodularia. Laboratory animals
are most frequently administered purified nodularin. Field cases attributed to nodularin
poisoning include the deaths of a dog in South Africa (Harding et al., 1995), sea birds in
the Baltic Sea (Sipiä et al., 2004) and sheep in Australia (Main et al., 1977). Laboratory
animals tested include mice (Carmichael et al., 1988; Eriksson et al., 1988; Runnegar et
al., 1988), guinea-pigs and sheep (Main et al., 1977). The primary target organ was the
liver.
There is only one study in mammals of the distribution of nodularin (Spoof et al.,
2003; Table 4.2). Two hours after intravenous injection of a non-toxic dose of
[3H]dihydronodularin isomers (20 µg/kg bw) into mice, the toxin (and possibly its
metabolites) was found concentrated in the liver. Intestine and blood also retained
significant amounts of the labelled compound. [The Working Group noted that the
experimental details were not sufficiently clear, the reported total activity was low and
only a single time point was reported.]
Other studies have investigated the effect of nodularin in aquatic animals: from sea-
ducks to zooplankton (Sipiä et al., 2001a,b; Kankaanpää et al., 2002; Sipiä et al., 2002;
Kankaanpää & Sipiä, 2003; Lehtonen et al., 2003; Sipiä et al., 2004; Kankaanpää et al.,
2005a,b). Adsorption and distribution in aquatic species are reported here (Table 4.3)
because of the potential for bioaccumulation that would result in contaminated food
sources. In fish from the Baltic Sea (such as flounders and cod), nodularin has also been
reported to accumulate mainly in the liver. In flounders, the concentration of toxin was
shown to increase strongly between May and August during the blooming period of
Nodularia. However, when measured, none or only trace amounts of nodularin were
detected in the muscle of fish even when the concentration in the liver was significant
(Sipiä et al., 2001a,b, 2002; Karlsson et al., 2003).

384 IARC MONOGRAPHS VOLUME 94
Table 4.3. Detection and distribution of nodularin in aquatic animals
Species Origin Method of detection Tissue Quantitation Reference
Flounders (Platichthys flesus)
Baltic Sea, 1995
LC–MS MALDI-TOF-MS
Liver 100–600 µg/kg wet wt Karlsson et al. (2003)
Eiders (Somateria mollissima)
Baltic Sea, 2002
ELISA LC–MS
Liver 3–180 µg/kg dry wt Sipiä et al. (2004)
Flounders (Platichthys flesus)
Baltic Sea, 1996–98
ELISA, HPLC, PP1 inhibition
Liver Muscle
25–140 µg/kg dry wt None detected
Sipiä et al. (2001a)
Cod (Gadus morhua)
Baltic Sea, 1996–98
ELISA, HPLC, PP1 inhibition
Liver Muscle
~55 µg/kg dry wt None detected
Sipiä et al. (2001a)
Flounders (Platichthys flesus)
Baltic Sea, 1999–2000
ELISA LC–MS
MALDI-TOF-MS
Liver Muscle
Up to 400 µg/kg None detected
Sipiä et al. (2002)
Clams (Macoma
baltica)
Baltic Sea,
2000
ELISA
LC–MS MALDI-TOF-MS
100–130 µg/kg dry wt
(one site, 1490 µg/kg)
Sipiä et al.
(2002)
Mussels (Mytilus edulis)
Baltic Sea, 1999–2000
ELISA LC–MS
MALDI-TOF-MS
40–130 µg/kg dry wt (one site, 1490 µg/kg)
Sipiä et al. (2002)
ELISA, enzyme-linked immunosorbent assay; HPLC, high-performance liquid chromatography; LC–
MS, liquid chromatography–mass spectrometry; MALDI-TOF-MS, matrix-assisted laser desorption/ionization time-of-flight mass spectrometry; PP, protein phosphatase
Clams and mussels can also accumulate nodularin. Blue mussels collected from the
northern Baltic Sea in 2000 contained about 40–130 µg/kg dry wt and, in the Gulf of
Finland, toxin concentrations were up to 1490 µg/kg dry wt. Total hepatotoxin levels in
mussels decreased from August to September, indicating at least partial
detoxification/depuration of the toxin. However, in deeper-living wreck mussels,
hepatotoxin levels continued to increase from August to September, indicating that
portions of cyanobacterial hepatotoxins reach the sea floor (Sipiä et al., 2002).
(ii) In-vitro absorption
Many studies have investigated the uptake of microcystins in isolated hepatocytes and
its consequences. Most frequently, the source of hepatocytes is rats but cells from any
other species would be expected to respond to microcystin in qualitatively the same way.
It has been known for more than 20 years that uptake in hepatocytes is carrier-mediated,
dose-dependent and saturable and that it can be inhibited (Runnegar et al., 1981; Eriksson
et al., 1990a). Other cells (even non-parenchymal liver cells) are much less sensitive to
the toxicity of microcystin and require much higher doses and longer incubation times for
toxicity (Runnegar et al., 1995a). [This finding of preferential uptake of microcystins in

CYANOBACTERIAL PEPTIDE TOXINS 385
hepatocytes may explain why the liver is the primary target of its accumulation and
toxicity.]
(iii) In-vitro and in-vivo inhibition of uptake
A number of earlier studies on the toxicity of microcystin and/or Microcystis
described the partial protection of the co-administration of a number of compounds.
Runnegar et al. (1981) showed that at least some of these compounds protect rat
hepatocytes in vitro: sodium cholate, deoxycholate, rifampicin (rifamycin SV) and
bromosulfophthalein all inhibited the cytoskeletal changes (blebbing of the cells) induced
by microcystin. With the introduction of the use of radiolabelled microcystins, this
protection in rat hepatocytes was shown to result from inhibition of uptake (Runnegar et
al., 1991, 1995b). Runnegar et al. (1999) found a similar pattern of protection in skate
hepatocytes which indicated the related nature of transporters in the uptake of
microcystins in these very divergent species.
Fischer et al. (2005) recently expressed the human OATP family that catalyses the
uptake of the cell-impermeable microcystins in Xenopus laevis oocytes (Section 4.1.1).
The activity of these transporters is inhibited by bile acids and dyes which concords with
the findings in hepatocytes by Runnegar et al. (1981). These transporters are present in
the brain, as well as the liver, and may mediate uptake of microcystins across the blood–
brain barrier, although this has not yet been demonstrated experimentally. However, some
data suggest the possible transfer of microcystins across the blood–brain barrier in mice
(Falconer et al., 1988; Maidana et al., 2006).
Hermansky et al. (1990) showed that 25 mg/kg bw rifampin given intraperitoneally
before 100 µg/kg bw microcystin-LR protected mice from microcystin-LR toxicity.
Runnegar et al. (1993) confirmed this in mice dosed intraperitoneally with 84 µg/kg bw
microcystin-YM. This dose, when injected alone, inhibited protein phosphatase (PP)
activity and [125I]microcystin-YM accumulated in the liver of mice within 15 min of
treatment. By 30 min, the liver had significantly increased in weight because of
haemorrhage. Intraperitoneal injection of the antibiotic rifamycin (5 µmol/mouse) 5 min
before microcystin-YM prevented the uptake of [125I]microcystin-YM, the inhibition of
PP activity and toxicity (increase in liver weight). This protection was still seen 24 h after
treatment. Injection of rifampin (Hermansky et al., 1990) or rifamycin (Runnegar et al.,
1993) after treatment with microcystins did not protect against toxicity.
No studies have reported factors that may inhibit uptake of nodularin.
(b) Metabolism
The proposed pathway for excretion of both microcystins and nodularin is
conjugation to the thiol of glutathione (GSH), which may be excreted as such or
processed to the γ-glutamyl cysteine conjugate and finally to the cysteine conjugate and
then excreted.

386 IARC MONOGRAPHS VOLUME 94
(i) Microcystins
The metabolic reactions of microcystins have been shown to occur enzymatically in
vitro with cell extracts from many sources (see Pflugmacher et al., 1998). Formation of a
GSH conjugate is the most probable pathway in vivo in view of the observed changes in
GSH peroxidase and GST activities following treatment with microcystins in mice and in
vitro (Pflugmacher et al., 1998; Gehringer et al., 2004).
Only one report identifies microcystin–GSH and –cysteine adducts in vivo following
treatment with microcystin. Kondo et al. (1996) identified an HPLC peak that
corresponded to a microcystin–GSH standard (chemically synthesized) as a microcystin-
RR–GSH adduct. Nucleophilic reaction of the thiol group of GSH with the α-β
unsaturated carbonyl of the methyl dehydroalanine moiety of microcystin results in the
microcystin–GSH adduct. In vivo, the reaction would be catalysed by liver GSTs. Three
hours after treatment, this HPLC metabolite constituted a small, unspecified percentage of
the dose in mice injected intraperitoneally with microcystin-RR (20 µg/mouse, equivalent
to about 600 µg/kg bw). Another peak was identified as the microcystin-LR–cysteine
conjugate in the liver cytosol of rats 24 h after injection with 4 µg microcystin-LR/rat.
Experimentally, the authors stated that results were at the limit of detection in a
concomitant liquid chromatography–mass spectrometry analysis. A number of other
unidentified metabolites that were more hydrophilic than microcystin-RR were also
formed as reported previously for microcystin-LR (Robinson et al., 1991).
The major mechanism that explains the high toxicity of microcystins is the ability of
these molecules to bind covalently to and inhibit the Ser/Thr protein phosphatases 1 and
2A (see below). The bond between microcystins and protein phosphatases is very stable
and influences metabolism (Runnegar et al., 1995c).
The metabolism of microcystins would result from a balance between the two types
of reactions described above.
Microcystin-LR, -YR and -RR–GSH adducts have been shown to retain some
toxicity in vivo. Microcystin-LR–GSH retained 6% of the toxicity of the parent
compound when injected intravenously into mice, while microcystin-LR–cysteine
retained 14% of the toxicity (Kondo et al., 1992). This indicates that GSH and cysteine
adducts might themselves inhibit PP activity. [However, the possibility that the adducts
convert back in part to the native microcystin in vivo and that this native toxin is the cause
of toxicity was not considered. Whether the GST can catalyse the conjugation of GSH to
microcystin when it is associated (non-covalently) with PPs has not been investigated
either. The inhibitory binding between most PP inhibitors, including microcystins, is very
tight and renders the interaction kinetically nearly irreversible (Takai et al., 1995).]
[In addition to GSH conjugation, many other factors may influence metabolism. The
methyl dehydroalanine moiety could react with cytochrome P450 enzymes to form more
soluble metabolites that retain, lack or have increased toxicity. Other possibilities include
glucoronidation and compartmentation within the cell that could lead to the sequestration
of some of the toxin. Decreased or increased activity or membrane localization of uptake
and/or export of microcystin and its metabolites that may result from changes in
CYANOBACTERIAL PEPTIDE TOXINS 387
phosphorylation could also impact metabolism. Even catabolism of PP could lead to
increases in active toxin within the cell. Metabolism of microcystin by endogenous
enzymes and/or intestinal flora is a further possibility.]
(ii) Nodularin
Nodularin readily forms adducts with GSH. As for microcystins, it has not yet been
fully demonstrated that the enzymatically formed GSH conjugate pathway applies to the
metabolism and detoxication of nodularin. GSTs catalyse the conjugation of nodularin at
the N-methyl dehydrobutyric residue to the thiol of GSH. These adducts can then be
excreted as such or processed to the γ-glutamyl cysteine conjugate and finally to the
cysteine conjugate. To date, the only evidence of this pathway of nodularin metabolism
has been in aquatic animals.
In-vitro assays using the substrate 1-chloro-2,4-dichlorobenzene (Beattie et al., 2003)
showed that extracts from cysts, nauplii and adult brine shrimp (Artemia salina) contained
significant amounts of GST. This GST activity was inhibited when tissue extracts from
nodularin-treated A. salina were added to the assay. The partially purified GSTs catalysed
the formation of nodularin–GSH efficiently. Feeding a culture of algae that contained
nodularin to Australian black tiger prawns resulted in a change in the classes and
distribution of GST enzymes (Pflugmacher et al., 2005)
Few studies have reported the occurrence of nodularin–GSH adducts in tissue from
animals exposed to nodularin. Sipiä et al. (2002) showed by mass spectrometry the
presence of adduct in mussels. This is the only report that identified nodularin–GSH in
animals exposed to nodularin. [Although no quantitation was given, by comparison of
peaks in the measurements of the soft tissue of mussels, it is possible to estimate that they
represent 20–30% of the native nodularin.] Other, unidentified nodularin-like compounds
have been found (Lehtonen et al., 2003) in clams (Macoma baltica).
[On balance, the metabolism of microcystin and nodularin is probably, at least
partially, catalysed by hepatic GSTs. Because of the varied specificities and activities of
GSTs between species and between individuals, the consistency in the response to
microcystin and nodularin is remarkable, and similar toxicities are found across species as
diverse as fish, pigs and mice.]
(c) Excretion
There is some evidence of biliary excretion of microcystin and its metabolites (Sahin
et al., 1996). In trout orally dosed with M. aeruginosa bloom containing microcystin-LR
(equivalent to 4.6 mg microcystin-LR), free microcystin or its metabolites that retained
the ability to inhibit PP1 were found in the bile by the PP inhibition assay. Cumulative
excretion was not reported, but maximal inhibition was exerted by two samples 3 h after
gavage, the concentration that inhibited PP was equivalent to 3.5 mg/mL of bile; another
sample contained 475 ng/mL 48 h after gavage. Enterohepatic circulation could lead to
the cycling of microcystin and its metabolites between the bile, intestine and liver.

388 IARC MONOGRAPHS VOLUME 94
It is not clear what role biliary excretion would play in acute microcystin intoxication.
Studies in perfused rat liver (Pace et al., 1991; Runnegar et al.,1995a) showed that bile
formation decreased shortly after exposure of the liver to a toxic dose of microcystin. Bile
flow was reduced by 50% within 15 min of perfusion; the amount of bile produced
between 45 and 60 min was less than 5% of that in control livers treated in exactly the
same way and, by 60 min, it had stopped completely (Runnegar et al., 1995a). Pace et al.
(1991) calculated that, after 60 min of perfusion, 1.7% of [3H]microcystin-LR was found
in the bile while liver-associated radiolabel was 16.8% of the total. The cessation of bile
flow paralleled liver damage. With non-toxic doses of microcystin, excretion through the
bile may play a significant role.
No radioactivity was detected in the urine of pigs that had been dosed intravenously
or into the ileal loop with [3H]dihydromicrocystin-LR and killed 4–5 h after injection
(Stotts et al., 1997b).
Mice treated intravenously with 35 µg/kg bw [3H]microcystin-LR had excreted 9.2%
of the dose within 6 days; most of the 9.2% was excreted within 24 h of treatment (only
6% at 6 h) (Robinson et al., 1991). In the same study, radioactivity in the faeces of mice
was maximal 6 h after injection and cumulative faecal excretion after 6 days was 14.5%
of the dose. The parent toxin constituted about 60% of the 23.7% of the dose excreted in
faeces and urine. A number of other more hydrophilic peaks constituted the remaining
35–40%.
From the above results, it can be concluded that microcystins are primarily excreted
in the faeces as the parent compound or as yet unidentified hydrophilic metabolites.
Orr et al. (2001) gave drinking-water containing Microcystis cultures to four lactating
Holstein-Friesian dairy cattle. The cattle consumed a total of 15 mg (1.21 µg/kg bw per
day) microcystin over a period of 21 or 28 days. The milk produced was analysed by
ELISA and HPLC and no microcystin was detected (detection limit, 2 ng/L of milk).
No data were available on the excretion of nodularin. The presence or absence of
nodularin or its metabolites has not been determined in faeces or urine after dosing.
4.2 Genetic and related effects
4.2.1 Genotoxicity (see Table 4.4 for details and references)
The genotoxic properties of microcystin-LR have been studied extensively in a
variety of test systems and the results have been contradictory.
Microcystin-LR was not mutagenic in Salmonella typhimurium or in Bacillus subtilis
in the multigene sporulation test in the presence or absence of exogenous metabolic
activation.
No cell transformation was observed in microcystin-LR-exposed Syrian hamster
embryo cells and no chromosomal aberrations were observed in Chinese hamster ovary
K1 cells exposed to microcystin-LR, although an increased frequency of polyploid cells
was reported, which suggests that it is aneugenic.

C
YA
NO
BA
CT
ER
IAL
PE
PT
IDE
TO
XIN
S
38
9
Table 4.4. Genetic and related effects of microcystins and nodularins
Resulta Test system
Without exogenous metabolic system
With exogenous metabolic system
Doseb
(LED/HID)
Reference
Microcystin-LR
Salmonella typhimurium TA98, TA100, reverse mutation – NT 10000 Grabow et al. (1982)
Salmonella typhimurium TA98, TA100,TA102, reverse mutation – – 900 Repavich et al. (1990) Bacillus subtilis, multigene sporulation test – – 900 Repavich et al. (1990)
Chromosomal aberrations, Chinese hamster ovary-K1 cells in vitro – – 100 Lankoff et al. (2003) Cell transformation, Syrian hamster embryo cells in vitro – NT 10 Wang et al. (1998)
Polyploidy, Chinese hamster ovary-K1 cells in vitro + + 25 Lankoff et al. (2003) Comet assay, human lymphocytes in vitro +c NT 1 Lankoff et al. (2004)
Chromosomal aberrations, human lymphocytes in vitro – NT 25 Lankoff et al. (2004) Chromosomal aberrations, human lymphocytes in vitro – NT 0.5 Lankoff et al. (2006a)
Nodularin
Micronucleus assay, human hepatoma HepG2 cells in vitro + – 2.5 Lankoff et al. (2006b)
a +, positive; –, negative; NT, not tested b LED, lowest effective dose; HID, highest ineffective dose; in-vitro tests, µg/mL c Complementary results revealed negative clastogenic properties

390 IARC MONOGRAPHS VOLUME 94
Microcystin-LR gave positive results in the comet assay in human cells, which suggests
that it may be genotoxic. However, complementary experiments with a modified comet
assay in human hepatoma HepG2 cells revealed an accumulation of unrepaired DNA
strand breaks which indicates that DNA fragmentation reflected the intermediates of the
cellular repair of oxidized purines and pyrimidines resulting from the action of reactive
oxygen species. This suggests that microcystin-LR might induce formation of reactive
oxygen species that cause DNA damage rather than have a direct clastogenic effect
(Zegura et al., 2003, 2004). [Due to inappropriate experimental design and statistical
evaluation of the data, and because HepG2 cells do not, or very weakly, express the
transporters necessary for microcystin uptake (Le Vee et al., 2006), the Working Group
raised serious doubt about the validity of the findings reported by Zegura et al. (2003,
2004).] However, a comparison of the positive results from the comet assay, the negative
results from the chromosomal aberration assay and the positive results for apoptosis in
human lymphocytes (Fladmark et al., 1999) showed that the microcystin-LR-induced
DNA damage observed in the comet assay might be related to apoptosis due to
cytotoxicity rather than to genotoxicity (Lankoff et al., 2004, 2006a).
[The Working Group raised doubts about the validity of positive results for the
genotoxicity of microcystin-LR (Suzuki et al., 1998; Ding et al., 1999; Mankiewicz et al.,
2002; Maatouk et al., 2004; Zhan et al., 2004; Bouaïcha et al., 2005) due to inappropriate
experimental design, statistical evaluation and interpretation of the data.]
The aneugenic effect of nodularin was tested in a single study that reported a dose-
dependent induction of centromere-positive micronuclei in HepG2 cells.
In conclusion, no evidence was provided for the mutagenic or clastogenic properties
of microcystins or nodularins in non-mammalian or mammalian test systems. However,
an increased frequency of polyploid cells as well as centromere-positive micronuclei were
observed, which possibly suggests that both microcystins and nodularin are aneugenic.
4.3 Mechanisms associated with the tumour promotion of microcystin-LR
and nodularin
4.3.1 Relationship between structure and inhibition of protein phosphatases (PP)
Although the structures of microcystin-LR and nodularin are not related to that of
okadaic acid (Fujiki & Suganuma, 1993), Uemura and Hirata (1989) proposed that the
okadaic acid molecule also has a cyclic structure with the formation of a hydrogen bond
between the carbonyl group at C1 and the hydroxyl group at C24, which may provide
evidence that microcystin-LR and nodularin act similarly to okadaic acid as inhibitors of
PP1 and PP2A (Yoshizawa et al., 1990; see also MacKintosh et al., 1990; Honkanen et
al., 1991). Microcystin-LR and nodularin inhibited PP activity in a cytosolic fraction of
mouse liver in vitro, with an IC50 (concentration that leads to 50% inhibition) of 1.6 nM
for microcystin-LR and 0.7 nM for nodularin. In addition, both inhibited specific
[3H]okadaic acid binding to PP1 and PP2A in the cytosolic fraction of mouse liver, with

CYANOBACTERIAL PEPTIDE TOXINS 391
an IC50 of 1.3 nM for microcystin-LR and 2.3 nM for nodularin, and in the particulate
fraction of mouse liver, with an IC50 of 11.0 nM for microcystin-LR and 8.0 nM for
nodularin (Yoshizawa et al., 1990). Microcystin-LR and nodularin both show a planarity
of peptide rings and similar relative spatial alignments of the ADDA and arginine side
chains (Taylor et al., 1992). Furthermore, Quinn et al. (1993) used molecular modeling
and identified common regions of microcystin-LR, okadaic acid and calyculin A.
Moreover, the crystal structure of mammalian PP1 complexed with microcystin was
determined by X-ray crystallography (Goldberg et al., 1995; Maynes et al., 2006).
Microcystin was reported to bind to a PP1 catalytic subunit through the interaction with
three distinct regions: the metal-binding site, the hydrophobic groove and the edge of the
C-terminal groove near the active site. In contrast to microcystin-LR, Bagu et al. (1997)
reported that nodularin does not bind covalently to PP1 or PP2A, and that microcystin-LR
and motuporin (nodularin-V) are strikingly similar to okadaic acid and calyculin A.
Maynes et al. (2006) recently elucidated that the crystal structures of dihydromicrocystin-
LR or motuporin (nodularin-V) binds to human PP1c (γ isoform). Comparisons of the
structures of the toxin:PP1 complexes explain why microcystins but not nodularins
permanently modify PP by covalent binding to an active cysteine residue.
4.3.2 Enzymatic inhibition of PP1 and PP2A
Microcystin-LR strongly inhibited PP1 and PP2A with inhibition constant values
below 0.1 nM, but inhibited PP2B 1000 times less potently (MacKintosh et al., 1990);
microcystin-LR inhibits both PP1 and PP2A with similar potency, whereas nodularin and
okadaic acid inhibit PP2A much more strongly than PP1 (Table 4.5; Honkanen et al.,
1991; Suganuma et al., 1992). Seven inhibitors of PP1, including microcystin-LL, -LV, -
LM, -LF and -LZ (Z represents an unknown hydrophobic amino acid), were purified from
blooms of Microcystis aeruginosa and inhibited PP1 with inhibitory concentration 50%
(IC50) values of 0.06–0.4 nM (Craig et al., 1993). However, the structure and functional
relationships between 6(E)-ADDA microcystin-LR and -RR and 6(Z)-ADDA microcystin-
LR and -RR were significantly different: the IC50 values of 6(E)-ADDA microcystin-LR
and -RR for PP2A activity were 0.28 and 0.78 nM, respectively, whereas those of 6(Z)-
ADDA microcystin-LR and -RR were 80 nM in both cases, indicating that 6(Z)-ADDA
microcystins inhibited PP2A about 100 times more weakly than the parent microcystin-
LR and -RR compounds (Nishiwaki-Matsushima et al., 1991). Runnegar et al. (1995c)
raised antibodies specific for PP1 and PP2A and found that, in hepatocytes, microcystin
forms secondary covalent bonds with the C-terminal of PP1 and PP2A catalytic subunits.
This covalent binding of microcystin to PP1 and PP2A catalytic subunits was confirmed
by Bagu et al. (1997). Microcystin-LR has been shown to inhibit nuclear protein
phosphatases (Guzman et al., 2003) and to be present in the nuclei (Guzman & Solter,
2002) of mouse hepatocytes following in-vivo administration.

392 IARC MONOGRAPHS VOLUME 94
Table 4.5. Inhibition of the protein phosphatases (PP) 1 and 2A compared with that of protein tyrosine phosphatase (PTP)
Agent PP1 (IC50 nM)
PP2A (IC50 nM)
PTP (IC50 nM)
Reference
Microcystin-LR 0.1 0.10 >10 000 Suganuma et al. (1992)
Nodularin 1.8 0.027 NR Honkanen et al. (1991)
Okadaic acid 3.4 0.07 >10 000 Suganuma et al. (1992)
NR, not reported; IC50, concentrations that lead to 50% inhibition
4.3.3 Cellular effects
The biochemical consequence of the inhibition of PP1 and PP2A by microcystin-LR
and nodularin is the accumulation of hyperphosphorylation of intracellular proteins in
hepatocytes (Eriksson et al., 1990b; Falconer & Yeung, 1992; Fujiki, 1992). These
alterations in phosphorylation have been shown to result in major morphological changes
in isolated human and rodent hepatocytes exposed to low (nM) concentrations of
microcystins. The major consequence observed is the disaggregation of intermediate
filaments composed of cytokeratins 8 and 18, which leads to the collapse of the
cytoskeleton of the hepatocytes. This disaggregation secondarily results in detachment of
the actin microfilament structure and contraction of the fibres. The characteristic blebbing
of exposed hepatocytes is the result of this microfilament contraction in cells (Runnegar et
al., 1981; Falconer & Runnegar, 1987; Eriksson et al., 1989; Yoshizawa et al., 1990;
Falconer & Yeung, 1992; Ohta et al., 1994; Toivola et al., 1997; Batista et al., 2003).
At concentrations up to 9.6 µM, microcystin-YR did not induce any effects in human
fibroblasts; it only induced morphological changes similar to those induced by okadaic
acid following microinjection of concentrations of 670 µM (Matsushima et al., 1990).
This suggests that microcystin and nodularin do not easily penetrate into fibroblasts, and
supports the finding that microcystin requires active uptake through OATPs (see Section
4.1). Similarly, the uptake of [3H]dihydromicrocystin-LR was shown to be specific for
freshly isolated rat hepatocytes, since its uptake in the human hepatocarcinoma HepG2
cell line, the human neuroblastoma SH-SY5Y cell line and the mouse fibroblast NIH/3T3
cell line was negligible (Eriksson et al., 1990a).
4.3.4 Apoptosis
A number of studies have demonstrated that microcystins and nodularins cause
apoptosis in cell cultures. At picomolar concentrations, microcystin-LR stimulated
cytokinesis in primary mouse hepatocytes and reduced the rate of apoptosis, whereas

CYANOBACTERIAL PEPTIDE TOXINS 393
higher concentrations (nanomolar) inhibited cytokinesis and induced cell death (Humpage
& Falconer, 1999).
Fladmark et al. (1999) reported that both microcystin-LR and nodularin induced
caspase-3-dependent apoptosis in an ultra rapid manner in toxin-microinjected Swiss
mice 3T3 fibroblasts, rat promyelotic (IPC-81) cells, normal rat kidney cells and human
embryo kidney HEK 293 cells. It was also proposed that apoptosis induced by
microcystins and nodularins correlates with PP inhibition and requires Ca2+/calmodulin-
dependent protein kinase II (Fladmark et al., 2002).
The induction of apoptosis was also shown in vitro in microcystin-LR-treated rat
hepatocytes and human lymphocytes (Mankiewicz et al., 2001), Chinese hamster ovary
K1 cells (Lankoff et al., 2003) and colon carcinoma CaCo2 cells (Botha et al., 2004) as
well as in nodularin-treated primary rat hepatocytes (Herfindal et al., 2005).
4.3.5 Gene expression
Sueoka et al. (1997) demonstrated that microcystin-LR and nodularin modulate the
expression of oncogenes and tumour-suppressor genes and revealed a strong induction of
tumour necrosis factor-α, and c-jun, jun B, jun D, c-fos, fos B and fra-1 gene expression in
primary cultured rat hepatocytes in vitro.
A two-stage carcinogenesis experiment that used initiation with NDEA and
promotion with nodularin in Fischer 344 rats increased the incidence of liver
preneoplastic foci. Increased transforming growth factor-β1 protein expression was seen
to co-localize with GST-P expression in the preneoplastic foci (Lim et al., 1999).
In summary, a number of studies have reported the involvement of microcystin-LR in
epigenetic processes. These include stimulation of gene expression, cell
survival/apoptosis and cell division. There is also evidence of the inhibitory effects of
microcystin-LR on DNA repair (Lankoff et al., 2004, 2006a). It was also found that
cytokinesis was stimulated and the rate of cell division was increased by picomolar
concentrations of microcystin-LR in primary mouse hepatocytes whereas nanomolar
concentrations inhibited cytokinesis and induced apoptosis (Humpage & Falconer, 1999).
These findings were supported by a combined transcriptomic and proteomic analysis with
gene expression profiling in the liver of mice treated with microcystin-LR which
demonstrated a modification of 61 of 96 apoptosis-related genes. At low concentrations,
microcystin-LR increased the expression of the anti-apoptotic Bcl-2 gene more that 4000-
fold. At high concentrations of microcystin-LR, expression of the Bcl-2 gene dropped
markedly (Chen et al., 2005).
394 IARC MONOGRAPHS VOLUME 94
4.4 Other relevant toxic effects
4.4.1 Humans
(a) Acute toxicity
The most relevant example of acute toxicity from cyanobacterial toxins was provided
by exposure through renal dialysis. In Caruaru, Brazil, following renal dialysis during a
single week in 1996, 116 of 131 dialysed patients developed disturbance of vision,
vomiting, nausea, headache, muscle weakness and epigastric pain. Of these,
100 developed liver failure and 76 died. The deaths of 52 patients could be attributed
directly to liver failure. Serum enzyme analysis showed an eightfold increase in aspartate
transaminase (AST) and a fourfold increase in total bilirubin in patients with clinical
symptoms (Jochimsen et al., 1998; Pouria et al., 1998; Carmichael et al., 2001).
Examination of the cation filters in the dialysis unit showed the presence of microcystins-
YR, -LR and -AR. The carbon filters also contained cylindrospermopsin; this compound
is an alkaloid toxin from freshwater cyanobacteria, which is also responsible for human
poisoning that results predominantly in liver damage, but through a different mechanism
(Hawkins et al., 1985). Microcystins were present in the blood of patients at an average
level of 2.2 ng/mL and in the liver at an average level of 223 ng/g. It was calculated that
19.5 µg/L microcystins were present in the dialysis water, and that the patients were
probably exposed to 120–150 L (Carmichael et al., 2001).
Another report of human injury related to acute exposure to M. aeruginosa was
among army recruits who carried out canoeing exercises in a lake that carried a heavy
water-bloom of this cyanobacterium (Turner et al., 1990). The exercises involved
swimming with a pack and also going underwater and coming back up while canoeing,
both of which probably resulted in the inhalation and oral ingestion of water. Ten of the
recruits reported symptoms of abdominal pain, nausea, vomiting, diarrhoea, sore throat,
dry cough, blistering of the lips and mouth and headache. Two were hospitalized with
pneumonia that was considered to be due to aspiration of bloom material. Serum enzymes
indicative of liver damage, alanine transaminase (ALT) and aspartate transaminase
(AST), were elevated in the most severe of the two cases investigated. Microcystin-LR
was identified in the cyanobacterial bloom material from the lake (Turner et al., 1990).
No data on nodularin were available to the Working Group.
(b) Subacute toxicity
Among the causes of human illness that have been associated with cyanotoxins in
drinking-water sources, the following three show plausibility.
In Harare, Zimbabwe, a paediatrician noted that children whose homes were supplied
with water from one reservoir developed seasonal acute gastroenteritis in the autumn,
whereas children whose drinking-water came from other municipal reservoirs were
unaffected. The reservoir that was the source of the water for the affected children had
developed a summer water-bloom of Microcystis, which broke down in the early winter

CYANOBACTERIAL PEPTIDE TOXINS 395
at the time of the gastroenteritis. The paediatrician concluded that the lysed cyanobacteria
in the water supply could be responsible for the illness (Zilberg, 1966).
A larger and more severe outbreak of gastroenteritis in children occurred in Brazil
after a new hydroelectric dam was filled and was the source of drinking-water for several
towns, including Paulo Alfonso that had a population of about 200 000 (Teixeira et al.,
1993). Overall, approximately 2000 cases were recorded at the hospital, and 88 deaths
resulted. Very high concentrations of cyanobacterial cells were detected in the water at the
intakes of the drinking-water treatment plant, including Microcystis. The authors
considered cyanobacterial toxins to be the probable cause of the outbreak, especially as
patients who used only boiled water were among those affected.
A less damaging but more closely investigated occurrence of human injury from
microcystins was reported in Australia in 1983 (Falconer et al., 1983). The laboratory in
Armidale, New South Wales, that monitored reservoirs of drinking-water supplies for
cyanobacterial blooms and regional cases of cyanobacterial poisoning of livestock
observed a water-bloom of highly toxic M. aeruginosa growing in the city drinking-water
reservoir. The water offtake for the treatment plant was located in a narrow bay that
accumulated wind-drift of cyanobacterial scums. The drinking-water at Armidale was the
subject of complaints of off-flavours and odours caused by Microcystis, to which the
operating authority responded by applying copper sulfate to the reservoir by air. This
caused rapid lysis of the cyanobacteria, and resulted in the liberation of free toxin into the
water. A retrospective cohort study of serum indicators of liver damage was carried out.
The data on liver enzymes from the regional pathology laboratory over a period of
18 weeks were sorted into analyses of samples taken during the 6 weeks of bloom
development and termination by treatment with copper sulfate, the 6 weeks before that
time and the 6 weeks after. Significantly increased levels of serum γ-glutamyl transferase
were observed in the samples collected from the population who had drunk water from
the affected reservoir only in the period when Microcystis was present and lysed. No
increase was observed in the cohort population or during the periods before and after the
water-bloom in either population. A smaller increase which was not statistically
significant was seen in ALT, but no increase was seen in AST or alkaline phosphatase.
While the average increase in γ-glutamyl transferase activity was approximately twofold,
some samples showed a considerably larger increase. Serum enzyme activities had
returned to normal by 6 weeks after the bloom. This evidence of liver damage was
attributed to microcystins in the drinking-water supply. Unfortunately, analytical
techniques that were sensitive enough to measure microcystins in drinking-water had not
been developed at that time, so no actual exposure data were available to allow a dose–
response determination.
(c) Immunotoxicity
No data were available to the Working Group.

396 IARC MONOGRAPHS VOLUME 94
4.4.2 Experimental systems and natural exposure
(a) Acute and subacute toxicity
Most of the structural variants of microcystins and nodularin are highly toxic in mice
within a comparatively narrow dose range: LD50 following intraperitoneal injection were
largely in the range of 50–300 µg/kg bw (Sivonen & Jones, 1999). Only a few non-toxic
variants have been identified. In general, any structural modifications to the ADDA-
glutamate region of the toxin molecule, such as a change in isomerization of the ADDA-
diene (6(E) to 6(Z)) or acylation of the glutamate, renders microcystins and nodularin
non-toxic. Linear microcystins and nodularin are more than 100 times less toxic than the
equivalent cyclic compounds. Linear microcystins are thought to be microcystin
precursors and/or bacterial breakdown products (Sivonen & Jones, 1999).
Microcystins and nodularin are primarily hepatotoxins. After acute or subacute
exposure by intravenous or intraperitoneal injection of microcystins in mice or pigs,
severe liver damage is characterized by a disruption of liver cell structure (due to damage
to the cytoskeleton), a loss of sinusoidal structure, increases in liver weight due to
intrahepatic haemorrhage, haemodynamic shock, heart failure and death. Other organs
affected are the kidneys, lungs and intestines (for an extensive review of microcystin
toxicity, see Sivonen & Jones, 1999).
(b) Chronic toxicity
Swiss albino mice were exposed to microcystin in the drinking-water for 1 year or
longer in two studies (Falconer et al., 1988; Ueno et al., 1999). In one study, female
BALB/c mice were exposed continuously to 20 µg/L microcystin-LR in the drinking-
water for 18 months (mean cumulative toxin intake estimated at 35 µg/mouse for
18 months). No adverse effects of treatment were recorded, including no clinical changes,
no observed liver histopathology or dysfunction and no liver tumours (Ueno et al., 1999).
In the other study, an extract of M. aeruginosa was administered in the drinking-water
at six dose levels to male and female Swiss albino mice. Animals were killed at intervals
up to 1 year. The highest dose administered was 56.6 µg/mL (approximately equivalent to
10 mg/kg bw per day), lower doses were 1/2, 1/4, 1/8 and 1/16 dilutions of this dose.
Only the highest dose resulted in a reduced growth rate in both sexes of mice. Male mice
were more adversely affected than females; at the 1/2 dilution, livers were significantly
heavier in males, with elevated ALT levels, whereas female livers were heavier and
serum contained significantly increased ALT only with the undiluted extract. Mortality
clearly increased with dose throughout the range. Histopathological examination of the
livers showed chronic active liver injury with hepatocyte necrosis, leukocyte infiltration
and fibrosis in livers from mice receiving undiluted and 1/2 diluted extract. At lower
concentrations of toxin, increased hepatic infiltration with neutrophils was seen.
Histopathological examination of other tissues showed a significantly increased incidence
of bronchopneumonia with age and dose, and a small number of cases of kidney damage
at 1/4 and 1/8 dilutions from 31 weeks onwards (Falconer et al., 1988).

CYANOBACTERIAL PEPTIDE TOXINS 397
In rats, daily intakes of lower doses of approximately 50 and 150 µg/kg bw pure
microcystin-LR administered in the drinking-water for 28 days also led to increased liver
weight, altered enzyme activities and histological injury to the liver (Heinze, 1999).
Intraperitoneal injections of microcystin-LR and -YR at a concentration of 10 µg/kg
bw every other day for 8 months increased the numbers of TUNEL-positive cells in the
cortex and medula of the kidney in rats (Milutinović et al., 2003).
It is apparent that microcystin-LR is predominantly hepatotoxic, whether
administered acutely, subchronically or chronically, in all species investigated. However,
toxic events due to consumption of or exposure to M. aeruginosa have been recorded in
human and large animal populations with a wider range of clinical symptoms than hepatic
injury alone, some of which are probably secondary to liver damage. It is also possible
that poisoning by naturally occurring cyanobacterial water blooms leads to exposure to a
range of toxic compounds, including several other microcystins and other cyanobacterial
toxins with different toxic potentials.
No studies on the chronic toxicity of nodularin were available to the Working Group.
(c) Immunotoxicity
Only limited effects of microcystin or nodularin on the immune system of whole
animals have been recorded. In rats administered microcystin-LR orally for 28 days, the
number of leukocytes and lymphocytes in blood increased significantly (Heinze, 1999).
In a study of mice exposed to extracts of M. aeruginosa in the drinking-water for up
to 1 year, the increased mortality could largely be attributed to pneumonia, not to liver
dysfunction, which may reflect impaired immune function (Falconer et al., 1988).
In a more recent study, mice were injected intraperitoneally with a M. aeruginosa
extract for 14 days and changes in the immune system were observed (Shen et al., 2003).
At the highest dose (20 µg microcystin equivalents/kg bw), both spleen and thymus
weights were decreased. Inhibition of lipopolysaccharide-induced B lymphocyte
proliferation and a dose-dependent decrease in antibody-forming cells in mice that were
immunized by sheep red blood cells were seen. [It should be noted that intraperitoneal
injection of extracts may cause responses to other compounds, e.g. lipopolysaccharide
endotoxins.] The proliferation of T cells following concanavalin A stimulation was not
affected by treatment.
Nodularin administered intraperitoneally to mice decreased humoral immune
responses to sheep red blood cells; the effect was heightened in animals given rifampicin
to inhibit nodularin uptake into the liver (Yea et al., 2001).
Similar results were reported in an in-vitro study of mouse splenocytes, which
demonstrated inhibition of lipopolysaccharide-stimulated lymphoproliferation in response
to exposure to microcystin-LR and -YR and nodularin at concentrations of 10–50 µM.
Concanavalin A-stimulated lymphoproliferation was suppressed by microcystin-YR and
nodularin but not by microcystin-LR (Yea et al., 2001). [These concentrations of toxin in
an in-vitro incubation are probably 103–104 times higher than those that occur in the blood
during acute toxicity in vivo.]

398 IARC MONOGRAPHS VOLUME 94
A range of other in-vitro assessments of microcystin activity on immune cells have
been undertaken, largely with the aim of clarifying the mechanism of toxicity.
Macrophages incubated with microcystin-LR at approximately 100 nM (~0.1 µg/Ml)
have been shown to respond by synthesis of tumour necrosis factor-α and interleukin-1β.
These factors resulted in stimulation of intestinal secretory activity in vitro of rabbit ileum
by supernatants from the incubation (Rocha et al., 2000).
Substrate adherence by polymorphonuclear leukocytes is an essential first step in the
response to inflammation and phagocytosis of bacterial pathogens. Very low
concentrations of microcystin-LR and nodularin (0.01–1.0 nM; ~0.01–1ng/mL) in vitro
enhanced the early spontaneous adherence of polymorphonuclear leukocytes, but had no
effect on late adherence or adherence of cells already stimulated by the peptide formyl-
methionyl-leucyl-phenylalanine (Hernandez et al., 2000).
These limited results on immunomodulation by microcystin indicate that lower doses
or concentrations may enhance immune response in some systems, but that higher doses
are probably toxic, particularly to B lymphocytes.
4.5 References
Azevedo SMFO, Carmichael WWW, Jochimsen EM et al. (2002). Human intoxication by
microcystins during renal dialysis treatment in Caruaru-Brazil. Toxicology, 181-182:441–446.
doi:10.1016/S0300-483X(02)00491-2. PMID:12505349
Bagu JR, Sönnichsen FD, Williams D et al. (1995). Comparison of the solution structures of
microcystin-LR and motuporin. Nat Struct Biol, 2:114–116. doi:10.1038/nsb0295-114.
PMID:7749913
Bagu JR, Sykes BD, Craig MM, Holmes CF (1997). A molecular basis for different interactions of
marine toxins with protein phosphatase-1. Molecular models for bound motuporin, microcystins,
okadaic acid, and calyculin A. J Biol Chem, 272:5087–5097. doi:10.1074/jbc.272.8.5087.
PMID:9030574
Batista T, de Sousa G, Suput JS et al. (2003). Microcystin-LR causes the collapse of actin filaments
in primary human hepatocytes. Aquat Toxicol, 65:85–91. doi:10.1016/S0166-445X(03)00108-
5. PMID:12932703
Beattie KA, Ressler J, Wiegand C et al. (2003). Comparative effects and metabolism of two
microcystins and nodularin in the brine shrimp Artemia salina. Aquat Toxicol, 62:219–226.
doi:10.1016/S0166-445X(02)00091-7. PMID:12560170
Botes DP, Tuinman AA, Wessels PL et al. (1984). The structure of cyanoginosin-LA, a cyclic
heptapeptide toxin from the Microcystis aeruginosa. J chem Soc Perkin Trans, 1:2311–2318.
doi:10.1039/p19840002311
Botha N, Gehringer MM, Downing TG et al. (2004). The role of microcystin-LR in the
induction of apoptosis and oxidative stress in CaCo2 cells. Toxicon, 43:85–92.
doi:10.1016/j.toxicon.2003.10.025. PMID:15037033
Bouaïcha N, Maatouk I, Plessis MJ, Périn F (2005). Genotoxic potential of microcystin-LR and
nodularin in vitro in primary cultured rat hepatocytes and in vivo in rat liver. Environ Toxicol,
20:341–347. doi:10.1002/tox.20110. PMID:15892058

CYANOBACTERIAL PEPTIDE TOXINS 399
Brooks WP, Codd GA (1987). Distribution of Microcystis aeruginosa peptide toxin and
interactions with hepatic microsomes in mice. Pharmacol Toxicol, 60:187–191.
doi:10.1111/j.1600-0773.1987.tb01731.x. PMID:3108872
Bury NR, Newlands AD, Eddy FB, Codd GA (1998). In vivo and in vitro intestinal transport of
3H-microcystin-LR in rainbow trout (Oncorhyncus mykiss). Aquat Toxicol, 42:139–148.
Carmichael WW, Eschedor JT, Patterson GM, Moore RE (1988). Toxicity and partial structure of a
hepatotoxic peptide produced by the cyanobacterium Nodularia spumigena Mertens emend.
L575 from New Zealand. Appl Environ Microbiol, 54:2257–2263. PMID:3142356
Carmichael WW, Azevedo SM, An JS et al. (2001). Human fatalities from cyanobacteria: chemical
and biological evidence for cyanotoxins. Environ Health Perspect, 109:663–668.
doi:10.2307/3454781. PMID:11485863
Chen T, Wang Q, Cui J et al. (2005). Induction of apoptosis in mouse liver by microcystin-LR: a
combined transcriptomic, proteomic, and simulation strategy. Mol Cell Proteomics, 4:958–
974. doi:10.1074/mcp.M400185-MCP200. PMID:15863401
Craig M, McCready TL, Luu HA et al. (1993). Identification and characterization of hydrophobic
microcystins in Canadian freshwater cyanobacteria. Toxicon, 31:1541–1549.
doi:10.1016/0041-0101(93)90338-J. PMID:8146867
Craig M, Luu HA, McCready TL et al. (1996). Molecular mechanisms underlying the interaction
of motuporin and microcystins with type-1 and type-2A protein phosphatases. Biochem Cell
Biol, 74:569–578.
Dietrich D, Hoeger S (2005). Guidance values for microcystins in water and cyanobacterial
supplement products (blue-green algal supplements): a reasonable or misguided approach?
Toxicol Appl Pharmacol, 203:273–289. doi:10.1016/j.taap.2004.09.005. PMID:15737681
Ding WX, Shen HM, Zhu HG et al. (1999). Genotoxicity of microcystic cyanobacteria extract of a
water source in China. Mutat Res, 442:69–77. PMID:10393275
Eriksson JE, Meriluoto JA, Kujari HP et al. (1988). Preliminary characterization of a toxin isolated
from the cyanobacterium Nodularia spumigena. Toxicon, 26:161–166. doi:10.1016/0041-
0101(88)90168-7. PMID:3129825
Eriksson JE, Paatero GI, Meriluoto JA et al. (1989). Rapid microfilament reorganization induced in
isolated rat hepatocytes by microcystin-LR, a cyclic peptide toxin. Exp Cell Res, 185:86–100.
doi:10.1016/0014-4827(89)90039-6. PMID:2806414
Eriksson JE, Grönberg L, Nygård S et al. (1990a). Hepatocellular uptake of 3H-
dihydromicrocystin-LR, a cyclic peptide toxin. Biochim Biophys Acta, 1025:60–66.
doi:10.1016/0005-2736(90)90190-Y. PMID:2369577
Eriksson JE, Toivola D, Meriluoto JAO et al. (1990b). Hepatocyte deformation induced by
cyanobacterial toxins reflects inhibition of protein phosphatases. Biochem Biophys Res
Commun, 173:1347–1353. doi:10.1016/S0006-291X(05)80936-2. PMID:2176489
Falconer IR, Beresford AM, Runnegar MT (1983). Evidence of liver damage by toxin from a
bloom of the blue-green alga, Microcystis aeruginosa. Med J Aust, 1:511–514. PMID:6405136
Falconer IR, Humpage AR (2005). Health risk assessment of cyanobacterial (blue-green algal) toxins
in drinking water. Int J Environ Res Public Health, 2:43–50. doi:10.3390/ijerph2005010043.
PMID:16705800
Falconer IR, Runnegar MT (1987). Effects of the peptide toxin from Microcystis aeruginosa on
intracellular calcium, pH and membrane integrity in mammalian cells. Chem-Biol Interact,
63:215–225. doi:10.1016/0009-2797(87)90042-1. PMID:3119237

400 IARC MONOGRAPHS VOLUME 94
Falconer IR, Yeung DS (1992). Cytoskeletal changes in hepatocytes induced by Microcystis toxins
and their relation to hyperphosphorylation of cell proteins. Chem-Biol Interact, 81:181–196.
doi:10.1016/0009-2797(92)90033-H. PMID:1370395
Falconer IR, Buckley T, Runnegar MTC (1986). Biological half-life, organ distribution and
excretion of 125-I-labelled toxic peptide from the blue-green alga Microcystis aeruginosa. Aust
J Biol Sci, 39:17–21. PMID:3096266
Falconer IR, Smith JV, Jackson ARB et al. (1988). Oral toxicity of a bloom of the cyanobacterium
Microcystis aeruginosa administered to mice over periods up to 1 year. J Toxicol Environ
Health, 24:291–305. doi:10.1080/15287398809531163. PMID:3135416
Fischer WJ, Altheimer S, Cattori V et al. (2005). Organic anion transporting polypeptides
expressed in liver and brain mediate uptake of microcystin. Toxicol Appl Pharmacol, 203:257–
263. doi:10.1016/j.taap.2004.08.012. PMID:15737679
Fischer WJ, Hitzfeld BC, Tencalla F et al. (2000). Microcystin-LR toxicodynamics, induced
pathology, and immunohistochemical localization in livers of blue-green algae exposed
rainbow trout (oncorhynchus mykiss). Toxicol Sci, 54:365–373. doi:10.1093/toxsci/54.2.365.
PMID:10774818
Fladmark KE, Brustugun OT, Hovland R et al. (1999). Ultrarapid caspase-3 dependent apoptosis
induction by serine/threonine phosphatase inhibitors. Cell Death Differ, 6:1099–1108.
doi:10.1038/sj.cdd.4400590. PMID:10578179
Fladmark KE, Brustugun OT, Mellgren G et al. (2002). Ca2+/calmodulin-dependent protein
kinase II is required for microcystin-induced apoptosis. J Biol Chem, 277:2804–2811.
doi:10.1074/jbc.M109049200. PMID:11713251
Fujiki H (1992). Is the inhibition of protein phosphatase 1 and 2A activities a general mechanism of
tumor promotion in human cancer development? Mol Carcinog, 5:91–94.
doi:10.1002/mc.2940050202. PMID:1313239
Fujiki H, Suganuma M (1993). Tumor promotion by inhibitors of protein phosphatases 1 and 2A:
the okadaic acid class of compounds. Adv Cancer Res, 61:143–194. doi:10.1016/S0065-
230X(08)60958-6. PMID:8394044
Galey FD, Beasley VR, Carmichael WW et al. (1987). Blue-green algae (Microcystis aeruginosa)
hepatotoxicosis in dairy cows. Am J Vet Res, 48:1415–1420. PMID:3116892
Gehringer MM, Shephard EG, Downing TG et al. (2004). An investigation into the detoxification
of microcystin-LR by the glutathione pathway in Balb/c mice. Int J Biochem Cell Biol,
36:931–941. doi:10.1016/j.biocel.2003.10.012. PMID:15006645
Goldberg J, Huang HB, Kwon YG et al. (1995). Three-dimensional structure of the catalytic subunit
of protein serine/threonine phosphatase-1. Nature, 376:745–753. doi:10.1038/376745a0.
PMID:7651533
Grabow WO, Du Randt WC, Prozesky OW, Scott WE (1982). Microcystis aeruginosa toxin: cell
culture toxicity, hemolysis, and mutagenicity assays. Appl Environ Microbiol, 43:1425–1433.
PMID:6808921
Gupta N, Pant SC, Vijayaraghavan R, Rao PV (2003). Comparative toxicity evaluation of
cyanobacterial cyclic peptide toxin microcystin variants (LR, RR, YR) in mice. Toxicology,
188:285–296. doi:10.1016/S0300-483X(03)00112-4. PMID:12767698
Guzman RE, Solter PF (2002). Characterization of sublethal microcystin-LR exposure in mice. Vet
Pathol, 39:17–26. doi:10.1354/vp.39-1-17. PMID:12102214

CYANOBACTERIAL PEPTIDE TOXINS 401
Guzman RE, Solter PF, Runnegar MT (2003). Inhibition of nuclear protein phosphatase activity in
mouse hepatocytes by the cyanobacterial toxin microcystin-LR. Toxicon, 41:773–781.
doi:10.1016/S0041-0101(03)00030-8. PMID:12782077
Harding WR, Rowe N, Wessels JC et al. (1995). Death of a dog attributed to the cyanobacterial
(blue-green algal) hepatotoxin nodularin in South Africa. J S Afr Vet Assoc, 66:256–259.
PMID:8691419
Hawkins PR, Runnegar MT, Jackson AR, Falconer IR (1985). Severe hepatotoxicity caused by the
tropical cyanobacterium (blue-green alga) Cylindrospermopsis raciborskii (Woloszynska)
Seenaya and Subba Raju isolated from a domestic water supply reservoir. Appl Environ
Microbiol, 50:1292–1295. PMID:3937492
Heinze R (1999). Toxicology of the cyanobacterial toxin microcystin-LR to rats after 28 days
intake with the drinking water. Environ Toxicol, 14:57–60. doi:10.1002/(SICI)1522-
7278(199902)14:1<57::AID-TOX9>3.0.CO;2-J.
Herfindal L, Oftedal L, Selheim F et al. (2005). A high proportion of Baltic Sea benthic
cyanobacterial isolates contain apoptogens able to induce rapid death of isolated rat
hepatocytes. Toxicon, 46:252–260. doi:10.1016/j.toxicon.2005.04.005. PMID:15990143
Hermansky SJ, Wolff SN, Stohs SJ (1990). Use of rifampin as an effective chemoprotectant and
antidote against microcystin-LR toxicity. Pharmacology, 41:231–236. doi:10.1159/000138723.
PMID:2080233
Hernandez M, Macia M, Padilla C, Del Campo FF (2000). Modulation of human
polymorphonuclear leukocyte adherence by cyanopeptide toxins. Environ Res, 84:64–68.
Hilborn ED, Carmichael WW, Yuan M, Azevedo SMFO (2005). A simple colorimetric method to
detect biological evidence of human exposure to microcystins. Toxicon, 46:218–221.
doi:10.1016/j.toxicon.2005.04.009. PMID:15963544
Honkanen RE, Dukelow M, Zwiller J et al. (1991). Cyanobacterial nodularin is a potent inhibitor
of type 1 and type 2A protein phosphatases. Mol Pharm, 40:577–583. PMID: 1656193
Humpage AR, Falconer IR (1999). Microcystin-LR and liver tumor promotion: effects on
cytokinesis, ploidy, and apoptosis in cultured hepatocytes. Environ Toxicol, 14:61–75.
doi:10.1002/(SICI)1522-7278(199902)14:1<61::AID-TOX10>3.0.CO;2-R.
Jackson AR, McInnes A, Falconer IR, Runnegar MT (1984). Clinical and pathological changes in
sheep experimentally poisoned by the blue-green alga Microcystis aeruginosa. Vet Pathol,
21:102–113. PMID:6424323
Jochimsen EM, Carmichael WW, An JS et al. (1998). Liver failure and death after exposure to
microcystins at a hemodialysis center in Brazil. N Engl J Med, 338:873–878.
doi:10.1056/NEJM199803263381304. PMID:9516222
Kankaanpää H, Sipiä V (2003). Cyanobacterial liver toxin, nodularin, in northern Baltic Sea food
webs in 1996–2002. In: Bäck S, Harjunkoski R, Koivu J et al., eds, Baltic Sea Science
Congress 2003, Helsinki, Finland, 24–28 August 2003 (abstract publication), Helsinki,
Yliopistopaino, p. 153.
Kankaanpää H, Vuorinen PJ, Sipiä V, Keinanen M (2002). Acute effects and bioaccumulation of
nodularin in sea trout (Salmo trutta m. trutta L.) exposed orally to Nodularia spumigena under
laboratory conditions. Aquat Toxicol, 61:155–168.
Kankaanpää H, Turunen AK, Karlsson K et al. (2005a). Heterogeneity of nodularin bioaccumulation
in northern Baltic Sea flounders in 2002. Chemosphere, 59:1091–1097.

402 IARC MONOGRAPHS VOLUME 94
Kankaanpää HT, Holliday J, Schroder H et al. (2005b). Cyanobacteria and prawn farming in
northern New South Wales, Australia—A case study on cyanobacteria diversity and
hepatotoxin bioaccumulation. Toxicol Appl Pharmacol, 203:243–256.
Karlsson K, Sipiä V, Krause E et al. (2003). Mass spectrometric detection and quantification of
nodularin-R in flounder livers. Environ Toxicol, 18:284–288. PMID:14502579
doi:10.1002/tox.10126
Kondo F, Ikai Y, Oka H et al. (1992). Formation, characterization, and toxicity of the glutathione
and cysteine conjugates of toxic heptapeptide microcystins. Chem Res Toxicol, 5:591–596.
doi:10.1021/tx00029a002. PMID:1445998
Kondo F, Matsumoto H, Yamada S et al. (1996). Detection and identification of metabolites of
microcystins formed in vivo in mouse and rat livers. Chem Res Toxicol, 9:1355–1359.
doi:10.1021/tx960085a. PMID:8951240
Lankoff A, Banasik A, Obe G et al. (2003). Effect of microcystin-LR and cyanobacterial extract
from Polish reservoir of drinking water on cell cycle progression, mitotic spindle, and
apoptosis in CHO-K1 cells. Toxicol Appl Pharmacol, 189:204–213. doi:10.1016/S0041-
008X(03)00094-2. PMID:12791305
Lankoff A, Krzowski L, Głab J et al. (2004). DNA damage and repair in human peripheral blood
lymphocytes following treatment with microcystin-LR. Mutat Res, 559:131–142.
PMID:15066581
Lankoff A, Bialczyk J, Dziga D et al. (2006a). The repair of γ-radiation-induced DNA damage is
inhibited by microcystin-LR, the PP1 and PP2A phosphatase inhibitor. Mutagenesis, 21:83–
90. doi:10.1093/mutage/gel002. PMID:16434448
Lankoff A, Wójcik A, Fessard V, Meriluoto J (2006b). Nodularin-induced genotoxicity following
oxidative DNA damage and aneuploidy in HepG2 cells. Toxicol Lett, 164:239–248.
doi:10.1016/j.toxlet.2006.01.003. PMID:16480838
Lehtonen KK, Kankaanpää H, Leiniö S et al. (2003). Accumulation of nodularin-like compounds
from the cyanobacterium Nodularia spumigena and changes in acetylcholinesterase activity in
the clam Macoma balthica during short-term laboratory exposure. Aquat Toxicol, 64:461–476.
doi:10.1016/S0166-445X(03)00101-2. PMID:12878416
Le Vee M, Jigorel E, Glaise D et al. (2006). Functional expression of sinusoidal and canalicular
hepatic drug transporters in the differentiated human hepatoma HepaRG cell line. Eur J Pharm
Sci, 28:109–117. doi:10.1016/j.ejps.2006.01.004. PMID:16488578
Lim IK, Park SC, Song KY et al. (1999). Regulation of selection of liver nodules initiated with
N-nitrosodiethylamine and promoted with nodularin injections in Fischer 344 male rats by
reciprocal expression of transforming growth factor-beta1 and its receptors. Mol Carcinog,
26:83–92.doi:10.1002/(SICI)1098-2744(199910)26:2<83::AID-MC3>3.0.CO;2-4.
PMID:10506752
Lin JR, Chu FS (1994). Kinetics of distribution of microcystin LR in serum and liver cytosol of mice:
An immunochemical analysis. J Agric Food Chem, 42:1035–1040. doi:10.1021/jf00040a038.
Maatouk I, Bouaïcha N, Plessis MJ, Périn F (2004). Detection by 32P-postlabelling of 8-oxo-7,8-
dihydro-2′-deoxyguanosine in DNA as biomarker of microcystin-LR- and nodularin-induced
DNA damage in vitro in primary cultured rat hepatocytes and in vivo in rat liver. Mutat Res,
564:9–20. PMID:15474406

CYANOBACTERIAL PEPTIDE TOXINS 403
MacKintosh C, Beattie KA, Klumpp S et al. (1990). Cyanobacterial microcystin-LR is a potent and
specific inhibitor of protein phosphatases 1 and 2A from both mammals and higher plants.
FEBS Lett, 264:187–192. doi:10.1016/0014-5793(90)80245-E. PMID:2162782
Maidana M, Carlis V, Galhardi FG et al. (2006). Effects of microcystins over short- and long-term
memory and oxidative stress generation in hippocampus of rats. Chem-Biol Interact, 159:223–
234 doi:10.1016/j.cbi.2005.12.001. PMID:16413006
Main DC, Berry PH, Peet RL, Robertson JP (1977). Sheep mortalities associated with the blue green
alga Nodularia spumigena. Aust Vet J, 53:578–581. doi:10.1111/j.1751-0813.1977.tb15830.x.
PMID:418760
Mankiewicz J, Tarczynska M, Fladmark KE et al. (2001). Apoptotic effect of cyanobacterial
extract on rat hepatocytes and human lymphocytes. Environ Toxicol, 16:225–233.
doi:10.1002/tox.1028. PMID:11409194
Mankiewicz J, Walter Z, Tarczynska M et al. (2002). Genotoxicity of cyanobacterial extracts
containing microcystins from Polish water reservoirs as determined by SOS chromotest and
comet assay. Environ Toxicol, 17:341–350. doi:10.1002/tox.10061. PMID:12203955
Matsushima R, Yoshizawa S, Watanabe MF et al. (1990). In vitro and in vivo effects of protein
phosphatase inhibitors, microcystins and nodularin, on mouse skin and fibroblasts. Biochem
Biophys Res Commun, 171:867–874. doi:10.1016/0006-291X(90)91226-I. PMID:2169738
Maynes JT, Luu HA, Cherney MM et al. (2006). Crystal structures of protein phosphatase-1 bound
to motuporin and dihydromicrocystin-LA: elucidation of the mechanism of enzyme inhibition
by cyanobacterial toxins. J Mol Biol, 356:111–120. doi:10.1016/j.jmb.2005.11.019.
PMID:16343532
Meriluoto JAO, Nygård SE, Dahlem AM, Eriksson JE (1990). Synthesis, organotropism and
hepatocellular uptake of two tritium-labeled epimers of dihydromicrocystin-LR, a
cyanobacterial peptide toxin analog. Toxicon, 28:1439–1446. doi:10.1016/0041-
0101(90)90157-3. PMID:2128565
Metcalf JS, Codd GA (2004). Cyanobacterial Toxins in the Water Environment, Marlow,
Foundation for Water Research.
Milutinović A, Zivin M, Zorc-Pleskovic R et al. (2003). Nephrotoxic effects of chronic
administration of microcystins -LR and -YR. Toxicon, 42:281–288. doi:10.1016/S0041-
0101(03)00143-0. PMID:14559079
Moorhead G, MacKintosh RW, Morrice N et al. (1994). Purification of type 1 protein
(serine/threonine) phosphatases by microcystin-Sepharose affinity chromatography. FEBS
Lett, 356:46–50.
Nishiwaki R, Ohta T, Sueoka E et al. (1994). Two significant aspects of microcystin-LR: specific
binding and liver specificity. Cancer Lett, 83:283–289. doi:10.1016/0304-3835(94)90331-X.
PMID:8062225
Nishiwaki-Matsushima R, Nishiwaki S, Ohta T et al. (1991). Structure–function relationships of
microcystins, liver tumor promoters, in interaction with protein phosphatase. Jpn J Cancer
Res, 82:993–996. PMID:1657848
Ohta T, Sueoka E, Iida N et al. (1994). Nodularin, a potent inhibitor of protein phosphatases 1 and
2A, is a new environmental carcinogen in male F344 rat liver. Cancer Res, 24:6402–6406.
Orr PT, Jones GJ, Hunter RA et al. (2001). Ingestion of toxic Microcystis aeruginosa by dairy
cattle and the implications for microcystin contamination of milk. Toxicon, 39:1847–1854.
doi:10.1016/S0041-0101(01)00166-0. PMID:11600147
404 IARC MONOGRAPHS VOLUME 94
Pace JG, Robinson NA, Miura GA et al. (1991). Toxicity and kinetics of [3H]microcystin-LR in
isolated perfused rat livers. Toxicol Appl Pharmacol, 107:391–401. doi:10.1016/0041-
008X(91)90303-V. PMID:2000630
Pflugmacher S, Wiegand C, Oberemm A et al. (1998). Identification of an enzymatically formed
glutathione conjugate of the cyanobacterial hepatotoxin microcystin-LR: the first step of
detoxication. Biochim Biophys Acta, 1425:527–533. PMID:9838216
Pflugmacher S, Wiegand C, Werner S et al. (2005). Activity and substrate specificity of cytosolic
and microsomal glutathione S-transferase in Australian black tiger prawns (Penaeus monodon)
after exposure to cyanobacterial toxins. Environ Toxicol, 20:301–307. doi:10.1002/tox.20121.
PMID:15892065
Pouria S, de Andrade A, Barbosa J et al. (1998). Fatal microcystin intoxication in haemodialysis unit
in Caruaru, Brazil. Lancet, 352:21–26. doi:10.1016/S0140-6736(97)12285-1. PMID:9800741
Quinn RJ, Taylor C, Suganuma M, Fujiki H (1993). The conserved acid binding domain model of
inhibitors of protein phosphatases 1 and 2A: molecular modelling aspects. Bioorg Med Chem
Lett, 3:1029–1034. doi:10.1016/S0960-894X(00)80281-4.
Repavich WM, Sonzogni WC, Standridge JH et al. (1990). Cyanobacteria (blue-green algae) in
Wisconsin waters: acute and chronic toxicity. Water Res, 24:225–231. doi:10.1016/0043-
1354(90)90107-H.
Robinson NA, Miura GA, Matson CF et al. (1989). Characterization of chemically tritiated
microcystin-LR and its distribution in mice. Toxicon, 27:1035–1042. doi:10.1016/0041-
0101(89)90154-2. PMID:2508271
Robinson NA, Pace JG, Matson CF et al. (1991). Tissue distribution, excretion and hepatic
biotransformation of microcystin-LR in mice. J Pharmacol Exp Ther, 256:176–182.
PMID:1988656
Rocha MF, Sidrim JJ, Soares AM et al. (2000). Supernatants from macrophages stimulated with
microcystin-LR induce electrogenic intestinal response in rabbit ileum. Pharmacol Toxicol,
87:46–51. doi:10.1111/j.0901-9928.2000.870108.x. PMID:10987215
Runnegar MT, Falconer IR, Silver J (1981). Deformation of isolated rat hepatocytes by a peptide
hepatotoxin from the blue-green alga microcystis aeruginosa. Naunyn Schmiedebergs Arch
Pharmacol, 317:268–272. doi:10.1007/BF00503829. PMID:6798472
Runnegar MTC, Falconer IR, Buckley T, Jackson ARB (1986). Lethal potency and tissue
distribution of 125I-labelled toxic peptides from the blue-green alga Microcystis aeruginosa.
Toxicon, 24:506–509. doi:10.1016/0041-0101(86)90083-8. PMID:3087033
Runnegar MTC, Jackson ARB, Falconer IR (1988). Toxicity of the cyanobacterium Nodularia
spumigena Mertens. Toxicon, 26:143–151. doi:10.1016/0041-0101(88)90166-3. PMID:3129824
Runnegar MT, Gerdes RG, Falconer IR (1991). The uptake of the cyanobacterial hepatotoxin
microcystin by isolated rat hepatocytes. Toxicon, 29:43–51. doi:10.1016/0041-0101(91)90038-
S. PMID:1903001
Runnegar MT, Kong S, Berndt N (1993). Protein phosphatase inhibition and in vivo hepatotoxicity
of microcystins. Am J Physiol, 265:G224–G230. PMID:8396333
Runnegar MT, Maddatu T, Deleve LD et al. (1995a). Differential toxicity of the protein
phosphatase inhibitors microcystin and calyculin A. J Pharmacol Exp Ther, 273:545–553.
PMID:7714810
Runnegar M, Berndt N, Kaplowitz N (1995b). Microcystin uptake and inhibition of protein
phosphatases: effects of chemoprotectants and self-inhibition in relation to known hepatic

CYANOBACTERIAL PEPTIDE TOXINS 405
transporters. Toxicol Appl Pharmacol, 134:264–272. doi:10.1006/taap.1995.1192.
PMID:7570603
Runnegar M, Berndt N, Kong SM et al. (1995c). In vivo and in vitro binding of microcystin to
protein phosphatases 1 and 2A. Biochem Biophys Res Commun, 216:162–169.
doi:10.1006/bbrc.1995.2605. PMID:7488083
Runnegar MT, Seward DJ, Ballatori N et al. (1999). Hepatic toxicity and persistence of ser/thr
protein phosphatase inhibition by microcystin in the little skate Raja erinacea. Toxicol Appl
Pharmacol, 161:40–49.
Sahin A, Tencalla FG, Dietrich DR, Naegeli H (1996). Biliary excretion of biochemically active
cyanobacteria (blue-green algae) hepatotoxins in fish. Toxicology, 106:123–130.
doi:10.1016/0300-483X(95)03173-D. PMID:8571383
Shen PP, Zhao SW, Zheng WJ et al. (2003). Effects of cyanobacteria bloom extract on some
parameters of immune function in mice. Toxicol Lett, 143:27–36. doi:10.1016/S0378-
4274(03)00110-3. PMID:12697377
Sipiä V, Kankaanpää H, Lahti K et al. (2001a). Detection of nodularin in flounders and cod from
the Baltic Sea. Environ Toxicol, 16:121–126. PMID:11339711 doi:10.1002/tox.1015
Sipiä VO, Kankaanpää HT, Flinkman J et al. (2001b). Time-dependent accumulation of
cyanobacterial hepatotoxins in flounders (Platichthys flesus) and mussels (Mytilus edulis) from
the northern Baltic Sea. Environ Toxicol, 16:330–336. PMID:11501282 doi:10.1002/tox.1040
Sipiä VO, Kankaanpää HT, Pflugmacher S et al. (2002). Bioaccumulation and detoxication of
nodularin in tissues of flounder (Platichthys flesus), mussels (Mytilus edulis, Dreissena
polymorpha), and clams (Macoma balthica) from the northern Baltic Sea. Ecotoxicol Environ
Saf, 53:305–311. doi:10.1006/eesa.2002.2222. PMID:12568468
Sipiä VO, Karlsson KM, Meriluoto JA, Kankaanpää HT (2004). Eiders (Somateria mollissima)
obtain nodularin, a cyanobacterial hepatotoxin, in Baltic Sea food web. Environ Toxicol Chem,
23:1256–1260. doi:10.1897/03-209. PMID:15180377
Sivonen K, Jones G (1999). Cyanobacterial toxins. In: Chorus I, Bartram J, eds., Toxic
Cyanobacteria in Water: A Guide to Their Public Health Consequences, Monitoring and
Management, London, Spon Press, pp. 41–111.
Soares RM, Yuan M, Servaites JC et al. (2006). Sublethal exposure from microcystins to renal
insufficiency patients in Rio de Janeiro, Brazil. Environ Toxicol, 21:95–103.
doi:10.1002/tox.20160. PMID:16528683
Spoof L, Klimova S, Mikhailov A et al. (2003). Synthesis and organotropism of 3H-dihydro
derivatives of the cyanobacterial peptide hepatotoxin nodularin. Toxicon, 41:1531–1562.
doi:10.1016/S0041-0101(02)00245-3.
Stotts RR, Twardock AR, Koritz GD et al. (1997a). Toxicokinetics of tritiated dihydromicrocystin-
LR in swine. Toxicon, 35:455–465. doi:10.1016/S0041-0101(96)00120-1. PMID:9080600
Stotts RR, Twardock AR, Haschek WM et al. (1997b). Distribution of tritiated dihydromicrocystin
in swine. Toxicon, 35:937–953. doi:10.1016/S0041-0101(96)00169-9. PMID:9241787
Sueoka E, Sueoka N, Okabe S et al. (1997). Expression of the tumor necrosis factor alpha gene and
early response genes by nodularin, a liver tumor promoter, in primary cultured rat hepatocytes.
J Cancer Res Clin Oncol, 123:413–419. PMID:9292703
Suganuma M, Fujiki H, Okabe S et al. (1992). Structurally different members of the okadaic acid
class selectively inhibit protein serine/threonine but not tyrosine phosphatase activity. Toxicon,
30:873–878. doi:10.1016/0041-0101(92)90385-I. PMID:1326138

406 IARC MONOGRAPHS VOLUME 94
Suzuki H, Watanabe MF, Wu Y et al. (1998). Mutagenicity of microcystin-LR in human RSa cells.
Int J Mol Med, 2:109–112. PMID:9854153
Takai A, Sasaki K, Nagai H et al. (1995). Inhibition of specific binding of okadaic acid to protein
phosphatase 2A by microcystin-LR, calyculin-A and tautomycin: method of analysis of
interactions of tight-binding ligands with target protein. Biochem J, 306:657–665.
PMID:7702557
Taylor C, Quinn RJ, McCullock R et al. (1992). An alternative computer model of the 3-
dimensional structural of microcystin-LR and nodularin rationalising their interactions with
protein phosphatases 1 and 2A. Bioorg Med Chem Lett, 2:299–302. doi:10.1016/S0960-
894X(01)80204-3.
Teixeira MdaG, Costa MdaC, de Carvalho VL et al. (1993). Gastroenteritis epidemic in the area of
the Itaparica Dam, Bahia, Brazil. Bull Pan Am Health Org, 27:244–253. PMID:8220519
Tencalla F, Dietrich D (1997). Biochemical characterization of microcystin toxicity in rainbow
trout (Oncorhynchus mykiss). Toxicon, 35:583–595. doi:10.1016/S0041-0101(96)00153-5.
PMID:9133713
Toivola DM, Goldman RD, Garrod DR, Eriksson JE (1997). Protein phosphatases maintain the
organization and structural interactions of hepatic keratin intermediate filaments. J Cell Sci,
110:23–33. PMID:9010781
Turner PC, Gammie AJ, Hollinrake K, Codd GA (1990). Pneumonia associated with contact with
cyanobacteria. BMJ, 300:1440–1441. doi:10.1136/bmj.300.6737.1440. PMID:2116198
Uemura D, Hirata Y (1989). Antitumor polyethers from marine animals. In: Rahman AU, ed,
Studies in Natural Products Chemistry, Amsterdam, Elsevier, pp. 377–401.
Ueno Y, Makita Y, Nagata S et al. (1999). No chronic oral toxicity of a low dose of microcystin-
LR, a cyanobacterial hepatotoxin, in female BALB/c mice. Environ Toxicol, 14:45–55.
doi:10.1002/(SICI)1522-7278(199902)14:1<45::AID-TOX8>3.0.CO;2-T.
Wang H, Zhu H, Nie L, Xu J (1998). [The combined effects of MCYST and water organic
pollutants on the co-induction of SHE cell transformation and expression of ras P21 protein.]
Wei Sheng Yan Jiu, 27:41–44.
Williams DE, Craig M, Dawe SC et al. (1997). 14C-Labeled microcystin-LR administered to
Atlantic salmon via intraperitoneal injection provides in vivo evidence for covalent binding of
microcystin-LR in salmon livers. Toxicon, 35:985–989. doi:10.1016/S0041-0101(96)00196-1.
PMID:9241792
Williams DE, Kent ML, Andersen RJ et al. (1995). Tissue distribution and clearance of tritium-
labeled dihydromicrocystin-LR epimers administered to Atlantic salmon via intraperitoneal
injection. Toxicon, 33:122–135. doi:10.1016/0041-0101(94)00154-Z.
Yea SS, Kim HM, Oh HM et al. (2001). Microcystin-induced down-regulation of lymphocyte
functions through reduced IL-2 mRNA stability. Toxicol Lett, 122:21–31. doi:10.1016/S0378-
4274(01)00339-3. PMID:11397554
Yoshida T, Makita Y, Nagata S et al. (1997). Acute oral toxicity of microcystin-LR, a
cyanobacterial hepatotoxin, in mice. Nat Toxins, 5:91–95. doi:10.1002/nt.1. PMID:9285911
Yoshizawa S, Matsushima R, Watanabe MF et al. (1990). Inhibition of protein phosphatases by
microcystins and nodularin associated with hepatotoxicity. J Cancer Res Clin Oncol, 116:609–
614. doi:10.1007/BF01637082. PMID:2174896

CYANOBACTERIAL PEPTIDE TOXINS 407
Zegura B, Sedmak B, Filipic M (2003). Microcystin-LR induces oxidative DNA damage in human
hepatoma cell line HepG2. Toxicon, 41:41–48. doi:10.1016/S0041-0101(02)00207-6.
PMID:12467660
Zegura B, Lah TT, Filipic M (2004). The role of reactive oxygen species in microcystin-LR-
induced DNA damage. Toxicology, 200:59–68. doi:10.1016/j.tox.2004.03.006. PMID:15158564
Zhan L, Sakamoto H, Sakuraba M et al. (2004). Genotoxicity of microcystin-LR in human
lymphoblastoid TK6 cells. Mutat Res, 557:1–6. PMID:14706513
Zilberg B (1966). Gastroenteritis in Salisbury. European children–a five-year study. Cent Afr J
Med, 12:164–168. PMID:5919885
408 IARC MONOGRAPHS VOLUME 94
5. Summary of Data Reported
5.1 Exposure data
Microcystins and nodularin are cyclic peptide toxins that have a ring structure of
seven and five amino acids, respectively, which comprise one unique phenyl deca-dienoic
acid, four invariable D-amino acids and, in microcystins, two variable L-amino acids.
There are approximately 70 variants of microcystin and several variants of nodularin.
These peptides are produced naturally by cyanobacteria, an evolutionarily very ancient
group of photosynthetic prokaryotic organisms. The bacteria occur in filamentous and
coccoid forms (blooms) in free suspension in water or form layers (scums) on surfaces;
they are distributed worldwide in water and soils, and on rock and plant surfaces.
Microcystin-LR (lysine-arginine) is the most extensively investigated cyanobacterial
peptide toxin because it is frequently present in blooms in rivers and lakes. Nodularin
occurs primarily in brackish waters. The peptide toxins are contained primarily within the
cyanobacterial cells and are rarely released before the cells die. The concentration of toxin
in water therefore depends on the cell content of microcystins or nodularin and the
concentration of cells in the water. Due to widespread eutrophication in many settings,
these toxins can occur at unnaturally high frequency and concentration. In natural water
bodies and in water storage reservoirs, the concentrations of toxin vary widely from
undetectable to several milligrams per litre in cyanobacterial scums.
A number of analytical techniques are used for the quantitation of cyanobacterial
peptide toxins, and include high-performance liquid chromatography, liquid
chromatography–mass spectrometry with a number of sophistications, enzyme inhibition
assays and the enzyme-linked immunosorbent assay. Genetic probes are also available for
the detection of the genes involved in the synthesis of these toxins.
Human exposure to these toxins occurs most frequently through the ingestion of
water, i.e. through drinking or during recreational activities in which water is swallowed.
Furthermore, cyanobacterial dietary supplements (blue-green algae supplements) are now
on sale, and consumption of these toxins occurs from this source. Marine products such as
fish, shellfish and crustaceans also accumulate nodularin, which remains stable and
unchanged during cooking; this leads to their ingestion by humans.
WHO has adopted a provisonal guideline value for drinking-water supplies of 1 µg/L
microcystin-LR, based on its subacute toxicity in mice. The toxicity of this microcystin
variant is representative of that of other variants and of nodularin, and therefore provides a
reasonable approximation of the toxicity of naturally occurring mixtures of these variants
in water bodies. Many European countries and countries such as Australia, Brazil and
Canada have adopted similar guideline values for microcystins, some of which are based
on their total concentration in water samples.

CYANOBACTERIAL PEPTIDE TOXINS 409
Guidelines for recreational exposure have also been proposed by WHO; they are
derived from the drinking-water guideline but are related to the concentrations of
cyanobacterial cells found in water. They have also been implemented internationally,
and include the emission of warnings at or the closure of recreational water sites when the
specified levels of cyanobacterial contamination are reached.
5.2 Human carcinogenicity data
The Working Group reviewed several reports on ecological, cohort and case–control
studies of the risk for hepatocellular carcinoma and source of drinking-water, some of
which contained information on concentrations of microcystins in the water source. As
access to the original publications was limited, the Working Group relied in many
instances on summary information in review articles that lacked detailed descriptions of
study methods and results. The studies of hepatocellular carcinoma included several
ecological studies (12 from a review), two cohort studies (one in the review) and several
case–control analyses (one meta-analysis, one pooled analysis and one additional case–
control study). All studies conducted in the area of Southeast China that is endemic for
hepatocellular carcinoma showed a positive association between the risk for
hepatocellular carcinoma and water source; surface waters (pond, ditch or river waters)
were associated with higher risks in contrast with either shallow or deep wells. Exposure
assessment was limited in all studies to the use of these categorical measures. The few
studies that reported concentrations of microcystins indicated that levels were much
higher in surface waters than in well waters, but no study estimated the level of
microcystins on an individual basis. In an analysis of pooled data from six case–control
studies, the relative risk was 1.59; estimates of relative risk from other studies were
generally in the range of 1.5–4, which raised the possibility that the observations were a
consequence of confounding factors. Exposure to aflatoxin was not generally considered,
and other contaminants or organisms in surface waters or factors related to water source
were not evaluated. Some studies controlled for hepatitis B viral antigen or a history of
hepatitis, which decreased the likelihood of confounding from this strong risk factor. An
ecological study of colorectal cancer showed an association with concentration of
microcystins, but confounding by other factors that are common to surface water sources
in which the levels of microcystins were highest could not be ruled out. In summary,
although many studies of hepatocellular carcinoma and one study of colorectal cancer
found intriguing, positive associations with consumption of surface waters, in light of the
quality of the published material available to the Working Group, it was not possible to
associate the excess risk specifically with exposure to microcystin.
5.3 Animal carcinogenicity data
In one limited study in male mice, repeated intraperitoneal injections of microcystin-
LR induced liver foci, which were probably benign tumours.

410 IARC MONOGRAPHS VOLUME 94
In three experiments in male rats that were initiated with N-nitrosodiethylamine and
one experiment in male rats that were initiated with aflatoxin B1, multiple intraperitoneal
injections of microcystin-LR increased the incidence in the liver of glutathione S-
transferase placental form-positive foci, which are considered to be preneoplastic lesions.
In one experiment in female mice that were initiated by skin application of 7,12-
dimethylbenz[a]anthracene, Microcystis extracts given in the drinking-water increased the
weight of skin papillomas per mouse.
One study in male mice that were initiated with N-methylnitrosourea and given
Microcystis extracts in the drinking-water gave negative results.
In one experiment in male mice that were initiated by intraperitoneal injection of
azoxymethane, exposure to Mycrocystis extracts in the drinking-water resulted in an
increase in the area of aberrant crypt foci in the colon.
In two studies in male rats that were initiated with N-nitrosodiethylamine, multiple
intraperitoneal injections of nodularin increased the incidence of glutathione S-transferase
placental form-positive foci in the liver.
5.4 Other relevant data
Studies on the distribution of microcystins and nodularin have been carried out after
intravenous and intraperitoneal administration to mice, rats and pigs of 125I-, 14C- or 3H-
labelled microcystins or nodularin. Kinetic studies showed rapid distribution into the liver
and low accumulation in other tissues.
The cyanobacterial toxin microcystin does not permeate into cells. It is hepatotoxic
because hepatocytes express transporters, which are organic anion-transporting
polypeptides that permit the uptake of the toxin. A number of chemicals are known to
compete for these transporters and inhibit the uptake of microcystins. In-vitro studies in
hepatocytes have shown competitive inhibition of microcystin uptake by endogenous
transporter substrates (e.g. bile acids) and xenobiotics (e.g. antibiotics).
The toxic action of microcystins is a consequence of their profound inhibition of
cellular Ser/Thr protein phosphatases, which results in altered phosphorylation
homeostasis. This impacts cell functions and structures that are controlled by changes in
phosphorylation. The cellular metabolism of microcystins has not been elucidated but
probably involves, at least in part, glutathione conjugation. Some data suggest that the
conjugation of microcystins and possibly nodularins by glutathione occurs. It has been
proposed, but not shown, that glutathione- and cysteine- adducts are excreted either in bile
or back into the circulation together with native microcystin. No evidence was available
of the involvement of cytochrome P450 in the detoxification of microcystins or nodularin.
Excretion of microcystins occurs primarily in faeces. A number of studies have
shown that renal excretion, when it occurs, clears insignificant amounts of microcystins.
A common mechanism in the toxicity of microcystins and nodularin is the specific
inhibition of Ser/Thr protein phosphatases 1 and 2A at picomolar concentrations in the
cytoplasm and the nucleus in vitro. This inhibition results in hyperphosphorylation of

CYANOBACTERIAL PEPTIDE TOXINS 411
intracellular proteins, which is shown by the rapid disaggregation of intermediate
filaments (cytokeratins) that form the cellular scaffold in human and rodent hepatocytes.
Microfilaments become detached from the cytoplasmic membrane, which results in cell
cytoskeletal deformation and bleb formation. Cell lysis and apoptosis follow, depending
on the dose. Death results from dissolution of the liver structure and intrahepatic pooling
of blood, which lead to overall haemorrhagic shock. Doses that are not immediately lethal
can result in death from liver failure in large animals and humans several months after the
initial exposure to microcystin.
The acute toxicity of microcystins in humans was shown unequivocally in the
intoxication of haemodialysis patients in Caruaru, Brazil, who were exposed to
microcystins in the dialysis water; this resulted in the death of more than 50 patients.
Significant amounts of microcystin were detected in the livers and sera of these patients,
and several incidents of hepatic disease and/or gastroenteritis have been reported after
subacute intoxication with microcystins.
The toxicity of microcystins and nodularin has been described in rodents after
intraperitoneal administration. The main injury was to the liver. Similar toxicity was also
demonstrated in sheep and pigs in which hepatic damage was sustained for long periods
after exposure.
Administration of cyanobacterial extracts that contain microcystins in the drinking-
water to mice over a period of 1 year leads to liver damage. There are indications that
chronic administration of microcystins results in immunotoxicity.
Nodularin has been studied less extensively than microcystin.
The mechanism(s) associated with the suspected carcinogenic activity of microcystins
and nodularin is the enzymatic inhibition of protein phosphatases, which leads to
downstream hyperphosphorylation of intracellular proteins.
There is no clear evidence that microcystins or nodularin are mutagenic or clastogenic
in non-mammalian, mammalian or human cell systems. However, other mechanistic data
indicate that both toxins are involved in epigenetic processes such as the modulation of
oncogene and tumour-supressor gene expression, cell survival and/or apoptosis and the
inhibition of DNA repair. In addition, an increased frequency of polyploid cells and
centromere-positive micronuclei was observed, which suggests that both microcystins and
nodularin are possibly aneugenic.

412 IARC MONOGRAPHS VOLUME 94
6. Evaluation and Rationale
There is inadequate evidence in humans for the carcinogenicity of microcystin-LR.
There is inadequate evidence in humans for the carcinogenicity of nodularin.
There is inadequate evidence in experimental animals for the carcinogenicity of
microcystin-LR.
There is inadequate evidence in experimental animals for the carcinogenicity of
Microcystis extracts.
There is inadequate evidence in experimental animals for the carcinogenicity of
nodularins.
Overall evaluation
Microcystin-LR is possibly carcinogenic to humans (Group 2B).
In three experiments in rats, Microcystin-LR promoted preneoplastic lesions of the
liver. In a study in mice, microcystins promoted preneoplastic foci in the colon and a
limited subchronic study with microcystin-LR resulted in persistent neoplastic nodules in
mouse liver.
Strong evidence supports a plausible tumour promoter mechanism for these liver
toxins. This mechanism is mediated by the inhibition of protein phosphatases 1 and 2A,
an effect observed in rodents as well as in primary hepatocytes in vitro. The resulting
hyperphosphorylation of intracellular protein leads to disruption of intermediate filaments
that form the cellular scaffold in human and rodent hepatocytes. These toxins modulate
the expression of oncogenes, early-response genes and of the cytokine, tumour necrosis
factor α, and affect cell division, cell survival and apoptosis.
Microcystis extracts are not classifiable as to their carcinogenicity to humans
(Group 3).
Nodularins are not classifiable as to their carcinogenicity to humans (Group 3).


