Cyber Security on the Offense: A Study of IT Security Experts
Ponemon Institute, November 2012 Part 1. Introduction We are pleased to present the findings of Cyber Security on the Offense: A Study of IT Security Experts authored by Radware and Ponemon Institute. The purpose of the study is to understand organizations’ recognition of the need to operate on the offense to prevent and detect cyber attacks. Further, the study looks at their ability to deploy offensive tactics such as prevention and counter measures to protect their organizations As cyber attacks grow in sophistication and stealth, organizations are urged to be proactive in addressing the threats. As revealed in this research, a major consequence of not preventing attacks such as DDoS (denial of service) can be costly. On average DDoS attacks are costing companies approximately $3.5 million annually, according to the findings of this research.1 Other negative consequences include lost intellectual property, declines in productivity, damage to brand and reputation and lost revenue. These findings are corroborated in other Ponemon Institute studies. In this study, we surveyed 705 IT and IT security practitioners. Most report directly to the Chief Information Officer (61 percent) and 21 percent report to the Chief Information Security Officer. Sixty-two percent of respondents are at the supervisor level or higher with an average of more than 11 years experience. All respondents have, to some degree, responsibility for managing their organization’s cyber security activities. Some of the most noteworthy findings include the following: The majority of organizations (64 percent) say the severity of cyber attacks is on the rise yet
less than half say they are vigilant in monitoring attacks. The most negative consequence experienced by organizations in this research as a result of
a cyber intrusion is the loss of intellectual property. The average amount of downtime following a DDoS attack is 54 minutes and the average
cost for each minute of downtime was about $22,000. However, the cost can range from as little as $1 to more than $100,000 per minute of downtime.
Critical to achieving a strong cyber security posture is the ability to have visibility into the motives of the cyber criminal, network infrastructure and applications. Insufficient visibility of people and business processes is most often cited as a barrier to achieving a strong cyber security posture.
The majority of respondents give their organizations an average or below rating for the ability to launch or implement a counter technique against hackers and other cyber criminals. Only 29 percent say their organizations are above average.
Availability of information and systems to those who need it is the most important cyber security business priority.
1 To determine the average annual cost we used the following calculation: $21,699 (average cost per minute of downtime) x 53.5 minutes (average amount of downtime as a consequence of one DDoS attack) x average number of DDoS attacks in the past 12 months = $3,482,689.50
Critical Counter Techniques The IT security experts surveyed agree that cyber attacks are more difficult to prevent than detect. That is why in this study they rate technologies that neutralize DDoS attacks, halt the attackers computers and pinpoint the attacker’s weak spots as critical to achieving a strong cyber security posture.
Part 2. Key Findings Following is an analysis of the key findings in this research. The complete audited findings of this research are presented in the appendix of this report. We have organized the report according to the following themes: Cyber attacks are outpacing many organizations’ ability to respond. Respondents’ perceptions about the threats and barriers to achieving an effective offensive
approach to cyber risk. Organizations need to build a stronger offense. Cyber attacks are outpacing many organizations ability to respond. Severity of cyber attacks is believed to be on the rise. According to Figure 1, the majority of respondents (64 percent) say the severity of cyber attacks experienced by their organization is on the rise yet only 29 percent agree that they have the in-house expertise to launch counter measures against hackers and other cyber criminals. Figure 1. Current perceptions and response to cyber attacks Strongly agree and agree response combined
Less than half of organizations say they are vigilant in monitoring attacks (48 percent). Possible reasons holding organizations back in addressing the attacks include lack of sufficient budget and not embracing the importance of launching a strong offensive against hackers and other cyber criminals, (both 44 percent).
29%
44%
44%
48%
64%
0% 10% 20% 30% 40% 50% 60% 70%
My organization has in-house expertise to launch counter measures against cyber criminals
Security budget is sufficient for mitigating most cyber attacks
Launching a strong offensive against cyber criminals is very important
My organization is vigilant in monitoring cyber attacks
Many organizations are lagging behind in their effectiveness to combat attacks and intrusions. Despite the recognition that cyber attacks are on the rise, 36 percent say their effectiveness is not improving but staying the same (Figure 2). Thirty-five percent of respondents say their organizations are less effective in dealing with attacks. Only 29 percent say their organization’s cyber security posture is more effective in combating attacks and intrusions. The increase in frequency and severity of cyber attacks could be the reason. When asked what they thought about the current state of cyber risk, 64 percent of respondents say both frequency and severity are increasing and only 10 percent say they are decreasing. Figure 2. Effectiveness in combating cyber attacks
The most negative consequence of a cyber intrusion is the loss of intellectual property. When asked to rank the severity of consequences Figure 3 shows that by far organizations are losing intellectual property (including trade secrets). Other negative consequences are productivity declines and reputation damage. The security layers most vulnerable are the data and application layers. Figure 3. Negative consequences of a cyber attack 8 = most severe to 1 = least severe
29%
35%
36%
0% 5% 10% 15% 20% 25% 30% 35% 40%
More effective in combating attacks and intrusions
Less effective in combating attacks and intrusions
The same in terms of its effectiveness in combating attacks and intrusions
Lack of visibility and inability to protect against mobile and negligent insiders is putting organizations at risk. Visibility can be defined as an organization’s ability to observe or record what employees are doing when logged onto their business computers, including mobile-connected devices such as laptops, smart phones, notebooks, tablets and other devices. As shown in Figure 4, respondents believe this lack of visibility is the greatest area of potential cyber security risk. Other risks that worry respondents are: mobile/remote employees, negligent insiders and third-party applications. Figure 4. Greatest areas of potential cyber security risk Three responses permitted
DDoS attacks are costly. Sixty-five percent of organizations represented in this study had an average of three DDoS attacks in the past 12 months. The average amount of downtime that their organization’s network or enterprise systems experienced as a result of one DDoS attack was about 54 minutes, as shown in Figure 5. Figure 5. Average downtime after one DDoS attack
Figure 6 shows that the average cost for each minute of downtime, which includes lost traffic, diminished end user productivity and lost revenues, was about $22,000. The cost can range from as little as $1 to more than $100,000 per minute of downtime. We calculated that these attacks average companies more than $3,482,689.50 annually. Figure 6. Cost per minute of downtime
The majority of organizations are using anti-virus/anti-malware and anti-DDos to deal with cyber attacks. Figure 7 reveals the cyber defenses most frequently considered important to protect their organizations from attacks or intrusions are anti-virus/anti-malware, anti-DoS/DDos (denial of services) and identity and authentication systems. Figure 7. Cyber defenses most important Very important and important response combined
The least important cyber defenses are shown in Figure 8. Although respondents are concerned about employees’ mobile devices, only 26 percent of respondents say mobile device management is important. Also not considered as important are enterprise encryption for data at rest and ID credentialing, including biometrics. Figure 8. Cyber defenses not as important Very important and important response combined
Companies are using outside security services providers (MSSP) to help deal with attacks and intrusions. On average, 24 percent of their organizations’ security defenses are managed outside
50%
50%
51%
51%
52%
56%
59%
64%
71%
75%
0% 10% 20% 30% 40% 50% 60% 70% 80%
Content aware firewalls
Web application firewalls
Security intelligence systems including SIEM
Endpoint security systems
Secure network gateways
Intrusion detection systems
Intrusion prevention systems
Identity and authentication systems
Anti-DoS/DDoS
Anti-virus/anti-malware
26%
32%
36%
38%
39%
45%
47%
0% 5% 10% 15% 20% 25% 30% 35% 40% 45% 50%
Mobile device management
Enterprise encryption for data at rest
ID credentialing including biometrics
Other crypto technologies including tokenization
Enterprise encryption for data in motion
Data loss prevention systems
Secure coding in the development of new applications
and the most typical services are remote perimeter management and penetration and vulnerability testing. Respondents’ perceptions about the threats and barriers to achieving an effective offensive approach to cyber risks. Respondents are clear about the major threats and barriers they face. We asked respondents to rank specific cyber security threats according to their risk mitigation priority within their organizations. According to Figure 9, organizations are most concerned about addressing denial of service (DoS), server-side injections (SSI) and distributed denial of service (DDoS). The following threats are ranked as a lower priority for risk mitigation: phishing and social engineering, web scrapping and cross-site scripting. Figure 9. Cyber security threats according to risk mitigation priority 10 = highest priority to 1 = lowest priority
The biggest barrier to achieving a strong cyber security posture is the lack of visibility into the enterprise and user behavior. Critical to achieving a strong cyber security posture is the ability to have visibility into the motives of the cyber criminal, network infrastructure and applications. Figure 10 reveals that respondents believe the biggest barrier to creating a strong security posture is insufficient visibility of people and business processes. Insufficient resources or budget and lack of effective security technology solutions are also major barriers. Only 22 percent say it is the lack of assessment of cyber security risks. Figure 10. Barriers to achieving a strong cyber security posture Two responses permitted
1%
8%
10%
19%
22%
27%
34%
35%
44%
0% 5% 10% 15% 20% 25% 30% 35% 40% 45% 50%
Other
Lack of leadership
Complexity of compliance and regulatory requirements
Lack of skilled or expert personnel
Insufficient assessment of cyber security risks
Lack of oversight or governance
Lack of effective security technology solutions
Insufficient resources or budget
Insufficient visibility of people and business processes
To reduce cyber risks organizations need to build a strong offense. Availability is the cyber security priority for many organizations. We asked respondents to select the top security objectives in terms of being a business priority within their organization. As shown in Figure 11, availability of information and systems to those who need it is considered most important. Compliance with regulations and laws is a close second. Maintaining the integrity or original state of information is about an average priority. Less important are confidentiality of sensitive and confidential information and interoperability. Figure 11. Ranking of cyber security objectives in terms of a business priority objective 5 = highest priority to 1 = lowest priority
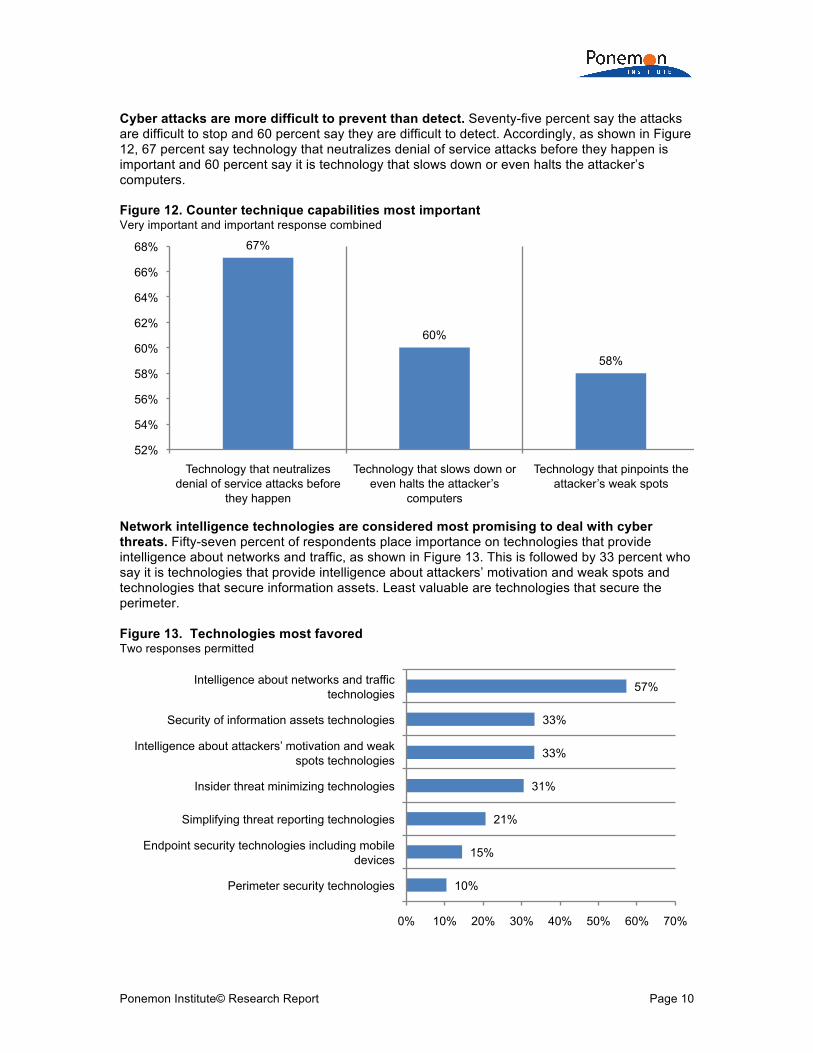
Cyber attacks are more difficult to prevent than detect. Seventy-five percent say the attacks are difficult to stop and 60 percent say they are difficult to detect. Accordingly, as shown in Figure 12, 67 percent say technology that neutralizes denial of service attacks before they happen is important and 60 percent say it is technology that slows down or even halts the attacker’s computers. Figure 12. Counter technique capabilities most important Very important and important response combined
Network intelligence technologies are considered most promising to deal with cyber threats. Fifty-seven percent of respondents place importance on technologies that provide intelligence about networks and traffic, as shown in Figure 13. This is followed by 33 percent who say it is technologies that provide intelligence about attackers’ motivation and weak spots and technologies that secure information assets. Least valuable are technologies that secure the perimeter. Figure 13. Technologies most favored Two responses permitted
67%
60%
58%
52%
54%
56%
58%
60%
62%
64%
66%
68%
Technology that neutralizes denial of service attacks before
they happen
Technology that slows down or even halts the attacker’s
computers
Technology that pinpoints the attacker’s weak spots
10%
15%
21%
31%
33%
33%
57%
0% 10% 20% 30% 40% 50% 60% 70%
Perimeter security technologies
Endpoint security technologies including mobile devices
Simplifying threat reporting technologies
Insider threat minimizing technologies
Intelligence about attackers’ motivation and weak spots technologies
Security of information assets technologies
Intelligence about networks and traffic technologies
Counter techniques enable companies to thwart an attacker’s offensive maneuvers while maintaining its defensive position. Seventy-one percent of respondents give their organizations an average or below rating for the ability to launch or implement a counter technique against hackers and other cyber criminals (Figure 14). Only 29 percent of respondents say their organizations are above average. Figure 14. Ability to launch a counter technique against a cyber criminal 1 = unable to perform counter technique to 10 = fully capable
Figure 15 shows that the main reasons for not being effective in launching a counter measure or technique is the lack of enabling technologies and resources or budget. Also significant is the dearth of expert personnel and the fact that very often counter measures are not a security priority. Figure 15. Reasons for not being fully capable of launching a counter technique More than one response permitted
According to Figure 16, if respondents rated their organizations above average, the counter techniques deployed against hackers and other cyber criminals are manual surveillance methods and close examination of logs and configuration settings. Figure 16. Methods for performing counter techniques More than one response permitted
67% 61%
43%
2% 0%
10%
20%
30%
40%
50%
60%
70%
80%
Manual surveillance methods
Close examination of logs and configuration settings
Comparison of three industries In this section we compare three industry sectors – namely, financial service, public sector (government) and health and pharmaceutical organizations. Please note that only these three industries had large enough sub-samples to be culled out of the total sample and analyzed separately.2 The following bar chart compares three industry sectors according to their average ranking of eight negative consequences that they experienced as a result of a cyber attack or intrusion (wherein 8 is the most severe consequence). As can be seen in Figure 17, productivity declines are considered a very severe consequence among respondents in all three industry sectors. However, reputation damage and lost revenue appears to be less severe for the public sector. In contrast, respondents in financial services rate reputation damage, customer turnover and regulatory action as a more severe consequence of a cyber attack than the other sectors. Finally, organizations in healthcare and pharmaceuticals rate productivity decline, lost revenue, lost intellectual property and regulatory actions as a more severe consequence of a cyber attack than financial services and public sector organizations. Figure 17. Most severe consequences of a cyber attack for three industry sectors 8 = most severe to 1 = least severe
2 The sample sizes are as follows: financial services (n = 134), public sector (n = 93) and health & pharmaceuticals (n = 78).
1.6
3.2
4.1
5.7
5.5
7.0
7.2
6.8
2.8
4.4
1.9
2.0
5.2
5.0
5.0
7.1
1.9
3.0
5.3
3.9
6.9
7.2
7.0
7.5
1.0 2.0 3.0 4.0 5.0 6.0 7.0 8.0
Cost of consultants and experts
Stolen or damaged equipment
Regulatory actions or lawsuits
Customer turnover
Lost intellectual property
Lost revenue
Reputation damage
Productivity decline
Health & pharmaceuticals Public sector Financial services
Figure 18 reports the average frequency of denial of service attacks experienced by financial service, public sector and health and pharmaceutical companies over the past 12 months. As can be seen, public sector organizations experienced a higher rate of DDoS attacks. Figure 18. Frequency of DDoS attacks experienced for organizations in three industries
Figure 19 summarizes the average amount of downtime that organizations in three industries experienced as a consequence of one DDoS attack. Here again, public sector organizations experience a longer period of downtime than financial service and health and pharmaceutical companies. Figure 19. Average downtime organizations in three industries Minutes of downtime
3.0
4.1
2.4
-
0.5
1.0
1.5
2.0
2.5
3.0
3.5
4.0
4.5
Financial services Public sector Health & pharmaceuticals
47.9
70.1
51.2
0
10
20
30
40
50
60
70
80
Financial services Public sector Health & pharmaceuticals
Figure 20 reports the extrapolated cost incurred by organizations in three industries each minute of downtime. The estimated cost includes lost traffic, end-user productivity and lost revenues that occur because of denial of service attacks. As can be seen, financial service organizations experienced the highest cost per minute of downtime. In contrast, public sector organizations had a substantially lower cost of downtime estimate as shown below. Figure 20. Estimated cost per minute of downtime for organizations in three industries
$32,560
$15,447
$23,519
$-
$5,000
$10,000
$15,000
$20,000
$25,000
$30,000
$35,000
Financial services Public sector Health & pharmaceuticals
Part 3. Conclusion and recommendations As is revealed in this research, organizations are lagging behind in their ability to deal with the aggressive and sophisticated tactics of cyber criminals. The IT security experts surveyed give their organizations a below average score in their effectiveness to launch counter measures. To achieve a proactive cyber security posture, organizations should consider the following practices: Create a strategy and plan that puts emphasis on having a strong offense against hackers
and other cyber criminals. Ensure internal IT staff as well as such external support as IT vendors and MSSPs are
knowledgeable and available to respond to attacks before they take place. Support the strategy with the right technologies to prevent and detect cyber attacks. In this and other Ponemon Institute studies on cyber crimes, the financial and reputational consequences are well documented. Organizations that suffer attacks face real-world consequences. The findings of this research can help organizations make the business case for adopting a more proactive approach to the advanced persistent threats facing them.
Part 4. Methods A random sampling frame of 22,501 IT and IT security practitioners located in all regions of the United States were selected as participants to this survey. As shown in Table 1, 895 respondents completed the survey. Screening removed 139 surveys and an additional 51 surveys that failed reliability checks were removed. The final sample was 705 surveys (or a 3.1 percent response rate).
Table 1. Sample response Freq. Pct% Total sampling frame 22,501 100.0% Total returns 895 4.0% Rejected surveys 51 0.2% Screened surveys 139 0.6% Final sample 705 3.1%
As noted in Table 2, the respondents’ average (mean) experience in IT, IT security or related fields is 11.4 years.
Table 2. Other characteristics of respondents Mean
Total years of overall experience 11.4
Total years in your current position 6.2 Pie Chart 1 reports the respondents’ primary industry segments. Nineteen percent of respondents are in financial services and 13 percent are in the public sector. Another eleven percent is in health and pharmaceuticals. Pie Chart 1. Distribution of respondents according to primary industry classification
19%
13%
11%
8% 7%
6%
6%
5%
5%
5%
4%
4% 2% 2% 2% 1% Financial services
Public sector Health & pharmaceuticals Retail (conventional) E-commerce Industrial Services Energy & utilities Hospitality Technology & software Consumer products Transportation Communications Education & research Entertainment & media Agriculture & food services
Pie Chart 2 reports the respondent’s organizational level within participating organizations. More than half (62 percent) of respondents are at or above the supervisory levels. Pie Chart 2. What organizational level best describes your current position?
According to Pie Chart 3, 61 percent of respondents report directly to the Chief Information Officer and 21 percent report to the CISO. Pie Chart 3. The primary person you or the IT security leader reports to within the organization
Forty-one percent of respondents say the CIO is most responsible for managing the cyber security posture and 21 percent say it is the CISO, as shown in Pie Chart 4. Pie Chart 4. The person most responsible for managing the cyber security posture
As shown in Pie Chart 5, 65 percent of respondents are from organizations with a global headcount of more than one thousand. Pie Chart 5. Global headcount
Part 5. Caveats There are inherent limitations to survey research that need to be carefully considered before drawing inferences from findings. The following items are specific limitations that are germane to most web-based surveys.
Non-response bias: The current findings are based on a sample of survey returns. We sent surveys to a representative sample of individuals, resulting in a large number of usable returned responses. Despite non-response tests, it is always possible that individuals who did not participate are substantially different in terms of underlying beliefs from those who completed the instrument. Sampling-frame bias: The accuracy is based on contact information and the degree to which the list is representative of individuals who are IT or IT security practitioners. We also acknowledge that the results may be biased by external events such as media coverage. We also acknowledge bias caused by compensating subjects to complete this research within a holdout period. Self-reported results: The quality of survey research is based on the integrity of confidential responses received from subjects. While certain checks and balances can be incorporated into the survey process, there is always the possibility that a subject did not provide a truthful response.
Appendix: Detailed Survey Results The following tables provide the frequency or percentage frequency of responses to all survey questions contained in this study. All survey responses were captured in September 2012. Survey response Freq Pct% Total sampling frame 22,501 100.0% Total returns 895 4.0% Rejections 51 0.2% Screening reductions 139 0.6% Final sample 705 3.1% Part 1. Screening questions S1. How familiar are you with your organization’s defense against cyber security attacks? Freq Pct% Very familiar 233 28% Familiar 311 37% Somewhat familiar 210 25% No knowledge (Stop) 90 11% Total 844 100% S2. Do you have any responsibility in managing cyber security activities within your organization? Freq Pct% Yes, full responsibility 291 39% Yes, some responsibility 299 40% Yes, minimum responsibility 114 15% No responsibility (Stop) 49 6% Total 754 100% Adjusted final sample 705
Part 2. Perceptions about the organization Strongly
agree Agree Q1a. My organization is vigilant in monitoring cyber attacks. 22% 26% Q1b. My organization’s security budget is sufficient for mitigating most cyber attacks (intrusions). 19% 25% Q1c. The severity of cyber attacks experienced by my organization is on the rise. 33% 31% Q1d. Launching a strong offensive against hackers and other cyber criminals is very important to my organization’s security strategy. 17% 27% Q1e. My organization has the in-house expertise to launch counter measures against hackers and other cyber criminals. 11% 18% Part 3. Security environment
Q2. Please rank each one of the following five (5) cyber security objectives in terms of a business priority within your organization from 5 = highest priority to 1 = lowest priority. Average rank Rank order Availability 4.7 1 Integrity 3.5 3 Confidentiality 2.8 4 Interoperability 1.9 5 Compliance 4.4 2 Average 3.5
Q3. Please rank each one of the following ten (10) cyber security threats in terms of a risk mitigation priority within your organization from 10 = highest priority to 1 = lowest priority. Average rank Rank order Malware 7.7 5 Server side injection (SSI) 8.6 2 Cross-site scripting 3.2 8 Denial of service (DoS) 9.0 1 Distributed denial of service (DDoS) 8.2 3 Web scrapping 3.0 9 Viruses, worms and trojans 7.9 4 Botnets 6.4 6 Malicious insiders 5.4 7 Phishing and social engineering 2.8 10 Average 6.2 Q4. Please rank each one of the following eight (8) negative consequences that your organization experienced as a result of a cyber attack or intrusion, from 8 = most severe to 1 = least severe. Average rank Rank order Lost revenue 6.2 4 Lost intellectual property (including trade secrets) 7.5 1 Stolen or damaged equipment 3.5 6 Productivity decline 6.8 2 Regulatory actions or lawsuits 2.2 8 Reputation damage 6.4 3 Customer turnover 6.1 5 Cost of outside consultants and experts 3.2 7 Total 5.2 Q5. Has the frequency and/or severity of cyber attacks experienced by your organization changed over the past 12 months? Pct% No change 20% Small increase (less than 10%) 25% Moderate increase (between 10% and 25%) 30% Increase Substantial increase (more than 25%) 9% 64% Small decrease (less than 10%) 5% Moderate decrease (between 10% and 25%) 3% Substantial decrease (more than 25%) 2% Decrease Cannot determine 6% 10% Total 100% Q6. What statement best describes changes to your organization’s cyber security posture over the past 12 months? Pct% Our organization’s cyber security posture is more effective in combating attacks and intrusions. 29% Our organization’s cyber security posture is less effective in combating attacks and intrusions. 35% Our organization’s cyber security posture remains the same in terms of its effectiveness in combating attacks and intrusions. 36% Total 100%
Q7. The following table contains 6 layers in the typical multi-layered security infrastructure. Please allocate the security risk inherent in each one of the 6 layers experienced by your organization. Note that the sum of your allocation must equal 100 points. Points Physical layer 7.0 Network layer 18.9 Host layer 12.4 Application layer 21.6 Data layer 24.0 Human layer 16.1 Total points 100.0 Q8. Where are you seeing the greatest areas of potential cyber security risk within your IT environment today? Please choose only your top three choices. Pct% The server environment 6% Data centers 6% Within operating systems 7% Across 3rd party applications 29% Desktop or laptop computers 20% Mobile devices such as smart phones 24% Removable media (USB sticks) and/or media (CDs, DVDs) 13% Network infrastructure environment (gateway to endpoint) 15% Malicious insiders 22% Negligent insiders 31% Cloud computing infrastructure and providers 28% Virtual computing environments (servers, endpoints) 8% Mobile/remote employees 32% Lack of system connectivity/visibility 34% Organizational misalignment and complexity 25% Total 300% Q9. What do you see as the most significant barriers to achieving a strong cyber security posture within your organization today? Please choose only your top two choices. Pct% Insufficient resources or budget 35% Lack of effective security technology solutions 34% Lack of skilled or expert personnel 19% Lack of leadership 8% Lack of oversight or governance 27% Insufficient visibility of people and business processes 44% Insufficient assessment of cyber security risks 22% Complexity of compliance and regulatory requirements 10% Other (please specify) 1% Total 200%
Part 4. Security tools & technologies Q10. What are the most promising technologies in general? Please choose only your top two choices. Pct% Technologies that secure the perimeter 10% Technologies that provide intelligence about networks and traffic 57% Technologies that provide intelligence about attackers’ motivation and weak spots 33% Technologies that simplify the reporting of threats 21% Technologies that secure endpoints including mobile-connected devices 15% Technologies that minimize insider threats (including negligence) 31% Technologies that secure information assets 33% Total 200% Q11. What cyber defenses does your organization deploy to protect your organization from attacks or intrusions? Please rate each one of the following defenses in terms of its importance in preventing or quickly detecting cyber attacks using the following 5-point scale. Very important and Important
Very important Important
Anti-virus/anti-malware 35% 40% Anti-DoS/DDoS (Denial of Services) 34% 37% Security intelligence systems including SIEM 26% 24% Web application firewalls (WAF) 19% 31% Secure coding in the development of new applications 24% 24% Content aware firewalls including next generation firewalls (NGFW) 19% 30% Identity and authentication systems 23% 42% Enterprise encryption for data at rest 13% 19% Enterprise encryption for data in motion 19% 20% Other crypto technologies including tokenization 15% 24% Data loss prevention systems 19% 27% Intrusion detection systems (IDS) 33% 24% Intrusion prevention systems (IPS) 32% 28% Endpoint security systems 20% 31% Mobile device management 12% 14% Secure network gateways including virtual private networks (VPN) 23% 30% ID credentialing including biometrics 16% 19% Average 22% 27% Q12a. Approximately, what percentage of your organization’s cyber security defenses are managed by an outside security services provider (MSSP)? Pct% None (skip to Q13) 30% 1 to 25% 24% 26 to 50% 21% 51 to 75% 10% 76 to 100% 5% Cannot determine 10% Extrapolation Average 100% 24%
Q12b. What types of security services are typically provided to your organization’s MSSP? Please check all that apply. Pct% DDoS protection 25% Remote perimeter management 50% Managed security monitoring 34% Penetration and vulnerability testing 43% Compliance monitoring 26% Mitigation support including forensics following an intrusion 29% Content filtering services 16% Other (please specify) 2% Total 225% Part 5. DDoS experience Q13. In the past 12 months, how many DDoS attacks did your organization experience? Pct% None (skip to Q15) 35% Only 1 21% 2 to 5 18% 6 to 10 11% More than 10 10% Cannot determine 5% Extrapolation Total 100% 3.0 Q14. What is the average amount of downtime that your organization’s network or enterprise systems experience as a consequence of one DDoS attack? Pct% None 0% Less than 1 minute 10% 1 to 10 minutes 13% 11 to 20 minutes 16% 21 to 30 minutes 22% 31 to 60 minutes 11% 1 to 2 hours 9% 3 to 5 hours 5% More than 5 hours 4% Cannot determine 10% Extrapolation Total 100% 53.5 Q15. Approximately, how much does it cost your organization each minute of downtime? Please include possible lost traffic, end-user productivity and lost revenues in this estimate. Pct% None 0% $1 to $10 1% $10 to $100 8% $101 to $1,000 12% $1,001 to $5,000 15% $5,001 to $10,000 15% $10,001 to $25,000 21% $25,001 to $50,000 11% $50,001 to $100,000 7% More than $100,000 5% Cannot determine 5% Extrapolation Total 100% $21,699
Part 6. Counter techniques Q16a. Please rate your organization’s ability to launch or implement a counter technique against hackers and other cyber criminals? Please use the following 10-point scale from weak (1 = unable to perform counter techniques) to strong (10 = fully capable of launching counter techniques). Pct% 1 (weak) 16% 2 19% 3 17% At or below 5 4 11% 71% 5 8% 6 5% Above 5 7 7% 29% 8 5% 9 9% 10 (strong) 3% Extrapolation Total 100% 4.2 Q16b. If your rating is at or below 5, what are the main reasons why your organization is not fully capable of launching counter techniques? Pct% Lack of resources or budget 69% Lack of enabling technologies 71% Do not have ample expert personnel 53% Not considered a security-related priority 53% Other (please specify) 2% Total 248% Q16c. If your rating is above 5, how does your organization perform counter techniques against hackers and other cyber criminals? Pct% Manual surveillance methods 67% Close examination of logs and configuration settings 61% Use of security intelligence tools 43% Other (please specify) 2% Total 173% Q17. Following are three features of security intelligence technologies that provide offensive or counter technique capabilities. In the context of your organization, please rate the importance of each feature using the following 5-point scale. Very important and Important
Very important Important
Technology that pinpoints the attacker’s weak spots 27% 31% Technology that neutralizes denial of service attacks before they happen 31% 36% Technology that slows down or even halts the attacker’s computers 27% 33% Average 28% 33% Q18. In your opinion, how difficult are cyber attacks to detect? Very difficult Difficult Very difficult and difficult 28% 32% Q19. In your opinion, how difficult are cyber attacks to prevent? Very difficult Difficult Very difficult and difficult 35% 40%
Part 3. Your role and organization D1. What organizational level best describes your current position? Pct% Senior executive 2% Vice president 1% Director 17% Manager 23% Supervisor 19% Technician 33% Staff 4% Consultant 1% Contractor 0% Other 0% Total 100% D2. Check the Primary Person you or your IT security leader reports to within the organization. Pct% CEO/Executive Committee 1% Chief Financial Officer 2% General Counsel 3% Chief Information Officer 61% Chief Information Security Officer 21% Compliance Officer 2% Human Resources VP 0% Chief Security Officer 2% Data Center Management 1% Chief Risk Officer 5% Other 2% Total 100% D3. Total years of relevant experience Mean Median Total years of IT or security experience 11.4 11.0 Total years in current position years 6.2 6.0 D4. Who is most responsible for managing your organization’s cyber security posture? Pct% Chief information officer (CIO) 41% Chief technology officer (CTO) 2% Chief information security officer (CISO) 21% Chief security officer (CSO) 1% Chief risk officer (CRO) 3% Data center management 2% Business unit management 11% Website development leader/manager 0% Corporate compliance or legal department 3% Outside managed service provider (MSSP) 4% No one person or function has overall responsibility 12% Other (please specify) 0% Total 100%
D5. What industry best describes your organization’s industry focus? Pct% Agriculture & food services 1% Communications 2% Consumer products 4% E-commerce 7% Education & research 2% Energy & utilities 5% Entertainment & media 2% Financial services 19% Health & pharmaceuticals 11% Hospitality 5% Industrial 6% Public sector 13% Retail (conventional) 8% Services 6% Technology & software 5% Transportation 4% Other (please specify) 0% Total 100% D6. Where are your employees located? (Check all that apply): Pct% United States 100% Canada 63% Europe 65% Asia-Pacific 54% Middle East & Africa 46% Latin America (including Mexico) 43% D7. What is the worldwide headcount of your organization? Pct% < 100 7% 100 to 500 9% 501 to 1,000 19% 1,001 to 5,000 34% 5,001 to 25,000 21% 25,001 to 75,000 6% > 75,000 4% Extrapolation Total 100% 10,546
For more information about this study, please contact Ponemon Institute by sending an email to [email protected] or calling our toll free line at 1.800.887.3118.
Ponemon Institute
Advancing Responsible Information Management Ponemon Institute is dedicated to independent research and education that advances responsible information and privacy management practices within business and government. Our mission is to conduct high quality, empirical studies on critical issues affecting the management and security of sensitive information about people and organizations. As a member of the Council of American Survey Research Organizations (CASRO), we uphold strict data confidentiality, privacy and ethical research standards. We do not collect any personally identifiable information from individuals (or company identifiable information in our business research). Furthermore, we have strict quality standards to ensure that subjects are not asked extraneous, irrelevant or improper questions.