+ All Categories
Home > Documents > CyberRams 7th January 2014 March 2014 - The NSTA …static.nsta.org/ecybermission-files/CyberRams...

CyberRams 7th January 2014 March 2014 - The NSTA …static.nsta.org/ecybermission-files/CyberRams...

Date post: 17-Apr-2018
Category:
Upload: duongduong
View: 214 times
Download: 2 times
Share this document with a friend
37
CyberRams 7th January 2014 March 2014 Our team, the CyberRams, focused on preventing noise-induced hearing loss in kids and teens. We found that in the United States, over five million children and teens have suffered permanent damage to their hearing from excessive exposure to noise. We met with several experts, including a local doctor who told us that she has seen 17 year olds with the hearing of 70 year olds due to excessive noise exposure. The problem is getting worse and is completely preventable. After conducting a survey in our community, we found that a major problem is knowledge -- while kids and teens may be aware they are exposed to loud noises, they don’t know how loud the noises are, and that exposure could cause serious injury. Our team addressed the problem by designing a prototype computer program called “Decibel mApp.” This program takes information gathered with the user’s smartphone regarding noise exposure over the course of a day (in decibels), links that information to GPS data, and provides the user with a report in the form of a map that shows where the user is exposed to levels of noise that may be damaging to hearing. Our testing of the program indicated that Decibel mApp works as intended. With our solution, users will be made aware of dangerous levels of noise so they can take preventative measures to avoid long term injury. Our team intends to eventually turn this program into a free App that can be downloaded for use on smartphones.
Transcript

CyberRams

7th

January 2014

March 2014

Our team, the CyberRams, focused on preventing noise-induced hearing loss in kids and

teens. We found that in the United States, over five million children and teens have

suffered permanent damage to their hearing from excessive exposure to noise. We met with several experts, including a local doctor who told us that she has seen 17 year olds

with the hearing of 70 year olds due to excessive noise exposure. The problem is getting

worse and is completely preventable. After conducting a survey in our community, we

found that a major problem is knowledge -- while kids and teens may be aware they are

exposed to loud noises, they don’t know how loud the noises are, and that exposure could

cause serious injury. Our team addressed the problem by designing a prototype computer program called “Decibel mApp.” This program takes information gathered with the user’s smartphone regarding noise exposure over the course of a day (in decibels), links that information to GPS data, and provides the user with a report in the form of a map that shows where the user is exposed to levels of noise that may be damaging to hearing. Our testing of the program indicated that Decibel mApp works as intended. With our solution, users will be made aware of dangerous levels of noise so they can take preventative

measures to avoid long term injury. Our team intends to eventually turn this program into

a free App that can be downloaded for use on smartphones.

State Virginia

Grade 7th

Mission Challenge Technology

Method Engineering Design Process

Students GoRmms1 (Submitted on: 3/2/2014 10:40:40 PM)

GoRmms2 (Submitted on: 3/2/2014 10:03:04 PM)

GoRmms3 (Submitted on: 3/3/2014 8:58:40 AM)

GoRmms4 (Submitted on: 3/2/2014 9:57:17 PM)

Team Collaboration

(1) Describe the plan your team used to complete your Mission Folder. Be sure to explain the role of each team member and how you

shared and assigned responsibilities. Describe your team’s process to ensure that assignments were completed on time and deadlines

were met.

We are the CyberRams (Diego, Aditya, Ravi, and Rishabh). We are 7th graders at Rocky Run Middle School in Chantilly, VA. Completion of the

eCybermission folder was a team effort. In one of our first meetings, we came up with the goals that we wanted to achieve and then developed

a calendar to reflect our progress and to help us meet the deadlines. We met every week with our coach at a room we reserved in our local

library, and on several Sundays at each other’s houses. We also went on several field trips to consult with experts in the area of hearing loss. In

between our group meetings, we did individual research, testing and prototype development which we then shared with the group. In order to

maximize the time available to complete the project, we assigned different tasks to different members based on our individual skills and expertise.

Ravi took the lead in testing various hearing protection devices, Diego was our chief researcher regarding issues related to noise-induced hearing

loss, and Rishabh and Aditya led the effort on writing code for the Decibel mApp program. Although Team members had areas of the project in

which they concentrated, all Team members became familiar and contributed to all aspects of the mission. We created a document in Google

Drive so we could all edit our Mission Folder and other graphs at the same time and see the progress of our fellow teammates. With only four

members on our Team, we realized that the project would only be successful if each member was committed and contributed to the

overall product .

Engineering Design

Problem Statement

(1) What problem in your community did your team try to solve? Why is this problem important to your community ?

Our Team set out to solve the problem of noise-induced hearing loss among kids in our community. Noise pollution is a growing problem in our

community and throughout the world. Although many kids are aware they are exposed to noise throughout the day, many don’t realize that high

levels of noise over a short period, or even lower levels of noise over a longer period, can permanently damage hearing. Team member Diego

initially suggested this would be a good problem to work on because as a drummer/percussionist, he sometimes had a ringing sound in his ears

after practice, and wondered if this was bad for his hearing. The other Team members realized that they too are exposed to a lot of noise on a

daily basis (from band practice, construction noise, headphones, noise at sporting events, even noise in the cafeteria), and thought that this could

be detrimental. After researching noise induced hearing loss, surveying people in the community, and meeting with experts in the area of hearing

loss, we found that hearing loss is completely preventable if people use hearing protection but may be unrepairable if damaged.

We believe that the problem is a lack of information – kids don’t know that they are listening to harmful levels of noise and so they don’t use

hearing protection. To address this problem, our Team created a prototype program that we call “Decibel mApp” which will track a user’s noise

exposure over the course of a day (in decibels), link that information to GPS data, and provide a report to the user and his or her parent in the

form of a map that shows where the user is exposed to levels of noise that may be damaging to hearing. (See pg. 1 of the Attachments to see the

Decibel mApp logo). Our Team intends to eventually turn this program into a free App that can be downloaded for use on smartphones.

(2) List at least 10 resources you used to complete your research (e.g., websites, professional journals, periodicals, subject matter

experts).

Subject Matter Experts

1) Dr. Michael Ardaiz is the Chief Medical Officer for the U.S. Department of Energy. He has practiced occupational medicine since 1998 on

behalf of multiple federal agencies including the Drug Enforcement Administration, the U.S. Marshals Service, and the Transportation Security

Administration. Dr. Ardaiz graduated from the George Washington University with a medical degree and master of public health degree and has

been board certified in Internal Medicine and Occupational & Environmental Medicine. Dr. Ardaiz met with the Team and helped us understand

the public health aspects of noise-induced hearing loss and ways in which public health officials are working to prevent hearing loss. He also

made us aware of PubMed, a database service of the U.S. National Library of Medicine, that the Team used to research journal articles on the

issue of hearing loss.

2) Dr. Vicki Owczarzak is a pediatric otolaryngologist with Otolaryngologist Associates, P.C. in Fairfax County, Virginia . She graduated from the

Drexel University - Medical College of Pennsylvania Hahnemann School of Medicine and is certified by the American Board of Otolaryngology. Dr.

Owczarzak met with the Team and helped us understand the medical causes of noise-induced hearing loss. At her office, we also met with an

audiologist who showed us the sound booth and equipment used to test for hearing loss.

3) Ramesh Balakrishnan is a lead engineer at Dropbox, a company that provides file hosting services. Mr. Balakrishnan studied Computer Science

at Stanford (BS ‘03, MS ‘05) and was a navigation specialist for Google for over 6 years where he led several areas in Google Maps - adding

country borders, building search backends and enabling community editing of map data. Team members conducted an interview with Mr.

Balakrishnan using Skype. He helped the Team understand the general navigation techniques used by companies like Google, the rendering of

routes on a map and the basic fundamentals of GIS data.

4) Meera Chattaraman is a lead engineer at a cybersecurity company in Herndon, VA. She received a Master degree in computer science from the

University of Maryland Baltimore County and spent 9 years at Boeing working on GIS related projects and 6 years at the nuclear measurements

company, Areva. Mrs. Chattaraman helped the Team understand issues relating to computer programming and mobile platforms.

5) The National Institute on Deafness and Other Communication Disorders (NIDCD), which is part of the National Institutes of Health (NIH). Since

2008, the NIDCD has sponsored a national public education campaign to raise awareness regarding noise-induced hearing loss among preteens.

The staff at NIDCD provided the Team with information regarding noise-induced hearing loss and literature (bookmarks, information sheets and

posters), which the Team distributed to area students. The Team is currently in discussions with the staff at NIDCD to organize presentations this

spring to the student body at Rocky Run Middle School regarding the issue of noise-induced hearing loss.

References

Brody, J. E. “All That Noise Is Damaging Children’s Hearing.” The New York Times N.p., 8 Dec. 2008. Web. 12 Feb. 2014.

Byrne, D.C. et al. (2011). Relationship between comfort and attenuation measurements for two types of earplugs. Noise & Health, 13, 86-92.

“Characteristics of Sound and the Decibel Scale.” Epd.gov.hk. Environmental Protection Department (Hong Kong). Web. 20 Feb. 2014.

http://www.epd.gov.hk/epd/noise_education/web/ENG_EPD_HTML/m1/intro_5.html.

Chung, J.H. et al. (2005, April). Evaluation of Noise-Induced Hearing Loss in Young People Using a Web-Based Survey Technique. Pediatrics,

115, 861 -867.

David, Isaiah. “How Does a Decibel Meter Work?” ehow.com. EHow. Web. 22 Feb. 2014. http://www.ehow.com/how-does_5220712_decibel -

meter-work_.html

“Decibel Exposure Time Guidelines: How Loud is Too Loud?” Dangerousdecibels.org. Dangerous Decibels. Web. 20 Feb. 2014.

http://www.dangerousdecibels.org/education/information-center/decibel-exposure-time-guidelines/

“Frequently Asked Questions.” Dangerousdecibels.org. Dangerous Decibels. Web. 20 Feb. 2014.

http://www.dangerousdecibels.org/education/information-center/faq/#who-originated

Kumparak, G. techcrunch.com. “Google’s Location History Browser Is A Minute -By -Minute Map Of Your Life.” 18 Dec. 2013. Web. 20 Feb. 2014

http://techcrunch.com/2013/12/18/google-location-history/

Harrington, Andrew N. “Hands-On Python A Tutorial Introduction for Beginners.” Web. 20 Feb. 2014. http://anh.cs.luc.edu/python/hands-

on/handsonHtml/handson.html

Hassell, Jonathan. “Developing for the iPhone and Android: The pros and cons.” Computerworld.com. Computerworld. 6 July 2010. Web. 20 Feb.

2014. http://www.computerworld.com/s/article/9178684/Developing_for_the_iPhone_and_Android_The_pros_and_cons.

Harrison, Robert V. “Noise-induced hearing loss in children: A ‘less than silent’ environmental danger.” Paediatrics & Child Health 13(5) (2008):

377 -382. Web. 11 Feb. 2014.

Harrison, Robert V. “The Prevention of Noise Induced Hearing Loss in Children.” International Journal of Pediatrics (2012). Print.

“Hearing Protector Device Compendium.” CDC.gov. The National Institutes for Occupational Safety and Health (NIOSH). Web. 15 Feb. 2014.

http://www2a.cdc.gov/hp-devices/hp_srchpg01.asp

“Intensity and the Decibel Scale.” PhysicsClassroom.com. The Physics Classroom. Web. 25 Feb. 2014.

http://www.physicsclassroom.com/class/sound/u11l2b.cfm

“KML Tutorial.” Google.com. Google. Web. 25 Feb. 2014. https://developers.google.com/kml/documentation/kml_tut

“Method for Calculating and Using the Noise Reduction Rating - NRR.” CDC.gov. Centers for Disease Control and Prevention. Web. 20 Feb.

2014. http://www2.cdc.gov/hp -devices/pdfs/calculation.pdf.

“Noise-Induced Hearing Loss.” CDC.gov. Centers for Disease Control and Prevention. 27 Feb. 2013. Web. 27 Feb. 2014.

http://www.cdc.gov/healthyyouth/noise/.

“Noise-Induced Hearing Loss.” NIH.gov. National Institute on Deafness and Other Communication Disorders (NIDCD). Oct. 2013. Web. 27 Feb.

2014. http://www.nidcd.nih.gov/health/hearing/pages/noise.aspx.

Sliwinska -Kowalska, M. and Davis, A. “Noise-Induced Hearing Loss.” Noise & Health 14 (2012): 274 -280. Web. 11 Feb. 2014.

“The Comma Separated Value (CSV) File Format.” Creativist.com. Creativist Software. Web 20 Feb. 2014.

http://creativyst.com/Doc/Articles/CSV/CSV01.htm

“The Decibel.” NTD-ed.org. NDT Resource Center. Web. 25 Feb. 2014. http://www.ndt -ed.org/GeneralResources/decibel/decibel.htm

“Tinnitus: What is that ringing in my ears?” Vestibular.org. Vestibular Disorders Association. Web. 27 Feb. 2014. http://vestibular.org/tinnitus

Traux, Barry. Handbook for Acoustic Ecology. N.p.: Simon Fraser University, 1999. SFU.ca. Simon Fraser University. Web. 27 Feb. 2014.

http://www.sfu.ca/sonic-studio/handbook/Threshold_Shift.html.

(3) Describe what you learned in your research.

Before we created our prototype, our Team identified a number of areas we needed to research. These included statistics regarding noise-

induced hearing loss, what causes noise-induced hearing loss, how noise levels are measured, what hearing protection is currently available on

the market, and how we might incorporate GPS technology into our design.

Our research revealed that noise-induced hearing loss is a growing problem among young people. According to the Center for Disease Control

and Prevention (CDC), an estimated 12.5% of children and adolescents aged 6–19 years (approximately 5.2 million people) have suffered

permanent damage to their hearing from excessive exposure to noise. (CDC, 2013)

We learned that the human ear contains tiny hair cells in the part of the inner ear called the cochlea. (See pg. 1 of the Attachments). Different

groups of hair cells react to different frequencies. When sound waves enter the ear, these hair cells send an electrical signal to the auditory nerve.

The auditory nerve then sends the electrical signal to the brain, which translates it into sound. (NIDCD, 2014). When a person is exposed to loud

noises, the body tries to protect itself by decreasing the ear’s sensitivity level. This is called a “standard threshold shift” and can cause a person to

temporarily have muffled hearing after a concert or other loud event. If the hair cells are not allowed to recover, they can be permanently

damaged and die. (Traux, 2014). Once hair cells are dead, they never grow back. (NIDCD, 2014). Loud noises can also cause tinnitus, which is

an abnormal noise in the ears such as ringing or buzzing. While it can go away, more than 12 million Americans have chronic tinnitus and

excessive noise exposure is considered to be the leading cause. (Vestibular, 2014).

The Team members met with Dr. Vicki Owczarzak, a pediatric otolaryngologist (an ear, nose and throat doctor), and an audiologist (a health-care

professional who is trained to evaluate conditions including hearing loss) who helped us understand the causes and diagnosis of noise-induced

hearing loss, and emphasized the importance of using hearing protection. Dr. Owczarzak told the Team that in her practice she has seen many

17 year olds with the hearing of 70 year olds due to excessive noise exposure. She talked to us about the how hearing loss is not reversible and

that she and her husband (who is also an otolaryngologist) make their kids wear earplugs when they are engaged in noisy activities such as

inflating an air mattress. Dr. Owczarzak was very happy to hear about our project and thought that it would be very beneficial for the community.

Pictures from our visit are at pg. 2 of the Attachments.

The Team studied how noise levels are calculated. We learned that sound is measured in decibels. The decibel scale starts at 0 dB, which is the

“Threshold of Hearing” (the smallest sound that can be heard by a healthy human ear), and increases logarithmically. For example, if you have an

increase from 40 dB to 60 dB, this means that there has been a 100 -fold increase in the strength of the sound waves. (David, 2014) Experts

generally agree that sounds that are louder than 85 dB can cause permanent hearing loss. (See pg. 3 of the Attachments). A sound that is 160 dB

can cause instant perforation of the eardrum. (Physics Classroom, 2014).

We learned that to prevent noise-induced hearing loss, it is important to get information not only about the decibel levels someone is exposed to,

but also how long the person is exposed. A brief exposure to a very loud noise at close range can cause permanent damage, but exposure to

lower levels may also cause permanent damage if a person is around the noise for a longer period. (Dangerous Decibels, 2014). If a person has to

raise his or her voice to be heard by someone standing an arm’s length away, it is likely the person is being exposed to dangerous levels of noise.

(Dangerous Decibels, 2014).

Survey Response in Our Community

Our research confirmed that noise-induced hearing loss is a big problem not only in our country, but throughout the world. However, our Team

wanted to see what people in our community had to say about the issue, so we conducted a survey over a period of 8 days, starting on February

16, 2014.

We created a one page survey, which we thought was short enough so that people would be willing to answer it, but provided information on key

issues such as whether people were exposed to loud noises, whether they used hearing protection, and whether they had experienced any

symptoms of hearing loss. Our survey was anonymous to protect the participants’ personal information, but we collected data on whether the

responder was male or female, and how old the person was. The survey form is provided at pg. 4 of the Attachments.

Initially, we distributed the survey in print form to students after school. Principally, these were kids who attended the after school homework club.

However, after doing some research on the best ways to collect the information, we realized that we could use Google Forms to collect survey

responses electronically. Google Forms is free, easy to use, and has many features we liked. On Google Forms, a respondent is told what

percentage of the survey has been completed, questions are targeted to previous responses (for example, if a user indicated that he did not have

a smartphone, the survey would not ask him what kind of smartphone he had). In addition, all the data was collected in an online spreadsheet and

analytic reports were available that allowed for easy analysis. Team member Aditya took the lead in entering the survey form on Google Forms, a

screenshot of which is included in the Attachments at pg. 4.

In order to get a wide cross-section of people to answer the survey, we asked our school after -school specialist to post a link to the survey on

Blackboard, which is an online resource teachers and kids use to post homework, notices, etc. We also asked the school to provide a link to our

survey through Keep In Touch, the email notification system our school uses to alert parents and kids to news and events. Copies of the notices

sent out are included in the Attachments at pg. 5.

The response to our survey amazed us. We had initially expected about 50 responses, based on the number of people who go to the after school

homework club each day. However, we ended up getting 246 responses by the time we closed our survey on February 23rd. After the

respondents completed the survey, we handed them bookmarks and other pamphlets that we had obtained from NIDCD about hearing loss. (See

pictures of the Team conducting survey at pg. 6 of the Attachments). If respondents chose to use paper instead of the Web form, the Team

members divided the completed forms and we each inputted the responses into Google Forms.

We not only got responses from middle school students (our original target audience), but we also got responses from older teens, parents, school

officials, and even grandparents. The results of our survey are included at pages 7-9 in the Attachments, and they show that noise exposure is a

major problem in our community, and that a large percentage of kids and teens are putting themselves at risk on a daily basis.

Among the results, we found that 93% of respondents think that noise-induced hearing loss is either a big problem or somewhat of a problem for

kids/teens. We learned that 51% of respondents know someone who has experienced hearing loss and 78% of respondents have experienced

symptoms after being around loud noises such as ringing in the ear, muffled hearing or hearing loss. We were happy to see that 53% of

respondents have been told they should wear hearing protection around loud noises, but were surprised that 47% still have not gotten the

message. A shocking 49% of respondents reported that they never wear hearing protection around loud noises, and a mere 5% of respondents

always wear protection around dangerously loud noises. Respondents indicated several reason for not wearing hearing protection, but the most

common reason (26%) was “I don’t think I need them”.

We surveyed respondents about their use of headphones and earbuds because this is an important component of cumulative exposure, and we

found that 83% of respondents use either headphones or earbuds on a daily basis. An astounding 21% of participants in the survey said they use

headphones or earbuds for more than 3 hours a day on average, and 7% reported that they listen to headphones or earbuds for 6+ hours per

day. Of the respondents who use headphones or earbuds, 25% said that they generally listen to loud volume on their headphones or earbuds and

28% said that they sometimes listen to loud volume.

We also gathered data about smartphone use because we wanted to determine if a substantial number of people already had smartphones that

could be used to collect the data for the Decibel mApp program. We found that 64% of all respondents have a smartphone, and of these 67%

have Apple devices and 28% have Android devices.

Research on Hearing Protection

After learning through our research that noise exposure was responsible for hearing loss, and learning through our survey that the problem was a

significant one in our community, we focused our efforts on the best way to protect kids from hearing damage. We initially had two separate goals.

The first was to find a better form of hearing protection than what was on the market. The second goal was to find a user friendly way to alert kids

that they were being exposed to too much noise.

Our first effort was to survey existing hearing protection on the market to determine if it could be improved. Our research indicated that noise-

induced hearing loss is almost always preventable if hearing protection is worn to reduce exposure. (Byrne, 2011)

Our Team traveled to Washington D.C. to meet with Dr. Mike Ardaiz, the Chief Medical Officer at the U.S. Department of Energy. Dr. Ardaiz spoke

with us about the public health aspects of hearing protection and he told us that for safety reasons, earplugs and other forms of hearing protection

cannot block out all sound because the person wearing them still needs to be able to hear people around them. This was something we had not

realized -- that hearing protection is actually designed to allow some noise in. Pictures from our visit with Dr. Ardaiz are at pg. 10 of the

Attachments.

After meeting with Dr. Ardaiz, the Team studied about different types of hearing protection, and design requirements. We found that NIOSH (The

National Institute for Occupational Safety and Health) maintains a database of all the manufactures of hearing protection in the U.S., and all the

types of hearing protection devices produced. The database allows one to search by different criteria including the materials used (foam, silicone,

etc.). (NIOSH 2014). Each hearing protector sold in the United States is required by law to have a Noise Reduction Rating (NRR). This rating

indicates how the hearing protector attenuates (or reduces) the decibel level. For example, if a person is exposed to 100 dB and is wearing ear

plugs that have an NRR of 20, the person’s exposure should be 80.

The Team decided to test out a variety of different earplugs on the market to see if it made sense to focus our efforts on improving forms of

hearing protection for kids. We focused on ear plugs as opposed to ear muffs because ear plugs are cheaper and more readily available. Ravi led

the Team’s effort on this research. He created a small round device with a hole in it (similar to a bottle cap), which would attach to a microphone

that was connected to a computer. The Team purchased several earplugs including polyurethane foam earplugs, silicone putty earplugs, and

multi-purpose waterproof earplugs. The Team then placed the ear plugs in the small hole, which was intended to mimic the ear canal. (See pg. 11

of the Attachments). The microphone served the part of the human ear, and the signal it received (a sound wave created with Audacity, an audio

editing software) was transmitted to the computer. Sound levels received by the microphone were converted into a graph showing decibels with a

software called VSLM (Virtual Sound Level Meter). (See pg. 12 of the Attachments).

The results of the earplug testing are provided on pg. 13 of the Attachments. The summary of our findings, which are provided on pg. 14 of the

Attachments is that the earplugs worked well and provided hearing protection. While our testing revealed lower NRR ratings in some cases than

those which are advertised, this difference may be attributed to the differences between the device we created to mimic the ear and the actual ear.

While our fixture is just a thin hole with not much surface area to reduce noise, the outer ear can be thought of as a cone, with much more surface

area for the ear plugs to block noise. The waterproof ear plug did not do well, as the several rings that would flex and block out noise could not

cover a thin opening like the one in our testing device. The silicone ear plug was the best one and the only one to surpass its NRR, but it poses a

risk of getting stuck. Dr. Owczarzak cautioned us about the silicone ear plug as she has had many patients come to her office for removal of this

putty. In fact, we had to break our device apart to get all the putty out! Rather than focusing our efforts on improving ear plugs, the Team decided

that the main problem we needed to address was making kids and parents aware that they were being exposed to noise at levels that required

hearing protection.

As a result of our research, we realized that much of the problem of noise-induced hearing loss stems from a lack of knowledge. People don’t

know the sound levels to which they are being exposed every day. There is no standard for volume controls on devices we use one a regular

basis such as televisions, radios, and cell phones that indicates the decibel level. During band rehearsal, during lunch at the cafeteria, or at a

basketball game, we may be aware that our surroundings are loud, but we don’t know how loud, or what the noise levels are doing to our hearing.

At this point, the Team decided to turn its efforts to researching what sort of device we could create that would measure and report a user’s

decibel level exposure throughout the day.

Research Regarding Decibel Meters

Initially, the Team thought of creating a small device that kids could attach to their backpack that would alert them when they are being exposed to

excessive noise. We researched decibel meters and how they work. We learned that sound is measured in waves. The waves travel through the

air so that we can hear them. Decibel meters have a small membrane which vibrates when sound hits it, and it sends an electric charge which is

directly proportional to the amplitude of the sound. (David, 2014). While the Team thought that it could create a pocket decibel meter for kids, we

realized that asking kids and parents to buy a new device might not make sense, when we could create a new program or app that the user could

install on existing technology -- his or her phone. As indicated above, our survey revealed that 64% of respondents own smartphones and 67% of

those are Apple phones.

After some research into what was currently on the market, we realized that there were several decibel meter apps already available. We liked the

Decibel 10th program because it is free, easy to use, and data gathered by the app could be exported in a usable format. What Decibel 10th and

other programs on the market do not provide is information regarding the location where the person was being exposed to excessive noise.

The Team visited the Smithsonian in Washington D.C. to learn more about GPS technology. As part of the “Time and Navigation” exhibit at the Air

and Space Museum, we learned about the invention of GPS and GPS applications. The Team members also drew upon their meeting with

Ramesh Balakrishnan, a former navigation specialist at Google who helped the Team members understand GIS techniques and navigation

technology used by companies such as Google. We learned about KML (Keyhole Markup Language), which is a file format used by Google to

display geographic data. (see pg. 15 of the Attachments).

While the Team members had some knowledge of computer programming through school and extracurricular programs, we studied various

possible programming languages in order to decide which one we would use for our project. We chose Python, which is a free, open source

programming language, because several of the Team members had studied it during the summer during a course about the Raspberry Pi, a small

computer that is used for electronics projects and uses the Python programming language. We also learned about CSV (comma-separated

values), which is a format used in many software applications to move data between programs that operate on different formats.

Experimental Design

(4) Develop a design statement. Be sure to describe what exactly your device should be able to do. Do not describe HOW it’s going to do

what it needs to do.

Our Team’s mission is to design a computer program that can be used to track the user’s decibel level exposure and let the user know the

geographic location where he or she is exposed to dangerous levels of noise. The idea behind our program is that a lot of hearing loss among

kids is caused by ignorance – kids and teens may be aware they are exposed to loud noises, but they and their parents just don’t know how loud

the noises are, and that exposure could cause injury. With our device, the user will know how much noise he or she is exposed to throughout the

day and where the exposure is occurring so that he or she can take preventative measures to avoid long term injury.

(5) Determine the criteria for a successful solution and identify constraints for your design. Discuss what the device must have in order to

accomplish its job and the restrictions of the device (i.e. the size, the cost, the weight, etc.).

In designing our program, we identified the following criteria:

1. The program should accurately show the decibel levels to which kids are exposed throughout the day.

2. The program should accurately show where noise exposures were greatest.

3. We wanted to make use of existing technology (decibel meters and GPS technology on smart phones) so users won’t have to buy additional

devices.

4. The program should be easy to use and understand.

5. The program should display the data in an easy to understand format.

The design had several constraints:

1. We had a budget constraint, so we were restricted to the use of affordable technology and free apps to provide the data for our computer

program.

2. We had limited time to create our computer program.

3. The programming language we use to create our program should be free, easy to use and sufficient to accomplish our objective.

4. Since we were utilizing a smartphone, we had to determine what platform we should initially use to provide data for our program. We decided

to use the iOS created by Apple because the Decibel 10th app was available for download on iPhones.

5. We had to decide what existing app we should use to provide data to our program regarding decibel levels. We used Decibel 10th because

Decibel 10th has the ability to export data in a CSV (Comma Separated Values) format to an email account. Our research showed that CSV data

could be easily exported and used by our program. See pg. 16 of the Attachments.

6. We needed to decide what GIS program we should use to provide data to our program regarding locations at which decibel readings were

received. Google Search was used because Google Search comes with Google Now, which has a feature called Location History. Location

History keeps track of all the locations that have been visited. This data can be exported in the KML (Keyhole Markup Language) file format. (see

pg. 17 of the Attachments).

(6) Identify the relevant variables you will use to test your prototype or model and explain how you will measure your variables.

Our prototype is a computer program and the variable we intend to measure is whether the program accurately produces a report for the user that

indicates decibel level and locations at which the decibel levels were recorded. To measure this variable, the Team will run the program using

KML data provided by Google Search (regarding geographic location) and CSV data provided using the Decibel 10th app (regarding decibel

levels) and compare the report produced by the Decibel mApp program to the decibel levels and locations we observed during the test period.

Build Prototype or Model

(7) Develop a design and list the materials you used in your design. Include technologies you used (e.g., scientific equipment, internet

resources, computer programs, multimedia, etc.).

The materials we used in our project were:

- Personal computers, both Windows and Mac

- Smartphones were used because a single mobile device could record the locations using Google Location Services and run Decibel 10th to

record the sound levels. We determined that it would be easier to port over the data from a single device with overlapping time stamps to a

computer on which the Python script would merge the two files. For our prototype, we used iPhones (iPhone 4 and iPhone 5) which had both

Google Search and Decibel 10th installed.

- Decibel 10th app by SkyPaw Co. Ltd, version 3.8.2, which was installed on our iPhones. This would record decibel levels on the mobile device

and this data can then be exported in a CSV (Comma Separated Values) for easy parsing (“parsing” is a method of separating of the values and

conducting operations on those values like mathematical operations or string operations). These values would be the date and time stamp and the

peak and average noise levels. The periodicity of recording intervals can be set from 2 readings per second to 10 readings per second.

- Google Search - Version 3.2.1.25875 which was installed on the smartphone. Google Search can track a person’s location. Google Search

comes with Google Now, which has a feature called Location History. Location History keeps track of all the locations that have been visited. This

gave us all the places and the timestamps where the user’s mobile device had been. “Timestamps” are a record of that instance in time in a date

and time format when an event happens.

- Python Version 2.7 - This is a freely available scripting language that is simple to use as well as powerful in its application. (See pg. 18 of the

Attachments). The software is available in http://www.python.org/download/releases/2.7/.

- Google Earth - Version 7.1.2.2041 - Google Earth is the software used to display the new modified KML file. Google Earth would display the track

taken by the user on Google Maps and it would show the decibel data at various points along the track. Google Earth can also draw a graph of all

the decibel data which would plot the levels where it was high and the range of locations where it was high.

- Etekcity® Sound Level Meter -- we used this device, which meets the standards of IEC (International Electrotechnical Commission) & ANSI

(American National Standards Institute), to confirm that the Decibel 10th app provided accurate decibel information.

- We used Google Forms to collect and analyze survey data.

For our research we used the Internet, especially the PubMed database, and we used our local library. We used Word to write our document,

Excel to analyze our data and PowerPoint to create the file with our pictures, drawings and data. We also used PowerPoint at our regular

meetings to show to our teammates and coach our progress and or our assignments.

(8) Explain how you built your prototype(s) or model(s) ? Include each of the steps in your process.

The first step in the process of developing our prototype program was to identify requirements for our software based on the design statement we

created. Our goal was to generate a set of data that would provide information on the decibel levels recorded at periodic intervals and the location

at which that decibel data was recorded. Based on our research, we learned that there were existing apps (Google Search and Decibel 10th) that

could accurately provide us with the data regarding decibel measurements and location. The Team set out to integrate data from these programs

to produce the desired output.

There were certain shortcomings the Team identified in using this approach instead of creating an app that did everything itself. Our approach

required the user to follow instructions for downloading the data and utilize a computer to produce the final product (the map with decibel and

location information). However, given the limited time that we had to produce the program, we felt that producing the Decibel mApp program at

this initial stage as a program rather than an app was reasonable and the resulting product accomplished our goal of alerting the user to where he

might be experiencing dangerous levels of noise.

The next step in our design process was determining how to use the geographic data that we received from Google Location Services and the

decibel data from Decibel 10th. We wrote the Python code to combine the two sets of data (CSV data regarding decibel levels and KML data

regarding geographic location) and produce a new set of data (KML data with embedded decibel data) that can be viewed in map form by the

user.

We needed to identify any shortcomings of the data that would be used by our program and then compensate for it. The first hurdle we hit was

the difference in intervals in which the Google Location Services recorded data and in which the Decibel 10th app recorded data. Google Location

Services recorded in an inconsistent manner based on the level of activity. It could be as short as a minute or as long as several minutes. In

contrast, the Decibel 10th app was more predictable and records decibel information at an interval that is set by the user and ranges from 2 to 10

seconds.

In our first attempt at writing the program, we took the location data and set out to map the decibel values recorded at that time. The problem was

that there were a few samples which did not convey enough information about geographic location because of the way Google Location Services

records location data. At this point, we went back to the design phase to figure out a way to use all the decibel data. We decided that it was more

important to accurately convey the decibel data even if the corresponding location data was slightly off due to the differing intervals. As a result,

our fix was to use all the decibel data we received, and provide an approximation of the location for those times for which we did not have exact

location information. Between each location there would be many hundreds of decibel data samples. We initially had the program take each piece

of decibel data and use the location previous to that time to provide a reasonable approximation of the user’s location.

The next problem we encountered, however, was that Google Earth is a location based software, and it continuously rejected duplicate data about

geographic location. Our solution to this problem was to have the program alternate the previous and subsequent location for every decibel data

sample between two given locations. On the map it would look like the user was traveling back and forth between two points, but we decided that

the decibel data was of more importance than the exact locality. Using this solution, our program provides the user with a reasonable, although not

perfect, estimate of the location at which the decibel data samples were recorded.

The final step in our prototype design process was to field test the program and produce sample output that we could use to verify that the

prototype program was accurately producing information regarding the user’s location with the associated decibel levels.

An overview of how the Decibel mApp program works is provided at pg.19 of the Attachments. The code the Team created for the Decibel mApp

program is shown at pages 20-21 of the Attachments.

Test Prototype

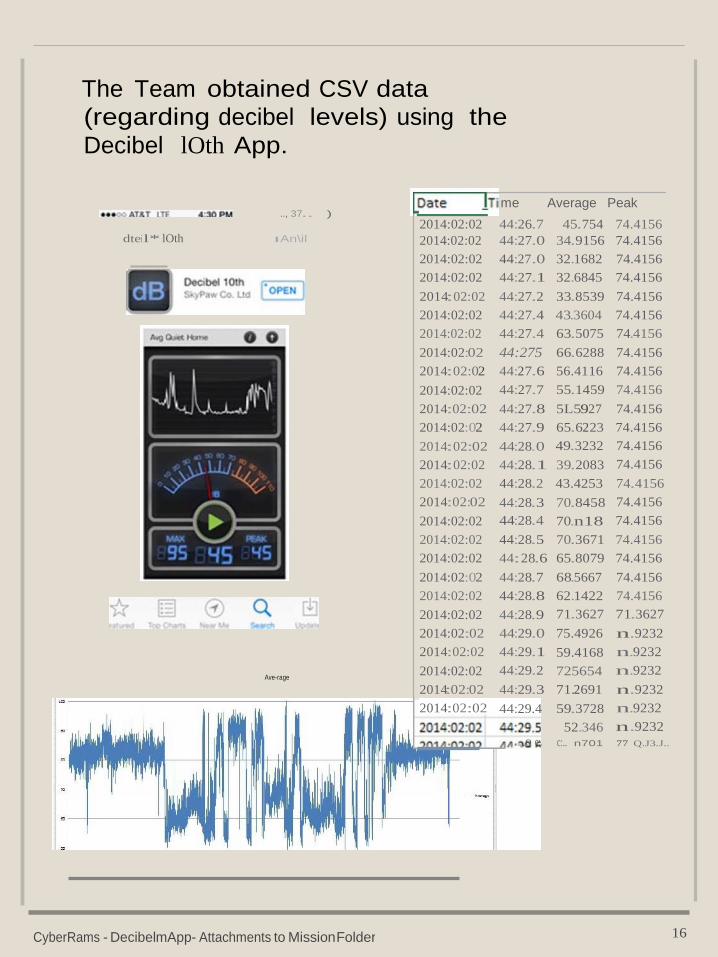
(9) Describe the data you collected and observed in your prototype testing (use of data tables, charts, and/or graphs are encouraged).

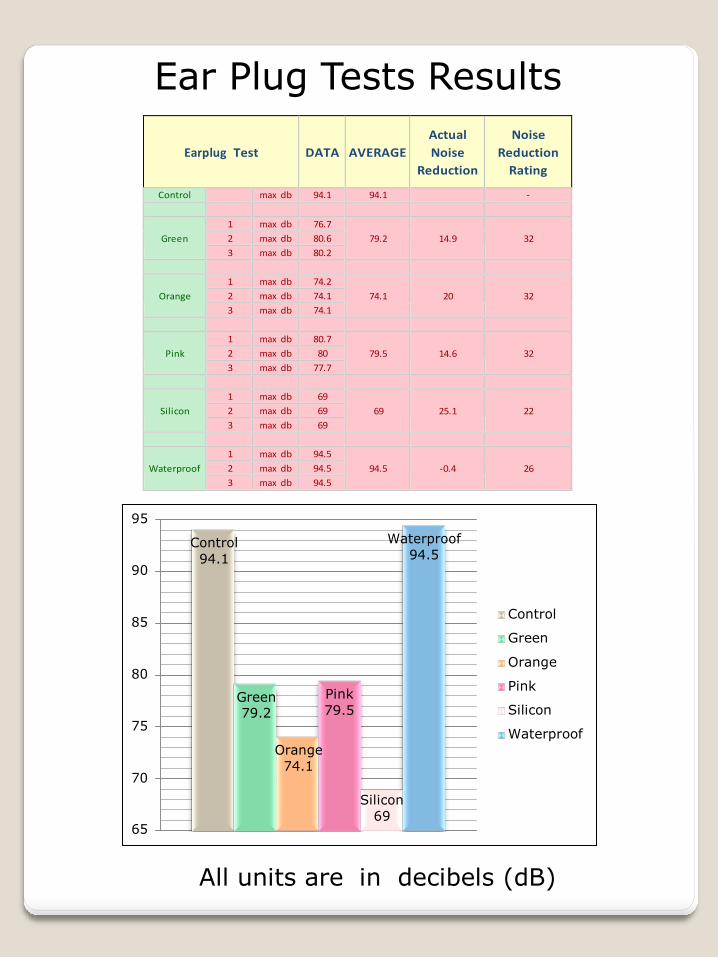
Before we tested our prototype software, we needed to determine whether our computer program could rely on data on decibel levels reported by

the decibel meter app. Since we determined that the free Decibel 10th app would be used to provide data on decibel exposure, we tested it

against the Etekcity® Sound Level Meter, which is a device that meets the standards of IEC (International Electrotechnical Commission) & ANSI

(American National Standards Institute) for Type 2 (general purpose for field use) sound level meters. Team member Diego played the snare

drum, Rishabh played the saxophone, and Ravi played the trumpet, while Aditya measured the sound levels with the two devices. On the basis of

this testing, the Team concluded that the Decibel 10th data varied according to the sensitivity of the iPhone microphone. To compensate for this

difference, the Team calibrated the Decibel 10th app by adjusting the sensitivity settings as follows:

iPhone model Decibel 10th Setting (gain)

iPhone 4 -1.7

iPhone 5 -0.5

iPhone 5s +4.3

With this calibration, the Decibel 10th app will provide reliable data regarding decibel levels for our computer program. See pg. 22 of the

Attachments.

Then, we tested our Decibel mApp program with the following process:

1. The user ensures that the two required apps are installed on his smartphone: Decibel 10th and Google Search.

2. The user logs in to Google Search with a gmail ID in order to record his location.

3. The user runs the Decibel 10th program keeping the smartphone as close as possible to the user’s ear.

4. At the end of the test period, the user emails the CSV file from his smartphone to his email address. Decibel 10th has the ability to send the

CSV file to any email address as an attachment. On the main screen of Decibel 10th, the user touches the top of the screen and this brings up a

window offering choices as “Send data to email,” “Clear graph” and “Close”. The user selects “Send data to email.” This will bring up a screen

similar to “Compose Message” on any email tool. The user enters the “To:” address field and clicks on “Send.” The CSV file will be attached to this

email.

5. The user opens the Google chrome browser on his computer and logs in to the Gmail account which will be used for all the Google tools. Then

the user goes to Google Dashboard (which allows the user to manage data collected by Google about them) and scrolls down to “Location

History”. There the user clicks on “View Location History” and clicks on “Export KML”. This will export the location history as a KML file on the

user’s Downloads directory. This is the file that would be needed for step 7.

6. The user downloads the CSV file from his email.

7. At this point the user has a CSV and KML file. He puts both files in the same computer directory as the Python script on the computer. The

Python script looks for these two specific files in that same directory to run the script on (this is a requirement of the Python script -- the program is

not yet able to handle files in different directories).

8. The user changes the name of the file in the Python script to be the new CSV and KML file.

9. The user runs the Python script, which creates a new KML file (the location data) with the decibel data embedded within.

10. The user opens Google Earth and then opens the new KML file, which shows the track with the decibel data along the track. The “track” is the

path that was taken over the period in which the test was conducted. This plots all the periodic coordinates onto a map and joins all these

coordinates using straight lines. The geographic coordinates and the decibel level at such coordinates will be displayed.

11. When the KML file is opened up by Google Earth, it will show the track with the decibel data. To get a relative comparison of location, time and

decibel data, the user right clicks on “Latitude User” (this is the default setting for the KML data which we have not changed). Then the user clicks

on “Show Elevation Profile”. This will bring up a graph with the decibel data, elevation and speed. The user would not need the elevation or the

speed for the purposes of this program so the user click on decibel. This will graph the decibel values as the Y -Axis and time as the X -Axis. The

graph will indicate the different decibel levels over the period of time tested and clicking on an area on the graph will show the location on the map

above.

(10) Analyze the data you collected and observed in your prototype testing. Does your data support or refute your design statement? Do

not answer with yes or no. Explain your answer using 'Our data supports/refutes the design statement because...'

After performing the testing above, the data collected is indicated at pg. 23 of the Attachments. Our data supports the design statement because

the output of the program regarding decibel level and location matches that which was experienced by the user. For example, in the data

presented at pg. 23 of the Attachments, Team member Rishabh was traveling to Langley High School to perform at a band assessment concert.

The output of the Decibel mApp program shows that during the car trip to the concert, the average decibel level was around 80 dB, principally due

to music from the car radio. While waiting for the concert to start, the decibel level dropped to around 54 decibels, and when the bands starting

playing the concert, the decibel level rose to a maximum of 100 decibels (see Attachments, page 23). This output was consistent with the

observed decibel levels and locations of the user. Therefore, the data supported the design statement because the Decibel mApp program

successfully manipulated the CSV and KML data to produce an accurate map of the user’s noise exposure.

(11) Explain any sources of error and how these could have affected your results

As described above, one source of error that we encountered was the rate at which the apps that provide data to our program (Decibel 10th and

Google Search) operate. Google Location Services only records location information if there is a movement. Moreover, when there is movement,

Google Location Services records data once every minute to once every few minutes. The Decibel 10th app, on the other hand, records data

about decibel levels at a minimum of 2 readings per second. The result of this inconsistency is that there may be decibel data without

correspondent location data. To address this problem, an entry was created for every Decibel 10th entry with the location that coincides in that

time range. This could be either the location data from before the time period or after the time period. We alternated each one (before or after) for

the different decibel data. The result of this is that the graph may display a slightly jumpy location but it should be a very good approximation of the

location of where the decibel data was recorded.

Drawing Conclusions

(12) Interpret and evaluate your results and write a conclusion statement that includes the following: Describe what you would do if you

wanted to retest or further test your design. Evaluate the usefulness of your prototype or model. What changes would you make to your

prototype or model for the future, if any?

Our Team set out to create a prototype which would provide the user with information regarding the decibel levels to which he was exposed

during the day and the locations at which those exposures were recorded. Our testing of the program indicated that the program works as

intended.

In order to further test our design, our Team would continue to gather data about decibel levels and location using Decibel 10th and Google

Search, and compare the resulting file in Google Earth with the sound levels and locations we noted at periodic times. While we did this multiple

times during our testing phase, further testing would give us even greater confidence that the Decibel mApp program was working as intended.

Our first version of this program was intended to test out our basic design, and now that we know it works, we have identified a number of

improvements that could be used to make our program even more user friendly and useful for the average user. Currently, the program does not

track cumulative exposures, but the program could be modified to provide this information. The CSV data provided by Decibel 10th includes the

time at which the decibel measurement was done, so it would be relatively simple to calculate cumulative exposures for an individual. Another

idea for improving our design is to show the map in Google Earth with a color coded display that reflects peak and average decibel values. Right

now, we only show the average decibel levels.

The next step in developing the program would be to make the whole process automated and more user friendly. In the current beta version of the

prototype, the data from Decibel 10th and Google Search must be exported by the user and the program in turn provides data that can be read by

Google Earth so that the user sees a map of locations with decibel information indicated.

In the future, we anticipate that this program can provide the basis for its own app (the “Decibel mApp”) in which all these processes would be

automated. The app could have a feature whereby the user is alerted when noise levels are excessive, or continue for a period at which the user’s

hearing could be permanently damaged. To make the app for an iPhone, the team could write a program in Objective C, which is a language used

by Apple and developers for Apple to create apps for the iPhone. The Objective C program would merge the data and use the Google Earth App

to read the KML file, however the process would take a great deal more time because Objective C is not as user friendly as Python. Another

option the Team could pursue would be to create the app for the Android platform which uses the Java programming language.

Community Benefit

(1) How could your design help solve your problem and benefit your community ? Describe next steps for further research/design and how

you have or how you could implement your solution in the future.

Our design is intended to provide important information to kids and their parents about excessive noise levels to which kids are exposed

throughout the day, and pinpoint locations at which kids should be wearing hearing protection. Our program will take information gathered with the

user’s smartphone regarding decibel levels and link it to GPS data. At the end of the day, the user and his or her parent can get a report about the

levels of noise exposures throughout the day and the locations at which the user was exposed.

We believe that the benefits of our design are significant and useful. Noise-induced hearing loss is a growing problem in our community and the

world in general. The problem is that most kids don’t know the noise levels to which they are being exposed to and what damage that can do in

the long term.

Our first effort was made for the iPhone but future models can be made for Android devices. The Team would need to identify a program similar

to Decibel 10th for the Android platform that could export CSV data regarding decibel levels. In order to test whether the program is having its

intended effect of changing behavior by alerting people as to their noise exposure throughout the day, the Team could also distribute another

survey to users of the program to evaluate whether the users’ behavior has changed. The Team could use Google Forms to carry out such a

survey since it had success with this approach during the current project.

Our Team believes that this device can be a key element in a program to reduce noise-induced hearing loss. We anticipate that in addition to

program, information about noise-induced hearing loss is key. The Team has already been working to get the word out in our community. The

Team contacted staff from The National Institute on Deafness and Other Communication Disorders (NIDCD), who provided the Team with

information regarding noise-induced hearing loss and literature (bookmarks and information sheets and posters). See pg. 24 of the Attachments.

Team members have placed posters regarding the issue of noise-induced hearing loss around school after getting permission from a school

administrator. Also, on Saturday, February 22, 2014, our Team was invited to attend the Fairfax County Public Schools STEM-H (science,

technology, engineering, math, and health and medical sciences) Expo, where we talked with community members about noise-induced hearing

loss. Pictures of the event are provided at pg. 25 of the Attachments. The Team is currently coordinating with NIDCD and our school

administrators about having NIDCD give a presentation to the student body this spring about noise-induced hearing loss, possibly in connection

with the Health curriculum at our school.

Uploaded Files:

• [ View

]

• [ View

]

Attachments Part I of II (By: Advisor, 03/02/2014, .pptx)

This is Part I of the Attachments to the Mission Folder

Attachments Part II of II (By: Advisor, 03/02/2014, .pptx)

This is Part II of the Attachments to the Mission Folder

1 CyberRams - Decibel mApp - Attachments to Mission Folder

D cibel mApp

Research Regarding Causes of Noise-Induced

Hearing Loss

Drawing of the auditory system of the human ear, and a picture of stereocilia (microscopic projections) on top of sensory hair cells in the inner ear (http://www.nidcd.nih.gov/health/hearing/pages/noise.aspx)

2 CyberRams - Decibel mApp - Attachments to Mission Folder

Team Meetings with Subject Matter Experts

The Team met Dr. Vicki Owczarzak, a pediatric otolaryngologist, and an audiologist, regarding medical causes of noise-induced hearing loss and learned how doctors test for hearing loss.

3 CyberRams - Decibel mApp - Attachments to Mission Folder

Research Regarding Decibel Levels

http://www.dangerousdecibels.org/education/information- center/decibel-exposure-time-guidelines/

http://www.epd.gov.hk/epd/noise_education/web/ENG_E

PD_HTML/m1/intro_5.html

4 CyberRams - Decibel mApp - Attachments to Mission Folder

Research

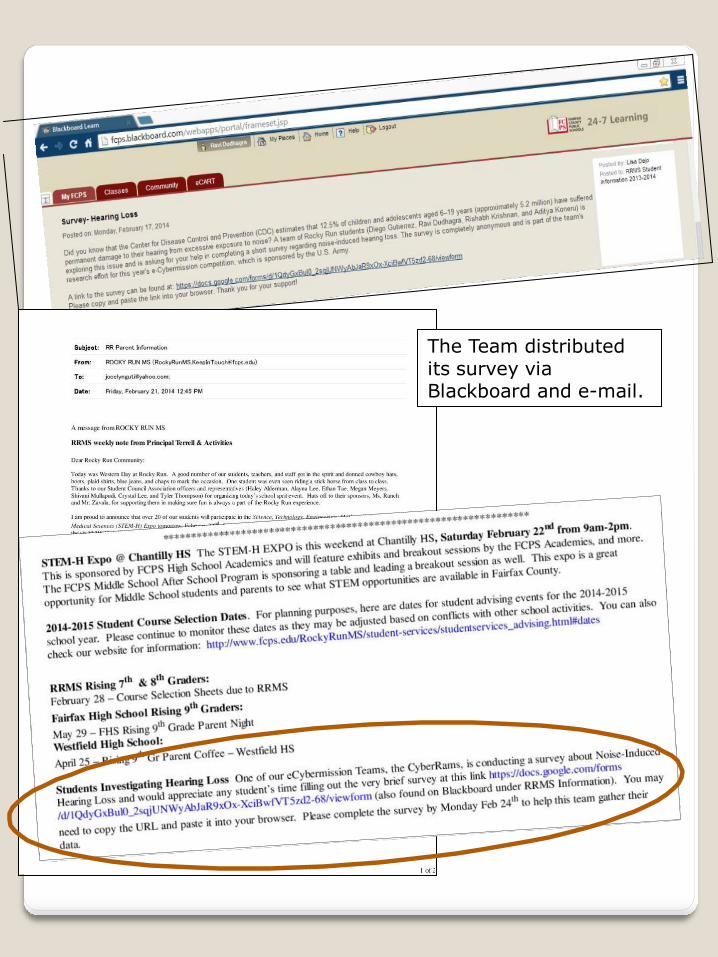
As part of our research effort, the team conducted a survey of 247 people in our community regarding noise- induced hearing loss. We inputted the data on Google Forms, which collected the data in an online spreadsheet.

5 CyberRams - Decibel mApp - Attachments to Mission Folder

The Team distributed its survey via Blackboard and e-mail.

The Team also distributed copies of its survey regarding

noise-induced hearing loss at school and a community

event.

CyberRams - DecibelmApp - Attachments to MissionFolder 6

7 CyberRams -DecibelmApp- Attachments to MissionFolder

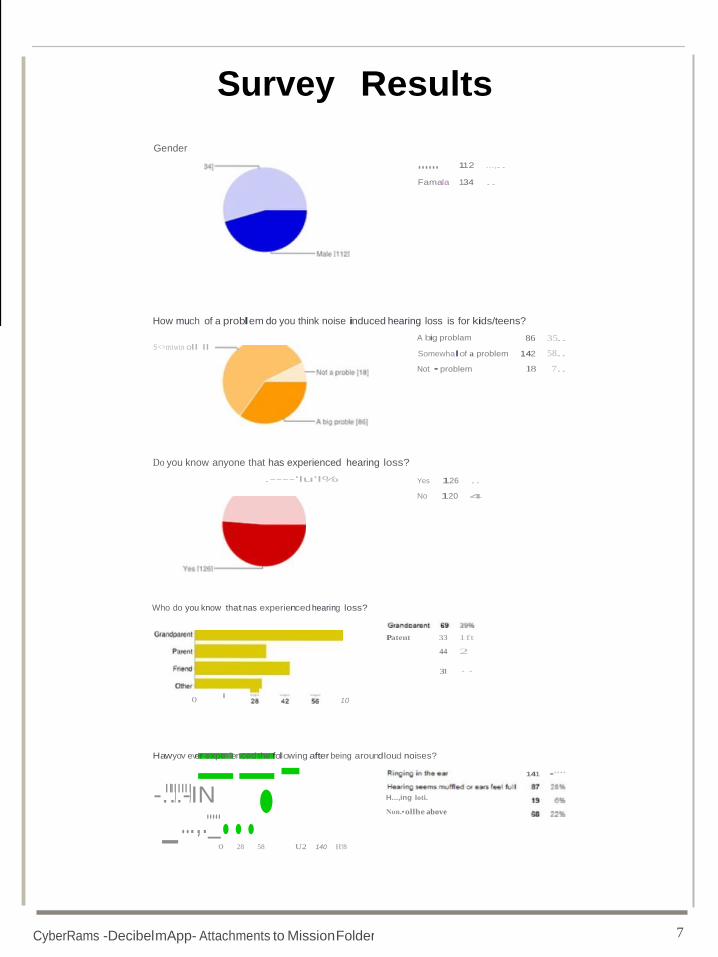
A big problam 86 35.. Somewhalof a problem 142 58.. Not • problem 18 7..

_ ...•

Survey Results

Gender

...... 112 ...,..

Famala 134 ..

How much of a problem do you think noise induced hearing loss is for kids/teens?

S<>mtwtn oll ll

Do you know anyone that has experienced hearing loss?

.----'lu'l%

Who do you know that nas experienced hearing loss?

Yes 126 ..

No 120 4

Patent 33 1ft

44 2

0 · 10

31 ··

Ha.w..y,o..v.e,v=er experie=nced the fo-llowing after being aroundloud noises?

-...-IN.....

H...,ing loti.

141 •'"'

...,._ 0 28 58 U2 140 H!8

Non.• ollhe above

8 CyberRams -DecibelmApp- Attachments to MissionFolder

Alway. 13 5 Usually 4.4 18" O.:X:.•ic>nal ty 69 28.. Neve< 120

Idon1thinIneed lhem 111 2G'I6 They ate uncomfortabl e 38 8'16 They 1oo1c <sl y"' weird 22 5'Mo

...

Ollie<

,,.

Survey Results (cont.)

Has anyone told you that you should wear hearing protection around loud noises?

.----Nu' Ye 130 53'11.

No 116 ·-

Who told you?

P tent

T•ac:hoo 0< school -

OOoCcIl\oer­

Patent

Teacher 0< schooloHocrol 28 • 7

Doctot 22 • 3

Olhe< 28 .,

0 •• 36 54 72 90 108

Oo you wear ear protectton around lOUd noises?

12'

N...,. ••3J · Oceaslortaty " Uo-,[44'

Please indicate why you don't always wear hearing protection

ldon't tlirrllln..

They are uncomto< -

They look <9YOt •

I don,hiYe any -·

I 001n know""-' -

They.,.too e.:pe. I

I C410,'-tf*IP -

They don,block -

I lOst !hen\ I

0 23 46 6i 92 115 138

Idon1 have any to "ear 96 21

Idon1<now wh..e to get lhem 43 10'16

They-too expemlv. 8 2

Ic:en t l-ear peQ91e talto me "he., Iuw them 10'16

Th"Y doni blod:out loud no·- 26 e:w,

Il ost them 6

Other 4S '1'16

9 CyberRams -DecibelmApp- Attachments to MissionFolder

None 41 17 Less than one hoo.. 83 1-2 hours 58 2c 2-3 hours 12 3-4 hours 22 9 4-,5 houn 5 2 5-e hOUB 8 3 II+ noun 17 7

· .

Survey Results (cont.)

How many hours per day do you use headphones or ear buds to listen to music,movies,games,etc.?

... • ,.!2)

1 2 hOurS (58) · 5 h

Houhno(uStI1181

-&- hOurS (11)

Leu• onta31

Notle(41(

What volume do you use your headphones or ear buds at?

r-- lr""" t IFZ] I don't knew

Sometimes loud

Generally loud

24 12'1f. 58 28'1fo

51 25'1fo

Do you have a smartphone?

don'l "'-(24)

I neve< listen toloud volume on my he•dphon.s or ear buds 72 35'1fo

What type of smartphone(s) do you have?

181

Yes 157

No 89 3e'lfo

Appl e 106 07

Android 44 28%

Other 8

10 CyberRams - DecibelmApp- Attachments to MissionFolder

Additional Team Meetings with Subject Matter Experts

The Team met with Dr. Michael Ardaiz regarding public health aspects of noise-induced hearing loss.

11 CyberRams - DecibelmApp- Attachments to MissionFolder

Ear Plug Testing

Testing device created

Ear plugs tested

Testing of ear plugs

12 CyberRams - DecibelmApp- Attachments to MissionFolder

Screenshot of the sound wave created with

“Audacity,” an audio editing software

Screenshot of “VSLM” (Virtual Sound Level Meter) - shown is the graph corresponding to the control test

13 CyberRams - DecibelmApp- Attachments to MissionFolder

"" "" ""

.. .. ..

"" "" ""

"" "" "" 00 00 00

.. .. ..

"" "" ""

r r . r

"" "" ""

.. .. ..

Green

Sound Pf'KW't ._...,., Sound Pf'KW't ._...,., Sound Pf'KW't ._...,.,

00 00 00

00 00 00

lll ·r-- "' "' 1,0..",' 1,0..",' 1,0..",'

Plugs " <0 " <0 " <0 Data >

.,l >

.,l >

.,l

10 10 10

00 0$ • • ' ,. 4S 00 0$ • • '

,. 4S 00 0$ • • ' ,. 4S

w- e Mr:tf $pH.d . l w- e

Mr:tf $pH.d .l w- e Mr:tf $pH.d . l

'-or.xa)'G' d(L11la29 uc .ar.xaeoe dG .11la29 uc '-or.x42 dO .u la30 uc

Sound Pf'KW't ._...,., Sound Pf'KW't ._...,., Sound Pf'KW't ._...,.,

00 00 00

00 00 00

Orange "' ,....-. "' ,-- "' .--

1,0..",' 1,0..",' 1,0..",' Plugs " <0 " <0 " <0 Data >

.,l >

.,l >

.,l

00 0$ • • ' ,. ..

00 0$ • • '

,. .. 4S 00 0$ • • ' ,. .. 4S

10 10 10

4S

w- e Mr:tf $pH.d .l w- e Mr:tf $pH.d .l w- e Mr:tf $pH.d .l '-or.xa)'4 2 dG .111a2a UC '-or.xa)'4 l dG .111a2a UC '-or.xa4' l dO .U la30 UC

Sound Pf'KW't ._...,., Sound Pf'KW't ._...,., Sound Pruwt ._...,.,

00 00 00

"' "' ,., .,..-----

Pink 1,0..",' 1,0..",' .",'

Plugs " <0 " <0 " .. Data >

.,l >

.,l >

.,l

10 10 10

00 0$ • • ' ,. •• 00 0$ • • '

,. •• 00 0$ • • ' ,. ••

wc Mr:tf $pH-cl . l wc Mr:tf $pH-cl . l wc Mr:tf $pH.d . l '-or.x4? d0.11la29uc .ar.xaeoodO .11la29 uc '-or.xa)'t? dl).llla29uc

L Sound Pf'KW't ._...,., Sound Pf'KW't ._...,., Sound Pruwt ._...,.,

00 00 00

00 00 00

Silicone "' 1,0..",'

"' 1,0..",'

"' ",'

Plugs " <0 " <0 " .. Data >

.,l >

.,l >

.,l

00 0$ • • ' ,. ..

• 00 0$ • • '

,. .. •• 00 0$ • • ' ,. .. ••

10 10 10

wc Mr:tf $pH-cl . l wc Mr:tf $pH-cl . l wc Mr:tf $pH.d . l '-or.xaG90 dt) .11lala"' '-or.xaG90 dt) .11lala"' '-or.x40dl).lllalauc

Sound Pf'KW't ._...,., Sound Pf'KW't ._...,., Sound Pf'KW't ._...,.,

00 oolr-" 00

00 00 00

Waterproot ""'' "' "' 1,0..",' 1,0..",'

Plugs Data; : " <0 " .. >

.,l >

.,l >

.,l

10 10 10

00 0$ • • ' ,. 4S 00 0$ • • '

,. 4S 00 0$ • • ' ,. 4S

w- e Mr:tf $pH.d .l w- e Mr:tf $pH.d .l w- e Mr:tf $pH.d .l '-or.x*5 dG .11lal 9 UC '-or.x*5 dG .111a1a uc '-or.x*5 dO .u1a1a uc

14 CyberRams - DecibelmApp- Attachments to MissionFolder

Ear Plug Tests Results

Earplug Test

DATA

AVERAGE

Actual

Noise

Reduction

Noise

Reduction

Rating

Control max db 94.1 94.1 -

Green 1 max db 76.7

79.2

14.9

32 2 max db 80.6 3 max db 80.2

Orange 1 max db 74.2

74.1

20

32 2 max db 74.1 3 max db 74.1

Pink 1 max db 80.7

79.5

14.6

32 2 max db 80 3 max db 77.7

Silicon 1 max db 69

69

25.1

22 2 max db 69 3 max db 69

Waterproof

1 max db 94.5 94.5

-0.4

26 2 max db 94.5

3 max db 94.5

95

Control

94.1 90

Waterproof

94.5

85

80

Green 79.2

75

Orange

74.1 70

65

Pink

79.5

Silicon

69

Control

Green

Orange

Pink

Silicon

Waterproof

All units are in decibels (dB)

15 CyberRams - DecibelmApp- Attachments to MissionFolder

GPS Technology

The Team visited the Smithsonian exhibit on

GPS technology.

We studied about Google Earth, and how KML code is used to display geographic data. Source: https://developers.g oogle.com/kml/docu mentation/kml_tut

16 CyberRams - DecibelmApp- Attachments to MissionFolder

2014:02:02 44:26.7 45.754 74.4156 2014:02:02 44:27.0 34.9156 74.4156

2014:02:02 44:27.0 32.1682 74.4156

2014:02:02 44:27.1 32.6845 74.4156

2014:02:02 44:27.2 33.8539 74.4156

2014:02:02 44:27.4 43.3604 74.4156

2014:02:02 44:27.4 63.5075 74.4156

2014:02:02 44:275 66.6288 74.4156

2014:02:02 44:27.6 56.4116 74.4156

2014:02:02 44:27.7 55.1459 74.4156

2014:02:02 44:27.8 5L5927 74.4156

2014:02:02 44:27.9 65.6223 74.4156

2014:02:02 44:28.0 49.3232 74.4156

2014:02:02 44:28.1 39.2083 74.4156

2014:02:02 44:28.2 43.4253 74.4156

2014:02:02 44:28.3 70.8458 74.4156

2014:02:02 44:28.4 70.n18 74.4156

2014:02:02 44:28.5 70.3671 74.4156

2014:02:02 44:28.6 65.8079 74.4156

2014:02:02 44:28.7 68.5667 74.4156

2014:02:02 44:28.8 62.1422 74.4156

2014:02:02 44:28.9 71.3627 71.3627

2014:02:02 44:29.0 75.4926 n.9232

2014:02:02 44:29.1 59.4168 n.9232

2014:02:02 44:29.2 725654 n.9232

2014:02:02 44:29.3 71.2691 n.9232

2014:02:02 44:29.4 59.3728 n.9232

.....,0 c:.

52.346 c:.. n701

n.9232

77 Q.J3.J..

The Team obtained CSV data

(regarding decibel levels) using the

Decibel lOth App.

.., 37.. )

dteil* lOth IAn\il

Ave-rage

me Average Peak

17 CyberRams - DecibelmApp- Attachments to MissionFolder

KML code

Google Search provides the KML data that will give information about a user’s geographic location.

18 CyberRams - DecibelmApp- Attachments to MissionFolder
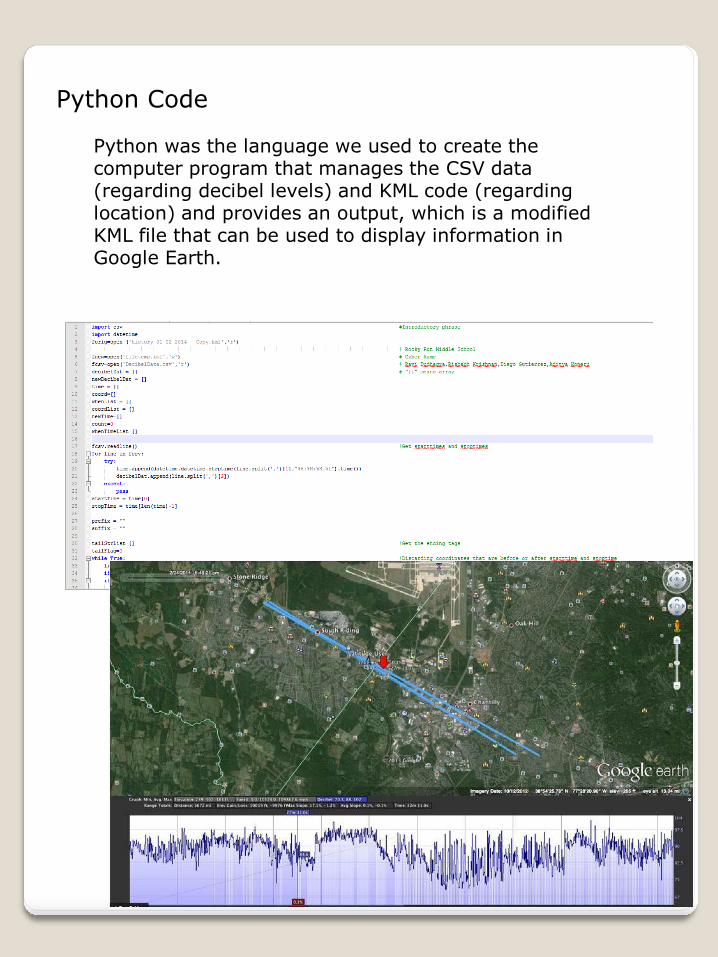
Python Code

Python was the language we used to create the computer program that manages the CSV data (regarding decibel levels) and KML code (regarding location) and provides an output, which is a modified KML file that can be used to display information in Google Earth.

Future

Mobile App

CyberRams - Decibel mApp - Attachments to Mission Folder 19

20 CyberRams - Decibel mApp - Attachments to Mission Folder

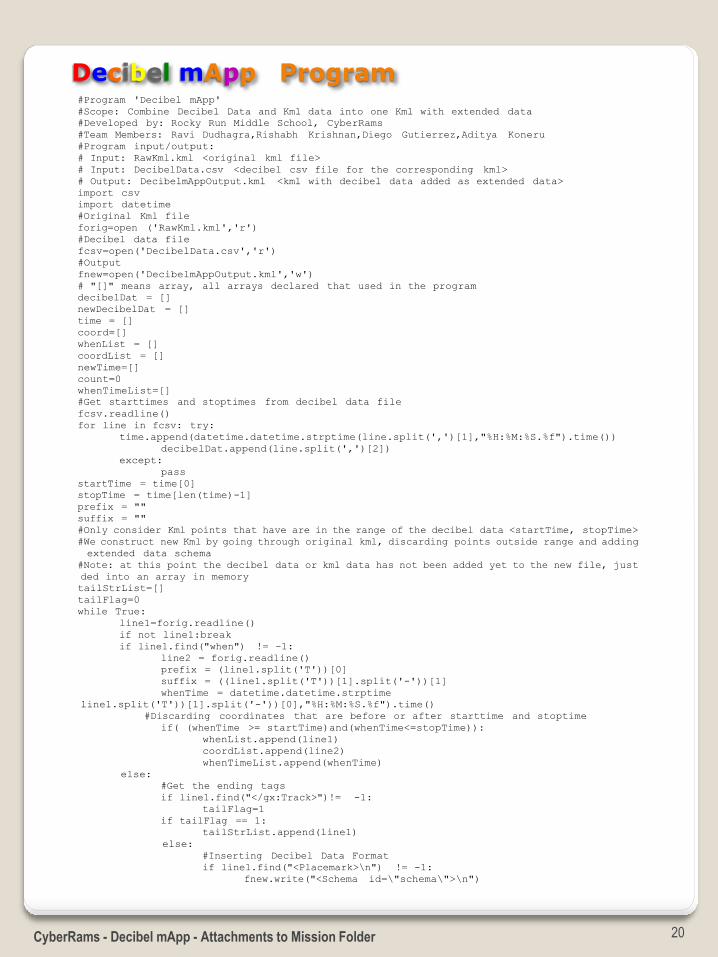
Decibel mApp Program

#Program 'Decibel mApp'

#Scope: Combine Decibel Data and Kml data into one Kml with extended data

#Developed by: Rocky Run Middle School, CyberRams

#Team Members: Ravi Dudhagra,Rishabh Krishnan,Diego Gutierrez,Aditya Koneru

#Program input/output:

# Input: RawKml.kml <original kml file>

# Input: DecibelData.csv <decibel csv file for the corresponding kml>

# Output: DecibelmAppOutput.kml <kml with decibel data added as extended data>

import csv

import datetime

#Original Kml file

forig=open ('RawKml.kml','r')

#Decibel data file

fcsv=open('DecibelData.csv','r')

#Output

fnew=open('DecibelmAppOutput.kml','w')

# "[]" means array, all arrays declared that used in the program

decibelDat = []

newDecibelDat = []

time = []

coord=[]

whenList = []

coordList = []

newTime=[]

count=0

whenTimeList=[]

#Get starttimes and stoptimes from decibel data file

fcsv.readline()

for line in fcsv: try:

time.append(datetime.datetime.strptime(line.split(',')[1],"%H:%M:%S.%f").time())

decibelDat.append(line.split(',')[2])

except:

pass

startTime = time[0]

stopTime = time[len(time)-1]

prefix = ""

suffix = ""

#Only consider Kml points that have are in the range of the decibel data <startTime, stopTime>

#We construct new Kml by going through original kml, discarding points outside range and adding

extended data schema

#Note: at this point the decibel data or kml data has not been added yet to the new file, just

ded into an array in memory

tailStrList=[]

tailFlag=0

while True:

line1=forig.readline()

if not line1:break

if line1.find("when") != -1:

line2 = forig.readline()

prefix = (line1.split('T'))[0]

suffix = ((line1.split('T'))[1].split('-'))[1]

whenTime = datetime.datetime.strptime

line1.split('T'))[1].split('-'))[0],"%H:%M:%S.%f").time()

#Discarding coordinates that are before or after starttime and stoptime

if( (whenTime >= startTime)and(whenTime<=stopTime)):

whenList.append(line1)

coordList.append(line2)

whenTimeList.append(whenTime)

else: #Get the ending tags

if line1.find("</gx:Track>")!= -1:

tailFlag=1

if tailFlag == 1:

tailStrList.append(line1)

else: #Inserting Decibel Data Format

if line1.find("<Placemark>\n") != -1:

fnew.write("<Schema id=\"schema\">\n")

21 CyberRams - Decibel mApp - Attachments to Mission Folder

e=\"int\">\n")

fnew.write("<Schema id=\"schema\">\n")

fnew.write(" <gx:SimpleArrayField name=\"dec_level\"

fnew.write(" <displayName>Decibel</displayName>\n")

fnew.write(" </gx:SimpleArrayField>\n")

fnew.write("</Schema>\n")

fnew.write(line1)

decibelCount = len(decibelDat)

index = 0

#Reconstructing time in KML form for all decibel data points as the sampling interval for decibel

a is different from that of kml

while index < decibelCount:

newTime.append(prefix+"T"+str(time[index])+"-"+suffix)

index = index+1

kmlVal = []

for timeVal in newTime :

whenIndex = 0

while(timeVal <= whenList[whenIndex]):

whenIndex = whenIndex+1;

if( whenIndex == len(whenList)):

break

kmlVal.append(timeVal)

kmlVal.append(coordList[whenIndex-1])

whenLen=len(whenList)

index=1

tmpcount=0

#Now, writing coordinates into the

while index<whenLen:

index2=0

flag=0

for item in time:

if item > whenTimeList[index-1] and item <= whenTimeList[index]:

fnew.write (newTime[index2])

if flag == 1:

fnew.write (coordList[index-1])

flag=0

else: fnew.write (coordList[index])

flag=1

newDecibelDat.append(decibelDat[index2])

tmpcount=tmpcount+1

index2=index2+1

index = index+1

#Writing Extended Data into output kml

fnew.write("<ExtendedData>\n")

fnew.write(" <SchemaData schemaUrl=\"#schema\">\n")

fnew.write(" <gx:SimpleArrayData name=\"dec_level\">\n")

for item in newDecibelDat:

fnew.write(" <gx:value>"+ str(int(float(item)))

/gx:value>\n" )

fnew.write(" </gx:SimpleArrayData>\n")

fnew.write(" </SchemaData>\n")

fnew.write("</ExtendedData>\n")

#Writing ending tags into document

for item in tailStrList:

fnew.write (item)

#Closing all files so that other programs can use them

forig.close()

fnew.close()

fcsv.close()

22 CyberRams - Decibel mApp - Attachments to Mission Folder

The Team tested a decibel meter vs. Decibel 10th.

iPhone model Decibel 10th Setting (gain)

iPhone 4 -1.7 iPhone 5 -0.5

iPhone 5s +4.3

23 CyberRams - Decibel mApp - Attachments to Mission Folder

data

Decibel mApp Testing Feb 28, 2014

Date Time Average Peak

2014:02:28 16:38.8 96.3673 99.01092 Snippet of 2014:02:28 16:39.3 87.83236 99.01092

2014:02:28 16:39.8 93.26693 99.01092 Decibel 2014:02:28 16:40.3 90.49622 94.92213

2014:02:28 16:40.8 91.00594 94.92213 10th raw 2014:02:28 16:41.3 91.49837 94.92213 2014:02:28 16:41.8 96.42691 99.76108

2014:02:28 16:42.3 93.26795 99.76108

2014:02:28 16:42.8 80.20666 97.85725

2014:02:28 16:43.3 57.43231 97.85725

2014:02:28 16:43.8 83.07713 97.85725

2014:02:28 16:44.3 92.31125 97.85725

2014:02:28 16:44.8 100.2467 100.2467

2014:02:28 16:45.3 90.40968 99.4125

2014:02:28 16:45.8 91.22826 99.4125

2014:02:28 16:46.3 91.31702 99.4125

2014:02:28 16:46.8 92.24198 99.4125

2014:02:28 16:47.3 91.33096 99.4125

2014:02:28 16:48.3 92.33073 98.38608

2014:02:28 16:48.5 81.85039 98.38608

2014:02:28 16:48.8 68.25811 98.38608

2014:02:28 16:49.3 56.00425 98.38608

2014:02:28 16:49.8 58.60161 98.38608

2014:02:28 16:50.3 68.23362 68.49931

2014:02:28 16:50.8 58.59604 68.49931

2014:02:28 16:51.3 67.39694 68.49931

2014:02:28 16:51.8 62.28712 74.40028

2014:02:28 16:52.3 62.49169 74.60365

2014:02:28 16:52.8 65.7199 83.71882

2014:02:28 16:53.3 61.88909 83.71882

Snippet of

Location raw data

Decibel mApp output shown with Google Earth

Max value 100.2667 db

Rocky Run MS band concert

24 CyberRams - Decibel mApp - Attachments to Mission Folder

The Team contacted the National Institute on Deafness and Other Communication Disorders (NIDCD) and distributed literature to the community after conducting surveys.

25 CyberRams - Decibel mApp - Attachments to Mission Folder
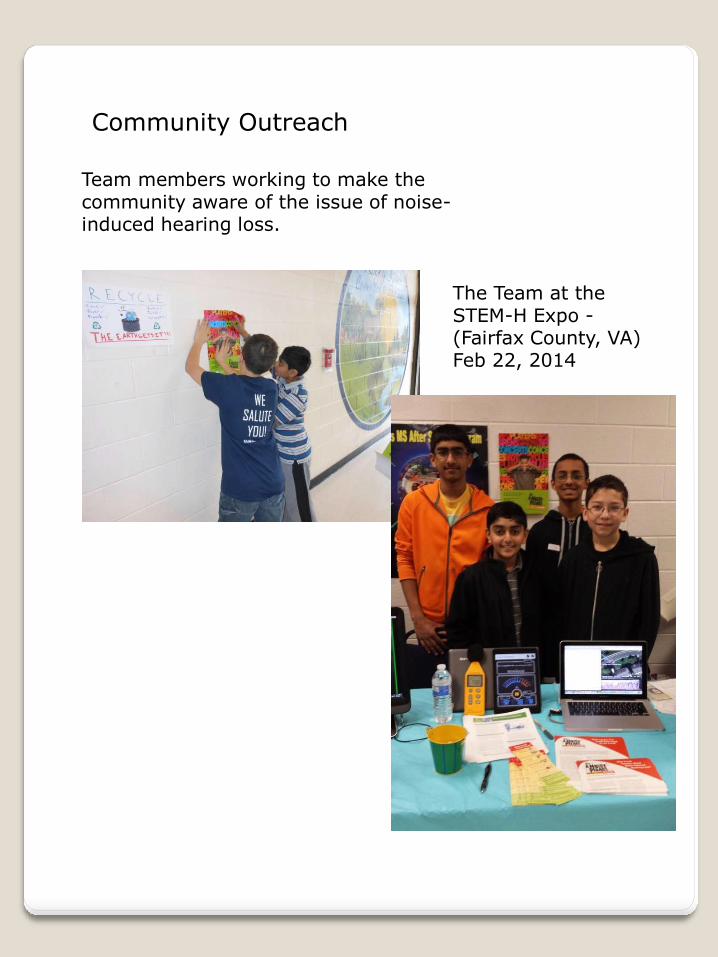
Community Outreach

Team members working to make the community aware of the issue of noise- induced hearing loss.

The Team at the STEM-H Expo - (Fairfax County, VA) Feb 22, 2014


Recommended