Cybersecurity in the Remote Work Era: A Global Risk Report Ponemon Institute, October 2020
Part 1. Executive summary COVID-19 has dramatically changed the workplace and has created new cybersecurity risks and exacerbated existing risks. The purpose of this research, sponsored by Keeper Security, is to understand the new challenges organizations face in preventing, detecting and containing cybersecurity attacks in what is often referred to as “the new normal”. Ponemon Institute surveyed 2,215 IT and IT security personnel in the United States, United Kingdom, DACH, Benelux, Scandinavia and ANZ (Australia and New Zealand). All respondents in this research are in organizations that have furloughed or directed their employees to telework because of COVID-19. According to the findings, before COVID-19 an average of 22 percent of these organizations’ employees worked remotely and due to COVID-19 an average of 58 percent of employees now work remotely. An average of 33 percent of employees were furloughed. The remote work force has significantly reduced the effectiveness of organizations’ security posture. Respondents were asked to rate the effectiveness of their organizations’ IT security posture prior to and during the pandemic on a scale from 1 = not effective to 10 = highly effective. The very and highly effective responses are shown in Figure 1 and reveal a significant decline from 71 percent of respondents who believed their organizations were effective at mitigating risks, vulnerabilities and attacks across the enterprise prior to COVID-19 to only 44 percent of respondents during COVID-19. Figure 1. Effectiveness of organizations’ IT security posture prior to COVID-19 and due to COVID-19 1 = not effective to 10 = highly effective, 7+ responses presented
71%
44%
0%
10%
20%
30%
40%
50%
60%
70%
80%
Effectiveness prior to COVID-19 Effectiveness due to COVID-19
Following are reasons why the remote workforce has reduced the effectiveness of organizations’ cybersecurity posture. § In the new era of a remote workforce, organizations worry most about the lack of
physical security in the remote worker’s work space. Almost half (47 percent) of respondents say it is the inability to control risks created by the lack of physical security in remote workers’ homes and other locations that is a significant concern for their organizations.
§ Organizations are very concerned remote workers are putting them at risk for a data
breach and/or security exploit. Seventy-one percent of respondents are very concerned that remote workers are putting the organization at risk for a data breach and 57 percent of respondents say they are prime targets for those wishing to exploit vulnerabilities.
§ Understandably organizations were caught off-guard by the sudden lockdown due to
COVID-19. As a result, they were not prepared for the affect it would have on their ability to respond to a cyberattack. According to 56 percent of respondents, the time to respond to a cyberattack has significantly increased (21 percent) or increased (35 percent). Forty-two percent of respondents say their organizations have no understanding how to protect against cyberattacks due to remote working. Customer records and financial information are most vulnerable.
§ Remote working has increased access to business-critical applications. Most likely out
of necessity, 59 percent of respondents say access to business-critical applications has significantly increased (26 percent) or increased (33 percent). On average, organizations have 51 business-critical applications and an average of 56 percent of these are accessed from mobile devices such as smart phones and tablets.
§ Not all organizations are requiring remote workers to use authentication methods. If
they do, few are requiring multi-factor authentication. Almost one-third (31 percent) of respondents say their organizations do not require their remote workers to use authentication methods. Of the 69 percent of organizations that do require authentication, only 35 percent of respondents say multi-factor authentication is required.
§ BYOD has decreased organizations’ security posture. Sixty-seven percent of
respondents say remote workers’ use of their own mobile devices such as tablets and smart phones to access business-critical applications and IT infrastructure has decreased their organizations’ security posture. Further, smart phones, laptops and mobile devices are the most vulnerable endpoints or entry points to organizations’ networks and enterprise systems.
§ Since COVID-19 many organizations have had exploits and malware that evaded their
intrusion detection systems and anti-virus solutions. Fifty-one percent of respondents say exploits and malware have evaded their organizations’ intrusion detection systems and almost half (49 percent) of respondents say they have evaded their organizations’ anti-virus solutions.
§ Credential theft and phishing/social engineering are the most frequent types of
cyberattacks since COVID-19. Sixty percent of respondents say their organizations experienced a cyberattack. The most frequent attacks involved credential theft (56 percent of respondents) and phishing/social engineering (48 percent of respondents).
§ IT security budgets and in-house expertise need to increase. Only 45 percent of
respondents say their organizations’ IT security budget is adequate for managing and mitigating cybersecurity risks caused by remote workers and only 39 percent of respondents say their organization has the expertise to manage and mitigate cybersecurity risks caused by remote working.
§ Security risks due to remote working require a new effort to educate employees about
their responsibility to follow remote working policies. Fifty percent of respondents say their organizations have a policy on the security requirements for remote workers. Only 43 percent of respondents say their organizations currently have programs that inform and educate remote workers about the risks created by remote working.
§ Despite the increase in security risks as a result of remote working, less than half (47
percent) of respondents say their organizations are monitoring the network 24/7. More than half (53 percent) of respondents say their organizations are instituting the necessary security protocols to keep the network safe and 50 percent of respondents say their organizations are encrypting sensitive data stored on devices. However, less than half of respondents are monitoring the network and protecting company-owned devices with up-to-date anti-virus, device encryption and firewalls.
Part 2. Key findings In this report, we refer to teleworkers as remote workers. In the context of this research, teleworking enables employees and other users to work from locations other than the organization’s facilities. Teleworkers use various devices such as desktop and laptop computers, smartphones and tablets to read and send email, access websites, review and edit documents and perform many other tasks. These devices may be controlled by the organization, by third parties or by the users themselves (BYOD). Most teleworkers use remote access, which is the ability for an organizations’ users to access its non-public computing resources from external locations other than the organization’s facilities. In this section, we present an analysis of the research results. The complete audited findings are presented in the Appendix of this report. The report is organized according to the following topics. § Security posture & COVID-19 § Cybersecurity risks during COVID-19 § Data breach risks created by COVID-19 § The steps organizations are taking and should take to manage cybersecurity risks § Conclusion and recommendations Security posture & COVID-19 While remote working has reduced organizations’ costs, it has not made remote workers more productive and efficient. According to Figure 2, 60 percent of respondents say remote working has reduced costs, but the tradeoff is less productivity and efficiency. Fifty-six percent of respondents say their organizations expect remote working to become the new norm making it critical to assess the security risks created by a remote workforce. However, according to the research 45 percent of respondents say their organizations have not assessed remote working risks. Figure 2. Perceptions about the impact of teleworking on organizations Strongly agree and Agree responses combined
35%
35%
56%
60%
0% 10% 20% 30% 40% 50% 60% 70%
Teleworking has made our organization moreefficient
A remote workforce is more productive than anon-site workforce
My organization expects teleworking to becomethe new norm
In the new era of remote working, organizations are most concerned about the lack of physical security in the remote worker’s work space. An average of 58 percent of organizations’ workforce telework. Figure 3 presents the security risks organizations are most concerned about with having half of their workforce working remotely. Almost half (47 percent) of respondents say it is the inability to control risks created by the lack of physical security in remote workers’ homes and other locations is a worry for their organizations. This is followed by concerns that remote workers’ devices will become infected with malware, according to 32 percent of respondents. Figure 3. Security risks organizations are most concerned about More than one response permitted
1%
8%
12%
15%
17%
20%
23%
24%
32%
47%
0% 5% 10% 15% 20% 25% 30% 35% 40% 45% 50%
Other
The difficulty in securing external access tointernal-only resources
Teleworkers lose or have their devices stolen
Phishing and social engineering scams directedat teleworkers
Criminals could leverage the devices to gainaccess to the enterprise network
The difficulty in securing your organization’s network
The inability to secure communications on external networks outside your organization’s
control
Criminals could gain control of teleworkers’ devices to steal sensitive and confidential data
Teleworkers’ devices become infected with malware
A lack of physical security in the teleworker’s work space
The time to respond to a cyberattack has increased since COVID-19. According to Figure 4, since COVID-19 56 percent of respondents say the time has significantly increased (21 percent) or increased (35 percent) to respond to a cyberattack. Only 27 percent of respondents say the time remains unchanged. Figure 4. Since COVID-19 how has the time to respond to a cyberattack changed?
Understandably organizations were caught off-guard by the sudden lockdown due to COVID-19. As a result, remote working increases the uncertainty about how to protect against cyberattacks. According to Figure 5, 42 percent of respondents say it is the uncertainty on how to get a handle on reducing the risk of cyberattacks is a challenge. An insufficient budget is always an issue with organizations trying to make the necessary investments in technology and staffing to improve their security posture. However, in the era of a remote workforce insufficient budget is the number one challenge organizations face (44 percent of respondents). Figure 5. What challenges keep your organization’s IT security posture from being fully effective due to teleworking? Two responses permitted
21%
35%
27%
9%7%
0%
5%
10%
15%
20%
25%
30%
35%
40%
Increasedsignificantly
Increased Remainedunchanged
Decreased Decreasedsignificantly
2%
18%
19%
24%
25%
27%
42%
44%
0% 5% 10% 15% 20% 25% 30% 35% 40% 45% 50%
Other
Management does not see teleworking causingsecurity risks
Insufficient personnel
Lack of in-house expertise
Lack of clear leadership
Insufficient enabling security technologies
No understanding how to protect againstcyberattacks
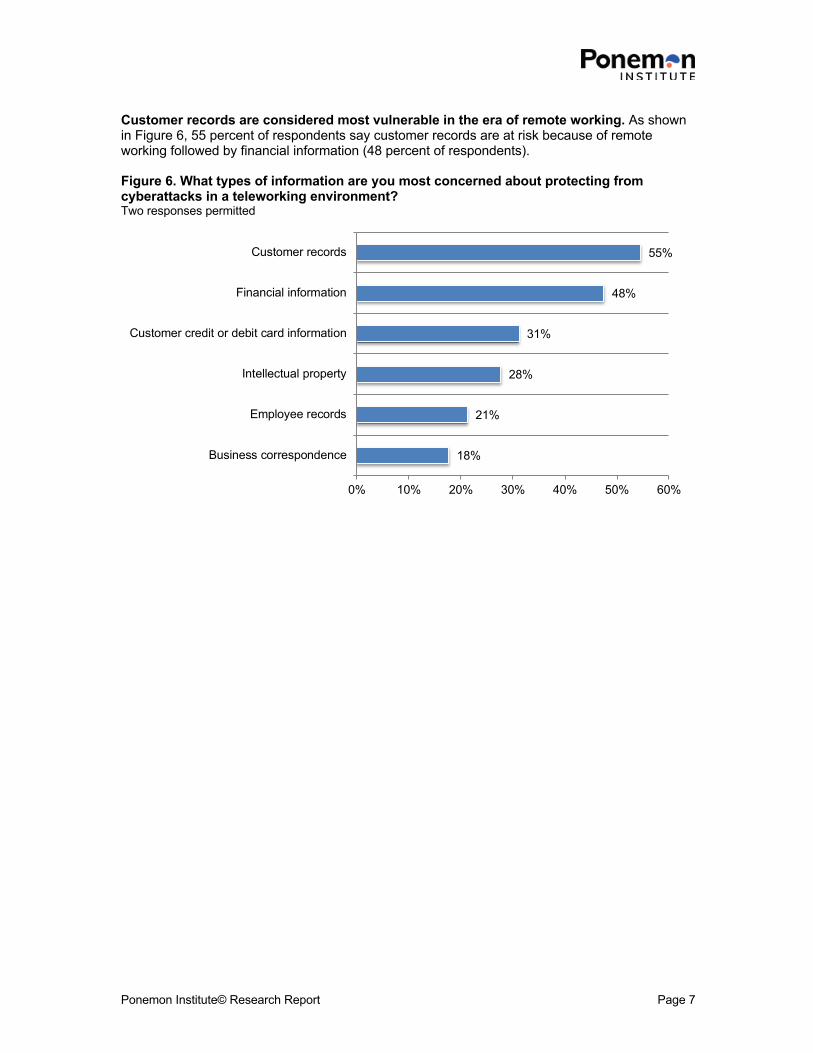
Customer records are considered most vulnerable in the era of remote working. As shown in Figure 6, 55 percent of respondents say customer records are at risk because of remote working followed by financial information (48 percent of respondents). Figure 6. What types of information are you most concerned about protecting from cyberattacks in a teleworking environment? Two responses permitted
Remote working has increased access to business-critical applications. A business-critical application is an application that is critical or important to keeping the business running. These applications can range from small tools to specialized tools such as lines of business systems. If interrupted, it would result in serious financial and legal loss; customer dissatisfaction and/or loss in productivity. As shown in Figure 7, 59 percent of respondents say access to business-critical applications has significantly increased (26 percent) or increased (33 percent). On average, organizations have 51 business-critical applications and on average 56 percent of these are accessed from mobile devices such as smart phones and tablets. Figure 7. Has the percentage of your organization’s business-critical applications accessed from mobile devices increased due to teleworking?
26%
33%
18% 18%
5%
0%
5%
10%
15%
20%
25%
30%
35%
Significantincrease
Increase Stay the same Decrease Significantdecrease
Not all organizations are requiring remote workers to use authentication methods. Almost one-third (31 percent) of respondents say their organizations do not require their teleworkers to use authentication methods. According to Figure 8, of the 69 percent of respondents who say authentication methods are required, 40 percent of respondents say two-factor authentication is required. Only 35 percent of respondents say multi-factor authentication is required, which would improve the security of remote access. Figure 8. What authentication methods does your organization require?
Cybersecurity risks during COVID-19 BYOD has decreased organizations’ security posture. According to Figure 9, 67 percent of respondents say remote workers’ use of their own mobile devices such as tablets and smart phones to access business-critical applications and IT infrastructure has decreased their organization’s security posture. As discussed previously, 31 percent of respondents say their organizations do not require remote workers to use authentication methods and only 35 percent of respondents say their organizations require multi-factor authentication. Cyberattacks during COVID-19 are becoming more severe in terms of negative consequences such as the impact on finances (50 percent of respondents) and almost half (47 percent) of respondents say cyberattacks are becoming more targeted. Thirty-six percent of respondents say they are becoming more sophisticated. Fifty-eight percent of respondents say their organizations experienced a compromise that damaged IT infrastructure or stole IT assets. The average cost to deal with these compromises over the past 12 months is $2.7 million. Similarly, 58 percent of respondents say their organizations had a disruption to normal operations at an average cost of $2.4 million. Figure 9. Perceptions about cybersecurity risks during COVID-19 Strongly agree and Agree responses combined
36%
47%
50%
67%
0% 10% 20% 30% 40% 50% 60% 70% 80%
Since teleworking, cyberattacks experienced bymy organization are becoming more
sophisticated
Since teleworking, cyberattacks experienced bymy organization are becoming more targeted
Since teleworking, cyberattacks experienced bymy organization are becoming more severe in
terms of negative consequences (such asfinancial impact)
Teleworkers’ use of their own mobile devices (BYOD) such as tablets and smart phones to
access business-critical applications and IT infrastructure has decreased our organization’s
During COVID-19, the types of attacks organizations have experienced most are credential theft and phishing/social engineering. As discussed previously, as a result of remote working many organizations have seen a decline in their cybersecurity posture. In fact, 60 percent of respondents say they have experienced a cyberattack. As shown in Figure 10, the most frequent attacks involved credential theft (56 percent of respondents) and phishing/social engineering (48 percent of respondents). Figure 10. What best describes the type of attacks experienced by your organization? More than one response permitted
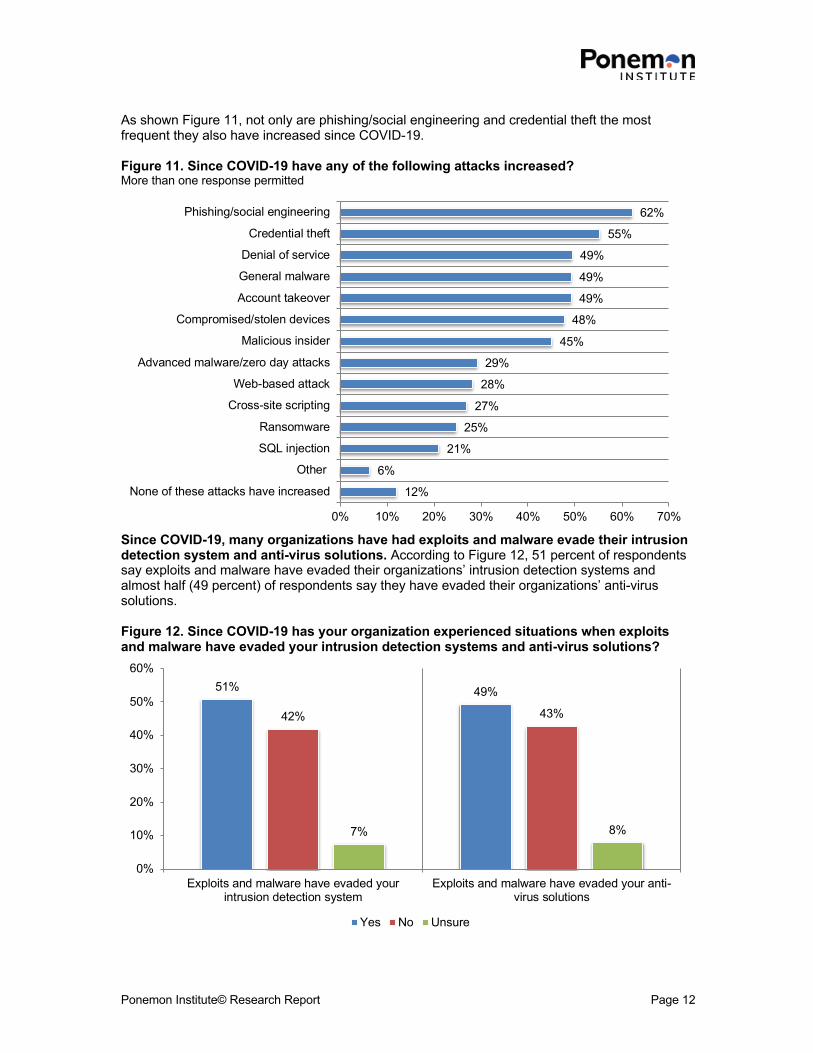
As shown Figure 11, not only are phishing/social engineering and credential theft the most frequent they also have increased since COVID-19. Figure 11. Since COVID-19 have any of the following attacks increased? More than one response permitted
Since COVID-19, many organizations have had exploits and malware evade their intrusion detection system and anti-virus solutions. According to Figure 12, 51 percent of respondents say exploits and malware have evaded their organizations’ intrusion detection systems and almost half (49 percent) of respondents say they have evaded their organizations’ anti-virus solutions. Figure 12. Since COVID-19 has your organization experienced situations when exploits and malware have evaded your intrusion detection systems and anti-virus solutions?
12%
6%
21%
25%
27%
28%
29%
45%
48%
49%
49%
49%
55%
62%
0% 10% 20% 30% 40% 50% 60% 70%
None of these attacks have increased
Other
SQL injection
Ransomware
Cross-site scripting
Web-based attack
Advanced malware/zero day attacks
Malicious insider
Compromised/stolen devices
Account takeover
General malware
Denial of service
Credential theft
Phishing/social engineering
51% 49%
42% 43%
7% 8%
0%
10%
20%
30%
40%
50%
60%
Exploits and malware have evaded yourintrusion detection system
Exploits and malware have evaded your anti-virus solutions
Smart phones, laptops and mobile devices are the most vulnerable endpoints to organizations’ networks and enterprise systems. According to Figure 13, to strengthen their security posture organizations should be assessing the risks created by remote workers’ smart phones, laptops and mobile devices because these are considered the most vulnerable entry points according to 55 percent, 50 percent and 48 percent of respondents, respectively. Figure 13. The most vulnerable endpoints or entry points to your organization’s networks and enterprise systems More than one response permitted
Instant messaging systems and Google Docs are the most popular tools for connectivity and collaboration. Fifty-eight percent of respondents say the use of collaboration tools significantly increased (33 percent) and increased (25 percent). As discussed previously, organizations are struggling to keep remote workers productive. Figure 14 presents a list of commonly used tools to enable connectivity and collaboration for teleworkers. The top two are instant messaging systems and Google Docs. Figure 14. What tools does your organization use to enable connectivity and collaboration for teleworkers? More than one response permitted
WebEx is the most commonly used video conferencing tool as shown in Figure 15. Followed by Zoom and Skype for Business. Figure 15. What video conferencing tools does your organization use? More than one response permitted
There is great concern that remote workers are making their organizations vulnerable for a data breach and/or a security exploit. Less than half (46 percent) of respondents say their organizations are effective (22 percent) or highly effective (24 percent) in reducing cybersecurity risks created by remote working. When asked to rate their concerns about the risks created by teleworkers on a scale of 1 = no concern to 10 = extremely concerned, 71 percent of respondents say they are very or extremely concerned (7+ responses on the 10-point scale) that teleworkers put the organization at risk for a data breach and 57 percent of respondents are very concerned or extremely concerned that remote workers are prime targets for those wishing to exploit vulnerabilities, as shown in Figure 16. Figure 16. Concerns about teleworkers being prime targets for those wishing to exploit vulnerabilities and putting organizations at risk for a data breach 1 = no concern to 10 = extremely concerned, 7+ responses presented
71%
57%
0%
10%
20%
30%
40%
50%
60%
70%
80%
Teleworkers are putting the organization atrisk for a data breach
Teleworkers are prime targets for thosewishing to exploit vulnerabilities
Data breach risks created by COVID-19 External attacks and third-party mistakes were the root causes of the data breach organizations had in the past year. Forty-four percent of respondents say their organizations had a data breach in the past 12 months (before and during the pandemic). As shown in Figure 17, 51 percent of respondents say external attacks and 42 percent of respondents say third-party mistakes were the root causes of the data breach. Figure 17. What were the root causes of the data breach experienced by your organization in the past 12 months? More than one response permitted
Steps organizations are taking and should take to manage cybersecurity risks IT security budgets and in-house expertise need to increase. As shown in Figure 18, only 45 percent of respondents say their organizations’ IT security budget is adequate for managing and mitigating cybersecurity risks caused by remote working and only 39 percent of respondents say their organization has the expertise to manage and mitigate cybersecurity risks caused by remote working. Figure 18. Perceptions about teleworking risks Strongly agree and Agree responses combined
39%
45%
0% 5% 10% 15% 20% 25% 30% 35% 40% 45% 50%
My organization has the necessary in-houseexpertise to manage and mitigate cybersecurity
risks caused by teleworking
My organization’s IT security budget is adequate for managing and mitigating cybersecurity risks
Security risks due to remote working require a new effort to educate remote workers about the risks. According to the research, organizations are at greater risk for security exploits and data breaches because of remote working. Moreover, remote working according to many respondents will be the new norm. As a result, it is more important than ever to have training programs that ensure remote workers are taking appropriate steps to avoid putting their organizations at risk. As shown in Figure 19, 43 percent of respondents say organizations currently inform and educate remote workers about the risks created by remote working and 33 percent of respondents say their organizations plan to. Figure 19. Does your organization inform and educate remote workers about the risks created by teleworking?
43%
33%
23%
0%
5%
10%
15%
20%
25%
30%
35%
40%
45%
50%
Yes, we currently provide suchinformation and education
No, but we are planning toprovide such information and
Policies for remote working mainly focus on password hygiene and up-to-date anti-virus protection on personal devices. Respondents recognize the security risks created by remote workers. However, 50 percent of respondents say their organizations do not have a policy on the security requirements for remote workers. As shown in Figure 20, if they do have a policy it is about the importance of password hygiene (63 percent of respondents) and the protection of personal devices used for business activities with up-to-date anti-virus solutions (60 percent of respondents). According to the research, 41 percent of respondents say their organizations had an attack involving the compromise of employees’ passwords. In the past year, on average each attack cost an organization $267,408. Figure 20. What does the policy on security requirements for teleworkers cover? More than one response permitted
5%
9%
32%
34%
37%
38%
41%
60%
63%
0% 10% 20% 30% 40% 50% 60% 70%
Other
None of the above
What constitutes a suspicious email and how tohandle it
Prohibition of the use of public WiFi and sharedcomputers for work-related activities
Prevention of laptops and devices from loss ortheft
Designation of which devices (company-ownedand/or employee-owned) can be used for which
kinds of business activity
If using WiFi at home how to make sure thenetwork is set up securely
Protection of personal devices used for businessactivities with up-to-date anti-virus
Despite the increase in security risks as a result of remote working, less than half (47 percent) of respondents say their organizations are monitoring the network 24/7. Figure 21 presents the steps organizations are taking to create a secure remote working environment. More than half (53 percent) of respondents say their organizations are instituting the necessary security protocols to keep the network safe and 50 percent of respondents say their organizations are encrypting sensitive data stored on devices. However, less than half of respondents are monitoring the network and protecting company-owned devices with up-to-date anti-virus, device encryption and firewalls. Figure 21. Steps taken to create a secure teleworking environment More than one response permitted
6%
35%
47%
47%
50%
53%
0% 10% 20% 30% 40% 50% 60%
Other
Require the use of a password manager
Monitor the network 24/7
Protect company-owned devices with up-to-dateanti-virus, device encryption and firewalls
Encryption of sensitive data stored on devices
Institute the necessary security protocols to keepthe network safe
Identity management & authentication is the top technology that improves an organization’s cybersecurity posture. Figure 22 presents a list of technologies and respondents were asked to identify those that have been most effective in improving their organizations’ cybersecurity posture. Seventy-one percent of respondents say it is identity management & authentication. This is followed by virtual private networks (59 percent of respondents) and endpoint security solutions (56 percent of respondents). Figure 22. Top ten technologies that improve organizations’ cybersecurity posture More than one response permitted
Country and regional differences Ponemon Institute surveyed a total of 2,215 respondents in the United States, the United Kingdom, DACH, Benelux, Scandinavia and ANZ. In this section, we present the most salient differences among these countries and regions. Organizations in the UK have the highest percentage of employees who are privileged users. As shown in Figure 23, an average of 31 percent of employees in the UK have access to their organizations’ critical, sensitive and proprietary information. Figure 23. What percentage of your employees who are teleworking due to COVID-19 have access to their organizations’ critical, sensitive and proprietary information? Extrapolated values presented
Organizations in ANZ, DACH and the US have the highest percentage of their business-critical applications accessed from mobile devices such as smart phones and tablets. As shown in Figure 24, an average of 62 percent of ANZ’s organizations’ business critical applications are accessed from smart phones and tablets. An average of 61 percent and 60 percent of business-critical applications are accessed in DACH and US organizations. Figure 24. What percentage of your organization’s business-critical applications are accessed from mobile devices such as smart phones and tablets? Extrapolated values presented
DACH and US organizations were more likely to have an attack that specifically leveraged COVID-19 as a threat vector. According to Figure 25, 52 percent of respondents in DACH organizations and 50 percent of respondents in the US say their organizations experienced an attack that specifically leveraged COVID-19 as a threat vector. Figure 25. Has your organization experienced an attack that specifically leveraged COVID-19 as a threat vector? Yes responses presented
ANZ organizations are more likely to have the necessary in-house expertise to manage and mitigate cybersecurity risks caused by remote working. The majority of organizations do not have the necessary in-house expertise to deal with remote working cybersecurity risks. However, more respondents (47 percent) in ANZ than the other countries and regions say their organizations have the necessary in-house expertise. Figure 26. My organization has the necessary in-house expertise to manage and mitigate cybersecurity risks caused by teleworking Strongly agree and Agree responses combined
More remote working educational programs are conducted in DACH and US organizations. As shown in Figure 27, 56 percent of respondents in DACH and 50 percent in the US say their organization currently inform and educate remote workers about the risks created by remote working. Fewer organizations in Scandinavia and the UK have such programs. Figure 27. Does your organization currently inform and educate remote workers about the risks created by teleworking? Yes responses presented
More organizations in DACH and the US have assessed the risk of remote working. According to Figure 28, 65 percent of respondents in DACH and 60 percent of respondents in the US say their organizations have assessed the risk of remote working. Figure 28. Has your organization assessed the risk of teleworking? Yes responses presented
Conclusion and recommendations Having a remote workforce has taken a toll on organizations’ cybersecurity posture. Many organizations have experienced attacks that have specifically leveraged COVI-19 as a threat vector. Because remote working seems to be here to stay, organizations need to assess the security risks, educate remote workers about these risks and create a remote workers security policy. Following are some recommendations to improve the security in the remote worker era. § Require all remote workers to use authentication methods, preferably multi-factor
authentication.
§ Make sure remote workers who are using their own devices (BYOD) have enabled basic security features such as the PIN, fingerprint or facial ID feature.
§ Ensure remote workers who have remote access to sensitive and confidential is based on
their role and responsibility. § Secure all types of remote worker devices--including desktop and laptop computers,
smartphones, and tablets--against common threats. § Require remote workers to keep computers and mobile devices patched and updated. § Educate remote workers on how to recognize unusual or suspicious activity on devices being
used for remote working and then contact your organization’s help desk or security operations center to report the activity.
§ To increase remote working security, organizations should require periodic password
changes, prohibit employees from reusing the same passwords on internal systems and require minimum password lengths.
Part 3. Methods The sampling frame is composed of 62,278 IT and IT security personnel in the United States, United Kingdom, DACH, Benelux, Scandinavia and ANZ (Australia and New Zealand) in organizations with a headcount from less than 250 to 5,000. All respondents in this research are in organizations that have furloughed or directed their employees to telework because of COVID-19. As shown in Table 2, 2,460 respondents completed the survey. Screening removed 245 surveys. The final sample was 2,215 surveys resulting in a 3.6 percent response rate. Table 2. Sample response Freq Pct%
Total sampling frame 62,278 100.0%
Total returns 2,460 4.0%
Rejected or screened surveys 245 0.4%
Final sample 2,215 3.6% The following pie chart summarizes the position level of qualified respondents. At 19 percent, the largest segment contains those who are managers. More than half (69 percent) of respondents are at or above the supervisory level. Pie Chart 1. Current position or organizational level
As shown in Pie Chart 2, 43 percent of respondents report to the CIO or head of corporate IT, 25 percent of respondents report to the head of IT security, 9 percent of respondents report to the business unit leader or general manager, and 6 percent of respondents indicated they report to the head of risk management. Pie Chart 2. Direct reporting channel
Pie Chart 3 shows the percentage distribution of respondents’ companies across 8 industries. Financial services represent the largest industry sector (at 17 percent of respondents), which includes banking, insurance, brokerage, investment management and payment processing. This is followed by public sector (11 percent of respondents), services (8 percent of respondents), industrial sector (8 percent of respondents) and retailing (8 percent of respondents). Pie Chart 3. Primary industry focus of respondents’ companies
Part 4. Caveats to this study There are inherent limitations to survey research that need to be carefully considered before drawing inferences from findings. The following items are specific limitations that are germane to most Web-based surveys. < Non-response bias: The current findings are based on a sample of survey returns. We sent
surveys to a representative sample of individuals, resulting in a large number of usable returned responses. Despite non-response tests, it is always possible that individuals who did not participate are substantially different in terms of underlying beliefs from those who completed the instrument.
< Sampling-frame bias: The accuracy is based on contact information and the degree to which
the list is representative of individuals who are IT or IT security professionals who were furloughed or directed their employees to telework because of COVID-19. Because we used a Web-based collection method, it is possible that non-Web responses by mailed survey or telephone call would result in a different pattern of findings.
< Self-reported results: The quality of survey research is based on the integrity of confidential
responses received from subjects. While certain checks and balances can be incorporated into the survey process, the possibility remains that a subject did not provide accurate responses.
The following tables provide the frequency or percentage frequency of responses to all survey questions contained in this study. All survey responses were captured in August 2020.
Survey response Total Total sampling frame 62,278 Total returns 2,460 Rejected surveys 245 Final sample 2,215 Response rate 3.6% Part 1. Screening Questions
S1. What range best describes the full-time employee headcount of your organization? Total Less than 100 12% 100 to 250 12% 251 to 500 22% 501 to 750 23% 751 to 1,000 14% 1,001 to 2,500 10% 2,501 to 5,000 6% More than 5,000 [STOP] 0% Total 100% Extrapolated value 796 S2. What best describes your role in managing the IT security function or activities within your organization? Check all that apply. Total Setting IT security priorities 55% Managing IT security budgets 41% Selecting vendors and contractors 63% Determining IT security strategy 37% Evaluating program performance 43% Administrating systems 30% None of the above [STOP] 0% Total 270%
S3. How do you rate your level of involvement in the evaluation, selection, and/or implementation of IT security products or services in your organization? Total Very high level of involvement 30% High level of involvement 45% Moderate level of involvement 19% Low level of involvement 6% Not involved [STOP] 0% Total 100%
S4. What percentage of your organization’s employees have been furloughed due to COVID-19? Total None [STOP] 0% < 10% 28% 10% to 25% 20% 26% to 50% 27% 51% to 75% 15% 76% to 100% 10% Total 100% Extrapolated value 33%
S5. Before COVID-19, What percentage of your organization’s employees were teleworking? Total None [STOP] 0% < 10% 51% 10% to 25% 20% 26% to 50% 14% 51% to 75% 9% 76% to 100% 6% Total 100% Extrapolated value 22%
S6. What percentage of your organization’s employees are teleworking due to COVID-19? Total None [STOP] 0% < 10% 5% 10% to 25% 12% 26% to 50% 17% 51% to 75% 34% 76% to 100% 31% Total 100% Extrapolated value 58%
Part 2: Security posture & COVID-19
Q1. What percentage of your organization’s employees who are teleworking due to COVID-19 have access to your organization’s critical, sensitive and proprietary information (e.g. privileged users)? Total None 0% < 10% 29% 10% to 25% 33% 26% to 50% 19% 51% to 75% 6% 76% to 100% 5% Total 100% Extrapolated value 23%
Q2a. How would you describe your organization’s IT security posture (in terms of its effectiveness at mitigating risks, vulnerabilities and attacks across the enterprise) prior to COVID-19? Total 1 or 2 2% 3 or 4 8% 5 or 6 19% 7 or 8 36% 9 or 10 35% Total 100% Extrapolated value 7.34 Q2b. How would you describe your organization’s IT security posture (in terms of its effectiveness at mitigating risks, vulnerabilities and attacks across the enterprise) due to COVID-19? Total 1 or 2 13% 3 or 4 22% 5 or 6 21% 7 or 8 30% 9 or 10 14% Total 100% Extrapolated value 5.71 Q3. What challenges keep your organization’s IT security posture from being fully effective due to teleworking? Please select the top two challenges. Total Insufficient budget (money) 44% Insufficient personnel 19% Lack of in-house expertise 24% Lack of clear leadership 25% Insufficient enabling security technologies 27% No understanding how to protect against cyberattacks 42% Management does not see teleworking causing security risks 18% Other (please specify) 2% Total 200%
Q4. What security risks caused by teleworking is your organization most concerned about? Please select the top two concerns. Total A lack of physical security in the teleworker’s work space 47% The difficulty in securing your organization’s network 20% The difficulty in securing external access to internal-only resources 8%
Criminals could gain control of teleworkers’ devices to steal sensitive and confidential data 24% Criminals could leverage the devices to gain access to the enterprise network 17% Teleworkers lose or have their devices stolen 12%
The inability to secure communications on external networks outside your organization’s control 23% Teleworkers’ devices become infected with malware 32% Phishing and social engineering scams directed at teleworkers 15% Other (please specify) 1% Total 200%
Q5. What types of information are you most concerned about protecting from cyberattacks in a teleworking environment? Please select the top two choices. Total Customer credit or debit card information 31% Financial information 48% Intellectual property 28% Customer records 55% Employee records 21% Business correspondence 18% Other (please specify) 0% Total 200%
Q6a. What percent of your organization’s business-critical applications are accessed from mobile devices such as smart phones, tablets and others? Total Zero 6% Less than 10% 13% 11 to 25% 23% 26 to 50% 33% 51 to 75% 17% 76 to 100% 8% Total 100% Extrapolated value 56%
Q6b. Has the percentage of your organization’s business-critical applications accessed from mobile devices such as smart phones, tablets and others increased due to teleworking? Total Significant increase 26% Increase 33% Stay the same 18% Decrease 18% Significant decrease 5% Total 100%
Q7a. Does your organization require teleworkers to use authentication methods? Total Yes 69% No 31% Total 100%
Q7b. If yes, what authentication method do you require? Total Two-Factor Authentication 40% Multi-Factor Authentication 35% FIDO2 12% Other (please specify) 13% Total 100%
Q8. How many business-critical applications does your organization have? Total Less than 10 4% 10 to 25 42% 26 to 50 31% 51 to 100 13% 101 to 250 6% More than 250 4% Total 100% Extrapolated value 50.69 Part 3: Cybersecurity risks during COVID-19 Q9a. Has your organization experienced a cyberattack in the past 12 months? Total Yes 60% No [Please skip to Q10] 31% Unsure [please skip to Q10] 9% Total 100%
Q9b. If yes, what best describes the type of attacks experienced by your organization in the past 12 months? Please select all that apply. Total Account takeover 43% Advanced malware / zero day attacks 24% Compromised / stolen devices 28% Credential theft 56% Cross-site scripting 16% Denial of services 42% General malware 42% Malicious insider 34% Phishing / social engineering 48% Ransomware 15% SQL injection 19% Web-based attack 36% Other (please specify) 5% Total 409%
Q10. Since COVID-19, have any of the following attacks increased? Please select all that apply. Total Account takeover 49% Advanced malware / zero day attacks 29% Compromised / stolen devices 48% Credential theft 55% Cross-site scripting 27% Denial of service 49% General malware 49% Malicious insider 45% Phishing / social engineering 62% Ransomware 25% SQL injection 21% Web-based attack 28% Other (please specify) 6% None of these attacks have increased 12% Total 506%
Q11. Has your organization experienced an attack that specifically leveraged COVID-19 as a threat vector? Total Yes 46% No 48% Unsure 6% Total 100%
Q12a. Since COVID-19, has your organization experienced situations when exploits and malware have evaded your intrusion detection system? Total Yes 51% No 42% Unsure 7% Total 100%
Q12b. Since COVID-19, has your organization experienced situations when exploits and malware have evaded your anti-virus solutions? Total Yes 49% No 43% Unsure 8% Total 100%
Q13. Since COVID-19, how has the time to respond to a cyberattack changed? Total Time has increased significantly 21% Time has increased 35% Time has remained unchanged 27% Time has decreased 9% Time has decreased significantly 7% Total 100%
Q14. Please rate the following statements using the agreement scale provided below each item. Strongly Agree and Agree responses provided. Total
Q14a. Since teleworking, cyberattacks experienced by my organization are becoming more targeted. 47%
Q14b. Since teleworking, cyberattacks experienced by my organization are becoming more sophisticated. 36% Q14c. Since teleworking, cyberattacks experienced by my organization are becoming more severe in terms of negative consequences (such as financial impact). 50%
Q14d. Teleworkers’ use of their own mobile devices (BYOD) such as tablets and smart phones to access business-critical applications and IT infrastructure has decreased our organization’s security posture. 67% Q14e. My organization expects teleworking to become the new norm 56% Q14f. A remote workforce is more productive than an on-site workforce 35% Q14g. Teleworking has made our organization more efficient. 35% Q14h. Teleworking has reduced our organization’s costs. 60%
Q15. In your opinion, what are the most vulnerable endpoints or entry points to your organization’s networks and enterprise systems? Please select all that apply. Total Desktops 34% Laptops 50% Tablets 24% Smart phones 55% Web server 23% Intranet server 17% Routers 13% Portable storage devices (including USBs) 20% Cloud systems 47% Mobile devices 48% Other (please specify) 4% Total 334%
Q16. Since teleworking how has the use of collaboration tools changed? Total Significantly increased 33% Increased 25% No change 11% Decreased 17% Significantly decreased 8% Our organization does not use collaboration tools 5% Total 100%
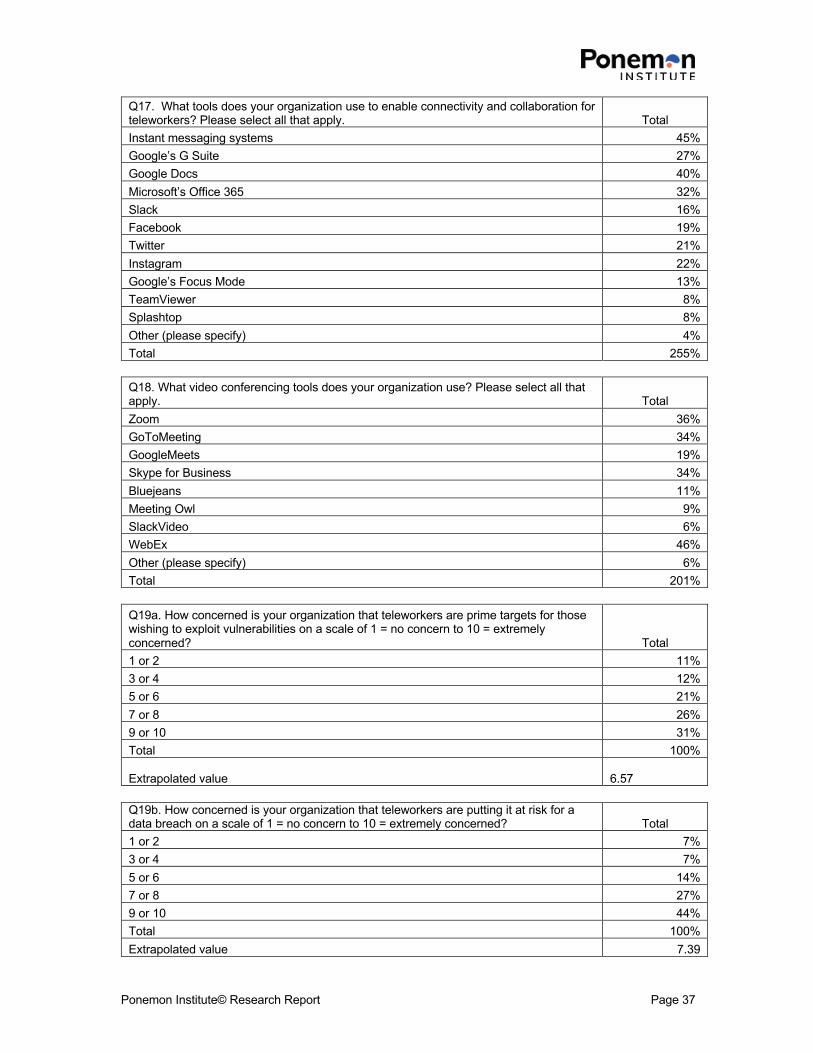
Q17. What tools does your organization use to enable connectivity and collaboration for teleworkers? Please select all that apply. Total Instant messaging systems 45% Google’s G Suite 27% Google Docs 40% Microsoft’s Office 365 32% Slack 16% Facebook 19% Twitter 21% Instagram 22% Google’s Focus Mode 13% TeamViewer 8% Splashtop 8% Other (please specify) 4% Total 255%
Q18. What video conferencing tools does your organization use? Please select all that apply. Total Zoom 36% GoToMeeting 34% GoogleMeets 19% Skype for Business 34% Bluejeans 11% Meeting Owl 9% SlackVideo 6% WebEx 46% Other (please specify) 6% Total 201%
Q19a. How concerned is your organization that teleworkers are prime targets for those wishing to exploit vulnerabilities on a scale of 1 = no concern to 10 = extremely concerned? Total 1 or 2 11% 3 or 4 12% 5 or 6 21% 7 or 8 26% 9 or 10 31% Total 100%
Extrapolated value 6.57
Q19b. How concerned is your organization that teleworkers are putting it at risk for a data breach on a scale of 1 = no concern to 10 = extremely concerned? Total 1 or 2 7% 3 or 4 7% 5 or 6 14% 7 or 8 27% 9 or 10 44% Total 100% Extrapolated value 7.39
Q19c. How effective is your organization in reducing cybersecurity risks created by teleworking on a scale of 1 = not effective to 10 = highly effective? Total 1 or 2 14% 3 or 4 16% 5 or 6 25% 7 or 8 22% 9 or 10 24% Total 100% Extrapolated value 6.00 Part 4. Data breach experience
Q20a. Has your organization experienced an incident involving the loss or theft of sensitive information about customers, target customers or employees (a.k.a. data breach) in the past 12 months? Total Yes 44% No [Please skip to Q21] 56% Total 100%
Q20b. If yes, with respect to your organization’s largest breach over the past 12 months, how many individual records were lost or stolen? Total Less than 100 32% 100 to 500 21% 501 to 1,000 21% 1,001 to 10,000 12% 10,001 to 50,000 9% 50,001 to 100,000 3% 100,001 to 1,000,000 1% More than 1,000,000 0% Total 100% Extrapolated value 7,819 Q20c. If yes, what were the root causes of the data breaches experienced by your organization in the past 12 months? Please select that apply. Total Malicious insider 40% External (hacker) attacks 51% Negligent employee or contractor 33% Error in system or operating process 30% Third party mistakes 42% Other (please specify) 6% Don’t know 4% Total 206%
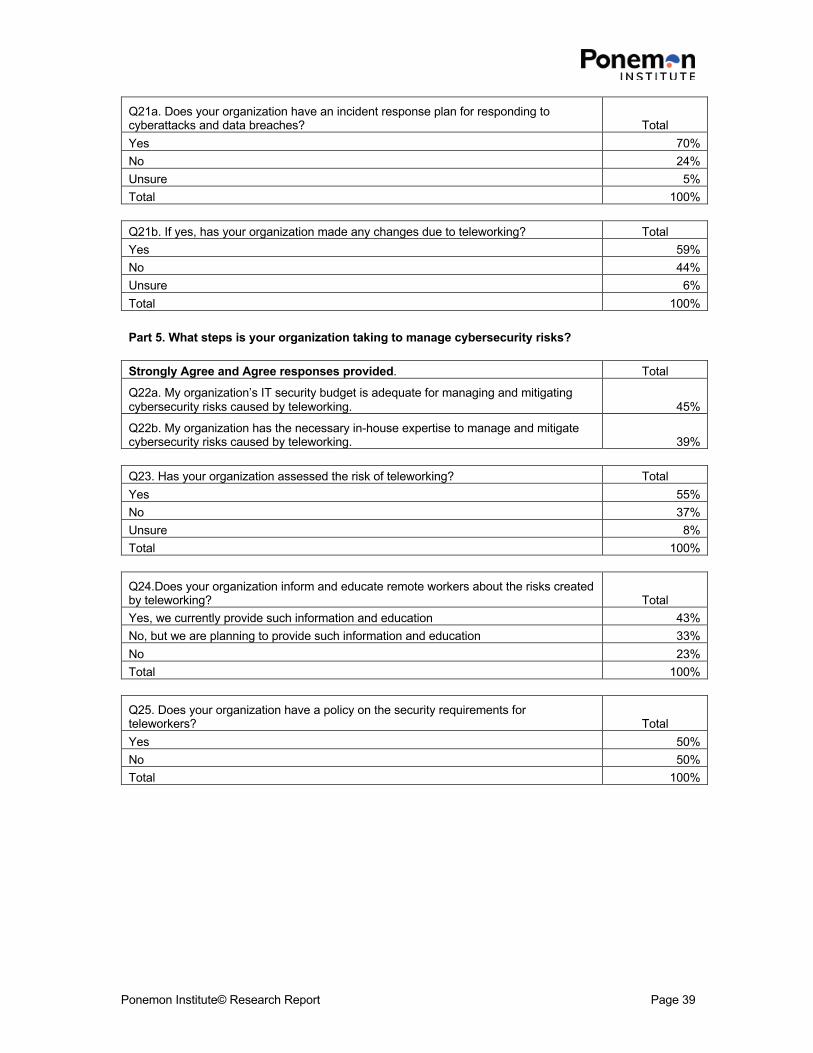
Q21a. Does your organization have an incident response plan for responding to cyberattacks and data breaches? Total Yes 70% No 24% Unsure 5% Total 100%
Q21b. If yes, has your organization made any changes due to teleworking? Total Yes 59% No 44% Unsure 6% Total 100%
Part 5. What steps is your organization taking to manage cybersecurity risks? Strongly Agree and Agree responses provided. Total
Q22a. My organization’s IT security budget is adequate for managing and mitigating cybersecurity risks caused by teleworking. 45%
Q22b. My organization has the necessary in-house expertise to manage and mitigate cybersecurity risks caused by teleworking. 39%
Q23. Has your organization assessed the risk of teleworking? Total Yes 55% No 37% Unsure 8% Total 100%
Q24.Does your organization inform and educate remote workers about the risks created by teleworking? Total Yes, we currently provide such information and education 43% No, but we are planning to provide such information and education 33% No 23% Total 100%
Q25. Does your organization have a policy on the security requirements for teleworkers? Total Yes 50% No 50% Total 100%
Q26. If yes, what does the policy cover? Please select all that apply Total The importance of password hygiene 63% Prevention of laptops and devices from loss or theft 37% Protection of personal devices used for business activities with up-to-date anti-virus 60%
Designation of which devices (company-owned and/or employee-owned) can be used for which kinds of business activity 38% What constitutes a suspicious email and how to handle it 32% Prohibition of the use of public WiFi and shared computers for work-related activities 34% If using WiFi at home how to make sure the network is set up securely 41% None of the above 9% Other (please specify) 5% Total 318%
Q27. What steps does your organization take to create a secure teleworking environment? Please select all that apply. Total
Protect company-owned devices with up-to-date anti-virus, device encryption and firewalls 47% Require the use of a password manager 35% Monitor the network 24/7 47% Institute the necessary security protocols to keep the network safe 53% Encryption of sensitive data stored on devices 50% Other (please specify) 6% Total 204%
Q28. Which of the following security technologies have been the most effective in helping your organization improve its cybersecurity posture. Please select your top ten (10) choices. Total Anti-virus / anti-malware 35% Artificial intelligence 21% Big data analytics for cybersecurity 36% Code review and debugging systems 31% Data loss prevention (DLP) 52% Data tokenization technology 28% DDoS solutions 33% Encryption for data at rest 36% Encryption for data in motion 47% Endpoint security solution 56% Governance solutions (GRC) 46% Identity management & authentication 71% Incident response platform 48% Intrusion detection & prevention systems 49% Machine learning 35% Network traffic surveillance 45% Next generation firewalls 39% Orchestration & automation 53% Security information and event management (SIEM) 51% User Behavioral Analytics (UBA) 51% Virtual private networks (VPN) 59% Web application firewalls (WAF) 38% Wireless security solutions 31% Other (please specify) 7% Total 1000%
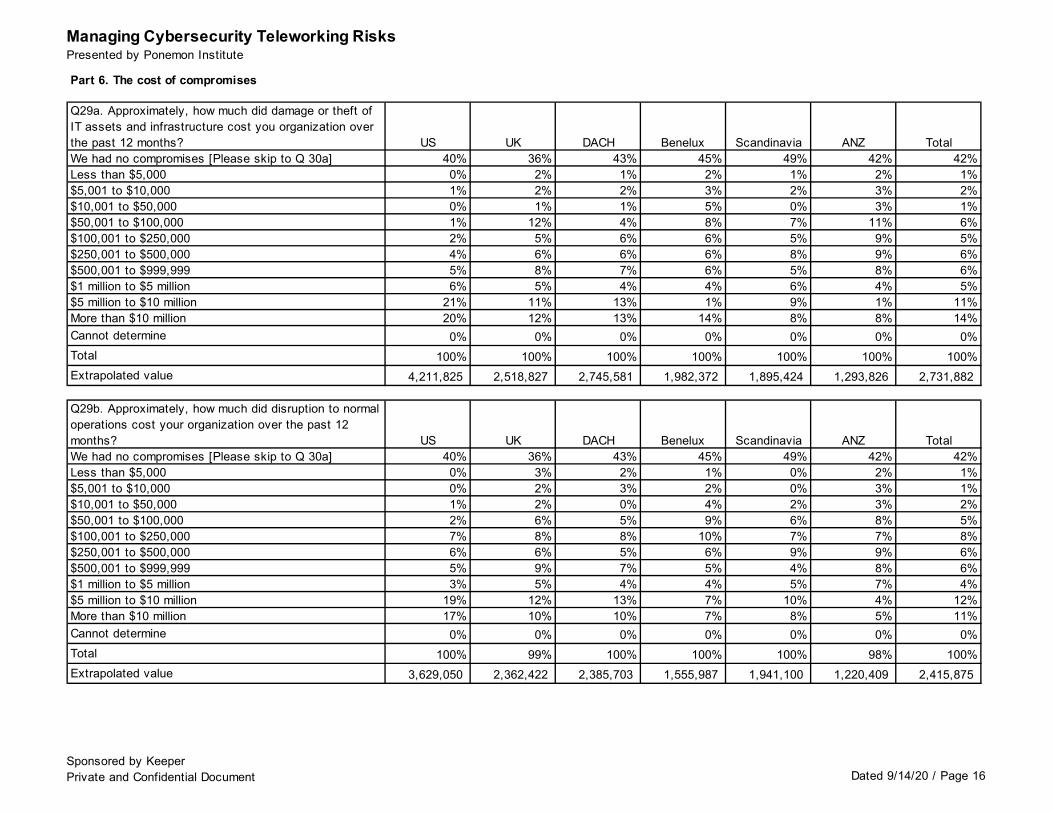
Part 6. The cost of compromises Q29a. Approximately, how much did damage or theft of IT assets and infrastructure cost you organization over the past 12 months? Total We had no compromises [Please skip to Q 30a] 42% Less than $5,000 1% $5,001 to $10,000 2% $10,001 to $50,000 1% $50,001 to $100,000 6% $100,001 to $250,000 5% $250,001 to $500,000 6% $500,001 to $999,999 6% $1 million to $5 million 5% $5 million to $10 million 11% More than $10 million 14% Cannot determine 0% Total 100% Extrapolated value $2,731,882
Q29b. Approximately, how much did disruption to normal operations cost your organization over the past 12 months? Total We had no compromises [Please skip to Q 30a] 42% Less than $5,000 1% $5,001 to $10,000 1% $10,001 to $50,000 2% $50,001 to $100,000 5% $100,001 to $250,000 8% $250,001 to $500,000 6% $500,001 to $999,999 6% $1 million to $5 million 4% $5 million to $10 million 12% More than $10 million 11% Cannot determine 0% Total 100% Extrapolated value $2,415,875 Q30a. Have you had an attack involving the compromise of employees’ passwords in the past year? Total Yes 41% No 51% Unsure 8% Total 100%
Q30b. If yes, on average how much did each attack cost your organization? Total Less than $10,000 4% $10,001 to $50,000 22% $50,001 to $100,000 18% $100,001 to $250,000 23% $250,001 to $500,000 25% $500,001 to $1,000,000 9% More than $1,000,000 4% Cannot determine 0% Total 100% Extrapolated value $266,725 Part 7. Role & Organizational Characteristics D1. What best describes your position level within the organization? Total Business owner 8% C-level executive/VP 10% Director 15% Manager 19% Supervisor 17% Staff/technician 18% Administrative 5% Consultant/contractor 6% Other (please specify) 1% Total 100%
D2. Which of the following executives do you report to in your current role? Total Business owner/board 5% CEO/executive committee 4% COO or head of operations 1% CFO, controller or head of finance 1% CIO or head of corporate IT 43% Business unit leader or general manager 9% Head of compliance or internal audit 5% Head of risk management 6% Head of IT security 25% Other (please specify) 1% Total 100%
D3. What best describes your organization’s primary industry classification? Total Aerospace & defense 1% Agriculture & food services 2% Communications 1% Construction and real estate 3% Consumer goods 6% Consumer products 3% Education & research 2% Entertainment, media and publishing 2% Financial services 17% Healthcare 5% Industrial 8% Logistics and distribution 6% Manufacturing 2% Pharmaceuticals 2% Public sector 11% Retailing 8% Services 8% Technology & software 7% Transportation 2% Other 2% Total 100%
Please contact [email protected] or call us at 800.887.3118 if you have any questions.
Ponemon Institute Advancing Responsible Information Management
Ponemon Institute is dedicated to independent research and education that advances responsible information and privacy management practices within business and government. Our mission is to conduct high quality, empirical studies on critical issues affecting the management and security of sensitive information about people and organizations. We uphold strict data confidentiality, privacy and ethical research standards. We do not collect any personally identifiable information from Individuals (or company identifiable information in our business research). Furthermore, we have strict quality standards to ensure that subjects are not asked extraneous, irrelevant or improper questions.
ABOUT KEEPER SECURITY Keeper Security is transforming the way businesses and individuals protect their passwords and sensitive digital assets to significantly reduce cyber theft. As the leading password manager and digital vault, Keeper helps millions of people and thousands of businesses substantially mitigate the risk of a data breach. Keeper is SOC 2 Certified and utilizes best-in-class encryption to safeguard its customers. Keeper protects industry-leading companies including Chase, Sony, Siemens, Chipotle, Philips and The University of Alabama at Birmingham. Keeper partners with global OEMs and mobile operators to preload Keeper on smartphones and tablets. Learn more at https://keepersecurity.com.
Managing Cybersecurity Teleworking RisksPresented by Ponemon Institute
Sponsored by KeeperPrivate and Confidential Document Dated 9/14/20 / Page 1
Part 1. Screening QuestionsS1. What range best describes the full-time employee headcount of your organization? US UK DACH Benelux Scandinavia ANZ TotalLess than 100 5% 15% 14% 11% 14% 17% 12%100 to 250 7% 16% 10% 16% 13% 18% 12%251 to 500 20% 23% 21% 23% 26% 24% 22%501 to 750 23% 27% 23% 20% 24% 19% 23%751 to 1,000 16% 6% 16% 16% 17% 16% 14%1,001 to 2,500 18% 6% 7% 10% 6% 6% 10%2,501 to 5,000 11% 7% 9% 3% 0% 0% 6%More than 5,000 [STOP] 0% 0% 0% 0% 0% 0% 0%Total 100% 100% 100% 99% 100% 100% 100%Extrapolated value 1,103 717 854 676 539 503 796
S2. What best describes your role in managing the IT security function or activities within your organization? Check all that apply. US UK DACH Benelux Scandinavia ANZ TotalSetting IT security priorities 54% 59% 58% 49% 60% 46% 55%Managing IT security budgets 41% 35% 40% 45% 41% 52% 41%Selecting vendors and contractors 60% 69% 69% 47% 72% 58% 63%Determining IT security strategy 37% 36% 38% 46% 31% 35% 37%Evaluating program performance 45% 39% 39% 43% 51% 45% 43%Administrating systems 33% 29% 29% 24% 37% 25% 30%None of the above [STOP] 0% 0% 0% 0% 0% 0% 0%Total 270% 267% 273% 253% 294% 261% 270%
S3. How do you rate your level of involvement in the evaluation, selection, and/or implementation of IT security products or services in your organization? US UK DACH Benelux Scandinavia ANZ TotalVery high level of involvement 28% 30% 35% 33% 30% 25% 30%High level of involvement 48% 41% 43% 42% 45% 48% 45%Moderate level of involvement 18% 21% 17% 20% 19% 20% 19%Low level of involvement 6% 8% 6% 5% 5% 7% 6%Not involved [STOP] 0% 0% 0% 0% 0% 0% 0%Total 100% 100% 100% 100% 100% 100% 100%
Managing Cybersecurity Teleworking RisksPresented by Ponemon Institute
Sponsored by KeeperPrivate and Confidential Document Dated 9/14/20 / Page 2
S4. What percentage of your organization’s employees have been furloughed due to COVID-19? US UK DACH Benelux Scandinavia ANZ TotalNone [STOP] 0% 0% 0% 0% 0% 0% 0%< 10% 15% 17% 35% 41% 51% 20% 28%10% to 25% 20% 18% 22% 20% 21% 21% 20%26% to 50% 28% 28% 28% 25% 20% 30% 27%51% to 75% 18% 22% 11% 12% 8% 14% 15%76% to 100% 19% 16% 3% 2% 0% 16% 10%Total 100% 100% 100% 100% 100% 100% 100%Extrapolated value 43% 42% 26% 24% 19% 38% 33%
S5. Before COVID-19, What percentage of your organization’s employees were teleworking? US UK DACH Benelux Scandinavia ANZ TotalNone [STOP] 0% 0% 0% 0% 0% 0% 0%< 10% 48% 54% 51% 63% 49% 42% 51%10% to 25% 21% 21% 22% 14% 16% 30% 20%26% to 50% 16% 12% 13% 11% 20% 9% 14%51% to 75% 6% 8% 11% 12% 8% 10% 9%76% to 100% 9% 5% 3% 0% 7% 9% 6%Total 100% 100% 100% 100% 100% 100% 100%Extrapolated value 24% 20% 21% 17% 24% 25% 22%
S6. What percentage of your organization’s employees are teleworking due to COVID-19? US UK DACH Benelux Scandinavia ANZ TotalNone [STOP] 0% 0% 0% 0% 0% 0% 0%< 10% 5% 3% 0% 9% 13% 5% 5%10% to 25% 12% 13% 10% 12% 12% 11% 12%26% to 50% 11% 9% 21% 25% 23% 23% 17%51% to 75% 34% 35% 43% 32% 28% 30% 34%76% to 100% 38% 40% 26% 22% 24% 31% 31%Total 100% 100% 100% 100% 100% 100% 100%Extrapolated value 61% 63% 59% 51% 50% 57% 58%
Managing Cybersecurity Teleworking RisksPresented by Ponemon Institute
Sponsored by KeeperPrivate and Confidential Document Dated 9/14/20 / Page 3
Part 2: Security posture & COVID-19Q1. What percentage of your organization’s employees who are teleworking due to COVID-19 have access to your organization’s critical, sensitive and proprietary information (e.g. privileged users)? US UK DACH Benelux Scandinavia ANZ TotalNone 5% 4% 14% 10% 13% 6% 0%< 10% 24% 23% 36% 38% 28% 23% 29%10% to 25% 32% 31% 36% 32% 35% 30% 33%26% to 50% 23% 20% 10% 19% 21% 22% 19%51% to 75% 7% 8% 4% 0% 3% 14% 6%76% to 100% 9% 14% 0% 1% 0% 5% 5%Total 100% 100% 100% 100% 100% 100% 100%Extrapolated value 28% 31% 14% 16% 17% 28% 23%
Q2a. How would you describe your organization’s IT security posture (in terms of its effectiveness at mitigating risks, vulnerabilities and attacks across the enterprise) prior to COVID-19? US UK DACH Benelux Scandinavia ANZ Total1 or 2 3% 4% 0% 2% 3% 2% 2%3 or 4 6% 12% 5% 9% 10% 12% 8%5 or 6 17% 20% 14% 23% 20% 21% 19%7 or 8 38% 31% 36% 39% 37% 34% 36%9 or 10 36% 33% 45% 27% 30% 31% 35%Total 100% 100% 100% 100% 100% 100% 100%Extrapolated value 7.46 7.04 7.92 7.10 7.12 7.11 7.34
Q2b. How would you describe your organization’s IT security posture (in terms of its effectiveness at mitigating risks, vulnerabilities and attacks across the enterprise) due to COVID-19? US UK DACH Benelux Scandinavia ANZ Total1 or 2 14% 12% 9% 13% 18% 11% 13%3 or 4 18% 25% 18% 24% 23% 33% 22%5 or 6 19% 25% 18% 19% 25% 20% 21%7 or 8 36% 22% 40% 30% 19% 28% 30%9 or 10 13% 16% 15% 14% 15% 9% 14%Total 100% 100% 100% 100% 100% 100% 100%Extrapolated value 5.82 5.57 6.17 5.66 5.30 5.35 5.71
Managing Cybersecurity Teleworking RisksPresented by Ponemon Institute
Sponsored by KeeperPrivate and Confidential Document Dated 9/14/20 / Page 4
Q3. What challenges keep your organization’s IT security posture from being fully effective due to teleworking? Please select the top two challenges. US UK DACH Benelux Scandinavia ANZ TotalInsufficient budget (money) 45% 46% 46% 42% 38% 45% 44%Insufficient personnel 19% 18% 22% 19% 16% 20% 19%Lack of in-house expertise 25% 23% 23% 20% 26% 25% 24%Lack of clear leadership 23% 20% 29% 31% 23% 24% 25%Insufficient enabling security technologies 27% 28% 22% 26% 31% 28% 27%No understanding how to protect against cyberattacks 41% 44% 41% 39% 46% 41% 42%Management does not see teleworking causing security risks 17% 18% 17% 21% 17% 16% 18%Other (please specify) 3% 4% 0% 2% 3% 0% 2%Total 200% 200% 200% 200% 200% 200% 200%
Q4. What security risks caused by teleworking is your organization most concerned about? Please select the top two concerns. US UK DACH Benelux Scandinavia ANZ TotalA lack of physical security in the teleworker’s work space 45% 48% 47% 44% 54% 50% 47%The difficulty in securing your organization’s network 20% 17% 21% 23% 20% 21% 20%The difficulty in securing external access to internal-only resources 8% 6% 8% 7% 9% 10% 8%Criminals could gain control of teleworkers’ devices to steal sensitive and confidential data 24% 25% 29% 22% 20% 21% 24%Criminals could leverage the devices to gain access to the enterprise network 17% 20% 13% 18% 16% 15% 17%Teleworkers lose or have their devices stolen 13% 10% 12% 11% 15% 13% 12%The inability to secure communications on external networks outside your organization’s control 25% 25% 23% 21% 20% 24% 23%Teleworkers’ devices become infected with malware 30% 34% 36% 34% 28% 27% 32%Phishing and social engineering scams directed at teleworkers 17% 16% 10% 19% 14% 15% 15%Other (please specify) 1% 0% 2% 0% 3% 3% 1%Total 200% 200% 200% 200% 200% 200% 200%
Managing Cybersecurity Teleworking RisksPresented by Ponemon Institute
Sponsored by KeeperPrivate and Confidential Document Dated 9/14/20 / Page 5
Q5. What types of information are you most concerned about protecting from cyberattacks in a teleworking environment? Please select the top two choices. US UK DACH Benelux Scandinavia ANZ TotalCustomer credit or debit card information 29% 38% 30% 32% 34% 23% 31%Financial information 46% 48% 46% 48% 51% 48% 48%Intellectual property 29% 24% 29% 29% 26% 28% 28%Customer records 53% 50% 62% 54% 50% 58% 55%Employee records 23% 19% 21% 23% 20% 21% 21%Business correspondence 20% 21% 12% 14% 19% 22% 18%Other (please specify) 0% 1% 0% 0% 0% 0% 0%Total 200% 200% 200% 200% 200% 200% 200%
Q6a. What percent of your organization’s business-critical applications are accessed from mobile devices such as smart phones, tablets and others? US UK DACH Benelux Scandinavia ANZ TotalZero 3% 7% 4% 9% 9% 5% 6%Less than 10% 12% 10% 10% 18% 16% 9% 13%11 to 25% 19% 28% 23% 26% 23% 20% 23%26 to 50% 30% 34% 37% 25% 33% 46% 33%51 to 75% 23% 16% 19% 15% 10% 15% 17%76 to 100% 13% 5% 7% 7% 9% 5% 8%Total 100% 100% 100% 100% 100% 100% 100%Extrapolated value 60% 57% 61% 49% 47% 62% 56%
Q6b. Has the percentage of your organization’s business-critical applications accessed from mobile devices such as smart phones, tablets and others increased due to teleworking? US UK DACH Benelux Scandinavia ANZ TotalSignificant increase 25% 26% 29% 22% 29% 27% 26%Increase 32% 33% 35% 34% 29% 31% 33%Stay the same 19% 18% 13% 21% 21% 21% 18%Decrease 20% 18% 20% 19% 15% 13% 18%Significant decrease 4% 5% 3% 4% 6% 8% 5%Total 100% 100% 100% 100% 100% 100% 100%
Q7a. Does your organization require teleworkers to use authentication methods? US UK DACH Benelux Scandinavia ANZ TotalYes 79% 61% 78% 67% 49% 64% 69%No 21% 39% 22% 33% 51% 36% 31%Total 100% 100% 100% 100% 100% 100% 100%
Managing Cybersecurity Teleworking RisksPresented by Ponemon Institute
Sponsored by KeeperPrivate and Confidential Document Dated 9/14/20 / Page 6
Q7b. If yes, what authentication method do you require? US UK DACH Benelux Scandinavia ANZ TotalTwo-Factor Authentication 44% 41% 39% 42% 39% 28% 40%Multi-Factor Authentication 29% 36% 38% 34% 35% 46% 35%FIDO2 12% 9% 15% 12% 11% 14% 12%Other (please specify) 15% 14% 8% 12% 15% 12% 13%Total 100% 100% 100% 100% 100% 100% 100%
Q8. How many business-critical applications does your organization have? US UK DACH Benelux Scandinavia ANZ TotalLess than 10 4% 4% 3% 4% 3% 3% 4%10 to 25 40% 41% 44% 43% 41% 46% 42%26 to 50 30% 34% 26% 31% 38% 32% 31%51 to 100 10% 12% 16% 16% 15% 14% 13%101 to 250 8% 7% 6% 4% 3% 5% 6%More than 250 8% 2% 5% 2% 0% 0% 4%Total 100% 100% 100% 100% 100% 100% 100%Extrapolated value 63.70 47.19 54.95 44.31 38.10 39.38 50.69
Part 3: Cybersecurity risks during COVID-19
Q9a. Has your organization experienced a cyberattack in the past 12 months? US UK DACH Benelux Scandinavia ANZ TotalYes 63% 60% 65% 56% 51% 60% 60%No [Please skip to Q10] 26% 30% 28% 36% 40% 32% 31%Unsure [please skip to Q10] 11% 10% 7% 8% 9% 8% 9%Total 100% 100% 100% 100% 100% 100% 100%
Managing Cybersecurity Teleworking RisksPresented by Ponemon Institute
Sponsored by KeeperPrivate and Confidential Document Dated 9/14/20 / Page 7
Q9b. If yes, what best describes the type of attacks experienced by your organization in the past 12 months? Please select all that apply. US UK DACH Benelux Scandinavia ANZ TotalAccount takeover 41% 40% 41% 47% 45% 46% 43%Advanced malware / zero day attacks 23% 23% 25% 27% 27% 22% 24%Compromised / stolen devices 27% 32% 27% 31% 27% 21% 28%Credential theft 55% 51% 56% 64% 56% 59% 56%Cross-site scripting 18% 14% 15% 14% 16% 16% 16%Denial of services 44% 44% 35% 41% 46% 40% 42%General malware 45% 50% 44% 43% 34% 31% 42%Malicious insider 36% 36% 33% 28% 34% 33% 34%Phishing / social engineering 50% 47% 48% 43% 53% 50% 48%Ransomware 17% 14% 16% 16% 12% 11% 15%SQL injection 18% 19% 21% 21% 18% 20% 19%Web-based attack 32% 34% 34% 40% 39% 43% 36%Other (please specify) 6% 4% 7% 4% 5% 3% 5%Total 412% 409% 402% 417% 411% 396% 409%
Q10. Since COVID-19, have any of the following attacks increased? Please select all that apply. US UK DACH Benelux Scandinavia ANZ TotalAccount takeover 50% 38% 57% 51% 48% 50% 49%Advanced malware / zero day attacks 30% 25% 36% 23% 34% 24% 29%Compromised / stolen devices 46% 49% 49% 53% 46% 41% 48%Credential theft 52% 62% 52% 58% 55% 54% 55%Cross-site scripting 29% 22% 25% 30% 26% 31% 27%Denial of service 53% 54% 41% 48% 45% 57% 49%General malware 48% 50% 54% 42% 52% 51% 49%Malicious insider 44% 52% 45% 43% 43% 42% 45%Phishing / social engineering 63% 79% 49% 65% 53% 64% 62%Ransomware 26% 26% 21% 24% 26% 26% 25%SQL injection 21% 23% 18% 21% 23% 19% 21%Web-based attack 30% 29% 31% 26% 22% 27% 28%Other (please specify) 6% 6% 7% 6% 7% 6% 6%None of these attacks have increased 11% 14% 13% 12% 10% 13% 12%Total 509% 529% 497% 502% 490% 505% 506%
Q11. Has your organization experienced an attack that specifically leveraged COVID-19 as a threat vector? US UK DACH Benelux Scandinavia ANZ TotalYes 50% 39% 52% 46% 39% 45% 46%No 46% 56% 41% 47% 55% 50% 48%Unsure 4% 5% 7% 7% 6% 5% 6%Total 100% 100% 100% 100% 100% 100% 100%
Managing Cybersecurity Teleworking RisksPresented by Ponemon Institute
Sponsored by KeeperPrivate and Confidential Document Dated 9/14/20 / Page 8
Q12a. Since COVID-19, has your organization experienced situations when exploits and malware have evaded your intrusion detection system? US UK DACH Benelux Scandinavia ANZ TotalYes 53% 48% 52% 51% 46% 52% 51%No 40% 43% 41% 43% 45% 41% 42%Unsure 7% 9% 7% 6% 9% 6% 7%Total 100% 100% 100% 100% 100% 100% 100%
Q12b. Since COVID-19, has your organization experienced situations when exploits and malware have evaded your anti-virus solutions? US UK DACH Benelux Scandinavia ANZ TotalYes 55% 49% 48% 47% 42% 50% 49%No 38% 41% 43% 46% 50% 44% 43%Unsure 7% 10% 9% 7% 8% 6% 8%Total 100% 100% 100% 100% 100% 100% 100%
Q13. Since COVID-19, how has the time to respond to a cyberattack changed? US UK DACH Benelux Scandinavia ANZ TotalTime has increased significantly 20% 19% 15% 23% 25% 29% 21%Time has increased 35% 41% 37% 38% 32% 24% 35%Time has remained unchanged 26% 21% 31% 29% 28% 30% 27%Time has decreased 11% 10% 10% 6% 8% 9% 9%Time has decreased significantly 8% 9% 7% 5% 7% 7% 7%Total 100% 100% 100% 100% 100% 100% 100%
Q14. Please rate the following statements using the agreement scale provided below each item. Strongly Agree and Agree responses provided. US UK DACH Benelux Scandinavia ANZ TotalQ14a. Since teleworking, cyberattacks experienced by my organization are becoming more targeted. 44% 42% 48% 53% 51% 51% 47%Q14b. Since teleworking, cyberattacks experienced by my organization are becoming more sophisticated. 35% 34% 36% 38% 40% 36% 36%Q14c. Since teleworking, cyberattacks experienced by my organization are becoming more severe in terms of negative consequences (such as financial impact). 56% 49% 50% 51% 45% 46% 50%Q14d. Teleworkers’ use of their own mobile devices (BYOD) such as tablets and smart phones to access business-critical applications and IT infrastructure has decreased our organization’s security posture. 67% 66% 65% 71% 65% 70% 67%Q14e. My organization expects teleworking to become the new norm 52% 63% 56% 63% 53% 49% 56%
Managing Cybersecurity Teleworking RisksPresented by Ponemon Institute
Sponsored by KeeperPrivate and Confidential Document Dated 9/14/20 / Page 9
Q14f. A remote workforce is more productive than an on-site workforce 36% 36% 34% 33% 37% 36% 35%Q14g. Teleworking has made our organization more efficient. 37% 35% 35% 34% 35% 31% 35%Q14h. Teleworking has reduced our organization’s costs. 48% 53% 58% 66% 68% 84% 60%
Q15. In your opinion, what are the most vulnerable endpoints or entry points to your organization’s networks and enterprise systems? Please select all that apply. US UK DACH Benelux Scandinavia ANZ TotalDesktops 34% 29% 33% 38% 38% 31% 34%Laptops 44% 47% 53% 58% 56% 42% 50%Tablets 29% 27% 23% 21% 20% 22% 24%Smart phones 58% 57% 52% 48% 54% 58% 55%Web server 23% 23% 23% 24% 22% 22% 23%Intranet server 19% 17% 18% 18% 16% 14% 17%Routers 12% 13% 12% 14% 14% 15% 13%Portable storage devices (including USBs) 21% 19% 20% 17% 20% 23% 20%Cloud systems 44% 48% 48% 45% 50% 47% 47%Mobile devices 50% 51% 49% 44% 43% 45% 48%Other (please specify) 5% 5% 4% 4% 4% 5% 4%Total 339% 335% 335% 329% 337% 323% 334%
Q16. Since teleworking how has the use of collaboration tools changed? US UK DACH Benelux Scandinavia ANZ TotalSignificantly increased 34% 35% 33% 30% 36% 27% 33%Increased 26% 25% 24% 27% 21% 25% 25%No change 12% 12% 9% 12% 13% 10% 11%Decreased 14% 17% 18% 19% 18% 23% 17%Significantly decreased 9% 8% 9% 7% 8% 9% 8%Our organization does not use collaboration tools 5% 4% 6% 5% 4% 5% 5%Total 100% 100% 100% 100% 100% 100% 100%
Managing Cybersecurity Teleworking RisksPresented by Ponemon Institute
Sponsored by KeeperPrivate and Confidential Document Dated 9/14/20 / Page 10
Q17. What tools does your organization use to enable connectivity and collaboration for teleworkers? Please select all that apply. US UK DACH Benelux Scandinavia ANZ TotalInstant messaging systems 34% 38% 42% 52% 62% 59% 45%Google’s G Suite 29% 31% 29% 26% 21% 20% 27%Google Docs 43% 44% 44% 37% 35% 33% 40%Microsoft’s Office 365 41% 33% 30% 27% 25% 27% 32%Slack 17% 15% 17% 15% 16% 19% 16%Facebook 19% 19% 19% 21% 15% 17% 19%Twitter 21% 23% 21% 20% 20% 23% 21%Instagram 19% 20% 24% 22% 25% 27% 22%Google’s Focus Mode 11% 14% 15% 12% 14% 15% 13%TeamViewer 9% 7% 8% 8% 6% 7% 8%Splashtop 8% 8% 9% 9% 7% 8% 8%Other (please specify) 3% 3% 3% 5% 5% 3% 4%Total 254% 254% 261% 253% 251% 258% 255%
Q18. What video conferencing tools does your organization use? Please select all that apply. US UK DACH Benelux Scandinavia ANZ TotalZoom 50% 35% 30% 32% 27% 28% 36%GoToMeeting 47% 32% 37% 3% 39% 37% 34%GoogleMeets 18% 18% 19% 18% 20% 21% 19%Skype for Business 34% 33% 40% 33% 31% 31% 34%Bluejeans 12% 11% 11% 8% 10% 11% 11%Meeting Owl 9% 9% 9% 10% 9% 10% 9%SlackVideo 7% 7% 6% 6% 5% 4% 6%WebEx 43% 42% 43% 52% 54% 47% 46%Other (please specify) 5% 6% 7% 6% 7% 7% 6%Total 225% 193% 201% 169% 202% 197% 201%
Q19a. How concerned is your organization that teleworkers are prime targets for those wishing to exploit vulnerabilities on a scale of 1 = no concern to 10 = extremely concerned? US UK DACH Benelux Scandinavia ANZ Total1 or 2 8% 11% 7% 15% 16% 15% 11%3 or 4 9% 15% 8% 12% 13% 15% 12%5 or 6 16% 22% 21% 25% 21% 23% 21%7 or 8 30% 32% 23% 23% 20% 23% 26%9 or 10 37% 20% 41% 25% 28% 24% 31%Total 100% 100% 100% 100% 100% 100% 100%Extrapolated value 7.08 6.21 7.16 6.12 6.08 6.02 6.57
Managing Cybersecurity Teleworking RisksPresented by Ponemon Institute
Sponsored by KeeperPrivate and Confidential Document Dated 9/14/20 / Page 11
Q19b. How concerned is your organization that teleworkers are putting it at risk for a data breach on a scale of 1 = no concern to 10 = extremely concerned? US UK DACH Benelux Scandinavia ANZ Total1 or 2 6% 8% 7% 9% 6% 8% 7%3 or 4 5% 9% 9% 8% 5% 5% 7%5 or 6 17% 16% 16% 12% 13% 7% 14%7 or 8 29% 28% 24% 23% 25% 37% 27%9 or 10 43% 39% 44% 48% 51% 43% 44%Total 100% 100% 100% 100% 100% 100% 100%Extrapolated value 7.46 7.12 7.28 7.36 7.70 7.54 7.39
Q19c. How effective is your organization in reducing cybersecurity risks created by teleworking on a scale of 1 = not effective to 10 = highly effective? US UK DACH Benelux Scandinavia ANZ Total1 or 2 14% 13% 13% 15% 13% 16% 14%3 or 4 15% 19% 16% 17% 15% 13% 16%5 or 6 21% 25% 31% 28% 23% 23% 25%7 or 8 23% 20% 19% 20% 25% 23% 22%9 or 10 27% 23% 21% 20% 24% 25% 24%Total 100% 100% 100% 100% 100% 100% 100%Extrapolated value 6.18 5.92 5.88 5.75 6.14 6.06 6.00
Part 4. Data breach experienceQ20a. Has your organization experienced an incident involving the loss or theft of sensitive information about customers, target customers or employees (a.k.a. data breach) in the past 12 months? US UK DACH Benelux Scandinavia ANZ TotalYes 50% 44% 39% 40% 43% 40% 44%No [Please skip to Q21] 50% 56% 61% 60% 57% 60% 56%Total 100% 100% 100% 100% 100% 100% 100%
Managing Cybersecurity Teleworking RisksPresented by Ponemon Institute
Sponsored by KeeperPrivate and Confidential Document Dated 9/14/20 / Page 12
Q20b. If yes, with respect to your organization’s largest breach over the past 12 months, how many individual records were lost or stolen? US UK DACH Benelux Scandinavia ANZ TotalLess than 100 28% 28% 30% 38% 40% 39% 32%100 to 500 21% 32% 24% 19% 14% 13% 21%501 to 1,000 19% 19% 21% 22% 24% 22% 21%1,001 to 10,000 13% 11% 9% 11% 13% 16% 12%10,001 to 50,000 10% 5% 11% 10% 9% 10% 9%50,001 to 100,000 6% 3% 3% 1% 0% 1% 3%100,001 to 1,000,000 3% 2% 1% 0% 0% 0% 1%More than 1,000,000 0% 0% 0% 0% 0% 0% 0%Total 100% 100% 100% 100% 100% 101% 100%Extrapolated value 12,935 7,598 7,822 4,534 3,647 4,857 7,819
Q20c. If yes, what were the root causes of the data breaches experienced by your organization in the past 12 months? Please select that apply. US UK DACH Benelux Scandinavia ANZ TotalMalicious insider 31% 33% 41% 47% 52% 47% 40%External (hacker) attacks 52% 63% 59% 47% 37% 36% 51%Negligent employee or contractor 35% 36% 34% 33% 29% 30% 33%Error in system or operating process 31% 29% 30% 35% 27% 25% 30%Third party mistakes 42% 36% 42% 50% 40% 41% 42%Other (please specify) 7% 5% 6% 6% 5% 6% 6%Don’t know 4% 3% 2% 4% 3% 6% 4%Total 202% 206% 214% 223% 193% 191% 206%
Q21a. Does your organization have an incident response plan for responding to cyberattacks and data breaches? US UK DACH Benelux Scandinavia ANZ TotalYes 76% 63% 77% 67% 65% 69% 70%No 20% 32% 20% 26% 26% 26% 24%Unsure 4% 5% 3% 7% 9% 5% 5%Total 100% 100% 100% 100% 100% 100% 100%
Q21b. If yes, has your organization made any changes due to teleworking? US UK DACH Benelux Scandinavia ANZ TotalYes 62% 63% 55% 52% 57% 69% 59%No 30% 32% 38% 42% 39% 26% 44%Unsure 8% 5% 7% 6% 4% 5% 6%Total 100% 100% 100% 100% 100% 99% 100%
Managing Cybersecurity Teleworking RisksPresented by Ponemon Institute
Sponsored by KeeperPrivate and Confidential Document Dated 9/14/20 / Page 13
Part 5. What steps is your organization taking to manage cybersecurity risks?
Strongly Agree and Agree responses provided. US UK DACH Benelux Scandinavia ANZ TotalQ22a. My organization’s IT security budget is adequate for managing and mitigating cybersecurity risks caused by teleworking. 40% 43% 46% 48% 54% 45% 45%Q22b. My organization has the necessary in-house expertise to manage and mitigate cybersecurity risks caused by teleworking. 36% 39% 39% 39% 41% 47% 39%
Q23. Has your organization assessed the risk of teleworking? US UK DACH Benelux Scandinavia ANZ TotalYes 60% 43% 65% 52% 56% 51% 55%No 31% 48% 28% 40% 37% 43% 37%Unsure 9% 9% 7% 8% 7% 6% 8%Total 100% 100% 100% 100% 100% 100% 100%
Q24.Does your organization inform and educate remote workers about the risks created by teleworking? US UK DACH Benelux Scandinavia ANZ TotalYes, we currently provide such information and education 50% 32% 56% 36% 33% 45% 43%No, but we are planning to provide such information and education 26% 39% 29% 41% 39% 32% 33%No 24% 29% 15% 24% 28% 23% 23%Total 100% 100% 100% 100% 100% 100% 100%
Q25. Does your organization have a policy on the security requirements for teleworkers? US UK DACH Benelux Scandinavia ANZ TotalYes 47% 43% 59% 51% 50% 46% 50%No 53% 57% 41% 49% 50% 54% 51%Total 100% 100% 100% 100% 100% 100% 100%
Managing Cybersecurity Teleworking RisksPresented by Ponemon Institute
Sponsored by KeeperPrivate and Confidential Document Dated 9/14/20 / Page 14
Q26. If yes, what does the policy cover? Please select all that apply US UK DACH Benelux Scandinavia ANZ TotalThe importance of password hygiene 56% 63% 71% 60% 63% 70% 63%Prevention of laptops and devices from loss or theft 42% 36% 39% 35% 33% 31% 37%Protection of personal devices used for business activities with up-to-date antivirus 54% 62% 63% 59% 56% 69% 60%Designation of which devices (company-owned and/or employee-owned) can be used for which kinds of business activity 38% 37% 35% 37% 42% 48% 38%What constitutes a suspicious email and how to handle it 42% 34% 31% 28% 21% 21% 32%Prohibition of the use of public WiFi and shared computers for work-related activities 34% 35% 35% 33% 32% 37% 34%If using WiFi at home how to make sure the network is set up securely 41% 40% 40% 41% 42% 39% 41%None of the above 11% 10% 10% 8% 8% 8% 9%Other (please specify) 4% 4% 5% 6% 5% 5% 5%Total 322% 320% 327% 308% 301% 328% 318%
Q27. What steps does your organization take to create a secure teleworking environment? Please select all that apply. US UK DACH Benelux Scandinavia ANZ TotalProtect company-owned devices with up-to-date antivirus, device encryption and firewalls 44% 54% 51% 48% 42% 36% 47%Require the use of a password manager 37% 34% 37% 35% 34% 31% 35%Monitor the network 24/7 35% 40% 44% 51% 60% 70% 47%Institute the necessary security protocols to keep the network safe 49% 52% 50% 55% 66% 53% 53%Encryption of sensitive data stored on devices 53% 54% 57% 45% 45% 40% 50%Other (please specify) 5% 5% 6% 7% 6% 6% 6%Total 223% 259% 257% 299% 246% 222% 250%
Managing Cybersecurity Teleworking RisksPresented by Ponemon Institute
Sponsored by KeeperPrivate and Confidential Document Dated 9/14/20 / Page 15
Q28. Which of the following security technologies have been the most effective in helping your organization improve its cybersecurity posture. Please select your top ten (10) choices. US UK DACH Benelux Scandinavia ANZ TotalAnti-virus / anti-malware 34% 35% 45% 22% 37% 34% 35%Artificial intelligence 21% 20% 24% 18% 20% 26% 21%Big data analytics for cybersecurity 34% 36% 42% 32% 40% 35% 36%Code review and debugging systems 27% 33% 29% 34% 33% 37% 31%Data loss prevention (DLP) 53% 53% 55% 56% 48% 45% 52%Data tokenization technology 25% 24% 29% 37% 24% 29% 28%DDoS solutions 33% 40% 32% 23% 31% 44% 33%Encryption for data at rest 39% 38% 34% 33% 31% 38% 36%Encryption for data in motion 41% 49% 45% 47% 53% 53% 47%Endpoint security solution 50% 54% 56% 68% 59% 53% 56%Governance solutions (GRC) 49% 51% 47% 41% 41% 46% 46%Identity management & authentication 65% 65% 71% 73% 83% 84% 71%Incident response platform 52% 50% 46% 43% 44% 48% 48%Intrusion detection & prevention systems 52% 43% 49% 51% 50% 50% 49%Machine learning 30% 31% 33% 39% 40% 49% 35%Network traffic surveillance 45% 51% 45% 55% 34% 31% 45%Next generation firewalls 41% 36% 35% 48% 47% 24% 39%Orchestration & automation 55% 55% 54% 56% 56% 37% 53%Security information and event management (SIEM) 59% 54% 46% 47% 42% 51% 51%User Behavioral Analytics (UBA) 53% 53% 48% 50% 52% 55% 51%Virtual private networks (VPN) 63% 48% 59% 61% 59% 62% 59%Web application firewalls (WAF) 43% 40% 36% 33% 40% 32% 38%Wireless security solutions 32% 33% 33% 28% 26% 29% 31%Other (please specify) 4% 6% 9% 7% 9% 8% 7%Total 1000% 1000% 1000% 1000% 1000% 1000% 1000%
Managing Cybersecurity Teleworking RisksPresented by Ponemon Institute
Sponsored by KeeperPrivate and Confidential Document Dated 9/14/20 / Page 16
Part 6. The cost of compromises
Q29a. Approximately, how much did damage or theft of IT assets and infrastructure cost you organization over the past 12 months? US UK DACH Benelux Scandinavia ANZ TotalWe had no compromises [Please skip to Q 30a] 40% 36% 43% 45% 49% 42% 42%Less than $5,000 0% 2% 1% 2% 1% 2% 1%$5,001 to $10,000 1% 2% 2% 3% 2% 3% 2%$10,001 to $50,000 0% 1% 1% 5% 0% 3% 1%$50,001 to $100,000 1% 12% 4% 8% 7% 11% 6%$100,001 to $250,000 2% 5% 6% 6% 5% 9% 5%$250,001 to $500,000 4% 6% 6% 6% 8% 9% 6%$500,001 to $999,999 5% 8% 7% 6% 5% 8% 6%$1 million to $5 million 6% 5% 4% 4% 6% 4% 5%$5 million to $10 million 21% 11% 13% 1% 9% 1% 11%More than $10 million 20% 12% 13% 14% 8% 8% 14%Cannot determine 0% 0% 0% 0% 0% 0% 0%Total 100% 100% 100% 100% 100% 100% 100%Extrapolated value 4,211,825 2,518,827 2,745,581 1,982,372 1,895,424 1,293,826 2,731,882
Q29b. Approximately, how much did disruption to normal operations cost your organization over the past 12 months? US UK DACH Benelux Scandinavia ANZ TotalWe had no compromises [Please skip to Q 30a] 40% 36% 43% 45% 49% 42% 42%Less than $5,000 0% 3% 2% 1% 0% 2% 1%$5,001 to $10,000 0% 2% 3% 2% 0% 3% 1%$10,001 to $50,000 1% 2% 0% 4% 2% 3% 2%$50,001 to $100,000 2% 6% 5% 9% 6% 8% 5%$100,001 to $250,000 7% 8% 8% 10% 7% 7% 8%$250,001 to $500,000 6% 6% 5% 6% 9% 9% 6%$500,001 to $999,999 5% 9% 7% 5% 4% 8% 6%$1 million to $5 million 3% 5% 4% 4% 5% 7% 4%$5 million to $10 million 19% 12% 13% 7% 10% 4% 12%More than $10 million 17% 10% 10% 7% 8% 5% 11%Cannot determine 0% 0% 0% 0% 0% 0% 0%Total 100% 99% 100% 100% 100% 98% 100%Extrapolated value 3,629,050 2,362,422 2,385,703 1,555,987 1,941,100 1,220,409 2,415,875
Managing Cybersecurity Teleworking RisksPresented by Ponemon Institute
Sponsored by KeeperPrivate and Confidential Document Dated 9/14/20 / Page 17
Q30a. Have you had an attack involving the compromise of employees’ passwords in the past year? US UK DACH Benelux Scandinavia ANZ TotalYes 42% 43% 36% 37% 42% 48% 41%No 50% 51% 55% 54% 48% 45% 51%Unsure 8% 6% 8% 9% 10% 7% 8%Total 100% 100% 100% 100% 100% 100% 100%
Q30b. If yes, on average how much did each attack cost your organization? US UK DACH Benelux Scandinavia ANZ TotalLess than $10,000 3% 5% 3% 5% 6% 7% 4%$10,001 to $50,000 7% 17% 19% 21% 29% 24% 24%$50,001 to $100,000 11% 21% 17% 23% 23% 16% 18%$100,001 to $250,000 20% 28% 22% 29% 20% 19% 23%$250,001 to $500,000 30% 19% 30% 17% 19% 31% 25%$500,001 to $1,000,000 18% 8% 6% 5% 3% 3% 9%More than $1,000,000 11% 2% 4% 0% 0% 0% 4%Cannot determine 0% 0% 0% 0% 0% 0% 0%
Total 100% 100% 100% 100% 100% 100% 100%Extrapolated value 425,000 225,350 262,197 175,800 155,000 191,319 267,408
Managing Cybersecurity Teleworking RisksPresented by Ponemon Institute
Sponsored by KeeperPrivate and Confidential Document Dated 9/14/20 / Page 18
D2. Which of the following commands do you report to in your current role? US UK DACH Benelux Scandinavia ANZ TotalBusiness owner/board 7% 6% 3% 5% 5% 6% 5%CEO/executive committee 4% 4% 4% 3% 4% 3% 4%COO or head of operations 1% 2% 2% 0% 2% 1% 1%CFO, controller or head of finance 0% 1% 1% 2% 1% 0% 1%CIO or head of corporate IT 38% 45% 48% 40% 43% 44% 43%Business unit leader or general manager 9% 9% 8% 9% 10% 11% 9%Head of compliance or internal audit 5% 4% 5% 4% 6% 7% 5%Head of risk management 6% 7% 6% 7% 4% 5% 6%Head of IT security 30% 20% 21% 29% 24% 23% 25%Other (please specify) 0% 1% 2% 1% 2% 0% 1%Total 100% 100% 100% 100% 100% 100% 100%