27
Final Report cycling safety study Summary Report
Final Report cycling
s a f e t y s t u d y Summary Report
CITY OF VANCOUVER
CYCLING SAFETY STUDY
SUMMARY REPORT
January 22, 2015
Prepared by
Prepared by Urban Systems, in association with
the Cycling in Cities Research Program at the
University of British Columbia and Simon Fraser
University
Reported cyclist collision data provided by ICBC
USL File No. 1166.0024.01
Photo Credits:
Back Page: Paul Krueger
All Other Photos: Urban Systems
City of Vancouver
Cycling Safety Study
Summary Report
i
s
City of Vancouver
Cycling Safety Study
Summary Report
2
1.0 Introduction
The City of Vancouver is one of the most bicycle-friendly cities in North America. It
has an extensive bicycle network that is well used by residents and visitors, as well
as one of the highest cycling mode shares among major North American cities.
According to the 2011 Canadian National Household Survey, cycling accounts for
approximately 4.4% of all trips to work in the City of Vancouver.
The City recognizes the critical role that cycling can play in creating green and
livable communities, and is committed toward making cycling safe, convenient,
and comfortable for people of all ages and abilities. The City’s Transportation Plan,
Transportation 2040, sets a target that two-thirds of all trips by 2040 will be made by
walking, cycling or transit. Transportation 2040 also sets a target to work towards
zero traffic-related fatalities, and places a special emphasis on safety for
vulnerable road users, including pedestrians and cyclists. One of the
recommended actions in Transportation 2040 was the development of a city-wide
Cycling Safety Study to provide a better understanding of cycling safety hotspots
and concerns.
A wide range of engineering treatments can be used to improve cycling safety,
such as protected bicycle lanes, buffered bicycle lanes, coloured conflict zone
markings, and protected bicycle signal phases. In addition to engineering
treatments, education and encouragement initiatives can help to raise awareness
among bicycle users, pedestrians, and motorists about how to safely share the
road and improve the behaviour of those driving and cycling.
The City has taken several significant steps in recent years to improve cycling
safety, including the installation of a number of engineering treatments such as
protected bicycle lanes, spot improvements at high collision intersections,
installation of signage and pavement markings, traffic control upgrades at key
intersections, and installation of coloured pavement markings in vehicle-bicycle
conflict zones. The City also has an Active Transportation Policy Council to advise
on matters that encourage and enhance cycling as a means of transportation,
recreation and health. In addition, the City is developing an Active Transportation
Promotion and Enabling Plan which identifies strategies that can help promote
active transportation for all residents.
The Cycling Safety Study builds on these initiatives and provides critical information
on key safety and design concerns within the bikeway network that, if addressed,
can further position cycling as a safe, comfortable, and attractive transportation
choice for people of all ages and abilities.
This study provides a comprehensive and objective review of the safety of cycling
in the City of Vancouver and provides an action plan to address each of the
identified cycling safety issues. This study involved an in-depth analysis of all
City of Vancouver
Cycling Safety Study
Summary Report
3
collisions reported to the Insurance Corporation of British Columbia (ICBC) involving
bicycle users and motor vehicles in the City of Vancouver between 2007 and 2012.i
In addition, the study analyzed the injury data from bicycling crashes that resulted
in treatment at a hospital emergency room in Vancouver in 2008 and 2009 from
the Bicyclists’ Injuries and Cycling Environment (BICE) study conducted through the
University of British Columbia Cycling and Cities program.ii Based on these
datasets, the analysis examined WHERE reported cycling collisions and injury
crashes took place, HOW they occurred, WHEN they took place, and WHO was
involved.
2.0 Vancouver in Context
The ICBC data included 2,994 reported collisions involving bicycle users and motor
vehicles between 2007 and 2012 in the City of Vancouver, equivalent to an
average of approximately 500 reported cycling collisions per year. In comparison,
there was an average of 50,145 total reported collisions in Vancouver per year over
this period. As such, on average, approximately 1.0% of all reported motor vehicle
collisions involved a bicycle user over this period.
The overall number of reported collisions involving bicycle users and motor vehicles
in Vancouver has been relatively stable on an annual basis over the past fifteen
years and beyond, although it should be noted that there was a pronounced
increase in the number of reported cycling collisions in 2001, which is likely a result
of the increased number of bicycle trips made during the transit strike.
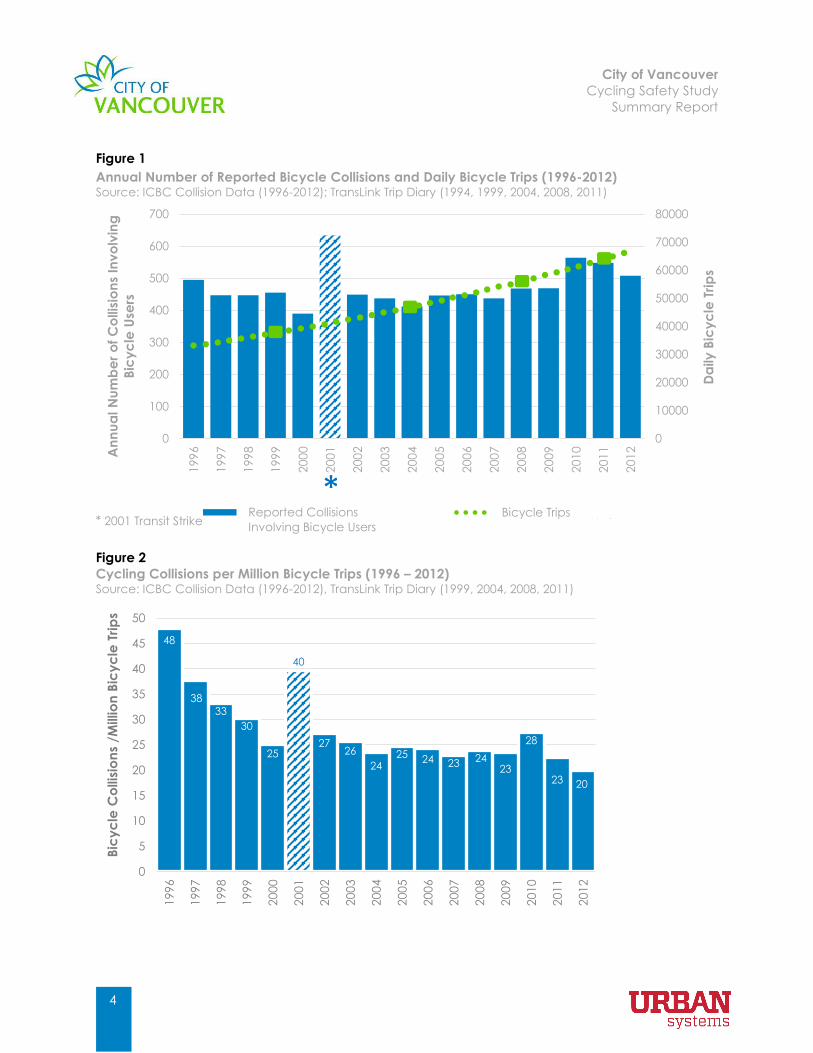
Although the absolute number of reported cycling collisions has remained
relatively stable since 1996, there has been a significant increase in the City’s
population as well as the number of bicycle trips made over this period. As shown
in Figure 1, although the number of daily cycling trips has steadily increased since
1999, this has not translated into an increase in the number of reported cycling
collisions. As a result, the rate of cycling collisions in Vancouver has been steadily
declining over the past fifteen years, as shown in Figure 2. In fact, the annual
cycling collision rate in Vancouver decreased by approximately 59% between
1996 and 2012, from approximately 48 to 20 reported cycling collisions per million
bicycle trips.
i For the remainder of this report, the term “reported cycling collisions” has been used to refer to
collisions reported to ICBC involving bicycle users and motor vehicles. ii For the remainder of this report, the term “cycling injury crashes” has been used to refer to injury data
from the BICE Study based on bicycling crashes that resulted in treatment at a hospital emergency room
in Vancouver.
City of Vancouver
Cycling Safety Study
Summary Report
4
Figure 1
Annual Number of Reported Bicycle Collisions and Daily Bicycle Trips (1996-2012) Source: ICBC Collision Data (1996-2012); TransLink Trip Diary (1994, 1999, 2004, 2008, 2011)
Figure 2
Cycling Collisions per Million Bicycle Trips (1996 – 2012) Source: ICBC Collision Data (1996-2012), TransLink Trip Diary (1999, 2004, 2008, 2011)
0
10000
20000
30000
40000
50000
60000
70000
80000
0
100
200
300
400
500
600
700
199
6
199
7
199
8
199
9
200
0
200
1
200
2
200
3
200
4
200
5
200
6
200
7
200
8
200
9
201
0
201
1
201
2An
nu
al N
um
be
r o
f C
ollis
ion
s In
vo
lvin
g
Bic
yc
le U
sers
Bicycle Collisions Bicycle Trips Expon. (Bicycle Trips)
48
38
33
30
25
40
2726
2425 24 23 24
23
28
23 20
0
5
10
15
20
25
30
35
40
45
50
199
6
199
7
199
8
199
9
200
0
200
1
200
2
200
3
200
4
200
5
200
6
200
7
200
8
200
9
201
0
201
1
201
2
Bic
yc
le C
ollis
ion
s /M
illio
n B
icy
cle
Tri
ps
Da
ily
Bic
yc
le T
rip
s
* Reported Collisions
Involving Bicycle Users Bicycle Trips
* 2001 Transit Strike
City of Vancouver
Cycling Safety Study
Summary Report
5
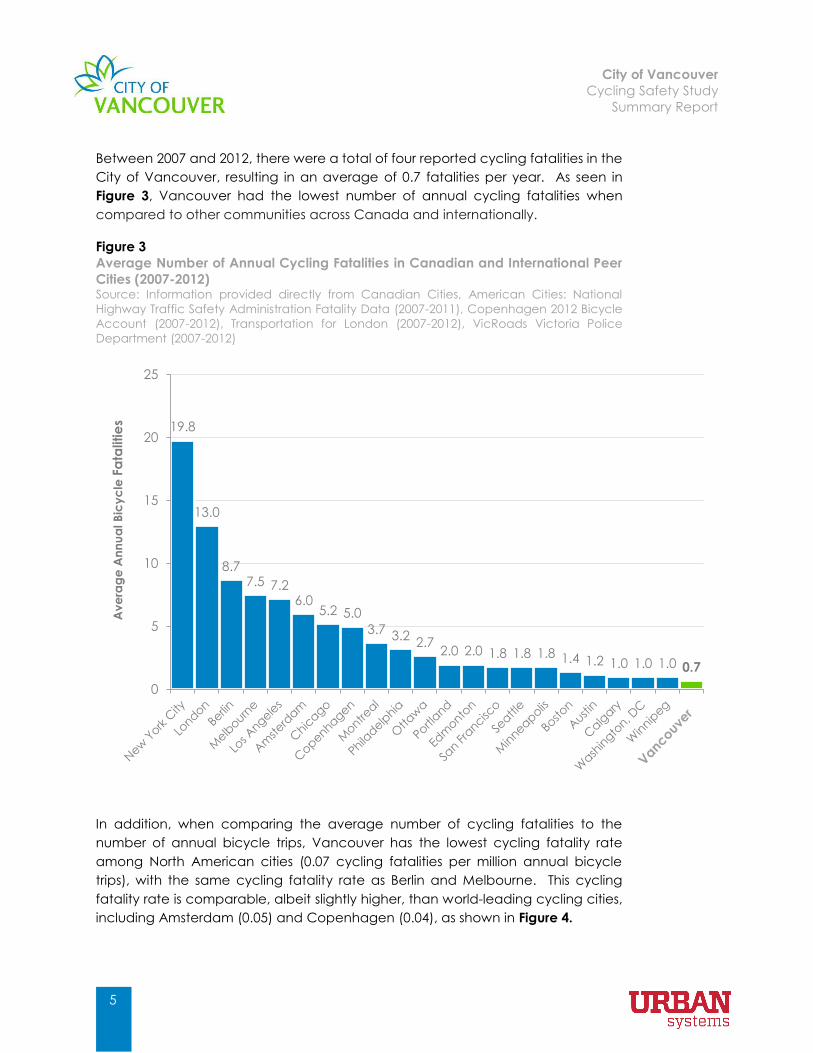
Between 2007 and 2012, there were a total of four reported cycling fatalities in the
City of Vancouver, resulting in an average of 0.7 fatalities per year. As seen in
Figure 3, Vancouver had the lowest number of annual cycling fatalities when
compared to other communities across Canada and internationally.
Figure 3
Average Number of Annual Cycling Fatalities in Canadian and International Peer
Cities (2007-2012) Source: Information provided directly from Canadian Cities, American Cities: National
Highway Traffic Safety Administration Fatality Data (2007-2011), Copenhagen 2012 Bicycle
Account (2007-2012), Transportation for London (2007-2012), VicRoads Victoria Police
Department (2007-2012)
In addition, when comparing the average number of cycling fatalities to the
number of annual bicycle trips, Vancouver has the lowest cycling fatality rate
among North American cities (0.07 cycling fatalities per million annual bicycle
trips), with the same cycling fatality rate as Berlin and Melbourne. This cycling
fatality rate is comparable, albeit slightly higher, than world-leading cycling cities,
including Amsterdam (0.05) and Copenhagen (0.04), as shown in Figure 4.
19.8
13.0
8.77.5 7.2
6.05.2 5.0
3.7 3.22.7
2.0 2.0 1.8 1.8 1.8 1.4 1.2 1.0 1.0 1.0 0.7
0
5
10
15
20
25
Av
era
ge
An
nu
al B
icy
cle
Fa
talitie
s

City of Vancouver
Cycling Safety Study
Summary Report
6
Figure 4
Average Bicycle Fatalities per Million Annual Bicycle Trips in Canadian and
International Peer Cities (2007-2012) Source: Information provided directly from Canadian Cities, American Cities: National
Highway Traffic Safety Administration Fatality Data (2007-2011), Copenhagen 2012 Bicycle
Account (2007-2012), Transportation for London (2007-2012), VicRoads Victoria Police
Department (2007-2012)
3.0 Summary of Findings
Overall cycling collision locations between 2007 and 2012 in the City of Vancouver
are shown in Figure 5. The following section provides a brief summary of the key
cycling safety issues that were identified based on the analysis of cycling collisions
over the past six years in the City of Vancouver, including WHERE cycling collisions
took place, HOW the collisions occurred, WHEN they took place, and WHO was
involved.
0
0.1
0.2
0.3
0.4
0.5
0.6
0.7
0.8
0.9
1
0%
5%
10%
15%
20%
25%
30%
35%
40%
Am
ste
rda
m
Co
pe
nh
ag
en
Be
rlin
Me
lbo
urn
e
Po
rtla
nd
Va
nc
ou
ve
r
Min
ne
ap
olis
Mo
ntr
ea
l
Sa
n F
ran
cis
co
Se
att
le
Wa
shin
gto
n,
DC
Ott
aw
a
Win
nip
eg
Lon
do
n
Ph
ilad
elp
hia
Bo
sto
n
Ed
mo
nto
n
Ca
lga
ry
Au
stin
Ch
ica
go
Los
An
ge
les
Ne
w Y
ork
City
Ave
ag
e B
icy
cle
Fa
talitie
s /
Millio
n A
nn
ua
l B
icy
cle
Trip
s
Bic
yc
le M
od
e S
ha
re (
%)
Bicycle Mode Share (%) Average Fatalities Per One Million Daily Trips

City of Vancouver
Cycling Safety Study
Summary Report
7
Figure 5
Concentration of Reported Cycling Collisions (2007-2012) Source: ICBC Collision Data (2007-2012)
Where
The highest number of reported cycling collisions was in the Downtown core
and the Metro Core of Vancouver, with reported cycling collisions
concentrated along several key corridors such as Burrard Street, Main
Street, 10th Avenue, Commercial Drive and Cypress Street.
61 locations throughout the City had at least one reported cycling collision
per year between 2007 and 2012; these 61 locations represented 4% of all
reported cycling collision locations, but accounted for 20% of all reported
cycling collisions.
Local Street Bikeways Painted Bike Lanes Painted Shared-Use Lanes Protected Bikeways
Local Street Bikeways
Painted Bicycle Lanes
Painted Shared-Use Lanes
Protected Bikeways
City of Vancouver
Cycling Safety Study
Summary Report
8
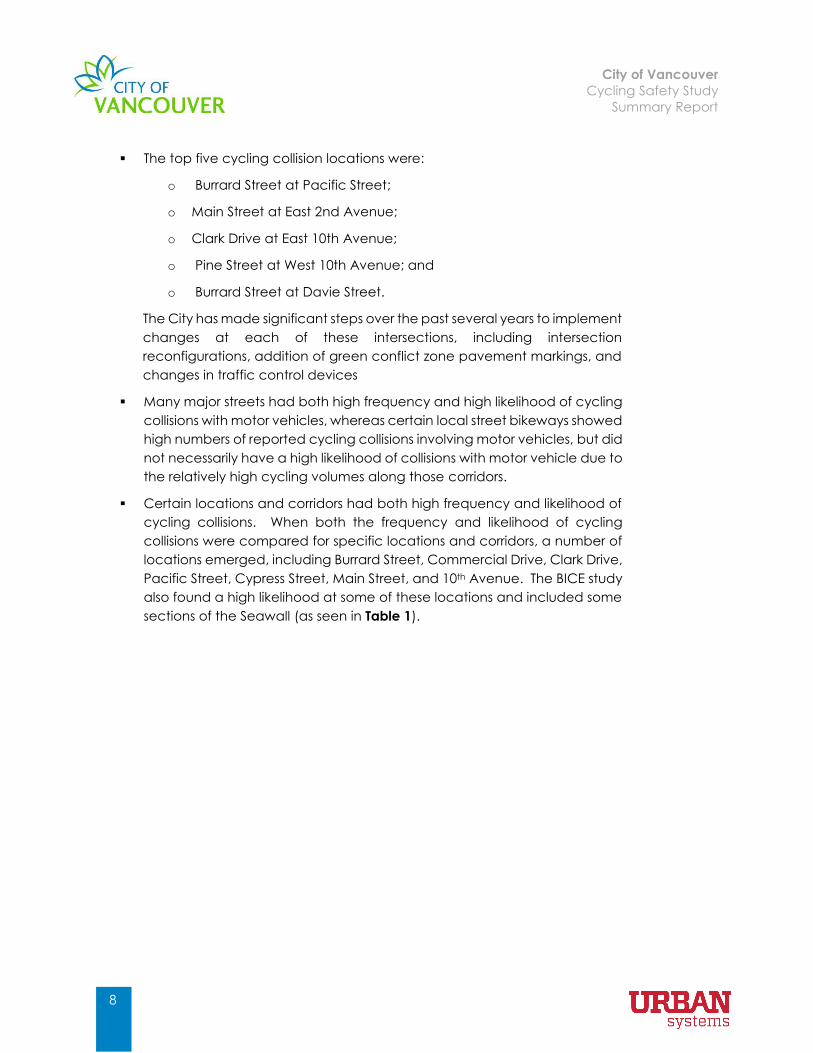
The top five cycling collision locations were:
o Burrard Street at Pacific Street;
o Main Street at East 2nd Avenue;
o Clark Drive at East 10th Avenue;
o Pine Street at West 10th Avenue; and
o Burrard Street at Davie Street.
The City has made significant steps over the past several years to implement
changes at each of these intersections, including intersection
reconfigurations, addition of green conflict zone pavement markings, and
changes in traffic control devices
Many major streets had both high frequency and high likelihood of cycling
collisions with motor vehicles, whereas certain local street bikeways showed
high numbers of reported cycling collisions involving motor vehicles, but did
not necessarily have a high likelihood of collisions with motor vehicle due to
the relatively high cycling volumes along those corridors.
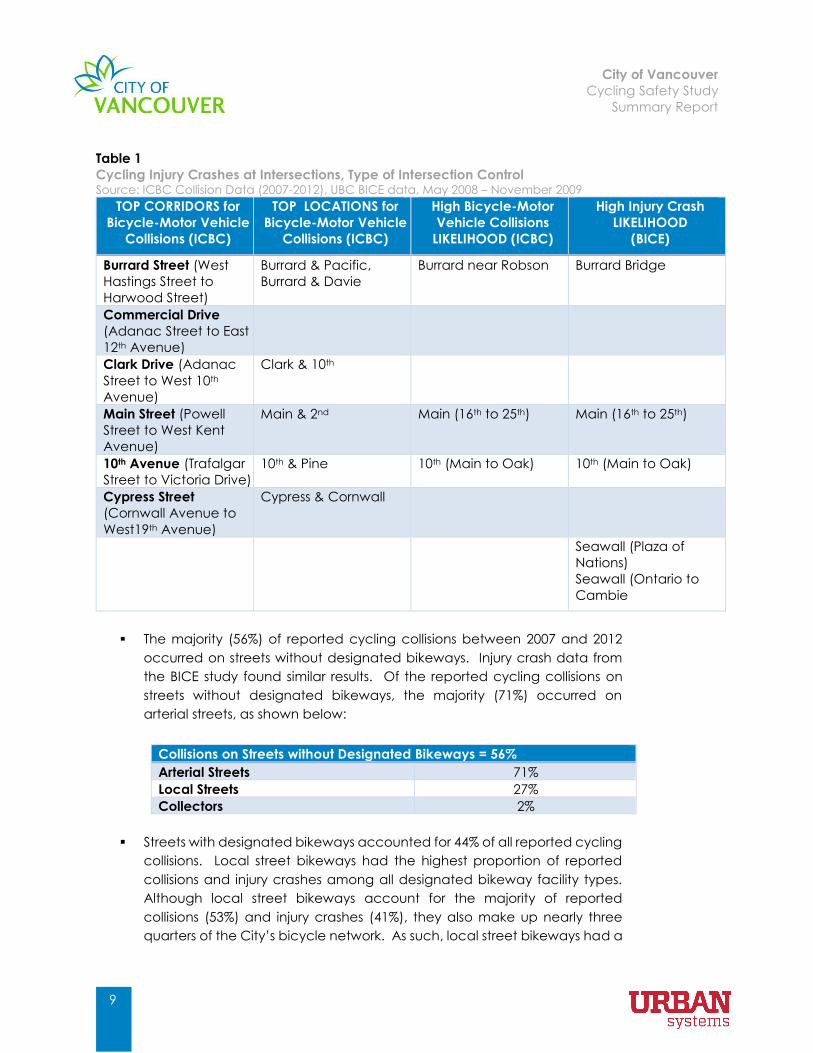
Certain locations and corridors had both high frequency and likelihood of
cycling collisions. When both the frequency and likelihood of cycling
collisions were compared for specific locations and corridors, a number of
locations emerged, including Burrard Street, Commercial Drive, Clark Drive,
Pacific Street, Cypress Street, Main Street, and 10th Avenue. The BICE study
also found a high likelihood at some of these locations and included some
sections of the Seawall (as seen in Table 1).
City of Vancouver
Cycling Safety Study
Summary Report
9
Table 1
Cycling Injury Crashes at Intersections, Type of Intersection Control Source: ICBC Collision Data (2007-2012), UBC BICE data, May 2008 – November 2009
TOP CORRIDORS for
Bicycle-Motor Vehicle
Collisions (ICBC)
TOP LOCATIONS for
Bicycle-Motor Vehicle
Collisions (ICBC)
High Bicycle-Motor
Vehicle Collisions
LIKELIHOOD (ICBC)
High Injury Crash
LIKELIHOOD
(BICE)
Burrard Street (West
Hastings Street to
Harwood Street)
Burrard & Pacific,
Burrard & Davie
Burrard near Robson Burrard Bridge
Commercial Drive
(Adanac Street to East
12th Avenue)
Clark Drive (Adanac
Street to West 10th
Avenue)
Clark & 10th
Main Street (Powell
Street to West Kent
Avenue)
Main & 2nd Main (16th to 25th) Main (16th to 25th)
10th Avenue (Trafalgar
Street to Victoria Drive)
10th & Pine 10th (Main to Oak) 10th (Main to Oak)
Cypress Street
(Cornwall Avenue to
West19th Avenue)
Cypress & Cornwall
Seawall (Plaza of
Nations)
Seawall (Ontario to
Cambie
The majority (56%) of reported cycling collisions between 2007 and 2012
occurred on streets without designated bikeways. Injury crash data from
the BICE study found similar results. Of the reported cycling collisions on
streets without designated bikeways, the majority (71%) occurred on
arterial streets, as shown below:
Collisions on Streets without Designated Bikeways = 56%
Arterial Streets 71%
Local Streets 27%
Collectors 2%
Streets with designated bikeways accounted for 44% of all reported cycling
collisions. Local street bikeways had the highest proportion of reported
collisions and injury crashes among all designated bikeway facility types.
Although local street bikeways account for the majority of reported
collisions (53%) and injury crashes (41%), they also make up nearly three
quarters of the City’s bicycle network. As such, local street bikeways had a
City of Vancouver
Cycling Safety Study
Summary Report
10
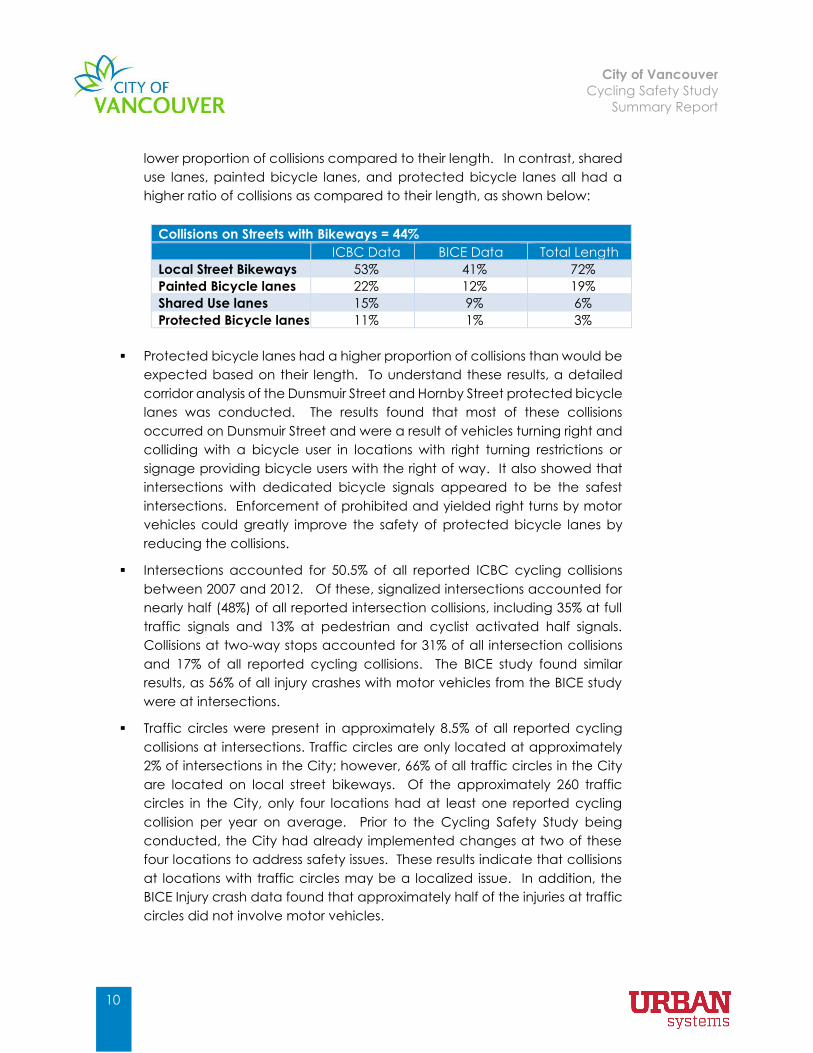
lower proportion of collisions compared to their length. In contrast, shared
use lanes, painted bicycle lanes, and protected bicycle lanes all had a
higher ratio of collisions as compared to their length, as shown below:
Collisions on Streets with Bikeways = 44%
ICBC Data BICE Data Total Length
Local Street Bikeways 53% 41% 72%
Painted Bicycle lanes 22% 12% 19%
Shared Use lanes 15% 9% 6%
Protected Bicycle lanes 11% 1% 3%
Protected bicycle lanes had a higher proportion of collisions than would be
expected based on their length. To understand these results, a detailed
corridor analysis of the Dunsmuir Street and Hornby Street protected bicycle
lanes was conducted. The results found that most of these collisions
occurred on Dunsmuir Street and were a result of vehicles turning right and
colliding with a bicycle user in locations with right turning restrictions or
signage providing bicycle users with the right of way. It also showed that
intersections with dedicated bicycle signals appeared to be the safest
intersections. Enforcement of prohibited and yielded right turns by motor
vehicles could greatly improve the safety of protected bicycle lanes by
reducing the collisions.
Intersections accounted for 50.5% of all reported ICBC cycling collisions
between 2007 and 2012. Of these, signalized intersections accounted for
nearly half (48%) of all reported intersection collisions, including 35% at full
traffic signals and 13% at pedestrian and cyclist activated half signals.
Collisions at two-way stops accounted for 31% of all intersection collisions
and 17% of all reported cycling collisions. The BICE study found similar
results, as 56% of all injury crashes with motor vehicles from the BICE study
were at intersections.
Traffic circles were present in approximately 8.5% of all reported cycling
collisions at intersections. Traffic circles are only located at approximately
2% of intersections in the City; however, 66% of all traffic circles in the City
are located on local street bikeways. Of the approximately 260 traffic
circles in the City, only four locations had at least one reported cycling
collision per year on average. Prior to the Cycling Safety Study being
conducted, the City had already implemented changes at two of these
four locations to address safety issues. These results indicate that collisions
at locations with traffic circles may be a localized issue. In addition, the
BICE Injury crash data found that approximately half of the injuries at traffic
circles did not involve motor vehicles.
City of Vancouver
Cycling Safety Study
Summary Report
11
When bicycle volumes were taken into account by neighbourhood,
neighbourhoods with the highest collision likelihoods were Sunset,
Shaughnessy, Victoria-Fraserview and Killarney. This suggests that the
neighbourhoods with the least amount of cycling and cycling infrastructure
had the highest cycling collision likelihood.
What & How
The top ten types of reported cycling collisions accounted for 69% of all
known collision types, while the top five accounted for 44%. The top types
of reported cycling collisions are described below and shown in Figure 6:
1. Doorings: Vehicle and bicycle user collided mid-block as vehicle door
was opening (15.2% of reported cycling collisions).
2. Conflict Zones: Vehicle and bicycle user collided mid-block as the
vehicle as entering or exiting an alley, parking lot, or driveway (10.7%).
3. Right Hooks: Vehicle turned right at a signal as bicycle user crossed at
signal with right-of-way (6.5%).
4. Sidewalk Riding: Bicycle user was riding on the sidewalk prior to collision
(6.1%, including 2.7% mid-block and 3.4% intersection).
5. Mid-Block: Vehicle and bicycle user collided while travelling in the
same direction (5.7%).
6. Left Cross: Vehicle turned left at a signal while a bicycle user entered
intersection with right-of-way (5.4%).
7. Intersections: Vehicle proceeded straight through a signal when right-
of-way was unclear (5.2%).
8. Traffic Circles: Vehicle and bicycle user collided in an intersection with
a traffic circle (4.9%).
9. Left Cross (Stop Signs): Vehicle turned left as a bicycle user crossed at
two-way stop with right of way (4.6%).
10. Two-Way Stops: Vehicle went straight as bicycle user crossed at two-
way stop with right-of-way (4.5%).

City of Vancouver
Cycling Safety Study
Summary Report
12
Figure 6
Reported ICBC Collision Locations and Types Source: ICBC Collision Data (2007-2012)
Approximately half (50.5%) of all reported collisions involving bicycle users
and motor vehicles took place when the bicycle user was crossing an
intersection. The majority of intersection collisions occurred when the cyclist
was travelling straight through the intersection, while a vehicle turned either
right or left. The top collision types for intersection and mid-block locations
are shown in Table 2.
Table 2
Top Collision Types
Source: ICBC Collision Data (2007-2012)
Top Collision Types
Intersections – 50.5% Mid-Block Collisions – 40.4%
Right turning vehicles – 12.6% Doorings – 15.2%
Left turning vehicles – 14.9% Driveways, alleyways, and parking lots – 10.7%
Traffic circles – 5% Travelling the same direction – 5.7%
Sidewalk riding – 3.4% Sidewalk riding – 2.7%
The most common type of reported cycling collisions were doorings, which
occurs when a driver opens the motor vehicle door and a cyclist collides
City of Vancouver
Cycling Safety Study
Summary Report
13
with it. Doorings occurred mostly on arterial streets without designated
bikeways, particularly on sections of the street where there were attractive
destinations, such as commercial high streets.
In the majority of cases, when collisions occurred at mid-block conflict
zones such as driveways, alleyways, and parking lots, the bicycle user was
usually proceeding straight ahead and the motor vehicle failed to yield.
The majority of these collisions occurred on arterial streets.
Collisions involving right turning vehicles occurred mostly at signalized
intersections, and 82% were on arterial streets.
Collisions involving left turning vehicles occurred mostly at signalized
intersections, and mostly on arterial streets.
Traffic circles appear to be a localized issue for collisions with motor vehicles
based on ICBC data as noted previously; however, when looking at the
supporting BICE data it was found that approximately half of the injury
crashes at traffic circles were with motor vehicles. This suggests that the
design treatments and intersection geometry should be carefully
considered with traffic circles.
Collisions resulting from sidewalk riding were found to occur when the
bicycle user entered the intersection from the sidewalk or crossed a conflict
zone on a sidewalk; these are locations where the motor vehicle driver
typically would not expect to be encountering a bicycle.
In nearly 1,600 of the 2,994 collisions, ICBC data allowed the right-of-way to
be evaluated. In approximately 93% of cases, the cyclist appeared to have
the right-of-way.
The majority of collisions at intersections occurred when the bicycle user
was travelling with the right-of-way. These actions indicate that
educational and enforcement campaigns directed to motor vehicle
drivers would greatly benefit the safety of cyclists.
When
Winter months (December, January and February) had a higher likelihood
of cycling collisions, as the proportion of reported cycling collisions was
higher than would be expected based on bicycle volumes during these
months.
The highest proportion of cycling collisions occurred during the afternoon
peak periods (between 4:00 pm and 7:00 pm), and this is also when the
highest proportion of cycling volumes occurred.
City of Vancouver
Cycling Safety Study
Summary Report
14
A higher proportion of reported cycling collisions occurred when it was
dark.
Bicycle users were particularly vulnerable when it was both dark and rainy,
particularly during the winter months when these conditions are more
prevalent.
Who
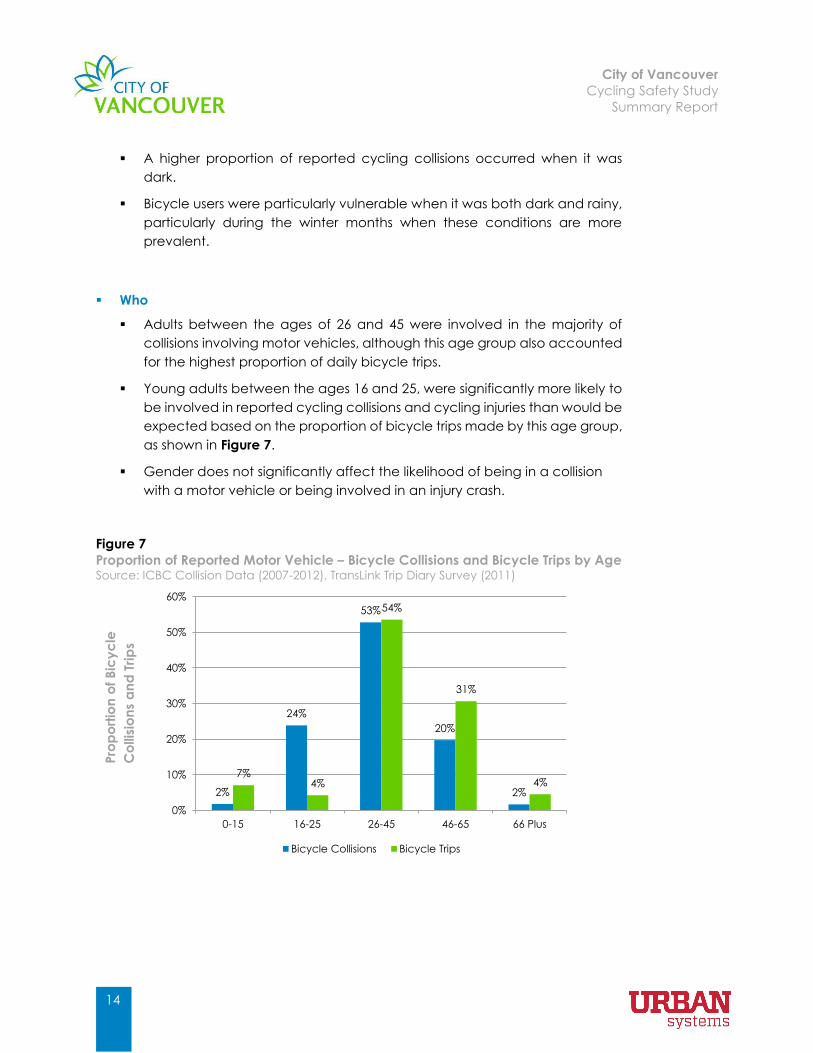
Adults between the ages of 26 and 45 were involved in the majority of
collisions involving motor vehicles, although this age group also accounted
for the highest proportion of daily bicycle trips.
Young adults between the ages 16 and 25, were significantly more likely to
be involved in reported cycling collisions and cycling injuries than would be
expected based on the proportion of bicycle trips made by this age group,
as shown in Figure 7.
Gender does not significantly affect the likelihood of being in a collision
with a motor vehicle or being involved in an injury crash.
Figure 7
Proportion of Reported Motor Vehicle – Bicycle Collisions and Bicycle Trips by Age Source: ICBC Collision Data (2007-2012), TransLink Trip Diary Survey (2011)
2%
24%
53%
20%
2%
7%4%
54%
31%
4%
0%
10%
20%
30%
40%
50%
60%
0-15 16-25 26-45 46-65 66 Plus
Bicycle Collisions Bicycle Trips
Pro
po
rtio
n o
f B
icy
cle
Co
llis
ion
s a
nd
Tri
ps
City of Vancouver
Cycling Safety Study
Summary Report
15
4.0 Action Plan
Based on the analysis of reported cycling collision data from ICBC and supported
by the cycling injury crash data from the BICE study, this study identified the
following twelve key cycling safety issues:
Key Issue 1 Doorings
Key Issue 2 Conflict Zones
Key Issue 3 Right Hooks
Key Issue 4 Left Crosses
Key Issue 5 Sidewalk Cycling
Key Issue 6 Two-way Stop Signs
Key Issue 7 Non Motor Vehicle Collisions
Key Issue 8 Collision Hotspots
Key Issue 9 High Collision Locations
Key Issue 10 Designated Bikeways
Key Issue 11 PM Peak
Key Issue 12 Adverse Weather and Low Light
The action plan addresses these twelve cycling safety issues, including a
description of each issue as well as engineering, education and enforcement
countermeasures recommended to address each issue.
Key Issue 1 Doorings
Doorings were the most common type of cycling collision in the City of Vancouver,
representing approximately 15.2% of all reported cycling collisions. Doorings occur
when bicycle users are struck by or strike a door of a parked motor vehicle, typically
on the driver side. Approximately two-thirds (67%) of all doorings occurred on
arterial streets without designated bikeways (such as Broadway, Commercial Drive
and Main Street). In addition, approximately 20% of doorings occurred on local
street bikeways such as 10th Avenue.
Engineering treatments to address doorings include: investigating the feasibility of
providing buffered or protected bicycle lanes; considering removing on-street
parking where feasible; ensuring that bikeways are on the passenger side of motor
vehicle parking lanes; and seeking to provide an adequate buffer space between
parking lanes and bicycle lanes if the bikeway is on the driver side of the motor
vehicle.
City of Vancouver
Cycling Safety Study
Summary Report
16
Education measures to address doorings can include: education campaigns for
drivers reminding them to look for bicycles before opening their door; education
campaigns for bicycle users to raise awareness of the risk of dooring and how to
position themselves in the roadway; and encouraging ICBC and the Provincial
government to add educational material regarding the importance of looking for
bicycle users before opening the door in driver education and licensing.
Key Issue 2 Conflict Zones
Mid-block conflict zones such as driveways, parking lots and alleyways accounted
for approximately 10.7% of all collisions involving bicycle users and motor vehicles.
This type of collision occurred between a bicycle user and a motor vehicle entering
or exiting an alleyway, parking lot, or driveway. As the bicycle users were
proceeding straight ahead, motor vehicles were identified as failing to yield when
they were pulling in or out of these locations. The majority (58%) of conflict zone
collisions occurred on arterial streets. 56% of these arterial streets did not have
designated bikeways. Several locations were identified as hot spots for collisions
that occurred when drivers were entering or exiting an alleyway, parking lot, or
driveway, including: Burrard Street, Main Street, Broadway, Kingsway, 1st Avenue,
and 10th Avenue.
Engineering treatments to address conflict zone collisions include: continuing to
provide and retrofit existing conflict zone pavement markings at driveways and
alleyways that have high collisions involving bicycle users and motor vehicles;
consider providing bikeways or upgraded existing bikeways on routes with conflict
zones; providing warning or high bicycle collision location signage at driveways
and alleyways that have high collisions involving bicycle users and motor vehicles
and where there is no existing bikeway; and removing on-street parking
immediately adjacent to high activity driveways and alleyways to ensure bicycle
user visibility,
Education campaigns can be used to raise awareness of drivers to look for bicycle
users when entering or exiting a parking lot or alleyway.
Key Issue 3 Right Hooks
Collisions involving right turning vehicles, also known as ‘right hooks’, accounted
for approximately 12.6% of all reported cycling collisions. Most of the right hook
collisions occurred in the downtown core. The majority of the right hooks occurred
on arterial streets (82%), including 41% on arterial streets with no bikeways. Many
of these collisions occurred at signalized intersections when the bicycle user was
crossing with the signal. A higher than expected number of right hooks occurred
on Dunsmuir Street after the protected bicycle lanes were installed and involved
City of Vancouver
Cycling Safety Study
Summary Report
17
motor vehicles making prohibited right turns and colliding with bicycle users or
motor vehicles failing to yield to bicycles.
Engineering treatments to address right hook collisions include: prohibiting right
turns on red at locations with high cycling volumes and/or locations with a high
number of right hook collisions; using dedicated signal phasing to provide bicycle
users a separate phase; pulling back the motor vehicle stop bar behind the stop
bar for the bicycles to increase visibility of the bicycle users; implementing right turn
only lanes for motor vehicles at intersections where there is sufficient space;
considering installing protected intersections, which utilize a combination of
bicycle signal phases and design elements as well as space allocation to help
protect cyclists from turning vehicles; continuing to provide and retrofit green
coloured conflict zone markings and dashed lane markings through intersections;
and prohibiting all right turns where there is a high number of right hook collisions
and where it is not feasible to provide a dedicated right turn only lane, particularly
where the right turn crosses a bi-directional separated bicycle lane.
Education, such as, a road safety awareness campaign could be directed at both
drivers and bicycle users, reminding them to look out for each other at
intersections.
Regular enforcement of restricted motor vehicle right-turns by police should also
be encouraged, with a focus on intersections with high numbers of cycling
collisions or illegal motor vehicle movements, particularly Dunsmuir Street.
Key Issue 4 Left Crosses
Collisions involving left turning vehicles at intersections, also known as left crosses,
were the most common type of vehicle movement resulting in a reported cycling
collision (14.9%). Similar to collisions involving right turning vehicles, many of these
collisions occurred at signalized intersections when the bicycle user was crossing
with the signal. Similar to other key issues, the majority of left cross collisions
occurred on arterial streets, with 36% of left crosses occurring on arterial streets with
no designated bikeways. The majority (77%) of left cross collisions occurred while
the bicycle user and motorist were travelling in opposing directions on the same
street.
Engineering treatments to address left cross collisions include: implementing uni-
directional protected bikeways where possible; pursuing design options that
discourage cycling the wrong way in a bikeway; implementing left turn only lanes
where there is sufficient space; continuing to provide and retrofit green coloured
conflict zone markings and dashed lane markings through intersections; and
considering installing protected intersections at high collision intersections.
City of Vancouver
Cycling Safety Study
Summary Report
18
Educational campaigns can be developed that highlight the importance of
vehicles being aware to look for bicycle users as they are making left turns and for
bicycle users to make themselves more visible to motorists.
Key Issue 5 Sidewalk Cycling
Approximately 6% of reported cycling collisions occurred where the bicycle users
were reportedly riding on the sidewalk prior to entering an intersection or conflict
zone. Sidewalk cycling can create visibility challenges with motor vehicles who
may not be expecting them at intersections or conflict zones, and also can create
safety concerns with pedestrians and other sidewalk users. Due to the location of
the incidents of sidewalk cycling, in many cases it is likely that bicycle users may be
using sidewalks because there are insufficient and/or uncomfortable bicycle
routes on the adjacent street. Most sidewalk cycling incidents resulted in two types
of collisions: mid-block collisions as the motor vehicle was entering or exiting a
driveway or alleyway, and intersection collisions where the motor vehicle was
turning right.
The top collision locations where bicycle users were riding on the sidewalk include
Kingsway, Hastings Street, Clark Drive, Main Street, Commercial Drive, Victoria
Drive, and 10th Avenue. None of the arterial streets noted above have designated
bicycle facilities, with the exception of Main Street, which has shared use lanes.
The feasibility of providing on-street bikeways where possible, on streets with high
numbers of bicycle users on sidewalks, should be investigated.
Awareness and education campaigns directed to bicycle users can also be
developed informing them that riding on the sidewalk poses its own risks, is not safe,
and is illegal in most cases. Vehicles are not expecting bicycle users to be on
sidewalks and are not looking for them, and there is increased likelihood of bicycle
users colliding with pedestrians on the sidewalk.
Enforcement campaigns can highlight the risks of sidewalk cycling, particularly at
conflict zones.
Key Issue 6 Two-Way Stops
Collisions at two-way stops involving all motor vehicle turning movements (right
turns, left turns, and straight motor vehicle movements) accounted for 31% of all
intersection collisions and 17% of all reported cycling collisions. In all cases where
right of way could be determined for two-way stops most of the collisions (84%)
occurred as a result of the vehicle not stopping at the stop sign while the bicycle
users had the right of way (was on the major street that did not have the stop sign).
City of Vancouver
Cycling Safety Study
Summary Report
19
Engineering treatments to improve cycling safety at two-way stops include speed
reduction treatments that slow all road users down as they are entering the
intersection, such as curb extensions, raised crosswalks, and raised intersections;
and remove on-street parking adjacent to the stop sign to improve bicycle user
visibility. Other strategies can include education campaigns to watch for bicycle
users in intersections, and enforcement for road users not stopping at stop signs,
especially at high collision locations.
Key Issue 7 Non-Motor Vehicle Collisions
This key issue summarizes cycling injury crash results from the BICE study. It includes
non-motor vehicle injury crashes between bicycle users and pedestrians, road
infrastructure, and debris. Collisions between bicycle users and pedestrians are
typically underreported or not reported at all. A number of studies and researchers
have worked to better understand the characteristics and frequency of collisions
between bicycle users and non-motor vehicles including collisions with pedestrians
and animals etc. The BICE study found that a minority of injury crashes were a result
of collisions with motor vehicles (37%), although another 10% involved avoidance
manoeuvres to avoid a motor vehicle collision. It found that 12% of cycling injuries
resulting in an emergency room visit were a result of bicycle users crashing because
of surface conditions (holes, bumps, roots, debris, leaves, etc.), 11% were a result
of infrastructure (curbs, bollards, posts, etc.), and 8% were a result of a collision with
a cyclist, pedestrian or animal.
Engineering treatments to address non-motor vehicle collisions include: developing
a reporting program with local partners to create a database of non-motor vehicle
collisions and near misses; collaborating with Vancouver Coastal Health to improve
the monitoring and analysis of cycling collisions and falls to supply pertinent and
timely information about injuries to City of Vancouver; providing separate
pedestrian and bicycle pathways instead of shared multi-use pathways where
feasible; separating pedestrians and bicycle users at crosswalks; ensuring bikeways
are well-maintained and clear of debris through ongoing maintenance and
sweeping; continuing to monitor pavement quality on all bicycle facilities to ensure
they have smooth surfaces; and ensuring that signage, poles and bollards are in
appropriate locations so as not to create vertical or horizontal obstructions.
Key Issue 8 High Collision Corridors
Several corridors throughout the City were identified that had a high density
(collisions/km) of reported cycling collisions. The top five collision corridors based
on collision density included: Burrard Street (West Hastings Street to Harwood
Street), Commercial Drive (Adanac Street to East 12th Avenue), Clark Drive
City of Vancouver
Cycling Safety Study
Summary Report
20
(Adanac Street to West 10th Avenue), Pacific Street (Hornby Street to Homer Street),
and Cypress Street (Cornwall Avenue to West 19th Avenue). In addition, high
collision frequencies were also found on 10th Avenue (Trafalgar Street to Victoria
Drive), Main Street (Powell Street to West Kent Avenue), and Broadway (Highbury
Street to Commercial Drive). The highest collision corridors generally
corresponded with streets with designated bikeways. This likely indicates that they
have a high level of usage.
Engineering treatments include proactively addressing cycling safety issues along
high collision corridors and continuing to monitor cycling safety at locations with
high collision rates by: considering higher order bikeways on high collision corridors
or, in cases where this is not possible provide more comfortable routes on parallel
streets for all ages and abilities; considering collision prone corridors such as Main
Street, Burrard Street, and Commercial Drive for complete streets policies and
initiatives; and conducting corridor specific studies and/or in-service road safety
reviews of high collision corridors to identify potential safety measures.
In addition, engineering measures should be complemented with a road safety
awareness campaign to alert both motorists and bicycle users of the prevalence
of cycling collisions along corridors and at intersections and encourage more
caution in these areas. The City should also work with the VPD to perform
enforcement actions along corridors with high occurrences of collisions to
discourage unsafe behaviour on the part of both motorists and bicycle users.
Key Issue 9 High Collision Locations
It is also important to identify the specific high collision locations within the City of
Vancouver. There were nineteen locations that had more than 10 reported
collisions between 2007 and 2012 as identified by the ICBC data. Most of these
collisions occurred at intersections that were controlled by a full signal (72%),
followed by intersections with a half signal (17%) and a two-way stop (11%).
Engineering treatments to improve cycling safety at high collision locations include:
installing dedicated bicycle signals with separate bicycle signal phasing where
feasible and ensure all intersections have bicycle detection; continuing to provide
green coloured conflict zone markings and dashed lane markings through
intersections; Implementing dedicated left turn and right turn only lanes for motor
vehicles at intersections where there is sufficient space; providing a safe queuing
area for bicycles at intersections; and installing full traffic signals at intersections
where collision rates are high.
City of Vancouver
Cycling Safety Study
Summary Report
21
Key Issue 10 Designated Bikeways
This study has helped to identify some key collision locations based on the type of
bike facility or designated bikeway. While the majority of collisions occurred on
streets without designated bicycle facilities, there was still a significant percentage
(44%) of collisions that occurred on bikeways. There were three main takeaways
from the results of this study:
1. Arterial streets with no bicycle facilities were the most common location for
collisions.
2. Collisions occurred frequently on shared use lanes, particularly Main Street.
Main Street and 2nd Avenue had the second highest number of bicycle
collisions for a single intersection, and Main Street and 10th Avenue was
ranked seventh.
3. Local street bikeways had the highest number of reported collisions out of
all types of designated bikeways within the City of Vancouver, but are also
the most common. A fewer proportion of collisions occurred on local street
bikeways as compared to their prevalence within the city’s bicycle
network.
Engineering treatments include analyzing the feasibility of installing bikeways on
corridors with high cycling collisions, especially on routes with important
neighbourhood destinations such as shopping streets (ex. Broadway and Main
Street).
Key Issue 11 PM Peak
The collision data indicated that the majority of reported cycling collisions
occurred during the afternoon peak period. Reported cycling collisions were most
common between 4:00 and 7:00 pm, which accounted for nearly a third (31%) of
all reported cycling collisions. This is also when the highest proportion of cycling
volumes occurred.
The prominence of cycling collisions in the evening peak period offers
opportunities to efficiently improve safety, such as coordinating enforcement
actions during this time period. This time period has been identified as a high
activity period with high volumes of bicycle users, motorists and pedestrians.
Engineering treatments to address this issue include: providing more time for
bicycle users at intersections by coordinating signal timings, decreasing the wait at
push buttons, or installing bicycle-friendly signal timing; and providing more visibility
for bicycle users at intersections by installing advance stop line or bike boxes. In
addition, road safety educational awareness campaigns targeted at all road
commuters can be developed to inform of the high collision rates in the afternoon
City of Vancouver
Cycling Safety Study
Summary Report
22
peak periods and that all road users should exercise additional caution after a long
work day. Finally, enforcement actions can be concentrated in the 4:00 to 7:00pm
time period at collision hotspots and high risk locations.
Key Issue 12 Adverse Weather and Low Light
Research indicates that adverse weather and darker lighting conditions, which
occur with shorter winter days, can increase the occurrence of cycling collisions.
The number of bicycle trips is also significantly impacted by weather and seasonal
conditions. The study found that a higher than expected number of collisions
occurred in winter months, relative to the observed cycling volumes, particularly
when it was dark and rainy.
Engineering treatments to address this issue include: improving street lighting at
intersections with high collisions and on bikeways, particularly local street bikeways,
and ensuring road surfaces on bikeways are skid resistant and provide adequate
drainage to prevent water pooling and icy conditions.
Education campaigns can be developed to remind cyclists about additional
equipment such as bicycle lights that can increase cyclist visibility as the days get
shorter.
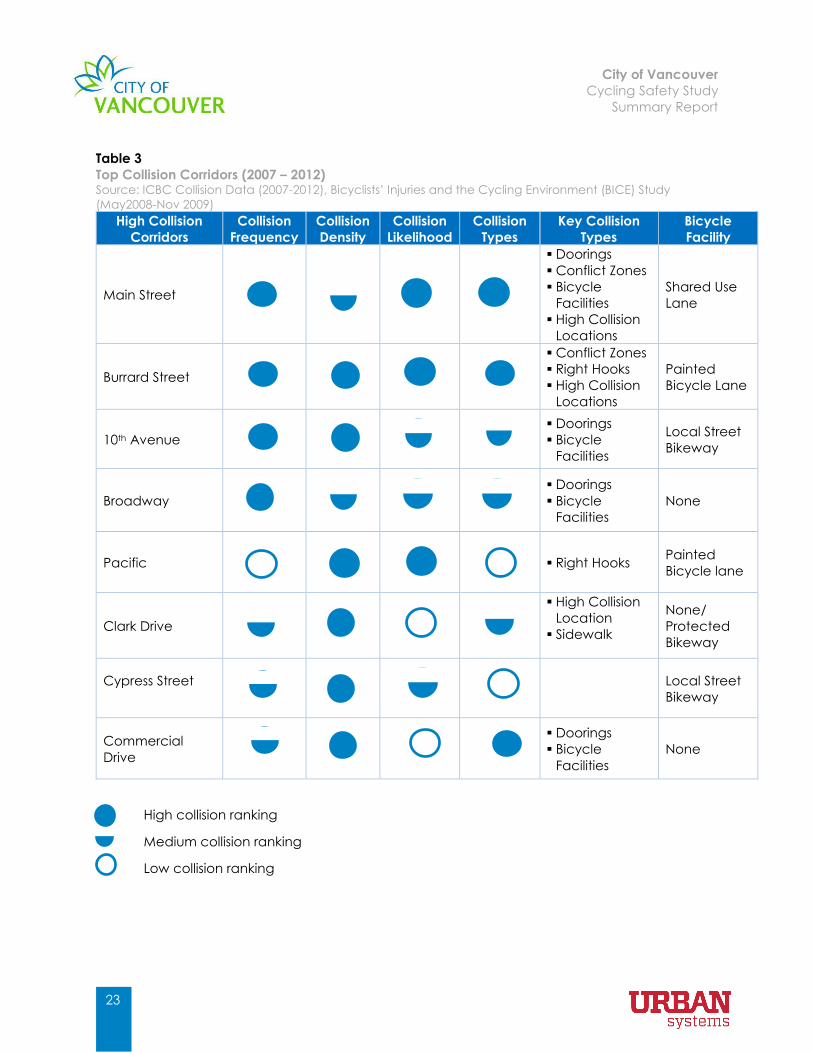
Summary
Based on the findings of this study, a number of corridors repeatedly emerged as
having a high collision frequency and/or likelihood, and presented a range of
cycling safety issues. Eight corridors in particular presented cycling safety issues as
shown in Table 3. Safety reviews should be conducted on these corridors in the
following priority:
Highest priority: Main Street and Burrard Street
Moderate priority: Commercial Drive, 10th Avenue, and Broadway.
Lower priority: Clark Drive, Pacific Street and Cypress Street.
In addition to these high collision corridors, a number of specific locations were
identified as having either high collision frequency or likelihood. Many of these
locations correspond with the high collision corridors. At high collision intersections,
a detailed intersection safety review should be conducted to identify cycling
safety issues and mitigation measures.
City of Vancouver
Cycling Safety Study
Summary Report
23
Table 3
Top Collision Corridors (2007 – 2012) Source: ICBC Collision Data (2007-2012), Bicyclists’ Injuries and the Cycling Environment (BICE) Study
(May2008-Nov 2009)
High Collision
Corridors
Collision
Frequency
Collision
Density
Collision
Likelihood
Collision
Types
Key Collision
Types
Bicycle
Facility
Main Street
Doorings
Conflict Zones
Bicycle
Facilities
High Collision
Locations
Shared Use
Lane
Burrard Street
Conflict Zones
Right Hooks
High Collision
Locations
Painted
Bicycle Lane
10th Avenue
Doorings
Bicycle
Facilities
Local Street
Bikeway
Broadway Doorings
Bicycle
Facilities
None
Pacific
Right Hooks Painted
Bicycle lane
Clark Drive
High Collision
Location
Sidewalk
None/
Protected
Bikeway
Cypress Street
Local Street
Bikeway
Commercial
Drive
Doorings
Bicycle
Facilities
None
High collision ranking
Medium collision ranking
Low collision ranking
City of Vancouver
Cycling Safety Study
Summary Report
24
In addition to engineering treatments at high collision corridors and locations, there
are a number of education and enforcement recommendations that should be
developed:
Doorings including campaigns targeted to motor vehicle drivers and
passengers to be sure to look out for bicycle users before opening their
door;
Sidewalk cycling, including informing bicycle users of the potential
hazards and collisions of riding on the sidewalks, and enforcement of
illegal sidewalk cycling;
Parking lot and driveway entrances and exits, including education
campaigns for both bicycle users and motor vehicle drivers;
Passing, including providing educational tools of the value of leaving
space between bicycle users and vehicles when passing and waiting
behind bicycle users as they are taking the lane to avoid doorings;
Providing increased awareness of potential risk during the afternoon
commute and dark and rainy conditions;
Providing increased awareness of hazards at locations with high
proportion of right/left turning vehicles;
Increased enforcement of vehicles violating right turn regulations; and
A joint education campaign for pedestrian and cyclist safety, providing
awareness of the number of collisions that occur when motor vehicles
are turning left and right.
The improvement of cycling safety within the City of Vancouver will require the
involvement and coordination of a number of agencies involved in cycling-related
infrastructure, operations, services, and enforcement. Some of these agencies
include the City of Vancouver, ICBC, Vancouver Police Department (VPD),
Vancouver Coastal Health (VCH), the BC Ministry of Health (MoH), TransLink, and
the Vancouver School Board (VSB). Through a collaborative effort among these
agencies focusing on a comprehensive range of strategies including engineering,
education, and enforcement measures, the City can work to improve cycling
safety and continue to be a leader in making cycling a safe, comfortable, and
attractive mode of transportation for people of all ages and abilities in Vancouver.
City of Vancouver
Cycling Safety Study
Summary Report
25


