Cynthia Steer Chief Research Strategist Managing Director, Fixed Income Research Telephone: 203-656-6716 [email protected]State Association of County Retirement Systems Fall Conference November 13-16, 2007
Section II The Case for Emerging Market Debt in 2007
Section III Understanding Emerging Market Countries as the New, Powerful Institutional Investor
3
Section I
The Case for Emerging Markets in 2004
4
Cartography and Investment Topography
5
Cartography and Investment Topography
In 2004, two definitions were useful in dividing the world and setting investment strategies and asset allocation targets:
Developed Markets
Emerging Markets
6
What is a Developed Market?
The implication is:
A nation that is industrialized (e.g., a well-developed manufacturing sector), has substantive infrastructure, and a well-developed service sector
A nation that has a per capita income higher than $9,655
A nation that has universal education and significant health indicators on infant mortality, life expectancy, and literacy
7
What is an Emerging Market?
The official definition:
An economy with low-to-middle per capita income as defined by the World Bank (i.e., less than $9,656 minimum GNP per capita)
Investable market cap is low relative to its most recent Gross Domestic Product (GDP)
8
What is an Emerging Market?
The implication is:
It is a nation that is in rapid transition, increasing in size, activity, or level of sophistication
It is a nation that is making an effort to change and improve its economy, as well as provide an infrastructure in order to become a developed nation
9
Cartography and Investment Topography (2004)
Like nature, nations gradually or glacially evolve from emerging to developed
And a few move back
What contributes to a successful evolution is a complex question as tectonic plates shift slowly
Why does it matter from an investment perspective?
10
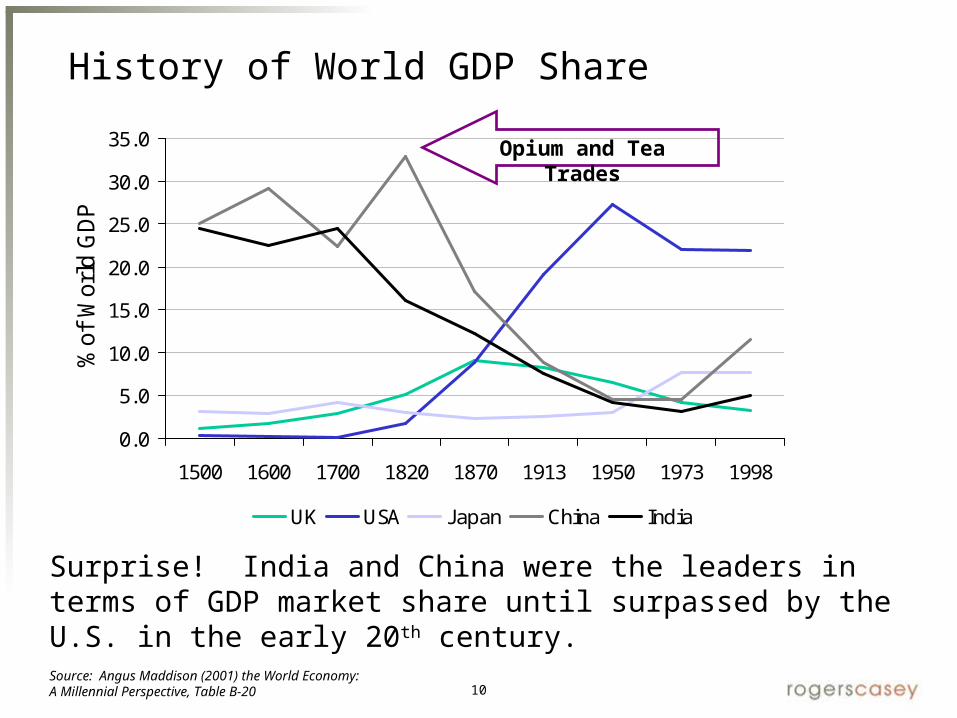
History of World GDP Share
0.0
5.0
10.0
15.0
20.0
25.0
30.0
35.0
1500 1600 1700 1820 1870 1913 1950 1973 1998
% o
f W
orld
GDP
UK USA J apan China India
Surprise! India and China were the leaders in terms of GDP market share until surpassed by the U.S. in the early 20th century. Source: Angus Maddison (2001) the World Economy:A Millennial Perspective, Table B-20
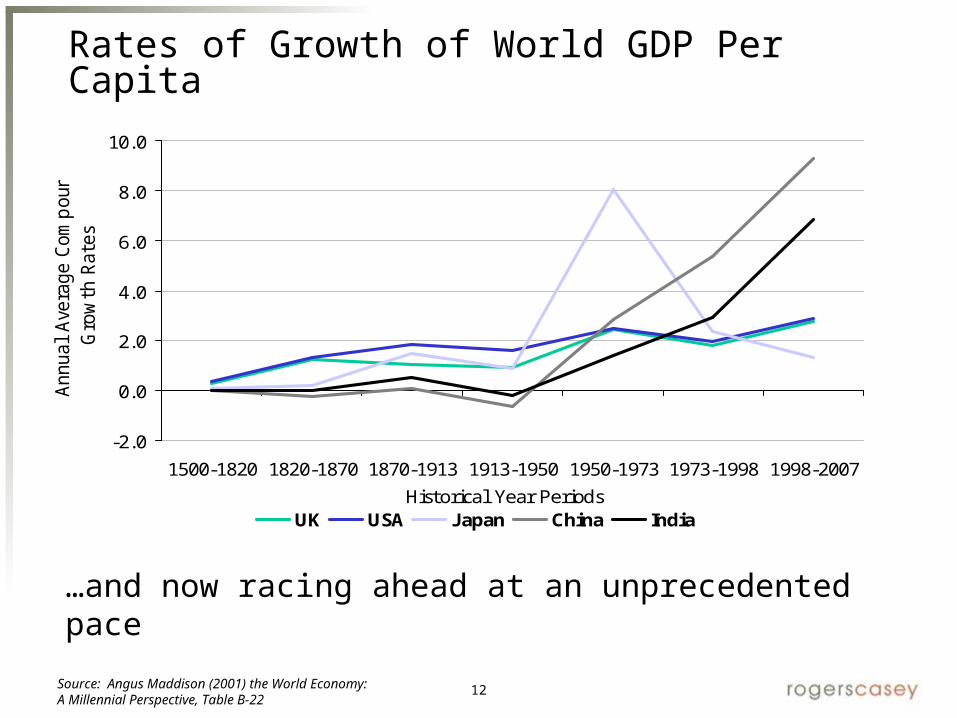
Source: Angus Maddison (2001) the World Economy:A Millennial Perspective, Table B-22
13
Developed, Emerging, or Hegemon?
Nation Time Period Source of Power or Wealth
Portugal 1494 – 1580 Dominance in navigation
Holland 1580 – 1688 Control of credit and money
Britain 1688 – 1792 Textiles and command of the sea
Britain 1815 – 1914 Industrial Supremacy and railroads
United States 1945 – 1971Petroleum and internal combustion engine
A highly evolved nation with overwhelming demographics does not always graduate to a developed nation
14
Cartography and Investment Topography (2004)
Economists and investors are always seeking to develop a set of metrics to identify a country’s future status
That is, which countries will move from:
Emerging to Developed to something else
However, there is no defined set of rules to determine who will and will not evolve
Are there catalysts?
15
Benchmarks as Investment Topography
Current industry practice is to construct portfolios using benchmarks as maps or guides
Are our current maps pre-Columbus, seismic sensors, or GPS?
16
A View of Our World in the Pre-Columbus Era
Fortunately, early investors did not use maps for guides or they might not have gotten there
17
A View of Our World from the English Colonies
Where would the U.S. be if our forefathers only focused on investing in the original 13 colonies and didn’t think about the frontier?
18
A View of Our World After the Louisiana Purchase
Or called it quits after Napoleon sold us the Louisiana Purchase?
19
So, What is the Lesson?
Historically, the most successful investors have sought future rather than past growth
Would you have invested in the Erie Canal?
If you are the typical institutional investor, probably not!
20
Cartography and Investment Topography
State of the art today…very Americentric
Very benchmark-aware
Average U.S. plan sponsor holds the following portfolio:
40 – 50% U.S. Equity
15 – 20% Non-U.S. Equity
15 – 30% Fixed Income
0 – 15% Alternatives
21
Market Capitalization Weights As Maps
10.1% 9.7%
52.6%
0.2% 0.4% 0.2%0%
10%
20%
30%
40%
50%
60%
UnitedKingdom
J apan USA India China Russia
Capi
taliz
atio
n W
eigh
ts w
ithi
n th
e M
SCI A
CWI F
ree
Source: RIMES Online
Constructing an investment map for tomorrow and today’s portfolio based on benchmarks is investing in the rearview mirror
Select Developed and Emerging Markets as of 2004
22
2004 Outlook
12.5%9.3% 9.7%
40.1%
46.7%
30.9%
0%
10%
20%
30%
40%
50%
UnitedKingdom
J apan USA India China Russia
5 Ye
ar C
umul
ativ
e Pr
ojec
ted
Real
GDP
Gro
wth
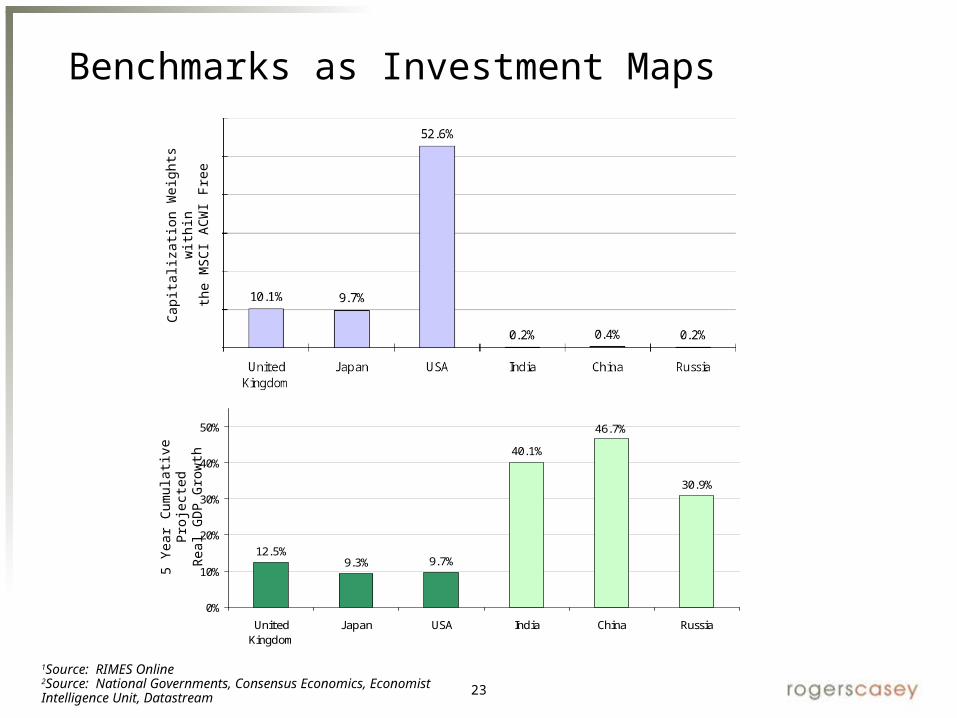
As an investor seeking to grow assets, wouldn’t you seek future rather than historical growth?
Source: National Governments, Consensus Economics, Economist Intelligence Unit, Datastream
Five Year Projected Growth Rates of Select Developed and Emerging Markets
23
Benchmarks as Investment Maps
12.5%9.3% 9.7%
40.1%
30.9%
46.7%
0%
10%
20%
30%
40%
50%
UnitedKingdom
J apan USA India China Russia
1Source: RIMES Online2Source: National Governments, Consensus Economics, Economist Intelligence Unit, Datastream
Cap
italiz
ati
on
Weig
hts
wit
hin
the M
SC
I A
CW
I Fr
ee
5 Y
ear
Cu
mu
lati
ve
Pro
ject
ed
Real G
DP G
row
th
24
S&P 500 Index vs. Nominal GDP Growth
0
12
3
4
56
7
8
910
11
12De
c-48
Dec-
50
Dec-
52
Dec-
54
Dec-
56
Dec-
58
Dec-
60
Dec-
62
Dec-
64
Dec-
66
Dec-
68
Dec-
70
Dec-
72
Dec-
74
Dec-
76
Dec-
78
Dec-
80
Dec-
82
Dec-
84
Dec-
86
Dec-
88
Dec-
90
Dec-
92
Dec-
94
Dec-
96
Dec-
98
Dec-
00
Dec-
02
Cum
ulat
ive
Log-
Adju
sted
Ret
urn
S&P 500 Index Nominal GDP Growth
Developed markets are positively correlated with domestic GDP growth but emerging markets may not be
Source: Nominal GDP Growth data provided courtesy of Bureau of Economic Analysis (BEA)
25
Section II
The Case for Emerging Market Debt in 2007
26
Cartography and Investment Topography
27
Asset Allocation with Possibly the Wrong Map
Public Plans Anticipating an Increase/ Decrease in Strategic Allocations
2%
9%
28%31%
22%
-15%
-28%
-2%0%0%
Equities Fixed Income Real Estate Private Equity Hedge Funds
Source: JPMorgan Asset Management
By Asset Class
% anticipating an increase in allocations
% anticipating a decrease in allocations
28
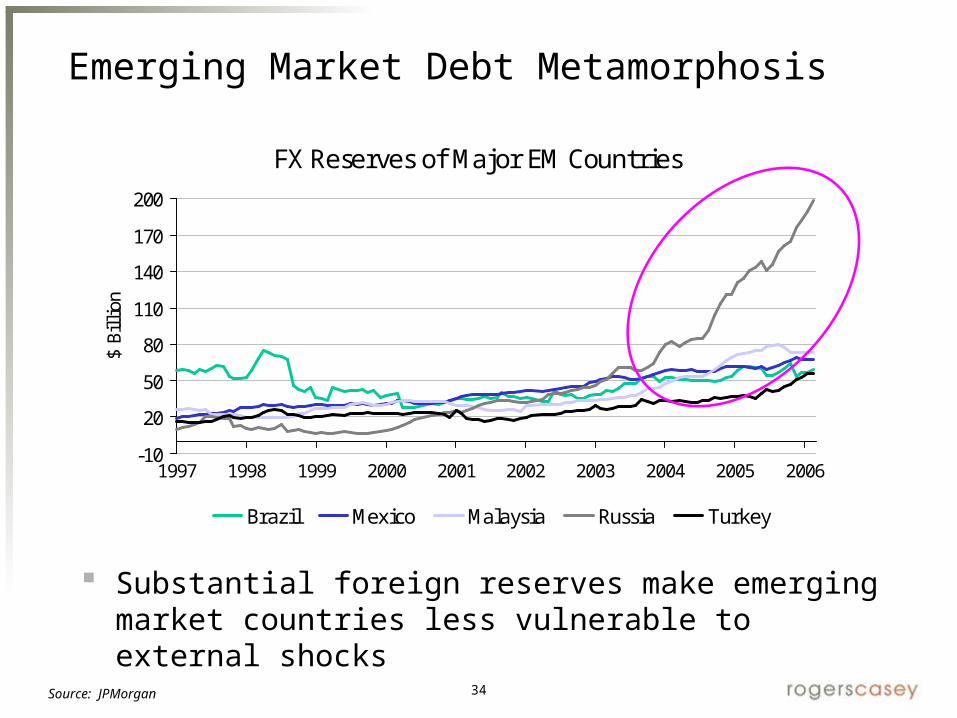
FX Reserves of Major EM Countries
-10
20
50
80
110
140
170
200
1997 1998 1999 2000 2001 2002 2003 2004 2005 2006
$ Bi
llio
n
Brazil Mexico Malaysia Russia Turkey
Emerging Market Metamorphosis
We all read about global liquidity and its sources but generally don’t ponder its implications
Source: JPMorgan
29
Emerging or Developed?
FranceThailand
30
Emerging or Developed?
London Morocco
31
Trivia
Approximately 25% of the total number of world cranes is situated in one single city. Which city is it?
Up until 1998, the trophy for the tallest building has been in developed countries, mainly the United States. Currently how many of the top ten tallest buildings are in developed countries?
True or False. In 2005, more space missions have been launched by developed countries than emerging countries?
Of the top 40 countries by growth in manufacturing output, how many are emerging markets?
How many of the world’s top five billionaires are EM country nationals and who currently leads that list?
Emerging Market Metamorphosis
32
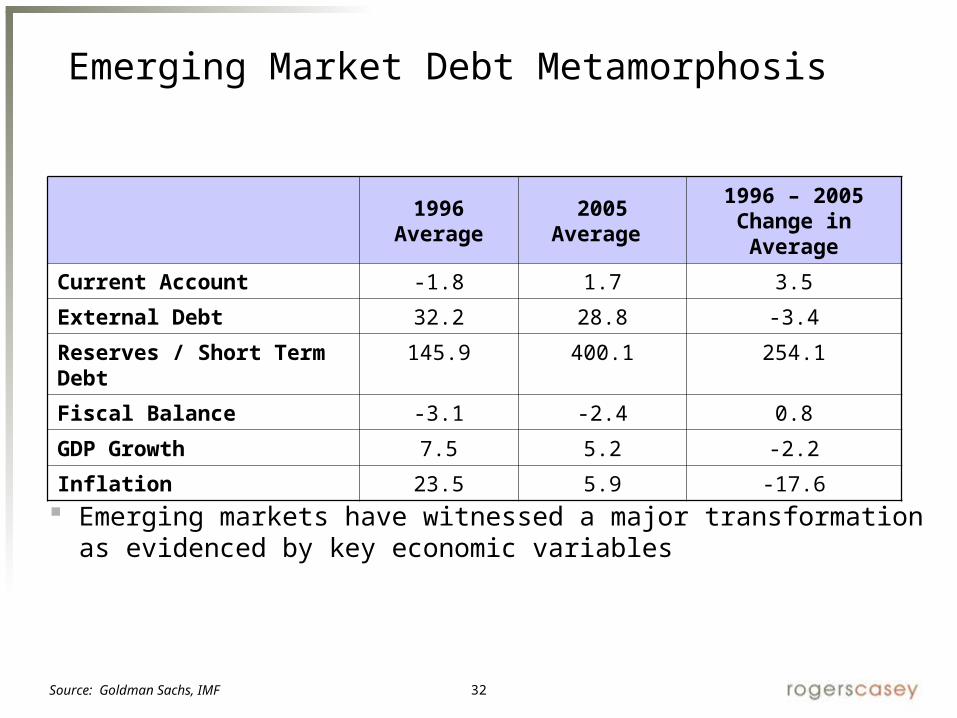
1996 Average
2005 Average
1996 – 2005Change in Average
Current Account -1.8 1.7 3.5
External Debt 32.2 28.8 -3.4
Reserves / Short Term Debt
145.9 400.1 254.1
Fiscal Balance -3.1 -2.4 0.8
GDP Growth 7.5 5.2 -2.2
Inflation 23.5 5.9 -17.6
Emerging markets have witnessed a major transformation as evidenced by key economic variables
Favorable rating trends have extended beyond sovereign debt
Source: S&P, JPMorgan Source: S&P, JPMorgan
39
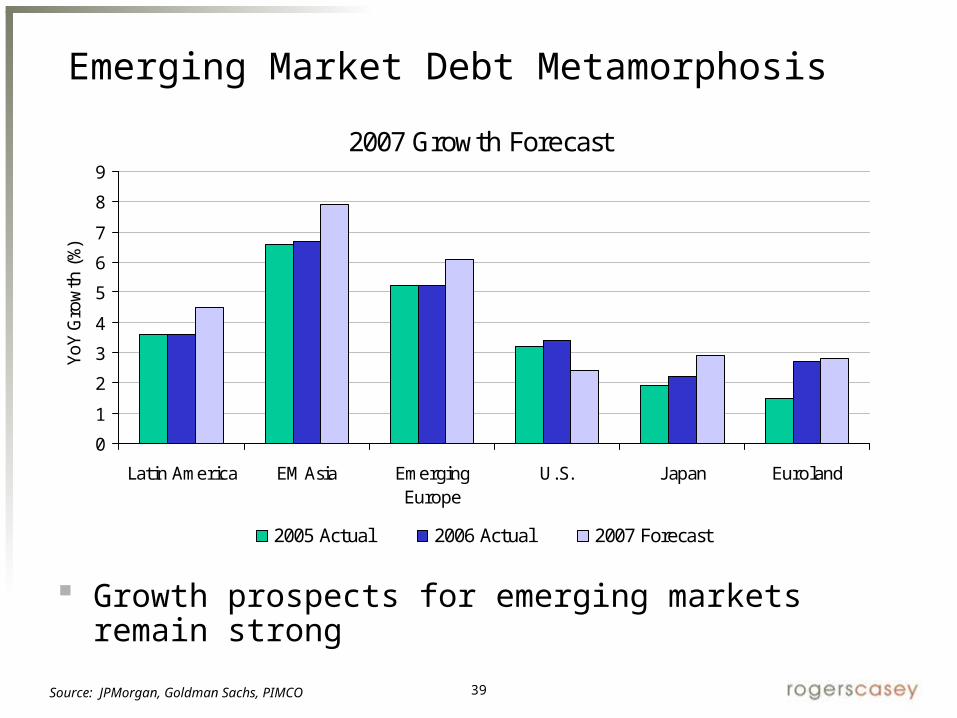
2007 Growth Forecast
0
1
2
3
4
5
6
7
8
9
Latin America EM Asia EmergingEurope
U.S. J apan Euroland
YoY
Gro
wth
(%)
2005 Actual 2006 Actual 2007 Forecast
Source: JPMorgan, Goldman Sachs, PIMCO
Growth prospects for emerging markets remain strong
Emerging Market Debt Metamorphosis
40
The correlation between economic activity in the large developed economies and total global growth has fallen, as emerging countries have become more important growth engines of the global economy
Relationship of G7 Growth to World Growth
-1
0
1
2
3
4
5
6
1980 1985 1990 1995 2000 2005
World Real GDP Growth G7 Real GDP Growth Correlation of G7 growth to World Growth
Source: IMF, PIMCO
Emerging Market Metamorphosis
41
Implications for the Investment Opportunity
Comparative Performance 2-Months as of August 31, 2007
-4
-3
-2
-1
0
1
2
3
J PM GBI-EM
(LC)
J PM EMBI
Global
Citigroup HY Credit Suisse
Leveraged
Loan
LB Aggregate
%
Is emerging market debt the new “safe haven” as opposed to U.S. credit? How much is too much in emerging markets? What is true growth?
Comparative Performance 1-Month as of August 31, 1998
-30
-25
-20
-15
-10
-5
0
5
J PM EMBI Global Citigroup HY Credit Suisse
Leveraged Loan
LB Aggregate
%
42
Section III
Understanding Emerging Market Countries as the New, Powerful Institutional Investor
43
Cartography and Investment Topography
44
Cartography and Investment Topography
Western financial markets create acronyms based on:
Economics
Liquidity and capital flows
Organizational structures
In era of vast change in size and influence of liquidity pools, important and instructional to reconsider basic assumptions
EMEA (Europe, Middle East and Africa) and MENA (Middle East, North Africa) are examples of this
Context of discussion centered on changing missions of World Bank, IMF, IFC (e.g., in North/South dialogues migrating to South/South investment)
45
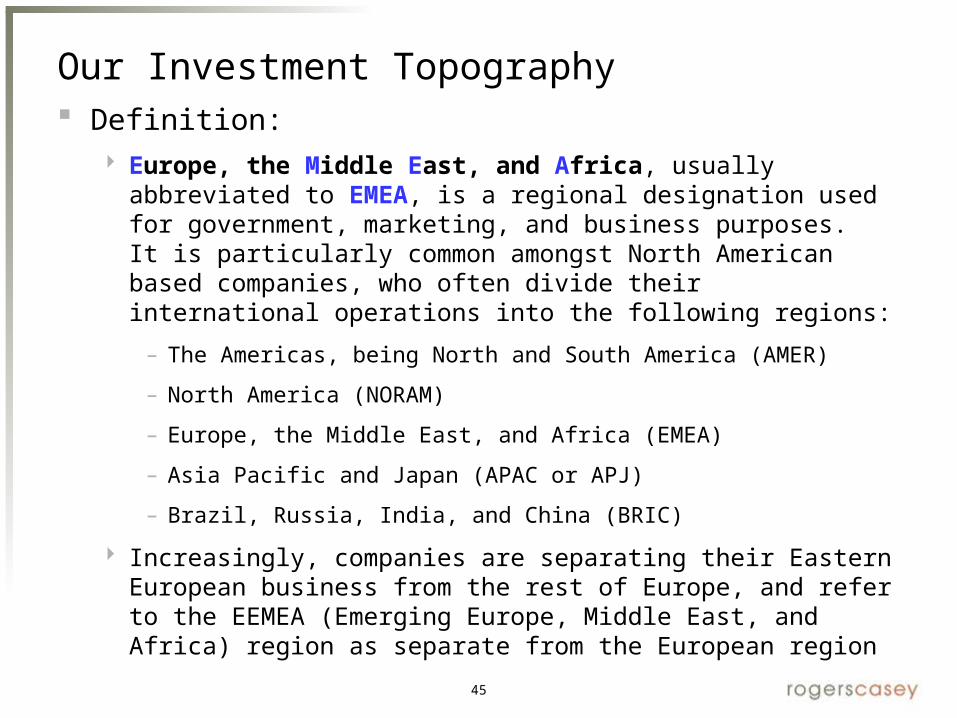
Our Investment Topography Definition:
Europe, the Middle East, and Africa, usually abbreviated to EMEA, is a regional designation used for government, marketing, and business purposes. It is particularly common amongst North American based companies, who often divide their international operations into the following regions:
– The Americas, being North and South America (AMER)
– North America (NORAM)
– Europe, the Middle East, and Africa (EMEA)
– Asia Pacific and Japan (APAC or APJ)
– Brazil, Russia, India, and China (BRIC)
Increasingly, companies are separating their Eastern European business from the rest of Europe, and refer to the EEMEA (Emerging Europe, Middle East, and Africa) region as separate from the European region
46
New Investment Topography
Definition:
The term MENA, for Middle East and North Africa
– An acronym often used in academic and business writing
– Generally covers an extensive region, extending from Morocco in northwest Africa, to Iran in southwest Asia
– Generally includes all the Arab Middle East and North Africa countries, including Iran but not Turkey
47
Our Investment Topography
EMEA GDP (as % of world GDP) and Market Capitalization (as % of MSCI AC World Index Free)
1998 - 2007*
0.0
0.5
1.0
1.5
2.0
2.5
3.0
3.5
4.0
4.5
5.0
1998 1999 2000 2001 2002 2003 2004 2005 2006 2007
(% )
GDP Market Cap
Source: MSCI and U.S. Department of Agriculture
* 2007 data is for the year to September.
48
EMEA Country GDP and Market Capitalization Growth (%)2003 - 2007
Source: MSCI and U.S. Department of Agriculture
Changing Investment Topography
CountryCumulative
GDPAnnualized
GDPCumulative Market Cap
Annualized Market Cap
Czech Republic 27.9 5.6 898 180
Hungary 20.0 4.0 430 86
Poland 28.0 5.6 895 179
Russia 39.4 7.9 1198 240
Turkey 38.3 7.7 924 185
Israel 23.2 4.6 337 67
Jordon 33.2 6.6 257 51
Egypt 28.3 5.7 2131 426
Morocco 23.1 4.6 658 132
South Africa 22.3 4.5 272 54
Total EMEA 30.9 6.2 552 110
49
Size and Shape of Capital Flows in Rapid Evolution
50
Changing Destination of Capital Flows
51
Changing Rapidly from EMEA to MENA
52
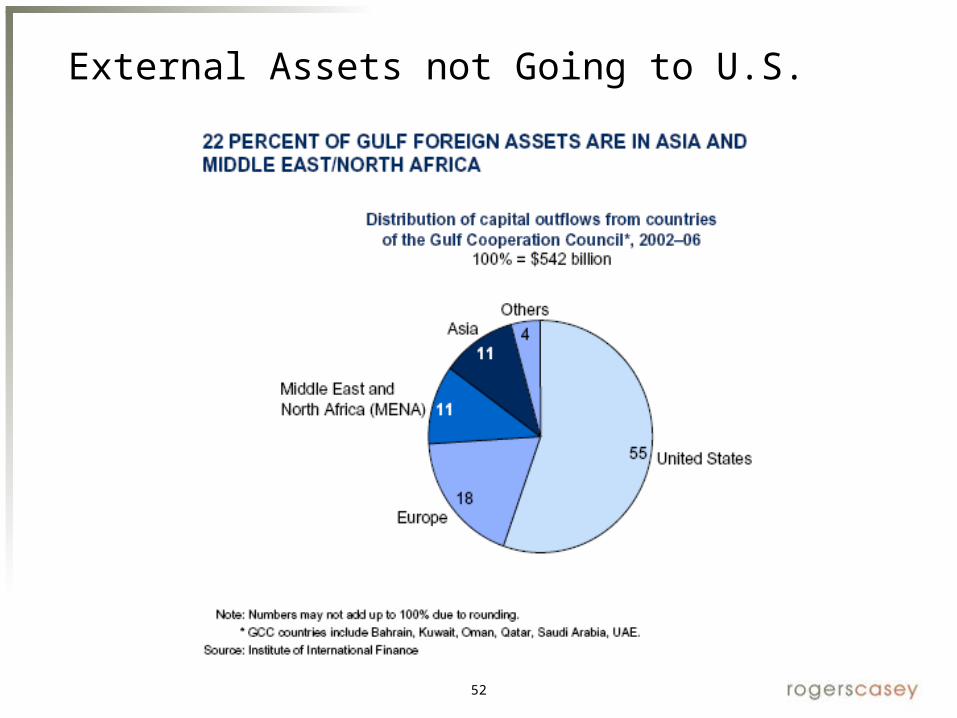
External Assets not Going to U.S.
53
And Increasingly Finding Local Homes
54
With Local Structures
55
The keystone to Islamic finance is the idea that investments must be made in a manner that is compliant with Shariah, a set of rules and laws, collectively governing economic, social, political, and cultural aspects of Islamic society.
Shariah prohibits riba, or the charging of interest, thus introducing a challenge to traditional investment mechanisms such as bonds or mortgages.
Most interpretations of Shariah state that in any investment arrangement, risks must be shared by all parties and equal risk-reward profiles must exist. Therefore, a predetermined interest rate is considered unacceptable (haram).
Sukuk – similar to an asset-backed bond, Sukuk pays investors over the life of the “bond” directly from leases, profits, or sales of tangible assets, such as property, infrastructure, equipment, or business ventures.
And Local Connotations
56
Sound Bytes About Islamic Finance
Up until this point, Islamic financial innovations have captured the attention of the clientele interested in Shariah compliant products. Going forward, these instruments will likely have a broader appeal.
In the near future, we will likely witness the creation of a much broader spectrum of Shariah compliant financial instruments, including structured products, hedging tools with features similar to the conventional derivatives markets, an increase in short-term liquidity products, and a wider variety of asset classes.
Shariah compliant securities will also attract attention from socially conscious investors across the globe. Shariah prohibits investment in any business that is deemed unethical, such as gambling, alcohol, and casinos.
Islamic finance offers a unique opportunity for bridging financial/cultural differences between Islamic and Western nations.
57
Implications for U.S. Pension Funds
Rapid redistribution of capital flows implies the following:
Mispricing of risk and return - old versus new thinking
Inappropriate weightings of region
Information inefficiency
Premium for early movers
BUT…old style analysis not as relevant
MENA investment dominated by real estate, infrastructure, plus hedge funds and private equity, not necessarily public equity
NECESSITY to consider new structures, including Shariah compliant bonds and investment vehicles
FEWER traditional managers (even hedge funds) able to take advantage, so finding regional capabilities will probably be important
IMPORTANT to know what you don’t know and to update frequently
58
Changing Investment Topography: Old Style Analyses Don’t Tell Story
EMEA GDP and Market Capitalization Annual Growth1998 - 2007*
MSCI Emerging Markets Index Regional BreakdownSeptember 2002
Market Cap: $475 Billion
EMEA
26%
Asia
58%
Latin America
16%
Changing Investment Topography
Source: MSCI
60
EMEA Country BreakdownSeptember 2007
Market Cap: $812 BillionHungary
4% Israel
9%
J ordan
0%
Poland
7%
Egypt
3%
South Africa
28%
Czech Republic
3%
Turkey
7%
Morocco
1%
Russia
37%
MSCI Emerging Markets Index Regional BreakdownSeptember 2007
Market Cap: $3,354 Billion
EMEA
24%
Asia
58%
Latin America
16%
Source: MSCI
Changing Investment Topography
61
EMEA Country Breakdown by GDP2002
Total GDP: $1,174 Billion
Hungary
4%
Israel
10%
J ordan
1%
Poland
15%
Egypt
9%
South Africa
12%
Czech Republic
5%
Turkey
17%
Morocco
3%
Russia
37%
Source: U.S. Department of Agriculture
Changing Investment Topography
EMEA Country Breakdown by GDP2007*
Total GDP: $1,538 Billion
Hungary
4%
Israel
9%
J ordan
1%
Poland
14%
Egypt
9%
South Africa
11%
Czech Republic
5%
Turkey
18%
Morocco
3%
Russia
37%
* 2007 data is for the year to September.
62
Old Versus New Topography
Growth in MENA lost in rapid growth in Asia and investor focus
Current index reflects public market capitalization but not true GDP growth and flows to private equity and new wealth
Country representation is limited
Plan sponsors lack time and focus to reposition portfolio
Alternatives include GDP/flow weighted indices and regional mandates for infrastructure, hedge funds, currency, and private equity as well as public equity
63
Old Versus New Topography
Facts:
0.3% of global equity markets but young demographics of 700 million
Resource provider to Europe and U.S.
Rapidly expanding and NEW infrastructure
Home to innovation in biotech and technology
Deep and liquid stock markets with over 200 global companies
Fast growing sovereign wealth funds (SWFs)
64
Aging Demographics but MENA is Young
Source: UN (2005)
65
With New Buildings and New Infrastructure…
Source: Factset, UBS
66
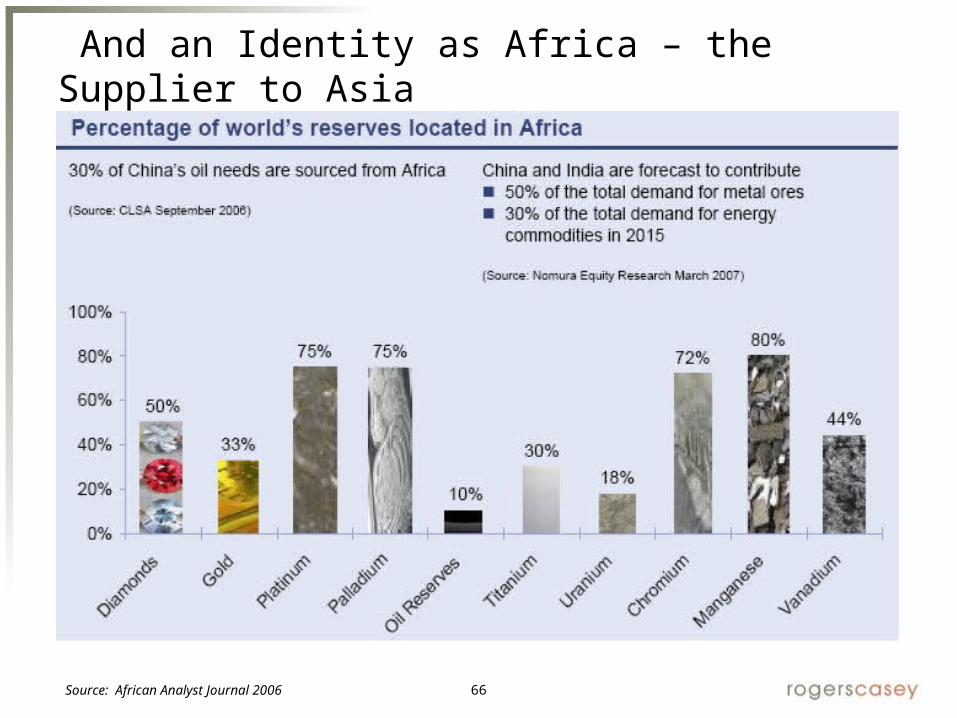
And an Identity as Africa – the Supplier to Asia
Source: African Analyst Journal 2006
67
So is this Risky?
Source: Factset
68
There is More to the Region than Just Oil…
Source: JPMorgan, Merrill Lynch estimates
69
Other Changing Topographies: Asia
70
Cartography and Investment Topography: Asia
Asia also growing rapidly
Surpluses are growing rapidly
Sovereign Wealth Funds have been created
Investment policy and governance are slowly being considered
Asian topography more centered on debt culture and ASEAN Plus 6
71
But Its Tectonic Plates Are Different
72
Investment Topography Changing but Slowly
73
Changing Investment Topography: Old Style Analyses Don’t Tell Story
ASEAN Plus 6 (Ex. U.S.) Plus New Zealand GDP and Market Capitalization Annual Growth
ASEAN Plus 6 (Ex. U.S.) Plus New ZealandCountry Breakdown, September 2007
Market Cap: $5,610 Billion
Hong Kong5%
South Korea9%
Malaysia1%
New Zeland0%
Phillipines0% Singapore
3%Thailand
1%
Indonesia1%
China10%
Japan52%
Australia17%
MSCI AC World Index (Ex. U.S.) Regional Breakdown, September 2007
Market Cap: $18,756 Billion
North America, 6%
Developed Europe
53%
ASEAN +6 (Ex. USA)
+ New Zealand
30%
EMEA
4%
Latin America
4%EM Asia Ex. Asean +6
3%
Source: MSCI
Changing Investment Topography
76
Implications for U.S. Pension Plans
Central bank reserves and sovereign wealth funds will be managed differently than petrodollar neighbors
Slow, cautious intra-region cooperation will be the norm
Asset allocation and SWF governance will evolve over time
ASEAN accords shed light on process (first steps, interlocking swap agreements to provide members liquidity relative to 1998 and purchases of regional sovereign debt)
ASEAN nations still engaging China, Japan, India, and Australasia
Policy focused on capital preservation and liquidity
Culture of debt and real estate rather than public and private equity
77
Summary
Surpluses of emerging markets are transforming to powerful investors
Risk/return appetites and perspectives differ from U.S. pension plans
Looking forward, it is imperative not to make assumptions viewing the world from our perspective…the consequences could be significant