FORM 10-K CYTORI THERAPEUTICS, INC. (Annual Report) Filed 4/2/2007 For Period Ending 12/31/2006 Address 3020 CALLAN ROAD SAN DIEGO, California 92121 Telephone 858-458-0900 CIK 0001095981 Industry Biotechnology & Drugs Sector Healthcare Fiscal Year 12/31
Transcript
FORM 10-K
CYTORI THERAPEUTICS, INC.
(Annual Report)
Filed 4/2/2007 For Period Ending 12/31/2006
Address 3020 CALLAN ROAD
SAN DIEGO, California 92121
Telephone 858-458-0900
CIK 0001095981
Industry Biotechnology & Drugs
Sector Healthcare
Fiscal Year 12/31
SECURITIES AND EXCHANGE COMMISSION Washington, D.C. 20549
____________________
FORM 10-K
CYTORI THERAPEUTICS, INC. (Exact name of Registrant as Specified in Its Charter)
Registrant’s telephone number, including area code: (858) 458-0900
Securities registered pursuant to Section 12(b) of the Act:
Common stock, par value $0.001
Securities registered pursuant to Section 12(g) of the Act: None
Indicate by check mark if the registrant is a well-known seasoned issuer as defined in Rule 405 of the Securities Act. Yes � No � Indicate by check mark if the registrant is not required to file reports pursuant to Section 13 or Section 15(d) of the Exchange Act. Yes � No � Indicate by check mark whether the registrant: (1) has filed all reports required to be filed by Section 13 or 15(d) of the Securities Exchange Act of 1934 during the preceding 12 months (or for such shorter period that the registrant was required to file such reports), and (2) has been subject to such filing requirements for the past 90 days. Yes � No � Indicate by check mark if disclosure of delinquent filers pursuant to Item 405 of Regulation S-K is not contained herein, and will not be contained, to the best of the registrant’s knowledge, in definitive proxy or information statements incorporated by reference in Part III of this Form 10-K or any amendment to this Form 10-K. � Indicate by check mark whether the registrant is a large accelerated filer, an accelerated filer, or a non-accelerated filer. See definition of “accelerated filer” and “large accelerated filer” in Rule 12b-2 of the Exchange Act. Large Accelerated Filer � Accelerated Filer �
Non-Accelerated Filer �
(Mark One) � � � � ANNUAL REPORT PURSUANT TO SECTION 13 OR 15(d) OF THE SECURITIES EXCHANGE ACT OF 1934 For the fiscal year ended December 31, 2006
OR � � � � TRANSITION REPORT PURSUANT TO SECTION 13 OR 15(d) OF THE SECURITIES EXCHANGE ACT OF 1934 For the transition period from to
Commission file number 0-32501
DELAWARE 33-0827593 (State or Other Jurisdiction
of Incorporation or Organization) (I.R.S. Employer
Identification No.)
3020 CALLAN ROAD, SAN DIEGO, CALIFORNIA 92121 (Address of principal executive offices) (Zip Code)
Indicate by check mark whether the registrant is a shell company (as defined in Rule 12b-2 of the Exchange Act). Yes � No � The aggregate market value of the common stock of the registrant held by non-affiliates of the registrant on June 30, 2006, the last business day of the registrant’s most recently completed second fiscal quarter, was $74,714,461 based on the closing sales price of the registrant’s common stock on June 30, 2006 as reported on the Nasdaq Global Market, of $7.19 per share. As of March 1, 2007, there were 22,534,622 shares of the registrant’s common stock outstanding.
DOCUMENTS INCORPORATED BY REFERENCE
Portions of the registrant’s definitive proxy statement for the 2007 Annual Meeting of Stockholders, which will be filed with the Securities and Exchange Commission within 120 days after the end of the year ended December 31, 2006, are incorporated by reference in Part III, Items 10, 11, 12, 13 and 14 of this Form 10-K.
TABLE OF CONTENTS
Table of Contents
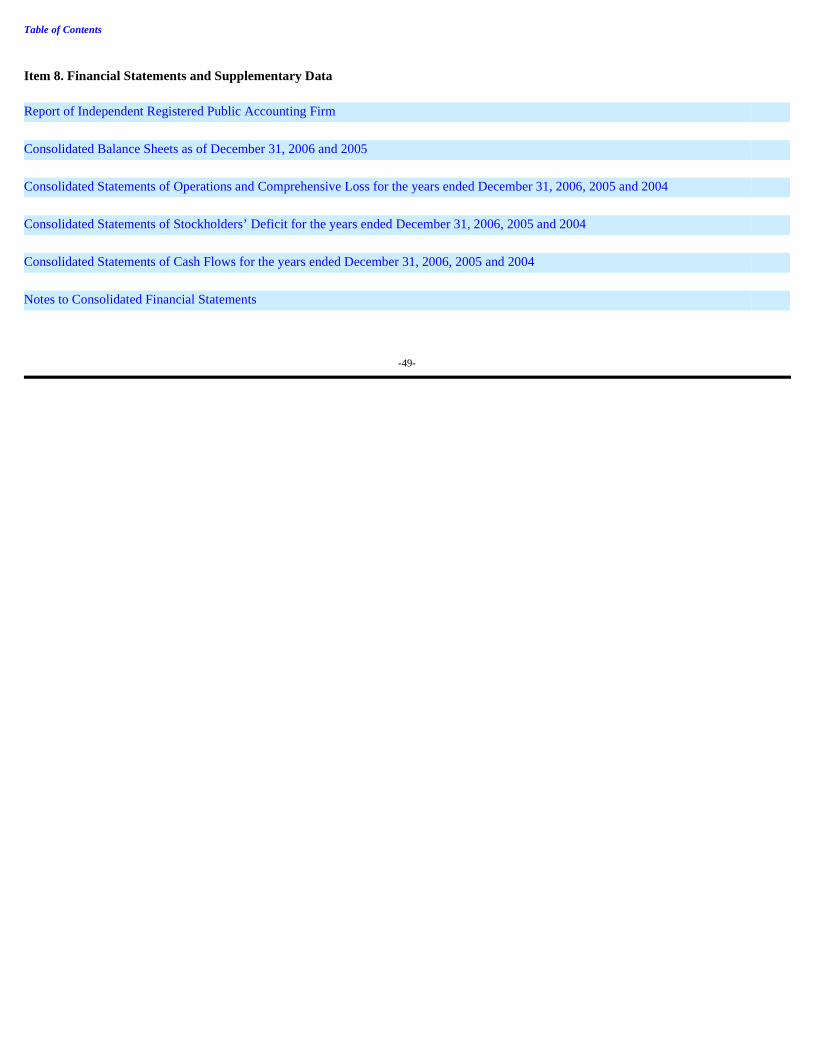
PART I Item 1. Business Item 1A. Risk Factors Item 1B. Unresolved Staff Comments Item 2. Properties Item 3. Legal Proceedings Item 4. Submission of Matters to a Vote of Security Holders PART II Item 5. Market for Registrant’s Common Equity Related Stockholder Matters Item 6. Selected Financial Data Item 7. Management’s Discussion and Analysis of Financial Condition and Results of Operations Item 7A. Quantitative and Qualitative Disclosures About Market Risk Item 8. Financial Statements and Supplementary Data Item 9. Changes in and Disagreements with Accountants on Accounting and Financial Disclosure Item 9A. Controls and Procedures Item 9B. Other Information PART III Item 10. Directors, Executive Officers and Corporate Governance Item 11. Executive Compensation Item 12. Security Ownership of Certain Beneficial Owners and Management and Related Stockholder Matters Item 13. Certain Relationships and Related Transactions, and Director Independence Item 14. Principal Accountant Fees and Services PART IV I tem 15. Exhibits and Financial Statement Schedules
-2-
PART I Item 1. Business General
Cytori Therapeutics, Inc. is developing and seeks to commercialize stem and regenerative cell therapies for cardiovascular disease, reconstructive surgery and many other serious, chronic, and life threatening conditions. These therapies will be commercialized through the sale of the Celution™ System, a device that quickly removes stem and regenerative cells from a patient’s own adipose tissue. To deliver these therapies, physicians remove a small amount of a patient’s fat, also known as adipose tissue, and process it inside the Celution™ System. About an hour later, a purified concentration of stem and regenerative cells are administered back to the same patient.
The Celution™ System is expected to be launched in Europe in early 2008. In 2007, we will begin a clinical study of the Celution™
System specifically for use in breast reconstruction following partial mastectomy in breast cancer patients. Cardiovascular disease is another application of the Celution™ System under development. A European safety and feasibility clinical study is underway for patients with chronic ischemia, a severe form of coronary artery disease. A separate European study is expected to begin in the second quarter of 2007 for use in heart attack patients.
Our MacroPore Biosurgery operating segment owns manufacturing rights to two product families that are no longer central to our business
focus. The HYDROSORB™ family of bioresorbable spine and orthopedic implants, including MYSTIQUE ™, is distributed worldwide exclusively by Medtronic, Inc. (“Medtronic”). Our Thin Film bioresorbable soft tissue separation implant product line will be marketed exclusively in Japan by Senko Medical Trading Co. (“Senko”) following regulatory approval of the product in Japan. We sold all of our non-Japan Thin Film product lines in 2004.
We were initially formed as a California general partnership in July 1996, and incorporated in the State of Delaware in May 1997. We
were formerly known as MacroPore Biosurgery, Inc., and before that as MacroPore, Inc. Over the past five years we have aggressively shifted the focus of our business from our bioresorbable implants business to our regenerative cell technology business, including the formation of a strategic joint venture with Olympus Corporation in 2005. We are actively pursuing a buyer (or buyers) for the bioresorbable implants business. Products and Markets Regenerative cell technology The Celution™ System
Cytori’s Celution™ System is a sophisticated medical device that allows physicians to offer regenerative therapies at the point of care
using the patients' own cells. It standardizes and automates a process that releases stem and regenerative cells residing naturally within a patient’s own adipose (fat) tissue. The adipose tissue is taken from the patient using a minor liposuction-like procedure, placed into the system and, with the touch of a button, the processing begins. About an hour later, following a tissue wash, cell separation and concentration by the Celution™ System, a prescribed dose of stem and regenerative cells may be delivered back to the patient.
Our Celution™ System will utilize a single-use therapeutic sets containing proprietary Cytori technology, to be used on a per-patient basis.
Each therapeutic set is unique and specific for each therapeutic application. For example, the therapeutic set for cardiovascular disease is distinct from that used in reconstructive surgery.
Celution™ PRS System
The Celution™ PRS (Plastic & Reconstructive Surgery) System is expected to be launched in early 2008 in Europe. We will initially target select surgeons and hospitals for general use in plastic and reconstructive surgery and, pending supporting clinical data, commercialize the Celution™ System for more specific applications such as breast reconstruction.
Table of Contents
-3-
In November 2006, preliminary safety was reported from an 11 patient investigator-initiated study using adipose-derived stem and regenerative cells to reconstruct breast tissue following partial mastectomy and radiation therapy. The cells were extracted using our Celution™ System and the study took place at Kyushu Central Hospital in Japan. The study was expanded to include eight additional patients. Evaluation of the 19 patients continues to support our preliminary safety and feasibility findings. Full results from the study are expected to be reported later in 2007.
In 2007, we will begin a clinical study using the Celution™ System to support adoption and reimbursement for breast reconstruction.
Over five hundred thousand patients are diagnosed with breast cancer each year worldwide. Approximately 60% of these patients will be treated with lumpectomy procedures, a trend that is increasing with early detection. In addition, there are an estimated 3.0 million breast cancer survivors in Europe and 2.2 million in the US. The reconstruction of partial mastectomy defects represents an important unmet medical need throughout the world.
Celution™ CV System
We are sponsoring two clinical trials for cardiovascular disease. The first is a trial for chronic myocardial ischemia, a severe form of coronary artery disease, which started enrolling patients in early 2007 (“PRECISE trial”). Our study for heart disease is scheduled to begin in the second quarter of 2007 (“APOLLO trial”). Results from both of these studies are expected in the second half of 2008.
Our PRECISE trial is a 36 patient safety and feasibility study evaluating adipose stem and regenerative cells as a treatment for chronic ischemia. The patients’ cells are extracted from their own adipose tissue using the Celution™ System. Next, the cells are injected around the injured oxygen-deprived areas of their hearts through a specially designed catheter. The patients will be followed for six months before evaluation. Full results are expected to be reported in 2008. The study is being conducted at Gregorio Marañón Hospital in Madrid Spain and led by Drs. Francisco J. Fernández-Avilés and Emerson Perin.
Cytori's APOLLO trial will be a 48 patient safety and feasibility study to evaluate adipose stem and regenerative cells as a treatment for heart attacks. The patients' cells will be extracted from their own adipose tissue using the Celution™ System. Next, the cells will be injected into their coronary artery down a catheter. The patients will be followed for six months before evaluation. Full results are expected to be reported in 2008. The study is being conducted at Thoraxcenter, Erasmus Medical Center Hospital in Rotterdam, the Netherlands and led by Dr. Patrick Serruys.
The American Heart Association estimates that in the United States alone, there are approximately 1.2 million heart attacks each year and
more than 5.2 million people suffer from a form of chronic heart disease.
Celution™ System Pipeline Other applications of the Celution™ System that are being investigated include: gastrointestinal disorders, which could address fistulas
and wounds associated with inflammatory disorders such as Crohn’s disease, vascular disease, and orthopedic applications such as bone or spinal disc repair. Our scientists are, to a varying degree, investigating these applications in pre-clinical models. The full pipeline and the relative stages of progress for all the targeted therapeutic areas is detailed below:
Table of Contents
Therapeutic Application Discovery Preclinical Clinical Testing Notes Reconstructive Surgery
Breast reconstruction X Efficacy study expected to start in 2007
Cardiovascular Disease Chronic Myocardial
Ischemia
X
Safety and feasibility trial underway
Heart Attack
X
Safety and feasibility trial expected to start Q2 2007
Gastrointestinal Disorders Crohn’s Disease X Intestinal Repair X Vascular Repair Peripheral Vascular Disease X Orthopedics Spinal Disc Disease X Bone Repair X
-4-
Stem Cell Banking We operate a California state-licensed tissue bank facility for the preservation of stem and regenerative cells extracted from adipose tissue.
This service is being offered on a very limited basis to surgical patients undergoing liposuction procedures. Typically arranged through a patient’s physician, cell preservation is the process by which regenerative cells, taken from a liposuction or other procedure, are stored (cryopreserved) in a liquid nitrogen freezer at -320˚F (-196˚C) exclusively for the patient who preserved them. The cells can be preserved indefinitely.
MacroPore Biosurgery Products
Our MacroPore Biosurgery business manufactures surgical implants derived from our bioresorbable technology. The HYDROSORB™
family of spine and orthopedic implant products, including MYSTIQUE™ products, is distributed exclusively by Medtronic. HYDROSORB™ and MYSTIQUE™ are trademarks of Medtronic. This product line accounted for 85.9% of our total revenues in 2005 but only 18.3% of our total revenues in 2006. Our sales of these products declined significantly in 2006. The Thin Film line of products, pending regulatory approval in Japan, would be distributed exclusively through Senko for anti-adhesion applications, soft tissue support, and minimization of the attachment of soft tissues throughout the body. We sold our non-Japan Thin Film business in 2004.
Manufacturing
Starting in late 2008, the Celution™ System will be manufactured by a joint venture between Cytori and Olympus Corporation
(“Olympus”), a global optics and life science company. The joint venture, Olympus-Cytori Inc. (the “Joint Venture”), enables Cytori to access Olympus’ expertise in engineering, manufacturing and servicing of sophisticated medical devices. The Joint Venture will supply the Celution™ System for all therapeutic applications solely to Cytori at a formula-based transfer price. Cytori owns Celution™ System marketing rights for all therapeutic applications.
Before the Joint Venture manufacturing is available, demand for the Celution™ System will be fulfilled by Cytori’s internal manufacturing
capabilities. Cytori has built and refined a manufacturing process that is currently supplying the earlier-generation Celution™ Systems for use in clinical trials and which can be expanded to supply the anticipated required number of systems and per-patient use therapeutic sets upon market launch in early 2008.
Technology
Adipose tissue, also known as fat tissue, is the richest and most accessible known source in the human body of adult stem cells. In addition
to stem cells, within adipose tissue there lies a defined population of cell types that are also major contributors to healing, referred to as ‘regenerative cells.’ Together, these stem and regenerative cells represent tremendous opportunities for cardiovascular disease treatment, reconstructive surgery, spine and orthopedic disorders and vascular conditions, as well as a variety of other areas of medicine.
Adipose tissue contains at least ten times more stem cells than the same amount of bone marrow, a commonly-used source for stem cells. While most adult stem cell therapies can take days or weeks of culturing, a meaningful dose can be extracted from adipose tissue in about an hour without the need for further cell culturing (expansion) or manipulation. This enables “real-time” treatment in the clinical setting, in which a patient can have his or her own cells harvested and administered without the cells ever leaving the hospital or surgery room. Competition
We compete with many pharmaceutical, biotechnology and medical device companies as well as universities, government agencies and private organizations that are involved in varying degrees in the discovery, development and commercialization of medical technologies and therapeutic products.
The field of regenerative medicine is rapidly progressing, as many organizations are initiating or expanding their research efforts in this
area. Most of these organizations are involved in research using cell sources other than adipose tissue, including bone marrow, embryonic and fetal tissue, umbilical cord and peripheral blood, and skeletal muscle. We work exclusively with adult regenerative cells from adipose tissue.
Companies performing regenerative cell research and development include, among others, Aastrom Biosciences, Inc., Baxter International,
Inc., BioHeart, Inc., Cellerix SA, Genzyme, Inc., Geron Corporation, Medtronic, MG Biotherapeutics (a joint venture between Genzyme and Medtronic), Osiris Therapeutics, Inc., Stem Cells, Inc., and ViaCell, Inc. We cannot with any accuracy forecast when or if these companies are likely to bring cell therapies to market for indications that we are also pursuing.
In addition to our own sponsored clinical trials, we are aware of two other clinical studies using adipose-derived cells. One is sponsored
Table of Contents
by Cellerix, which is performing a 50 patient, Phase IIb clinical trial in Spain where adipose-derived cultured cells are being used to treat fistulas associated with Crohn’s disease. The other is sponsored by the University of Tokyo, where researchers are examining the potential of adipose-derived regenerative cells in soft tissue repair and breast tissue augmentation. Neither study uses an automated system to remove cells from adipose tissue, but rather rely upon a manual laboratory procedure.
Companies researching and developing cell-based therapies for cardiovascular disease include Baxter, BioHeart, MG Biotherapeutics,
Osiris, and ViaCell. Baxter supports a Phase II study in the United States using stem cells extracted from peripheral blood for chronic myocardial ischemia. BioHeart is conducting multiple ongoing clinical trials in the United States and Europe for its investigational product MyoCell™, which are cultured autologous skeletal myoblasts. Its most advanced study is a 46 patient phase II trial in Europe for treatment of severe non-acute damage to the heart in patients. Osiris Therapeutics, Inc. is currently conducting a Phase I clinical trial using Provacel™, which are allogeneic (donor), mesenchymal stem cells, for acute myocardial infarction. ViaCell, Inc. is currently in pre-clinical development using allogeneic cells derived from umbilical cord blood for cardiac disease.
No company is currently commercializing any approved adipose tissue derived stem cell therapies.
-5-
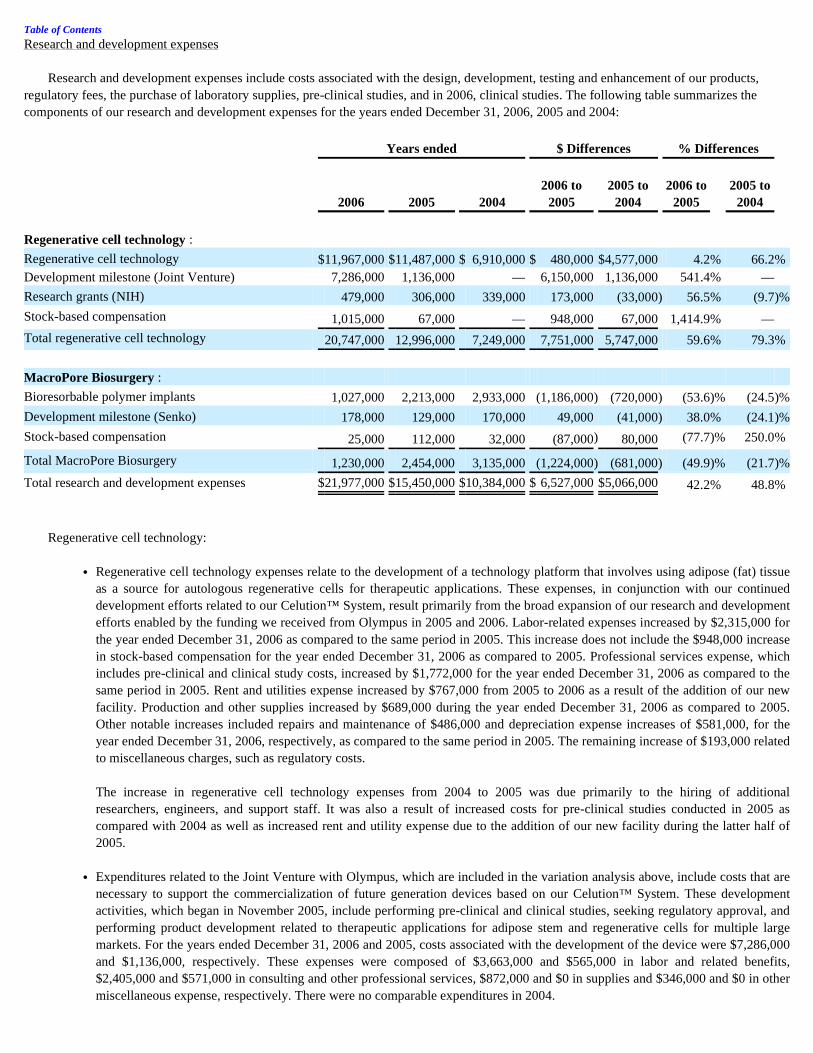
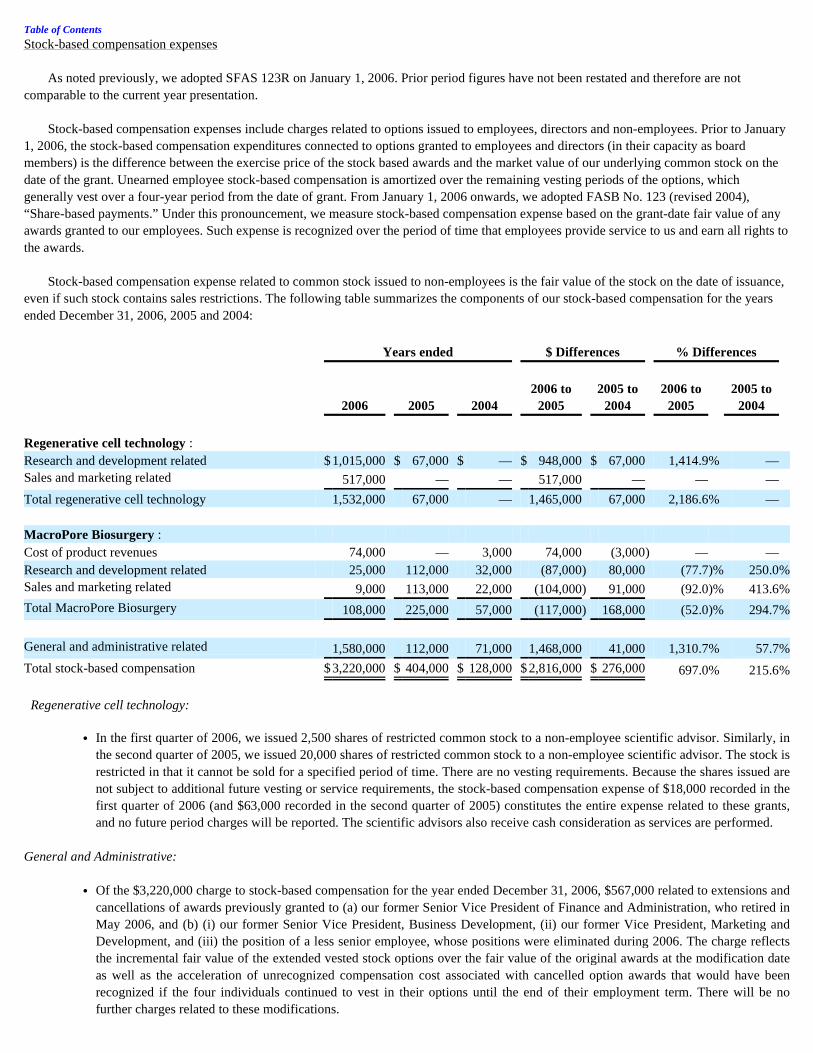
Research and Development
Research and development expenses were $21,977,000, $15,450,000 and $10,384,000 for the years ended December 31, 2006, 2005 and 2004, respectively. For 2006, $20,747,000 of the total was related to our regenerative cell technology and $1,230,000 was related to our bioresorbable technology.
Our research and development efforts in 2006 focused predominantly on the following areas:
Multiple cardiovascular disease pre-clinical studies were conducted in 2006 to investigate safety, efficacy, dosing and delivery
optimization, mechanisms-of-action, cell distribution, among other considerations required for entering clinical studies. In 2006, results from a pre-clinical myocardial ischemia study showed adipose-derived stem and regenerative cells are safe and able to
improve heart function. The study was conducted in collaboration with Emerson Perin, M.D., Ph.D., at The Texas Heart Institute. Specifically, in the blinded, randomized pre-clinical study, either adipose stem and regenerative cells (treated) or a saline injection (control) were administered. Autologous adipose stem and regenerative cells were extracted and concentrated using the Celution™ System. The cells were then delivered via a state of the art delivery system directly into the ischemic sites. Thirty days following treatment, the cell treated group exhibited a 13% (p ≤ 0.03) absolute improvement in ejection fraction over the control group. Ejection fraction is a common measure of the heart's pumping efficiency. Consistent with this functional improvement, heart structure was preserved as evidenced by a 37% (p ≤ 0.0001) thicker ventricular wall in the cell treated groups, versus the control. Improved wall thickness leads to improved mechanical properties of the heart, which may slow deterioration of its pumping ability.
Table of Contents
• Design and implementation for two cardiovascular disease clinical trials in Spain and The Netherlands for chronic myocardial ischemia and heart attacks, respectively;
• Collaboration with clinical investigators using the Celution™ System in breast reconstruction applications in Japan;
• Conducting extensive pre-clinical studies investigating the use of adipose-derived stem and regenerative cells for cardiovascular disease, plastic and reconstructive surgery, spinal disc repair, and gastrointestinal disorders;
• Preparation and submission of multiple regulatory filings in the United States and Europe related to various cell processing systems under development;
• Optimization of the design, functionality and manufacturing process for the Celution™ System; and
• Investigating the cellular and molecular properties and characteristics of stem and regenerative cells residing in adipose tissue towards improving our intellectual property position and towards understanding how to improve and control the therapeutic products;
-6-
We also conducted several additional pre-clinical studies and analyses of adipose-derived stem and regenerative cells with multiple other major U.S. and European academic research institutions to optimize their application in cardiovascular disease. In addition, we have pre-clinical research underway both internally and with multiple collaborators in Europe exploring potential spine and orthopedic applications for adipose stem and regenerative cells.
Our internal research team continued to investigate the cellular properties of stem and regenerative cells residing in adipose tissue.
Specifically, we are expanding our knowledge of the mechanisms and signaling that contribute to the formation of new blood vessel growth. In addition, we are further characterizing the cell output, which has provided us with important propriety insight that should help optimize therapeutic development.
In parallel, our engineering team has further optimized the Celution™ System. Progress in 2006 included: maximizing the cell yield and output through the development and implementation of our proprietary methods, design modifications to decrease the processing time, and improvements in manufacturing processes that will lead to more efficient, robust, and cost-effective manufacturing capabilities.
The most significant regulatory development in 2006 was that the Celution™ System received European regulatory approval (CE Mark) in
January 2006. The CE Mark grants regulatory approval in the European Union and other countries that recognize the CE Mark. European claims include the extraction, wash, and concentration of a patient's own stem cells and other associated progenitor cells from their own adipose tissue for re-implantation or re-infusion during the same surgical procedure. The regenerative (progenitor) cells are those cells within adipose tissue that can differentiate into a single tissue type, while pluripotent stem cells have the ability to differentiate into various mesenchymal lineages. Customers
In our primary business (regenerative cell technology), we do not yet have any commercial customers. Medtronic is our primary distributor and our principal customer for our bioresorbable implant products, directly accounting for $1,451,000
or 100% of our product revenues in 2006, $5,634,000 or 100% of our product revenues in 2005, and $4,085,000 or 64.6% of our product revenues in 2004.
Under our global co-development and supply agreement with Medtronic, we co-develop bioresorbable implants for spinal or reconstructive
fixation, stabilization and fusion. Medtronic has exclusive worldwide rights to market and sell all of the bioresorbable products that we co-develop for this application through January 2012. Currently our only commercially available product line under this agreement is the HYDROSORB™ family of spine and orthopedic implants. We are concerned about Medtronic’s level of commitment to this product line and we are actively seeking a buyer (or buyers) for this product line.
In July 2004, we entered into a Distribution Agreement with Senko under which we granted to Senko an exclusive license to sell and
distribute Thin Film products in Japan. The sale of products through Senko commences upon “commercialization,” which requires regulatory clearance from the Japanese regulatory authorities. We expect to gain the required regulatory clearance in 2007. Following commercialization, the Distribution Agreement has a five-year duration and is renewable for an additional five years after reaching mutually agreed minimum purchase guarantees. In 2004, we sold all of our non-Japan Thin Film business. Sales by Geographic Region
Currently, our only product sales come from our bioresorbable surgical implants, which are no longer core to our business focus. We sell
our products predominantly in the United States and to a lesser extent internationally through Medtronic. Our existing distribution agreements all provide for payment in U.S. dollars and we intend to include similar payment provisions in future distribution agreements. Fluctuations in currency exchange rates may affect demand for our products by increasing the price of our products relative to the currency of the countries in which the products are sold.
Regenerative Cell Technology
Our balance sheet includes a line item entitled deferred revenues, related party. This account primarily consists of the consideration we
have received in exchange for future services that we have agreed to perform on behalf of Olympus and the Joint Venture. We recognize deferred revenues, related party, as development revenue when certain performance obligations are met. Such revenue recognition results from completion of certain milestones, such as completion of pre-clinical and clinical studies, product development efforts, and seeking regulatory approval for the treatment of various therapeutic conditions with adult stem and regenerative cells residing in adipose (fat) tissue. In 2006, we recognized $5,905,000 of revenue associated with our arrangements with Olympus. There was no similar revenue in 2005 or 2004.
Table of Contents
-7-
For the years ended December 31, 2006, 2005, and 2004, we recorded $310,000, $312,000, and $328,000 in grant revenue related to our agreement with the National Institutes of Health (“NIH”), respectively. Under this agreement, the NIH reimburses us for “qualifying expenditures” related to research on Adipose-Derived Cell Therapy for Myocardial Infarction.
We also recorded stem cell banking revenue of $7,000, $8,000, and $10,000 for the years ended December 31, 2006, 2005, and 2004,
respectively, related to the preservation of stem and regenerative cells extracted from adipose tissue at our California state-licensed tissue bank facility.
MacroPore Biosurgery
In 2006, 2005, and 2004 our product sales were $1,451,000, $5,634,000 and 4,085,000, respectively, all of which relate to the MacroPore
Biosurgery segment. These revenues were primarily related to orders for our radiographically identifiable Spine System products, marketed under the name MYSTIQUE™. As noted above, we are concerned about the level of commitment to these products from Medtronic, our exclusive distributor, and we have changed the focus of our business away from these products.
Under a distribution agreement with Senko, we are responsible for the completion of the initial regulatory application to the MHLW (the
Japanese equivalent of the U.S. Food and Drug Administration). We recognized development revenue based on milestones defined within this agreement of $152,000, $51,000, and $158,000 for the years ended December 31, 2006, 2005, and 2004, respectively. We have not received any Thin Film product revenue in Japan yet, and we sold all our non-Japan Thin Film business in 2004.
We anticipate that our future international product revenues will increase as a result of our Distribution Agreement with Senko once our
Thin Film products reach commercialization in Japan.
Planned Capital Expenditures
Although capital expenditures may vary significantly depending on a variety of factors, we presently intend to spend approximately $1,000,000 on capital equipment purchases in 2007. A portion of these may be paid with our available cash. Raw Materials
We currently purchase the high molecular weight, medical grade, lactic acid copolymer used in manufacturing most of our bioresorbable products from a single qualified source, B.I. Chemicals, Inc. Although we have a contract with B.I. Chemicals, which guarantees continuation of supply through August 15, 2008, we cannot guarantee that they will elect to continue the contract beyond that date, or that they will not elect to discontinue the manufacture of the material. They have agreed that if they discontinue manufacturing they will either find a replacement supplier, or provide us with the necessary technology to self-manufacture the material, either of which could mean a substantial increase in material costs. Also, despite this agreement, they might fail to fulfill their obligations. Under the terms of the contract, B.I. Chemicals, Inc. may choose to raise their prices upon six months prior notice which may also result in a substantially increased material cost. Although we believe that we would be able to obtain the material from at least one other source in the event of a failure of supply, there can be no assurance that we will be able to obtain adequate increased commercial quantities of the necessary high quality within a reasonable period of time or at commercially reasonable rates. Lack of adequate commercial quantities or inability to develop alternative sources meeting regulatory requirements at similar prices and terms within a reasonable time or any interruptions in supply in the future could have a significant negative effect on our ability to manufacture bioresorbable products. Intellectual Property
Our success depends in large part on our ability to protect our proprietary technology and information, and operate without infringing on the proprietary rights of third parties. We rely on a combination of patent, trade secret, copyright and trademark laws, as well as confidentiality agreements, licensing agreements and other agreements, to establish and protect our proprietary rights. Our success also depends, in part, on our ability to avoid infringing patents issued to others. If we were judicially determined to be infringing any third party patent, we could be required to pay damages, alter our products or processes, obtain licenses or cease certain activities.
Table of Contents
-8-
To protect our proprietary regenerative cell technology we have filed applications for 27 United States patents, as well as an additional 87 corresponding international patent applications. We are also the exclusive, worldwide licensee of the Regents of the University of California’s rights to one U.S. Patent (Patent No. 6,777,231) related to isolated adipose derived stem cells that can differentiate into two or more of a variety of cell types, three related issued foreign patents, five related U.S. patent applications, and 18 related international patent applications. With respect to our bioresorbable implant products and technology, we have obtained 17 U.S. patents, three of which were sold in product line dispositions. Our three U.S. patents related to the design of our macro-porous bioresorbable sheets for skeletal repair and regeneration were issued in July 1999, August 2001 and March 2004. Our three U.S. patents for the design of our high torque bioresorbable screws were issued in August 2001, February 2002 and November 2002. Our U.S patent related to our membrane with tissue guiding surface corrugations was issued in May 2002. Our two U.S. patents related to our bioresorbable barrier film for the control of postsurgical adhesions were issued in March 2003 and January 2004 and assigned to MAST as part of the Thin Film product line sale agreement. Our U.S. patent related to stereotaxic detachable needle extensions was issued in June 2003. Our U.S. patent related to non-scatterable radio-opaque material for imaging applications was issued in October 2003. Our U.S. patents related to a resorbable posterior spinal fusion system were issued in April 2004 and July 2006. Our U.S. patent related to thermally pliable and carbon fiber stents was issued in March 2006. Our U.S. patent for a time release substance delivery device was issued in August 2006. Our U.S. patent for a heating pen, tack seating device and tap was issued in September 2006. We also have two Australian patents, one Canadian patent and one European patent related to our bioresorbable mesh, one Australian patent for the design of our high torque bioresorbable screws and one Australian patent and one European patent related to our membrane with tissue guiding surface corrugations. Our four Australian patents were issued in August 2000, January 2003 and September 2003. Our Canadian patent was issued November 2004. Our two European patents were issued January 2005 and June 2006. Each of our patents will expire 20 years from the filing date of the original patent application. In addition, we have filed applications for 10 additional U.S. patent applications as well as 46 corresponding international patents relating to our bioresorbable technology.
We cannot assure that any of the pending patent applications will be issued, that we will develop additional proprietary products that are patentable, that any patents issued to us will provide us with competitive advantages or will not be challenged by any third parties or that the patents of others will not prevent the commercialization of products incorporating our technology. Furthermore, we cannot assure that others will not independently develop similar products, duplicate any of our products or design around our patents. U.S. patent applications are not immediately made public, so we might be surprised by the grant to someone else of a patent on a technology we are actively using.
Patent law outside the United States is uncertain and in many countries is currently undergoing review and revisions. The laws of some
countries may not protect our proprietary rights to the same extent as the laws of the U.S. Third parties may attempt to oppose the issuance of patents to us in foreign countries by initiating opposition proceedings. Opposition proceedings against any of our patent filings in a foreign country could have an adverse effect on our corresponding patents that are issued or pending in the U.S. It may be necessary or useful for us to participate in proceedings to determine the validity of our patents or our competitors’ patents that have been issued in countries other than the U.S. This could result in substantial costs, divert our efforts and attention from other aspects of our business, and could have a material adverse effect on our results of operations and financial condition. We currently have pending patent applications in Europe, Australia, Japan, Canada, China, Korea, and Singapore, among others.
Patent litigation results in substantial costs to us and diversion of effort, and may be necessary from time to time to enforce or confirm the
ownership of any patents issued or licensed to us or to determine the scope and validity of third party proprietary rights. If our competitors claim technology also claimed by us and prepare and file patent applications in the United States, we may have to participate in interference proceedings declared by the U.S. Patent and Trademark Office or a foreign patent office to determine priority of invention, which could result in substantial costs to and diversion of effort, even if the eventual outcome is favorable to us. In particular, in the fourth quarter of 2004, the University of Pittsburgh filed a lawsuit naming all of the inventors who had not assigned their ownership interest in Patent 6,777,231 to the University of Pittsburgh, seeking a determination that its assignors, rather than the University of California’s assignors, are the true inventors of Patent No. 6,777,231. If the University of Pittsburgh wins the lawsuit, our license rights to this patent could be nullified or rendered non-exclusive with respect to any third party that might license rights from the University of Pittsburgh, and certain aspects of our strategy related to our regenerative cell technology could be impacted. We have incurred and expect to continue to incur substantial legal costs as a result of the University of Pittsburgh lawsuit. Our President, Marc Hedrick, M.D., is a named individual defendant in that lawsuit.
Table of Contents
-9-
In addition to patent protection, we rely on unpatented trade secrets and proprietary technological expertise. We cannot assure you that others will not independently develop or otherwise acquire substantially equivalent techniques, somehow gain access to our trade secrets and proprietary technological expertise or disclose such trade secrets, or that we can ultimately protect our rights to such unpatented trade secrets and proprietary technological expertise. We rely, in part, on confidentiality agreements with our marketing partners, employees, advisors, vendors and consultants to protect our trade secrets and proprietary technological expertise. We cannot assure you that these agreements will not be breached, that we will have adequate remedies for any breach or that our unpatented trade secrets and proprietary technological expertise will not otherwise become known or be independently discovered by competitors.
Failure to obtain or maintain patent protection, or protect trade secrets, for any reason, third party claims against our patents, trade secrets
or proprietary rights, or our involvement in disputes over our patents, trade secrets or proprietary rights, including involvement in litigation, could have a substantial negative effect on the results of our operations, cash flows and financial condition. Government Regulation
Most medical devices, therapies and treatments for use in humans, including our investigational stem cell-based treatments, are subject to stringent government regulation in the United States by the Food and Drug Administration, or “FDA,” under the federal Food, Drug and Cosmetic Act, or “FDC” Act and by the European Union. The FDA regulates the clinical testing, manufacture, safety, labeling, sale, distribution and promotion of medical devices and therapies. Included among these regulations are pre-market clearance, pre-market approval, biologic license application, new drug application, and Quality System Regulation, or “QSR,” requirements. Other statutory and regulatory requirements govern, among other things, registration and inspection, medical device listing, prohibitions against misbranding and adulteration, labeling and post-market reporting. The regulatory process may be lengthy, expensive and uncertain. Securing FDA approvals and clearances may require us to submit extensive clinical data and supporting information to the FDA. Failure to comply with applicable requirements can result in application integrity proceedings, fines, recalls or seizures of products, injunctions, civil penalties, total or partial suspensions of production, withdrawals of existing product approvals or clearances, refusal to approve or clear new applications or notifications, and criminal prosecution.
Under the FDC Act, medical devices are classified into Class I, Class II or Class III devices, based on their risks and the control necessary to reasonably ensure their safety and effectiveness. Class I devices are subject to general controls such as labeling, pre-market notification and adherence to QSR requirements. Class II devices are subject to general controls, and may be subject to specific controls such as performance standards, post-market surveillance and patient registries. Class II devices require pre-market notification to the FDA in the form of a 510(k) application that demonstrates the new device to be “substantially equivalent” to an existing FDA 510(k) cleared device. Generally, Class III devices, which include certain life-sustaining, life-supporting and implantable devices or new devices which have been found not to be substantially equivalent to certain legally marketed devices, must receive pre-market approval from the FDA. All of our bioresorbable implant products to date are Class II medical devices.
Before any new Class II or III medical device may be introduced to the market, the manufacturer generally must obtain either pre-market
clearance through the 510(k) pre-market notification process or pre-market approval through the lengthier Pre-market Approval Application, or “PMA,” process. The FDA will grant a 510(k) pre-market notification if the submitted data establishes that the proposed device is “substantially equivalent” to a legally marketed Class I or Class II medical device. The FDA may request data, including clinical studies, before it can make a determination of substantial equivalence. It generally takes from three to 12 months from submission to obtain 510(k) pre-market clearance, although it may take longer. There is no assurance that clearance will be granted. We must file a PMA if one of our products is found not to be substantially equivalent to a legally marketed Class II device or if it is a Class III device for which the FDA requires PMAs. A PMA must be supported by extensive data to demonstrate the safety and effectiveness of the device, including laboratory, pre-clinical and clinical trial data, as well as extensive manufacturing information. Before initiating human clinical trials on devices that present a significant risk, we must first obtain an Investigational Device Exemption, or IDE, for the proposed medical device. Obtaining FDA approval of the Investigational Device Exemption allows the sponsor to begin the collection of clinical data according to a protocol that must be approved by the FDA. Several factors influence the overall time frame of the IDE process. These include: the number of patients required for statistical significance, the requirement for a pilot (safety) study in advance of initiating a pivotal study, and the duration of follow-up required before the IDE can be closed and the PMA prepared for submission to FDA. This follow-up period typically ranges from 12-24 months on the last patient to be enrolled in the study. Toward the end of the PMA review process, the FDA will generally conduct an inspection of the manufacturing facilities to ensure compliance with QSRs. Approval of a PMA could take up to one or more years from the date of submission of the application or petition; however, the entire process of IDE submission /approval, clinical data collection, patient follow-up, PMA preparation and approval typically requires 4 years or more. The PMA process can also be expensive and uncertain, and there is no guarantee of ultimate approval.
Table of Contents
-10-
Modifications or enhancements of products that could affect the safety or effectiveness or effect a major change in the intended use of a
device that was either cleared through the 510(k) process or approved through the PMA process may require further FDA review through new 510(k) or PMA submissions.
As a medical device manufacturer, we are subject to periodic inspections by the FDA to ensure that devices continue to be manufactured in
accordance with QSR requirements. We are also subject to post-market reporting requirements for deaths or serious injuries when a device may have caused or contributed to death or serious injury, and for certain device malfunctions that would be likely to cause or contribute to a death or serious injury if the malfunction were to recur. Post-market reporting also may be required for certain corrective actions undertaken for distributed devices. If safety or effectiveness problems occur after the product reaches the market, the FDA may take steps to prevent or limit further marketing of the product. Additionally, the FDA actively enforces regulations prohibiting marketing of devices for indications or uses that have not been cleared or approved by the FDA.
Under the terms of our development and supply agreement with Medtronic, Medtronic is responsible for preparing and filing applications
for, and obtaining regulatory approval of the products we co-develop for use in spinal fixation, stabilization or fusion applications. We or our marketing partners may not be able to obtain necessary 510(k) clearances or PMA approvals to market the products we are developing in the United States for their intended use on a timely basis, if at all.
We must comply with extensive regulations from foreign jurisdictions regarding safety, manufacturing processes and quality. These
regulations, including the requirements for marketing authorization, may differ from the United States FDA regulatory scheme. Specifically, in regard to our licensing agreement with Senko, marketing authorization from the Japanese Ministry of Health, Labour and Welfare is necessary for commercialization of the Thin Film product line in Japan.
We may not be able to obtain marketing authorization in all of the countries where we intend to market our products, may incur significant costs in obtaining or maintaining our foreign marketing authorizations, or may not be able to successfully commercialize our current or future products in any foreign markets. Delays in receipt of marketing authorizations for our products in foreign countries, failure to receive such marketing authorizations or the future loss of previously received marketing authorizations could have a material adverse effect on our results of operations, cash flows and financial condition.
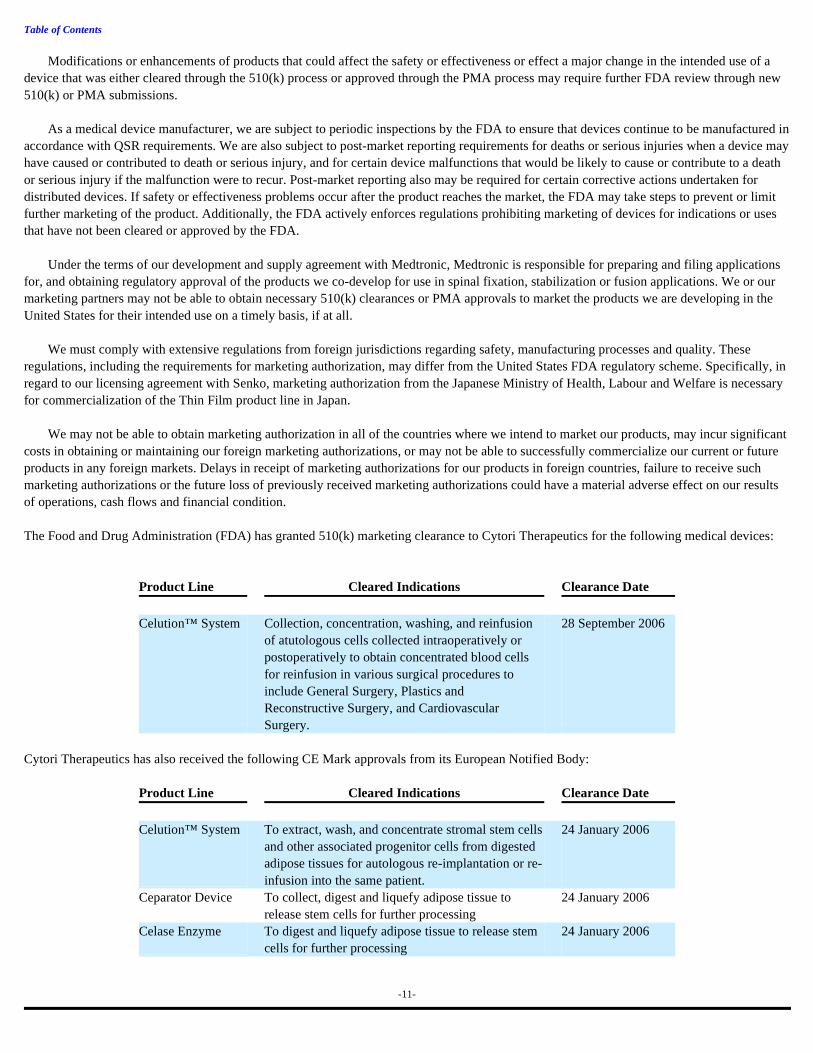
The Food and Drug Administration (FDA) has granted 510(k) marketing clearance to Cytori Therapeutics for the following medical devices:
Cytori Therapeutics has also received the following CE Mark approvals from its European Notified Body:
Table of Contents
Product Line Cleared Indications Clearance Date Celution™ System Collection, concentration, washing, and reinfusion
of atutologous cells collected intraoperatively or postoperatively to obtain concentrated blood cells for reinfusion in various surgical procedures to include General Surgery, Plastics and Reconstructive Surgery, and Cardiovascular Surgery.
28 September 2006
Product Line Cleared Indications Clearance Date Celution™ System To extract, wash, and concentrate stromal stem cells
and other associated progenitor cells from digested adipose tissues for autologous re-implantation or re-infusion into the same patient.
24 January 2006
Ceparator Device To collect, digest and liquefy adipose tissue to release stem cells for further processing
24 January 2006
Celase Enzyme To digest and liquefy adipose tissue to release stem cells for further processing
24 January 2006
-11-
Staff
As of December 31, 2006, we had 133 employees, including part-time and full-time employees. These employees are comprised of 4 employees in manufacturing, 89 employees in research and development, 5 employees in sales and marketing and 35 employees in management and finance and administration. From time to time, we also employ independent contractors to support our administrative organizations. Our employees are not represented by any collective bargaining unit and we have never experienced a work stoppage. A breakout by segment is as follows:
The above figures reflect a reduction in force which we effected in July 2006, resulting in the elimination of 29 positions.
Web Site Access to SEC Filings
We maintain an Internet website at www.cytoritx.com. Through this site, we make available free of charge our annual reports on Form 10-K, quarterly reports on Form 10-Q, current reports on Form 8-K, and amendments to those reports filed or furnished pursuant to Section 13(a) of the Securities Exchange Act of 1934 as soon as reasonably practicable after we electronically file such material with, or furnish it to, the U.S. Securities and Exchange Commission (SEC). In addition, we publish on our website all reports filed under Section 16(a) of the Securities Exchange Act by our directors, officers and 10% stockholders.
These materials are accessible via the Investor Relations section of our website within the “SEC Filings” link. Some of the information is
stored directly on our website, while other information can be accessed by selecting the provided link to the section on the SEC website, which contains filings for our company and its insiders.
We file electronically with the SEC our annual reports on Form 10-K, quarterly reports on Form 10-Q and current reports on Form 8-K
pursuant to Section 13(a) of the Securities Exchange Act of 1934. The SEC maintains an Internet site that contains reports, proxy information and information statements, and other information regarding issuers that file electronically with the SEC. The address of that website is http://www.sec.gov . The materials are also available at the SEC’s Public Reference Room, located at 100 F Street, Washington, D.C. 20549. The public may obtain information through the public reference room by calling the SEC at 1-800-SEC-0330. Item 1A. Risk Factors
In analyzing our company, you should consider carefully the following risk factors, together with all of the other information included in this annual report on Form 10-K. Factors that could adversely affect our business, operating results and financial condition, as well as adversely affect the value of an investment in our common stock, include those discussed below, as well as those discussed above in “Management’s Discussion and Analysis of Financial Condition and Results of Operations” and elsewhere throughout this annual report on Form 10-K.
We are subject to the following significant risks, among others: We will need to raise more cash in the future
We have always had negative cash flows from operations. Our regenerative cell business will continue to result in a substantial requirement for research and development expenses for several years, during which it could bring in no significant cash and /or revenues. Our spine and orthopedics products business has performed poorly and we are actively seeking to divest these assets. There can be no guarantee that adequate funds for our operations from any additional debt or equity financing, our operating revenues, arrangements with distribution partners or from other sources will be available when needed or on terms attractive to us. The inability to obtain sufficient funds would require us to delay, scale back or eliminate some or all of our research or product development programs, manufacturing operations, clinical studies or regulatory activities or to license third parties to commercialize products or technologies that we would otherwise seek to develop ourselves,
Table of Contents
Regenerative Cell
Technology MacroPore Biosurgery Corporate Total
Manufacturing — 4 — 4 Research & Development 88 1 — 89 Sales and Marketing 5 — — 5 General & Administrative — — 35 35 Total 93 5 35 133
thus having a substantial negative effect on the results of our operations and financial condition.
-12-
We have never been profitable on an operational basis and we expect to have significant operating losses for the next few years
We have incurred net operating losses in each year since we started doing business. These losses have resulted primarily from expenses associated with our research and development activities and general and administrative expenses. Losses related to our development of regenerative cell technology are expected to keep us in a loss position on a consolidated basis for several years. We anticipate that our recurring operating expenses will be at high levels for the next few years, due to the continued need to fund our clinical research program as well as additional pre-clinical research. Our business strategy is high-risk
We are focusing our resources and efforts primarily on our regenerative cell technology and its cash needs for research and development activities. This is a high-risk strategy because there can be no assurance that our regenerative cell technology will ever be developed into commercially viable products (commercial risk), that we will be able to preclude other companies from depriving us of market share and profit margins by selling products based on our inventions and developments (legal risk), that we will be able to successfully manage a company in a different business than we have operated in the past (operational risk), that we will be able to deliver regenerative cells into the body to achieve the desired therapeutic results (scientific risk), or that our cash resources will be adequate to develop the regenerative cell technology until it becomes profitable, if ever (financial risk). We are using our cash in one of the riskiest industries in the economy (strategic risk). This may make our stock an unsuitable investment for some investors.
The financial risk in this strategy is significant, particularly since our bioresorbable products are not currently independently cash-flow-
positive. Although we eliminated the negative cash flow of the early commercialization stage of the (non-Japan) Thin Film business by selling that business to MAST in May 2004, even our core spine and orthopedics implants business fell back into a negative cash flow position in 2004 due to the sharp reduction in orders from and sales to Medtronic. This trend has continued throughout 2005 and 2006. We must keep our joint venture with Olympus operating smoothly
Our regenerative cell business cannot succeed on the current timelines unless our joint venture collaboration with Olympus goes well. We have given Olympus-Cytori, Inc. an exclusive license to our regenerative cell therapeutic device technology for use in future generation devices. If Olympus-Cytori, Inc. does not successfully develop and manufacture future generation devices for sale to us, we may not be able to commercialize any device or any therapeutic products successfully into the market. In addition, any future disruption in or breakup of our relationship with Olympus would be extremely costly to our reputation, in addition to causing many serious practical problems.
We and Olympus must overcome contractual and cultural barriers as we work together. Our relationship is formally measured by a set of complex contracts, which have not yet been tested in practice. In addition, many aspects of the relationship will be essentially non-contractual and must be worked out between the parties and the responsible individuals over time. The Joint Venture is intended to have a long life, and it is difficult to maintain cooperative relationships over a long period of time from a far distance in the face of various kinds of change. Cultural differences, including a language barrier to some degree, may affect the efficiency of the relationship as well.
Olympus-Cytori, Inc. is 50% owned by us and 50% owned by Olympus. By contract, each side must consent before any of a wide variety
of important business actions can occur. This situation possesses a risk of potential time-consuming and difficult negotiations which could at some point delay the Joint Venture from pursuing its business strategies.
Olympus is entitled to designate the Joint Venture's chief executive officer and a majority of its board of directors, which means that day-
to-day decisions which are not subject to a contractual veto will essentially be controlled by Olympus. In addition, Olympus-Cytori, Inc. will need more money than its initial capitalization in order to finalize development of and production of the future generation devices. If we are unable to help provide future financing for Olympus-Cytori, Inc., our relative equity interest in Olympus-Cytori, Inc. may decrease.
Furthermore, under a License/Joint Development Agreement among Olympus-Cytori, Inc., Olympus, and us, Olympus will have a primary
role in the development of Olympus-Cytori, Inc.'s future generation devices. Although Olympus has extensive experience in developing medical devices, this arrangement will result in a reduction of our control over the development and manufacturing of the future generation devices.
Table of Contents
-13-
We rely on Medtronic to distribute a majority of our current biomaterials products, but Medtronic’s level of commitment to our products historically has been poor
We have limited control over sales, marketing and distribution of our biomaterials products. Our strategy for sales and marketing of our bioresorbable products included entering into an agreement with Medtronic, a company with a large distribution network, to market many of our current and certain future products incorporating our technology. The sale of hard-tissue-fixation bioresorbable implant products to our distribution partner, Medtronic, has constituted the majority of our revenues.
We remain significantly dependent on Medtronic to generate sales revenues for all of our spine and orthopedics bioresorbable products.
The amount and timing of resources which may be devoted to the performance of Medtronic’s contractual responsibilities are not within our control. There can be no guarantee that Medtronic will perform its obligations as expected or pay us any additional option or license fees. There is also no guarantee that it will market any new products under the distribution agreements or that we will derive any significant revenue from such arrangements. Medtronic’s sale of our products to end customers in 2004, 2005 and 2006, and its rate of product orders placed with us in the same periods, disappointed our expectations.
We remain significantly disappointed with the marketing efforts of Medtronic for our non-MYSTIQUE™ products at this time. We
recorded an inventory provision for slow-moving non-MYSTIQUE™ inventory in the second, third and fourth quarters of 2005 as well as in the second and third quarters of 2006. We are also becoming concerned about Medtronic’s commitment to MYSTIQUE™.
Our dependence upon Medtronic to market and sell our bioresorbable products places us in a position where we cannot accurately predict
the extent to which our products will be actively and effectively marketed, depriving us of some of the reliable data we need to make optimal operational and strategic decisions. The results of this business line in each year from 2004 through 2006 have been below our internal expectations.
The prices which Medtronic pays us are fixed (pending semiannual price reviews in January and July of each year), based on a percentage
of Medtronic’s historic selling price to its customers. If our costs increase but our selling prices remain fixed, our profit margin will suffer. Medtronic owns 4.45% of our stock subsequent to the offering in February 2007, which may limit our ability to negotiate commercial
arrangements optimally with Medtronic. Although Medtronic has exclusive distribution rights to our co-developed spinal implants, it also distributes other products that are competitive to ours. Medtronic might choose to develop and distribute existing or alternative technologies in preference to our technology in the spine, or preferentially market competitive products that can achieve higher profit margins. We suspect that this has in fact been happening.
There can be no assurance that our interests will coincide with those of Medtronic or that disagreement over rights or technology or other
proprietary interests will not occur. The loss of the marketing services provided by Medtronic (or the failure of Medtronic to satisfactorily perform these marketing services), or the loss of revenues generated by Medtronic, could have a substantial negative effect on our ability or willingness to continue our spine and orthopedics biomaterials business. Indeed, it seems the problems we have already experienced with Medtronic may be intractable. Accordingly, we are actively seeking divestiture or other strategic alternatives for the business.
Senko has not yet begun to distribute our Thin Film products in Japan; but if and when they do, we cannot be assured that they will be successful. We have a limited operating history; our operating results can be volatile
Our prospects must be evaluated in light of the risks and difficulties frequently encountered by emerging companies and particularly by such companies in rapidly evolving and technologically advanced fields such as the biotechnology and medical device fields. Due to our limited operating history, and the development stage status of our regenerative cell business, comparisons of our year-to-year operating results are not necessarily meaningful and the results for any periods should not necessarily be relied upon as an indication for future performance. Since our limited operating history makes the prediction of future results difficult or impossible, our recent revenue results should not be taken as an indication of any future growth or of a sustainable level of revenue. Operating results will also be affected by our transition away from our revenue generating medical device business and the focus of the vast majority of our resources into the development of the regenerative cell business.
Table of Contents
-14-
Moreover, our operating results can vary substantially from our previously published financial guidance (such as occurred in the second quarter of 2004), from analyst expectations and from previous periodic results for many reasons, including the timing of product introductions and distributor purchase orders. Also, the 2002 sale of our CMF bone fixation implant and accessory product line, which had represented a large portion of our revenues, plus the 2004 sale of our (non-Japan) Thin Film surgical implants for separation of soft tissues, have distorted quarterly and annual earning comparisons through 2004 and 2005. Earnings surprises can have a disproportionate effect on the stock prices of emerging companies such as ours. Also, our stock price is likely to be disproportionately affected by changes which generally affect the economy, the stock market or the medical device and biotechnology industries.
From time to time, we have tried to influence our investors’ expectations as to our operating results by periodically announcing financial
guidance. However, we have in the past been forced to revise or withdraw such guidance due to lack of visibility and predictability of product demand. This lack of visibility and predictability of product demand for our bioresorbable implant products is likely to occur in the future as well. We are vulnerable to competition and technological change, and also to physicians’ inertia
We compete with many domestic and foreign companies in developing our technology and products, including biotechnical, medical device, pharmaceutical and biopharmaceutical companies. Many of our competitors and potential competitors have substantially greater financial, technological, research and development, marketing and personnel resources than we do. There can be no assurance that our competitors will not succeed in developing alternative technologies and products that are more effective, easier to use or more economical than those which we have developed or are in the process of developing or that would render our technology and products obsolete and non-competitive in these fields. In general, we may not be able to preclude other companies from developing and marketing competitive regenerative cell therapies or bioresorbable products that are similar to ours or perform similar functions.
These competitors may also have greater experience in developing therapeutic treatments, conducting clinical trials, obtaining regulatory
clearances or approvals, manufacturing and commercializing therapeutic or biomaterials products. It is possible that certain of these competitors may obtain patent protection, approval or clearance by the U.S. Food and Drug Administration “FDA” or achieve commercialization earlier than we, any of which could have a substantial negative effect on our business. Finally, Olympus, Medtronic and our other partners might pursue parallel development of other technologies or products, which may result in a partner developing additional products that will compete with our products.
We also compete with other types of regenerative cell therapies such as bone marrow derived cell therapies, and potentially embryonic
derived therapies. Our biomaterials business competes with manufacturers of traditional non-bioresorbable implants, such as titanium implants. Doctors have historically been slow to adopt new technologies such as ours, whatever the merits, when older technologies continue to be supported by established providers. Overcoming such inertia often requires very significant marketing expenditures or definitive product superiority.
We expect physicians’ inertia and skepticism to also be a significant barrier as we attempt to gain market penetration with our future
regenerative cell products. We believe we will need to finance lengthy time-consuming clinical studies (so as to provide convincing evidence of the medical benefit) in order to overcome this inertia and skepticism.
Our regenerative cell technology products are pre-commercialization, which subjects us to development and marketing risks
We are in a relatively early stage of the path to commercialization with many of our products. We believe that our long-term viability and growth will depend in large part on our ability to develop commercial quality cell processing devices and to establish the safety and efficacy of our therapies through clinical trials and studies. We are presently pursuing regenerative cell opportunities in cardiovascular disease, aesthetic and reconstructive surgery, spine and orthopedic conditions, and gastrointestinal disorders that may require extensive additional capital investment, research, development, clinical testing and regulatory clearances or approvals prior to commercialization. There can be no assurance that our development programs will be successfully completed or that required regulatory clearances or approvals will be obtained on a timely basis, if at all.
There is no proven path for commercializing our regenerative cell technology in a way to earn a durable profit commensurate with the
medical benefit. Although we are working to develop proprietary therapeutic products which optimize or enhance the benefit of autologous stem and regenerative cells for a variety of particular indications, most of our cell-related products and/or services are at least two to five years away.
Moreover, the successful development and market acceptance of our technologies and products are subject to inherent developmental risks,
including failure of inventive imagination, ineffectiveness or lack of safety, unreliability, failure to receive necessary regulatory clearances or approvals, high commercial cost and preclusion or obsolescence resulting from third parties’ proprietary rights or superior or equivalent
Table of Contents
products, as well as general economic conditions affecting purchasing patterns. There can be no assurance that we or our partners will be able to successfully develop and commercialize our technologies or products, or that our competitors will not develop competing technologies that are less expensive or otherwise superior to ours. The failure to successfully develop and market our new regenerative cell technologies would have a substantial negative effect on the results of our operations and financial condition.
-15-
We have limited manufacturing experience
We have no experience in manufacturing the Celution™ System at a commercial level, and although Olympus is a highly capable and experienced manufacturer of medical devices, there can be no guarantee that the Olympus-Cytori joint venture will be able to successfully develop and manufacture the Celution™ System in a manner that is cost-effective or commercially viable, or that development and manufacturing capabilities might not take much longer than currently anticipated to be ready for the market.
In the event that the Olympus-Cytori joint venture is not successful, Cytori may not have the resources or ability to self manufacture
commercially viable devices, and in any event this failure may substantially extend the time it would take for us to bring a commercial device to market. This makes us significantly dependant on the continued dedication and skill of Olympus for the successful development of the Celution™ System.
In addition, as a company we have limited experience in manufacturing the type of cell-related therapeutic products which we intend to
introduce in 2008. In addition, the future of our biomaterials business success is significantly dependent on our ability to manufacture our bioresorbable
implants in commercial quantities, in compliance with regulatory requirements and in a cost-effective manner. Production of some of our products in commercial-scale quantities may involve unforeseen technical challenges and may require significant scale-up expenses for additions to facilities and personnel. There can be no guarantee that we will be able to achieve large-scale manufacturing capabilities for some of our biomaterials products or that we will be able to manufacture these products in a cost-effective manner or in quantities necessary to allow us to achieve profitability. Our 2002 sale of CMF production assets to Medtronic and our 2004 sale of the (non-Japan) Thin Film product line deprived us of some economies of scale in manufacturing. Current demand for spine and orthopedics products from Medtronic is so low that economies of scale are lacking in regard to that product line as well.
We have to maintain quality assurance certification and manufacturing approvals
The manufacture of our bioresorbable products is, and the manufacture of the Celution™ System for regenerative cells will be, and the manufacture of any future cell-related therapeutic products would be, subject to periodic inspection by regulatory authorities and distribution partners. The manufacture of devices and products for human use is subject to regulation and inspection from time to time by the FDA for compliance with the FDA’s Quality System Regulation “QSR” requirements, as well as equivalent requirements and inspections by state and non-U.S. regulatory authorities. There can be no guarantee that the FDA or other authorities will not, during the course of an inspection of existing or new facilities, identify what they consider to be deficiencies in our compliance with QSRs or other requirements and request, or seek, remedial action.
Failure to comply with such regulations or a potential delay in attaining compliance may adversely affect our manufacturing activities and
could result in, among other things, injunctions, civil penalties, FDA refusal to grant pre-market approvals or clearances of future or pending product submissions, fines, recalls or seizures of products, total or partial suspensions of production and criminal prosecution. There can be no assurance that we will be able to obtain additional necessary regulatory approvals or clearances on a timely basis, if at all. Delays in receipt of or failure to receive such approvals or clearances or the loss of previously received approvals or clearances could have a substantial negative effect on the results of our operations and financial condition. We depend on a sole source supplier for our crucial raw material for our bioresorbable products
We currently purchase the high molecular weight, medical grade, lactic acid copolymer used in manufacturing most of our bioresorbable products, from a single qualified source. Although we have a contract with B.I. Chemicals, Inc., which guarantees continuation of supply through August 15, 2008, we cannot guarantee that they will elect to continue the contract beyond that date, or that they will not elect to discontinue the manufacture of the material. They have agreed that if they discontinue manufacturing they will either find a replacement supplier, or provide us with the necessary technology to self-manufacture the material, either of which could mean a substantial increase in material costs. Also, despite this agreement they might fail to do these things for us. Under the terms of the contract, B.I. Chemicals, Inc. may choose to raise their prices upon six months’ prior notice which may also result in a substantially increased material cost. Although we believe that we would be able to obtain the material from at least one other source in the event of a failure of supply, there can be no assurance that we will be able to obtain adequate increased commercial quantities of the necessary high quality within a reasonable period of time or at commercially reasonable rates. Lack of adequate commercial quantities or the inability to develop alternative sources meeting regulatory requirements at similar prices and terms within a reasonable time or any interruptions in supply in the future could have a significant negative effect on our ability to manufacture products, and, consequently, could have a material adverse effect on the results of our operations and financial condition.
Table of Contents
-16-
We may not be able to protect our proprietary rights
Our success depends in part on whether we can obtain additional patents, maintain trade secret protection and operate without infringing on the proprietary rights of third parties.
Our recently amended regenerative cell technology license agreement with the Regents of the University of California contains certain developmental milestones, which if not achieved could result in the loss of exclusivity or loss of the license rights. The loss of such rights could impact our ability to develop certain regenerative cell technology products. Also, our power as licensee to successfully use these rights to exclude competitors from the market is untested. In addition, further legal risk arises from a lawsuit, filed by the University of Pittsburgh naming all of the inventors who had not assigned their ownership interest in Patent 6,777,231 to the University of Pittsburgh, seeking a determination that its assignors, rather than the University of California’s assignors, are the true inventors of Patent 6,777,231. We are the exclusive, worldwide licensee of the University of California’s rights under this patent, which relates to adult stem cells isolated from adipose tissue that can differentiate into two or more of a variety of cell types. If the University of Pittsburgh wins the lawsuit, our license rights to this patent could be nullified or rendered non-exclusive with respect to any third party that might license rights from the University of Pittsburgh, and our regenerative cell strategy could be impacted.
We have various U.S. patents for the design of our bioresorbable plates and high torque screws and devices and we have filed applications
for numerous additional U.S. patents, as well as certain corresponding patent applications outside the United States, relating to our technology. However, we believe we cannot patent the use of our lactic acid copolymer for surgical implants, nor are many of our particular implants generally patentable.
There can be no assurance that any of the pending patent applications will be approved or that we will develop additional proprietary
products that are patentable. There is also no assurance that any patents issued to us will provide us with competitive advantages, will not be challenged by any third parties or that the patents of others will not prevent the commercialization of products incorporating our technology. Furthermore, there can be no guarantee that others will not independently develop similar products, duplicate any of our products or design around our patents.
Our commercial success will also depend, in part, on our ability to avoid infringing on patents issued to others. If we were judicially
determined to be infringing on any third party patent, we could be required to pay damages, alter our products or processes, obtain licenses or cease certain activities. If we are required in the future to obtain any licenses from third parties for some of our products, there can be no guarantee that we would be able to do so on commercially favorable terms, if at all. U.S. patent applications are not immediately made public, so we might be surprised by the grant to someone else of a patent on a technology we are actively using. As noted above as to the University of Pittsburgh lawsuit, even patents issued to us or our licensors might be judicially determined to belong in full or in part to third parties.
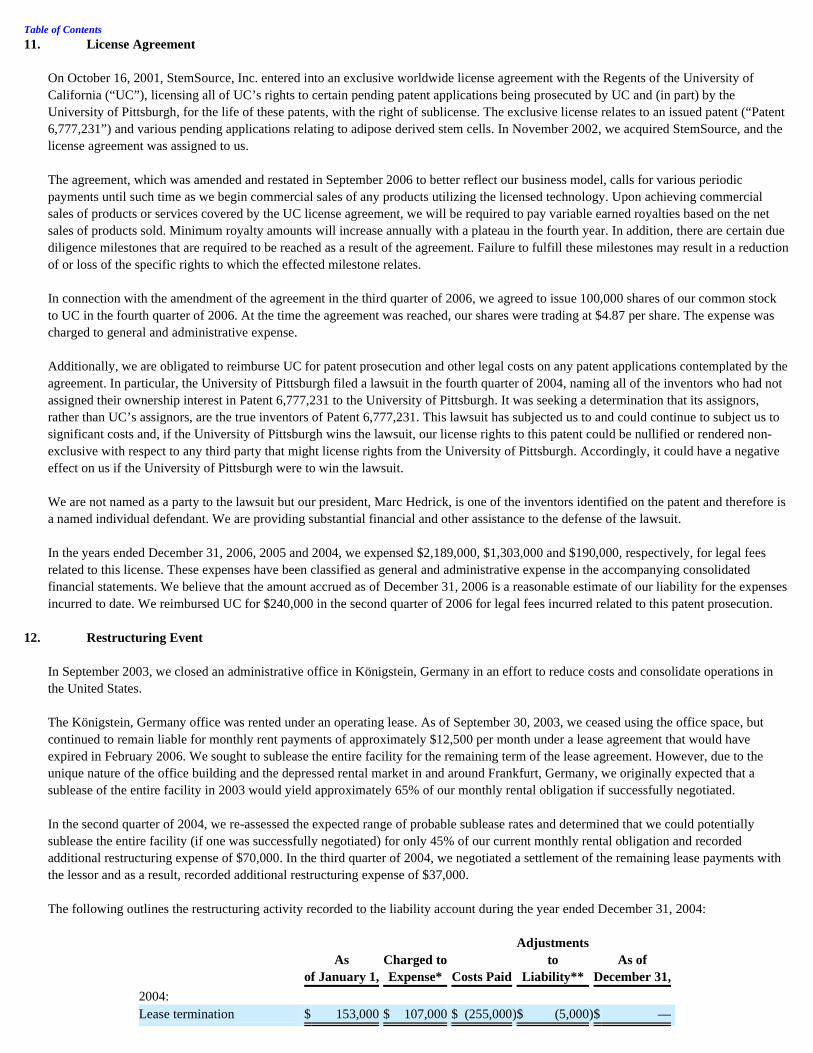
Litigation, which would result in substantial costs to us and diversion of effort on our part, may be necessary to enforce or confirm the
ownership of any patents issued or licensed to us or to determine the scope and validity of third party proprietary rights. If our competitors claim technology also claimed by us and prepare and file patent applications in the United States, we may have to participate in interference proceedings declared by the U.S. Patent and Trademark Office or a foreign patent office to determine priority of invention, which could result in substantial costs to and diversion of effort, even if the eventual outcome is favorable to us.
Any such litigation or interference proceeding, regardless of outcome, could be expensive and time consuming. We have been incurring
substantial legal costs as a result of the University of Pittsburgh lawsuit, and our president, Marc Hedrick, is a named individual defendant in that lawsuit because he is one of the inventors identified on the patent. As a named inventor on the patent, Marc Hedrick is entitled to receive from the Regents of the University of California up to 7% of royalty payments made by a licensee (us) to the Regents of the University of California. This agreement was in place prior to his employment with us.
Table of Contents
-17-
In addition to patents, which alone may not be able to protect the fundamentals of our regenerative cell and bioresorbable businesses, we also rely on unpatented trade secrets and proprietary technological expertise. We rely, in part, on confidentiality agreements with our partners, employees, advisors, vendors and consultants to protect our trade secrets and proprietary technological expertise. There can be no guarantee that these agreements will not be breached, or that we will have adequate remedies for any breach, or that our unpatented trade secrets and proprietary technological expertise will not otherwise become known or be independently discovered by competitors.
Failure to obtain or maintain patent protection, or protect trade secrets, for any reason (or third party claims against our patents, trade
secrets or proprietary rights, or our involvement in disputes over our patents, trade secrets or proprietary rights, including involvement in litigation), could have a substantial negative effect on the results of our operations and financial condition. We may not be able to protect our intellectual property in countries outside the United States
Intellectual property law outside the United States is uncertain and in many countries is currently undergoing review and revisions. The laws of some countries do not protect our patent and other intellectual property rights to the same extent as United States laws. We currently have pending patent applications in Europe, Australia, Japan, Canada, China, Korea, and Singapore, among others. We are, and Olympus-Cytori, Inc. will be, subject to intensive FDA regulation
As newly developed medical devices, our and Olympus-Cytori’s regenerative cell harvesting, isolation and delivery devices and our bioresorbable implants must receive regulatory clearances or approvals from the FDA and, in many instances, from non-U.S. and state governments, prior to their sale. Our and Olympus-Cytori’s current and future regenerative cell harvesting, isolation and delivery devices and bioresorbable implants are subject to stringent government regulation in the United States by the FDA under the Federal Food, Drug and Cosmetic Act. The FDA regulates the design/development process, clinical testing, manufacture, safety, labeling, sale, distribution and promotion of medical devices and drugs. Included among these regulations are pre-market clearance and pre-market approval requirements, design control requirements, and the Quality System Regulations / Good Manufacturing Practices. Other statutory and regulatory requirements govern, among other things, establishment registration and inspection, medical device listing, prohibitions against misbranding and adulteration, labeling and post market reporting.
The regulatory process can be lengthy, expensive and uncertain. Before any new medical device may be introduced to the United States
market, the manufacturer generally must obtain FDA clearance or approval through either the 510(k) pre-market notification process or the lengthier pre-market approval application “PMA” process. It generally takes from three to 12 months from submission to obtain 510(k) pre-market clearance, although it may take longer. Approval of a PMA could take four or more years from the time the process is initiated. The 510(k) and PMA processes can be expensive, uncertain and lengthy, and there is no guarantee of ultimate clearance or approval. We expect that some of our future products under development as well as Olympus-Cytori’s will be subject to the lengthier PMA process. Securing FDA clearances and approvals may require the submission of extensive clinical data and supporting information to the FDA, and there can be no guarantee of ultimate clearance or approval. Failure to comply with applicable requirements can result in application integrity proceedings, fines, recalls or seizures of products, injunctions, civil penalties, total or partial suspensions of production, withdrawals of existing product approvals or clearances, refusals to approve or clear new applications or notifications and criminal prosecution.
Medical devices are also subject to post-market reporting requirements for deaths or serious injuries when the device may have caused or
contributed to the death or serious injury, and for certain device malfunctions that would be likely to cause or contribute to a death or serious injury if the malfunction were to recur. If safety or effectiveness problems occur after the product reaches the market, the FDA may take steps to prevent or limit further marketing of the product. Additionally, the FDA actively enforces regulations prohibiting marketing and promotion of devices for indications or uses that have not been cleared or approved by the FDA.
Our current medical implants are at different stages of FDA review. We currently have 510(k) clearances for a wide variety of
bioresorbable surgical implant products and we are constantly engaged in the process of obtaining additional clearances for new and existing products. There can be no guarantee that we will be able to obtain the necessary 510(k) clearances or PMA approvals to market and manufacture our other products in the United States for their intended use on a timely basis, if at all. Delays in receipt of or failure to receive such clearances or approvals, the loss of previously received clearances or approvals, or failure to comply with existing or future regulatory requirements could have a substantial negative effect on the results of our operations and financial condition.
Table of Contents
-18-
To sell in international markets, we will be subject to intensive regulation in foreign countries
In cooperation with our distribution partners, we intend to market our current and future products both domestically and in many foreign markets. A number of risks are inherent in international transactions. In order for us to market our products in Europe, Canada, Japan and certain other non-U.S. jurisdictions, we need to obtain and maintain required regulatory approvals or clearances and must comply with extensive regulations regarding safety, manufacturing processes and quality. For example, we still have not obtained regulatory approval for our Thin Film products in Japan. These regulations, including the requirements for approvals or clearances to market, may differ from the FDA regulatory scheme. International sales also may be limited or disrupted by political instability, price controls, trade restrictions and changes in tariffs. Additionally, fluctuations in currency exchange rates may adversely affect demand for our products by increasing the price of our products in the currency of the countries in which the products are sold.
There can be no assurance that we will obtain regulatory approvals or clearances in all of the countries where we intend to market our
products, or that we will not incur significant costs in obtaining or maintaining foreign regulatory approvals or clearances, or that we will be able to successfully commercialize current or future products in various foreign markets. Delays in receipt of approvals or clearances to market our products in foreign countries, failure to receive such approvals or clearances or the future loss of previously received approvals or clearances could have a substantial negative effect on the results of our operations and financial condition. We depend on a few key officers
Our performance is substantially dependent on the performance of our executive officers and other key scientific staff, including Christopher J. Calhoun, our Chief Executive Officer, and Marc Hedrick, MD, our President. We rely upon them for strategic business decisions and guidance. We believe that our future success in developing marketable products and achieving a competitive position will depend in large part upon whether we can attract and retain additional qualified management and scientific personnel. Competition for such personnel is intense, and there can be no assurance that we will be able to continue to attract and retain such personnel. The loss of the services of one or more of our executive officers or key scientific staff or the inability to attract and retain additional personnel and develop expertise as needed could have a substantial negative effect on our results of operations and financial condition. Two executive officers left us in 2006, one in connection with a summer 2006 reduction of our headcount by 18%.
Companies which make personnel cuts sometimes find the resulting loss of experience and lack of coverage can cause important business
problems. We may not have enough product liability insurance
The testing, manufacturing, marketing and sale of our regenerative cell and bioresorbable implant products involve an inherent risk that product liability claims will be asserted against us, our distribution partners or licensees. There can be no guarantee that our clinical trial and commercial product liability insurance is adequate or will continue to be available in sufficient amounts or at an acceptable cost, if at all. A product liability claim, product recall or other claim, as well as any claims for uninsured liabilities or in excess of insured liabilities, could have a substantial negative effect on the results of our operations and financial condition. Also, well-publicized claims could cause our stock to fall sharply, even before the merits of the claims are decided by a court.
Our charter documents contain anti-takeover provisions and we have adopted a Stockholder Rights Plan to prevent hostile takeovers
Our Amended and Restated Certificate of Incorporation and Bylaws contain certain provisions that could prevent or delay the acquisition of the Company by means of a tender offer, proxy contest or otherwise. They could discourage a third party from attempting to acquire control of the Company, even if such events would be beneficial to the interests of our stockholders. Such provisions may have the effect of delaying, deferring or preventing a change of control of the Company and consequently could adversely affect the market price of our shares. Also, in 2003 we adopted a Stockholder Rights Plan, of the kind often referred to as a poison pill. The purpose of the Stockholder Rights Plan is to prevent coercive takeover tactics that may otherwise be utilized in takeover attempts. The existence of such a rights plan may also prevent or delay a change in control of the Company, and this prevention or delay adversely affect the market price of our shares. We pay no dividends
We currently do not intend to pay any cash dividends for the foreseeable future.
Table of Contents
-19-
Item 1B. Unresolved Staff Comments
Not applicable. Item 2. Properties
On May 24, 2005, we entered into a lease for 91,000 square feet located at 3020 and 3030 Callan Road, San Diego, California. We moved the majority of our operations to this new facility during the second half of 2005 and the first quarter of 2006. The agreement bears rent at a rate of $1.15 per square foot, with annual increases of 3%. The lease term is 57 months, commencing on October 1, 2005 and expiring on June 30, 2010.
Our lease on the facility located at 6740 Top Gun Street, San Diego, California was amended and terminated on December 31, 2006. We
will continue to occupy a portion of the building and pay rent to the new lessee until June 30, 2007. We also lease:
On the properties stated above, we pay an aggregate of approximately $140,000 in rent per month.
Item 3. Legal Proceedings
From time to time, we have been involved in routine litigation incidental to the conduct of our business. As of December 31, 2006, we were not a party to any material legal proceeding. Item 4. Submission of Matters to a Vote of Security Holders
None
Table of Contents
• 16,000 additional square feet for research and development activities located at 6749 Top Gun Street, San Diego, California that has been amended to terminate on April 30, 2007.
• 4,027 square feet of office space located at 9-3 Otsuka 2-chome, Bunkyo-ku, Tokyo, Japan. The agreement bears rent at a rate of $3.66 per square foot, expiring on November 30, 2007.
-20-
PART II Item 5. Market for Registrant’s Common Equity Related Stockholder Matters Market Prices
Since our initial public offering in Germany in August 2000, our common stock has been quoted on the Frankfurt Stock Exchange under the symbol “XMPA” (formerly XMP). Until December 19, 2005, the Frankfurt Stock Exchange had served as the primary market for our securities. Effective December 19, 2005, we began trading on the Nasdaq Capital Market under the symbol “CYTX,” and have since transferred to the Nasdaq Global Market effective February 14, 2006. The following table shows the high and low sales prices for our common stock for the periods indicated, as reported by the Frankfurt Stock Exchange and the Nasdaq Stock Market. These prices do not include retail markups, markdowns or commissions. Frankfurt Stock Exchange (XETRA)
Nasdaq Stock Exchange
In preparation for our Nasdaq listing, we changed depository agents from Clearstream Banking AG, Frankfurt, Germany, to the Depository
Trust & Clearing Corporation, U.S (“DTCC”). All of our outstanding shares have been deposited with DTCC since December 9, 2005. Dividends
We have never declared or paid any dividends and do not currently anticipate paying any cash dividends on our outstanding shares of common stock in the foreseeable future. German Securities Laws
As a United States company with securities trading on a German stock exchange, we are subject to various laws and regulations in both jurisdictions. Some of these laws and regulations, in turn, can affect the ability of holders of some of our securities to transfer or sell those securities.
There are no limitations imposed by German law or our certificate of incorporation or bylaws on the right of owners to hold or vote the
Quarter ended December 31, 2005 $ 10.01 $ 7.60 2006
Quarter ended March 31, 2006 $ 9.20 $ 6.65 Quarter ended June 30, 2006 $ 9.16 $ 6.66 Quarter ended September 30, 2006 $ 8.00 $ 4.05 Quarter ended December 31, 2006 $ 7.43 $ 3.87
-21-
Equity Compensation Plan Information
________________________________________
Comparative Stock Performance Graph
The following graph shows how (assuming reinvestment of all dividends) an initial investment of $100 in our common stock would have compared to an equal investment in the Nasdaq Composite Index and the Amex Biotechnology Index during the period from December 31, 2001, through December 31, 2006. The performance shown is not necessarily indicative of future price performance.
Table of Contents
Plan Category
Number of securities to be issued upon exercise of outstanding options, warrants and rights
Weighted-average exercise price of outstanding options, warrants
and rights
Number of securities remaining available for future
issuance under equity compensation plans (excluding securities reflected
in column(a)) (a) (b) (c) Equity
compensation plans approved by security holders
4,409,286 $ 4.22 430,653 Equity
compensation plans not approved by security holders(1)
1,524,743 $ 5.80 2,413,691 Total 5,934,029 $ 4.62 2,844,344
(1) The maximum number of shares shall be cumulatively increased on the first January 1 after the Effective Date, August 24, 2004, and each January 1 thereafter for 9 more years, by a number of shares equal to the lesser of (a) 2% of the number of shares issued and outstanding on the immediately preceding December 31, and (b) a number of shares set by the Board.
-22-
Item 6. Selected Financial Data
The selected data presented below under the captions “Statements of Operations Data,” “Statements of Cash Flows Data” and “Balance Sheet Data” for, and as of the end of, each of the years in the five-year period ended December 31, 2006, are derived from our audited financial statements. The consolidated balance sheets as of December 31, 2006 and 2005, and the related consolidated statements of operations and comprehensive loss, stockholders’ equity (deficit), and cash flows for each of the years in the three-year period ended December 31, 2006, which have been audited by KPMG LLP, an independent registered public accounting firm, and their report thereon, are included elsewhere in this annual report. The consolidated balance sheets as of December 31, 2004, 2003 and 2002, and the related consolidated statements of operations and comprehensive loss, stockholders’ equity (deficit), and cash flows for the years ended December 31, 2003 and 2002, which were also audited by KPMG LLP, are included with our annual reports previously filed.
The information contained in this table should be read in conjunction with “Management’s Discussion and Analysis of Financial Condition
and Results of Operations” and the financial statements and related notes thereto included elsewhere in this report (in thousands except share and per share data):
Table of Contents
2006 2005 2004 2003 2002 Statements of Operations Data: Product revenues: Sales to related party $ 1,451 $ 5,634 $ 4,085 $ 12,893 $ 8,605 Sales to third parties — — 2,237 1,186 561 1,451 5,634 6,322 14,079 9,166 Cost of product revenues 1,634 3,154 3,384 4,244 4,564 Gross profit (loss) (183 ) 2,480 2,938 9,835 4,602 Development revenues: Development 6,057 51 158 9 — Research grants and other 419 320 338 — — 6,476 371 496 9 — Operating expenses: Research and development 21,977 15,450 10,384 8,772 5,816 Sales and marketing 2,055 1,547 2,413 4,487 4,121 General and administrative 12,547 10,208 6,551 5,795 4,894 Change in fair value of option liabilities (4,431 ) 3,645 — — — Restructuring charge — — 107 451 — Equipment impairment charge — — 42 — 370 In-process research and development — — — — 2,296 Total operating expenses 32,148 30,850 19,497 19,505 17,497 Other income (expense): Gain on sale of assets — 5,526 — — — Gain on the sale of assets, related party — — 13,883 — — Interest income 708 299 252 417 1,037 Interest expense (199 ) (137 ) (177 ) (126 ) (241 ) Other income (expense) (27 ) (55 ) 15 87 (22 ) Equity loss in investments (74 ) (4,172 ) — — (882 )
Net loss $ (25,447 ) $ (26,538 ) $ (2,090 ) $ (9,283 ) $ (13,003 )
Basic and diluted net loss per share $ (1.53 ) $ (1.80 ) $ (0.15 ) $ (0.64 ) $ (0.91 )
Basic and diluted weighted average common shares 16,603,550 14,704,281 13,932,390 14,555,047 14,274,254 Statements of Cash Flows Data: Net cash used in operating activities $ (16,483 ) $ (1,101 ) $ (12,574 ) $ (7,245 ) $ (6,886 ) Net cash provided by investing activities 591 911 13,425 5,954 17,265 Net cash provided by (used in) financing activities 16,787 5,357 (831 ) (997 ) (7,971 )
Net increase (decrease) in cash 895 5,167 20 (2,288 ) 2,408
Cash and cash equivalents at beginning of year 8,007 2,840 2,820 5,108 2,700 Cash and cash equivalents at end of year $ 8,902 $ 8,007 $ 2,840 $ 2,820 $ 5,108 Balance Sheet Data: Cash, cash equivalents and short-term investments $ 12,878 $ 15,845 $ 13,419 $ 14,268 $ 24,983 Working capital 7,392 10,459 12,458 12,432 25,283 Total assets 24,868 28,166 25,470 28,089 39,319 Deferred revenues 2,389 2,541 2,592 — — Deferred revenues, related party 23,906 17,311 — — — Option liabilities 900 5,331 — — — Deferred gain on sale of assets — — 5,650 — — Deferred gain on sale of assets, related party — — — 7,539 9,623 Long-term deferred rent 741 573 80 — — Long-term obligations, less current portion 1,159 1,558 1,128 1,157 770 Total stockholders’ equity (deficit) $ (10,813 ) $ (6,229 ) $ 12,833 $ 14,909 $ 25,995
-23-
Item 7. Management’s Discussion and Analysis of Financial Condition and Results of Operations CAUTIONARY STATEMENT REGARDING FORWARD-LOOKING STATEMENTS This report contains certain statements that may be deemed “forward-looking statements” within the meaning of United States securities laws. All statements, other than statements of historical fact, that address activities, events or developments that we intend, expect, project, believe or anticipate will or may occur in the future are forward-looking statements. Such statements are based upon certain assumptions and assessments made by our management in light of their experience and their perception of historical trends, current conditions, expected future developments and other factors they believe to be appropriate. The forward-looking statements included in this report are also subject to a number of material risks and uncertainties, including but not limited to the risks described under the “Risk Factors” section in Part I above. We encourage you to read those descriptions carefully. We caution you not to place undue reliance on the forward-looking statements contained in this report. These statements, like all statements in this report, speak only as of the date of this report (unless an earlier date is indicated) and we undertake no obligation to update or revise the statements except as required by law. Such forward-looking statements are not guarantees of future performance and actual results will likely differ, perhaps materially, from those suggested by such forward-looking statements. Overview Regenerative cell technology
Cytori is developing its Celution™ System, an innovative medical device that removes a patient's own stem and regenerative cells from
their fat tissue so that these cells can be delivered to the same patient in about an hour. The commercialization model will be based on the sale of the system and related single-use therapeutic sets that are tailored to each therapeutic application. We are focused initially on bringing applications to market for reconstructive surgery and cardiovascular disease. Success is dependent on conducting well-designed clinical trials that demonstrate patient benefit and support reimbursement and physician adoption, gaining regulatory clearance for the Celution™ System, and building out our commercialization and manufacturing infrastructure.
The Celution™ System may potentially be applied to other important therapeutic areas, which include gastrointestinal disorders, peripheral
vascular disease, spinal disc repair, and urinary incontinence. For this reason, a significant part of our strategy is to seek commercialization partnerships with medical device or pharmaceutical companies that possess development expertise and have sales forces dedicated to specific therapeutic areas. The goal is to broaden the number of applications for which the Celution™ System may be sold, accelerate the development of applications outside of our core expertise and to bring in capital through partnering agreements that will offset the development of reconstructive surgery and cardiovascular disease applications. Breast Reconstruction
We made significant progress in 2006 toward commercializing the Celution™ System in Europe in early 2008 for reconstructive surgery. Through placement of a Celution™ System in a 19 patient investigator-initiated breast reconstruction clinical study in Japan, we gained substantial knowledge on how to optimize use of the device in a hospital setting and we learned from preliminary observations that adipose stem and regenerative cells are safe in this indication.
In 2007, we will initiate a larger company-sponsored clinical study to evaluate efficacy in breast reconstruction following partial
mastectomy. In parallel, we will build out our manufacturing capabilities and enter into European distribution agreements. Starting in late 2008, we expect that the Olympus-Cytori Joint Venture, described below, will assume device manufacturing, and in that same time frame we expect to announce results from our breast reconstruction trial in Europe and thus anticipate increased product demand.
Currently, there are few if any options available to patients who undergo a partial mastectomy and desire a breast reconstruction. In
Europe, there are 300,000 patients diagnosed with breast cancer each year and an estimated 60% are considered eligible for a partial mastectomy. Approximately 3 million women in Europe already have breast cancer. In the United States, 215,000 are diagnosed each year with breast cancer and 2.2 million are estimated to already have the condition. During 2007, Cytori plans to begin preparing and designing breast reconstruction clinical trials to begin in the United States in 2008.
Table of Contents
-24-
Cardiovascular Disease
Over the past three years, a significant percentage of our research and development has been dedicated to performing several cardiovascular disease pre-clinical studies and analysis to demonstrate safety, efficacy, expand our understanding of mechanisms and distribution in order to optimize delivery techniques. This has resulted in a compilation of extensive pre-clinical data to support the initiation of human clinical trials, which was the highest development priority during 2006.
Based on these results, we started a clinical trial for chronic ischemia in January 2007. It is a 36 patient safety and feasibility study
evaluating adipose stem and regenerative cells as a treatment for chronic ischemia. The patients’ cells are extracted from their adipose tissue using the Celution™ System then injected into the injured oxygen-deprived areas of their hearts through a specially designed catheter. The patients will be evaluated for six months after treatment. The study is being conducted at Gregorio Marañón Hospital in Madrid Spain and led by Drs. Francisco J. Fernández-Avilés and Emerson Perin. Enrollment for this trial remains on track and full results are expected to be reported in the fourth quarter of 2008.
We expect to start a clinical trial in heart attack patients in the second quarter of 2007. This trial will be a 48 patient safety and feasibility study to evaluate adipose stem and regenerative cells as a treatment for heart attacks. The cells are extracted from their adipose tissue using the Celution™ System and injected into their coronary artery. The patients will be evaluated six months after treatment. Full results are expected to be reported in 2008. The study is being conducted at Thoraxcenter, Erasmus Medical Center Hospital in Rotterdam, the Netherlands and led by Dr. Patrick Serruys. Preparations for initiating this trial remain on schedule and results are expected to be reported in the fourth quarter of 2008.
The American Heart Association estimates that in the United States alone, there are approximately 1.2 million heart attacks each year and more than 5.2 million people suffer from a form of chronic heart disease. Given the size of this market and the pre-clinical data demonstrating functional improvement, cardiovascular disease represents a very important application for our Celution™ System and we believe that outcome of the clinical data from these safety and feasibility studies could have a significant impact on our future operations.
Olympus Partnership
On November 4, 2005, we entered into a strategic development and manufacturing joint venture agreement and other related agreements (“JV Agreements”) with Olympus Corporation (“Olympus”). As part of the terms of the JV Agreements, we formed a joint venture, Olympus-Cytori, Inc. (the “Joint Venture”), to develop and manufacture future generation devices based on our Celution™ System.
Under the Joint Venture Agreements:
Put/Calls and Guarantees
The Shareholders’ Agreement between Cytori and Olympus provides that in certain specified circumstances of insolvency or if we
experience a change in control, Olympus will have the rights to (i) repurchase our interests in the Joint Venture at the fair value of such interests or (ii) sell its own interests in the Joint Venture to Cytori at the higher of (a) $22,000,000 or (b) the Put’s fair value.
As of November 4, 2005, the fair value of the Put was determined to be $1,500,000. At December 31, 2006 and 2005, the fair value of the
Put was $900,000 and $1,600,000, respectively. Fluctuations in the Put value are recorded in the statements of operations as a component of Change in fair value of option liabilities. The Put value itself, which is perpetual, has been recorded as a long-term liability on the balance sheet in the caption option liabilities.
Table of Contents
• Olympus paid $30,000,000 for its 50% interest in the Joint Venture. Moreover, Olympus simultaneously entered into a License/Joint Development Agreement with the Joint Venture and us to develop a second generation commercial system and manufacturing capabilities.
• We licensed our device technology, including the Celution™ System and certain related intellectual property, to the Joint Venture for use in future generation devices. These devices will process and purify adult stem and regenerative cells residing in adipose (fat) tissue for various therapeutic clinical applications. In exchange for this license, we received a 50% interest in the Joint Venture, as well as an initial $11,000,000 payment from the Joint Venture; the source of this payment was the $30,000,000 contributed to the Joint Venture by Olympus. Moreover, upon receipt of a CE mark for the first generation Celution™ System in January 2006, we received an additional $11,000,000 development milestone payment from the Joint Venture.
-25-
The following assumptions were employed in estimating the value of the Put:
The Put has no expiration date. Accordingly, we will continue to recognize a liability for the Put and mark it to market each quarter until it
is exercised or until the arrangements with Olympus are amended. The Joint Venture has exclusive access to our technology for the development, manufacture, and supply of the devices (second generation
and beyond) for all therapeutic applications. Once a second generation Celution™ System is developed and approved by regulatory agencies, the Joint Venture would sell such systems exclusively to us at a formula-based transfer price; we have retained marketing rights to the second generation devices for all therapeutic applications of adipose stem and regenerative cells.
In 2006, Cytori worked closely with Olympus’ team of scientists and engineers to design future generations of the Celution™ System that
contain certain product enhancements and that can be manufactured in a streamlined manner. For 2007, the Joint Venture will continue its efforts with the goal of scale-up manufacturing available in late 2008.
Other Related Party Transactions
As part of the formation of the Joint Venture and as discussed above, the Joint Venture agreed to purchase development services from
Olympus. In December 2005, the Joint Venture paid to Olympus $8,000,000 as a payment for those services. The payment has been recognized in its entirety as an expense on the books and records of the Joint Venture as the expenditure represents a payment for research and development services that have no alternative future uses. Our share of this expense has been reflected within the account, equity loss from investment in joint venture, within the consolidated statement of operations.
In a separate agreement entered into on February 23, 2006, we granted Olympus an exclusive right to negotiate commercialization
collaboration for the use of adipose stem and regenerative cells for a specific therapeutic area outside of cardiovascular disease. In exchange for this right, we received a $1.5 million payment from Olympus. As part of this agreement, Olympus will conduct market research and pilot clinical studies in collaboration with us over a 12 to 18 month period for the therapeutic area.
MacroPore Biosurgery Spine and orthopedic products
We manufacture bioresorbable implants used in spine and orthopedic procedures. Medtronic is the sole distributor of our products but due to a substantial decrease in their orders of this product, we experienced negative profit margins for our MacroPore Biosurgery segment for the year ended December 31, 2006 and are actively pursuing a buyer (or buyers) for this line of business.
Thin Film Japan Distribution Agreement
In 2004, we sold the majority of our Thin Film business to MAST. Even after consummation of the 2004 Thin Film asset sale to MAST, we retained all rights to Thin Film business in Japan (subject to a
purchase option of MAST, as described later below), and we received back from MAST a license of all rights to Thin Film technologies in the:
Table of Contents
December 31, 2006
December 31, 2005
November 4, 2005
Expected volatility of Cytori 66.00 % 63.20 % 63.20 % Expected volatility of the Joint Venture 56.60 % 69.10 % 69.10 % Bankruptcy recovery rate for Cytori 21.00 % 21.00 % 21.00 % Bankruptcy threshold for Cytori $ 10,110,000 $ 10,780,000 $ 10,780,000 Probability of a change of control event for Cytori 1.94 % 3.04 % 3.04 % Expected correlation between fair values of Cytori and the Joint Venture in the future 99.00 % 99.00 % 99.00 % Risk free interest rate 4.71 % 4.39 % 4.66 %
• Spinal field, exclusive at least until 2012, and
• Field of regenerative medicine, non-exclusive on a perpetual basis.
-26-
In the third quarter of 2004, we entered into a Distribution Agreement with Senko. Under this agreement, we granted to Senko an exclusive license to sell and distribute certain Thin Film products in Japan. Specifically, the license covers Thin Film products with the following indications:
The Distribution Agreement with Senko commences upon “commercialization.” In simplest terms, commercialization occurs when one or
more Thin Film product registrations are completed with the Japanese Ministry of Health, Labour and Welfare (“MHLW”). Following commercialization, the Distribution Agreement has a duration of five years and is renewable for an additional five years after
reaching mutually agreed minimum purchase guarantees. We received a $1,500,000 upfront license fee from Senko. We have recorded the $1,500,000 received as a component of deferred revenues
in the accompanying balance sheet. Half of the license fee is refundable if the parties agree commercialization is not achievable and a proportional amount is refundable if we terminate the arrangement, other than for material breach by Senko, before three years post-commercialization.
Under the Distribution Agreement, we will also be entitled to earn additional payments from Senko based on achieving defined milestones.
On September 28, 2004, we notified Senko of completion of the initial regulatory application to the MHLW for the Thin Film product. As a result, we became entitled to a nonrefundable payment of $1,250,000, which we received in October 2004 and recorded as a component of deferred revenues. To date we have recognized a total of $361,000 in development revenues ($152,000, $51,000, and $158,000 for the years ended December 31, 2006, 2005, and 2004, respectively).
The previously mentioned 2004 sale agreement granted MAST a “Purchase Right” to acquire, at any time before May 31, 2007, our Thin
Film-related interests and rights for Japan. If MAST chooses to exercise the Purchase Right between now and May 31, 2007, the exercise price of the Purchase Right will be equal to the fair market value of the Japanese business, but in no event will be less than $3,000,000. Moreover, until May 31, 2007, MAST has a right of first refusal to match the terms of any outside offer to buy our Japanese Thin Film business.
Capital Requirements and Liquidity
Research and development for the Celution™ System and clinical applications of adipose-derived stem and regenerative cell therapies has been and will continue to be very costly. We anticipate expanding our research and development expenses to fund clinical trials costs (which we will be initiating for the first time in 2007), pre-clinical research, and general and administrative activities. As a result, we expect to continue incurring losses for the foreseeable future.
Over 94% of our 2006 research and development expenses of $21,977,000 were related to our regenerative cell technology business, and
the majority of those were related to research and development of applications of adipose stem and regenerative cells for cardiovascular disease. We believe our research and development expenses will continue to increase should we advance more products into and through clinical trials and as we prepare for a commercial launch. We plan to fund this anticipated research and development from the following:
As of December 31, 2006, we had cash and cash equivalents and short-term investments on hand of $12,878,000 and an accumulated
deficit of $103,460,000.
Table of Contents
• Anti-adhesion,
• Soft tissue support, and
• Minimization of the attachment of soft tissues throughout the body.
• Existing cash and short-term investments;
• Potential future financings,
• Payments, if any, related to potential Celution™ System commercialization partnerships or stem cell banking licensing agreements
• Payments, if any, related to potential biomaterial product line divestitures; and
• Potential research grants
On February 28, 2007, we completed a registered direct public offering of units consisting of common stock and warrants, which raised approximately $19,700,000 after expenses. On March 29, 2007, we entered into an agreement to sell 1,000,000 shares of common stock at $6.00 per share to Green Hospital Supply, Inc. in a private placement.
-27-
Results of Operations Product revenues
Product revenues relate entirely to our MacroPore Biosurgery segment and include revenues from our spine and orthopedic products, thin film products and CMF products. The following table summarizes the components for the years ended December 31, 2006, 2005 and 2004:
MacroPore Biosurgery:
The future : Our revenue from spine and orthopedic products is dependent upon the market’s adoption of our technology, which is largely
• Spine and orthopedic product revenues represent sales of bioresorbable implants used in spine and orthopedic surgical procedures. For the years ended December 31, 2006 and 2005, these revenues were primarily related to orders for our radiographically identifiable Spine System products, marketed under the name MYSTIQUE™, which Medtronic, our sole distributor of spine and orthopedic products, launched in the third quarter of 2005. However, subsequent to the initial product launch, Medtronic has substantially decreased its orders of this product, and we are concerned about Medtronic’s ongoing level of commitment to this product. As a result of this decrease, we experienced negative profit margins for our MacroPore Biosurgery segment for the year ended December 31, 2006. As a result, we are actively seeking a buyer (or buyers) for this line of business.
Medtronic owned approximately 5.34% of our outstanding common stock as of December 31, 2006 (4.45% after our February 28, 2007 stock issuance).
• Thin Film product revenues in 2004 represent sales of SurgiWrap™ bioresorbable Thin Film. We sold most, but not all, of our intellectual property rights and tangible assets related to our Thin Film product line to MAST Biosurgery in the second quarter of 2004. We were obliged by contract to act as a back-up supplier for these products and to sell them to MAST at our manufacturing costs. However, as MAST assumed the manufacturing process, domestic revenue from Thin Film products ended in 2004. No revenues from the Thin Film product line were recognized during the years ended December 31, 2006 and 2005. We have never received any Thin Film revenues from Japan, because the MHLW has not approved Thin Film for sale in Japan yet.
• The CMF product revenues represent sales of the CMF surgical implants product line used for trauma and reconstructive procedures in the mid-face and craniofacial skeleton (the head and skull). We sold this product line to Medtronic in 2002. As with the Thin Film products, we sold CMF products at cost in 2004 under a contractual back-up supply agreement with Medtronic. A portion of the deferred gain on sale of assets, related party was recognized as revenue in order to reflect the fair value of products sold, based on historical selling prices of similar products, over our manufacturing cost. During the third quarter of 2004, we completed all remaining performance obligations related to the 2002 sale of the CMF product line to Medtronic. Therefore, we did not earn any CMF product revenues during the years ended December 31, 2006 and 2005 and will not generate revenue from this product line in the future.
dependent upon Medtronic’s marketing efforts and pricing strategies. Therefore our visibility of the size and timing of HYDROSORB™ and MYSTIQUE™ orders is limited. Since we rely on Medtronic’s ability and commitment to build and expand the market share for our products and we have been disappointed in the past by their effort at such, it is possible that we will not receive more than minimal orders for the MYSTIQUE™ portion of the HYDROSORB™ product line during 2007. Since it is unlikely that we will see significant sales of the current non-MYSTIQUE™ products any time in the future, it is likely that we will continue to see losses in our Medtronic-dependent MacroPore Biosurgery business going forward. We are trying to scale back MacroPore Biosurgery’s expenses to reflect our modest expectations of future revenues.
All product revenues are currently attributable to Medtronic as domestic Thin Film revenues ceased in 2004. This may change when
commercialization of the Thin Film products in Japan occurs and we begin Thin Film shipments to Senko, which we believe will happen in 2007.
-28-
Cost of product revenues
Cost of product revenues includes material, manufacturing labor, overhead costs and an inventory provision. The following table summarizes the components of our cost of revenues for the years ended December 31, 2006, 2005 and 2004:
MacroPore Biosurgery:
The future. Ceasing to manufacture the CMF product line and the non-Japan bioresorbable Thin Film product line, combined with the poor
rate of orders from Medtronic deprives us of economies of scale and has and will continue to negatively impact our margins. We do not expect demand for our HYDROSORB™ MYSTIQUE™ products, which depends largely on Medtronic’s marketing efforts, to increase in the future.
In an effort to reduce overhead costs related to the MacroPore Biosurgery segment, we have accelerated termination of two of our leases.
As a result, one of our leases will terminate in April 2007 and we will be subletting only a small portion of the other building during the first half of 2007.
As mentioned above, it appears that the spine and orthopedics business is not succeeding under our stewardship. As a result, our Board of
Directors has decided to divest and is actively seeking a buyer (or buyers) for these assets.
Total cost of product revenues as % of Product revenues 112.6 % 56.0 % 53.5 %
• Our product revenues are currently generated only through sales of bioresorbable products and therefore, cost of revenues is related only to our MacroPore Biosurgery segment.
• The change in cost of revenues for the year ended December 31, 2006 as compared to the same period in 2005 as well as between 2005 and 2004 were due primarily to amounts of fixed labor and overhead costs applied to product revenues in each period. As MacroPore revenues have declined, gross margins have been negatively affected by fixed costs.
• In response to MacroPore Biosurgery’s declining revenues, we are seeking to reduce expenses. We reduced our headcount by 29 people in the third quarter of 2006. A portion of the affected personnel related to the MacroPore Biosurgery segment. �
• Cost of product revenues includes approximately $74,000, $0 and $3,000 of stock-based compensation expense for the years ended December 31, 2006, 2005 and 2004, respectively. For further details, see stock-based compensation discussion below.
• During the years ended December 31, 2006, 2005, and 2004, we recorded a provision of $88,000, $280,000, and $242,000, respectively, related primarily to excess and slow-moving inventory. In 2006 and 2005, this inventory was produced in anticipation of stocking orders from Medtronic which did not materialize.
• The $242,000 inventory provision during 2004 related to excess inventory produced in consideration of our responsibility to be a back-up supplier for the CMF product line. We sold the assets related to this product line to a subsidiary of Medtronic in September 2002. In April of 2004, Medtronic indicated that it would no longer purchase CMF inventory from us under the back-up supply arrangement, leading to our determination that the remaining CMF inventory on hand would not be recoverable.
-29-
Development revenues
The following table summarizes the components of our development revenues for the years ended December 31, 2006, 2005, and 2004:
Regenerative cell technology:
Our policy is to recognize revenues under the NIH grant arrangement as the lesser of (i) qualifying costs incurred (and not previously recognized), plus our allowable grant fees for which we are entitled to funding or (ii) the amount determined by comparing the outputs generated to date versus the total outputs expected to be achieved under the research arrangement. During the year ended December 31, 2006, we incurred $479,000 in expenditures, of which $310,000 were qualified. We recorded a total of $310,000 in revenues for the year ended December 31, 2006, which included allowable grant fees as well as cost reimbursements. During the year ended December 31, 2005, we incurred $306,000 in qualifying expenditures. During the year ended December 31, 2004, we incurred $339,000 of costs, of which only $328,000 were qualified expenditures. We recorded a total of $312,000 and $328,000 in revenues for the years ended December 31, 2005 and 2004, respectively, which include allowable grant fees as well as cost reimbursements.
MacroPore Biosurgery (Thin Film):
Under a Distribution Agreement with Senko we are entitled to earn payments based on achieving the following defined milestones:
Total development revenues $ 6,476,000 $ 371,000 $ 496,000 $ 6,105,000 $ (125,000 ) 1,645.6 % (25.2 )%
• We recognize deferred revenues, related party, as development revenue when certain performance obligations are met (i.e., using a proportional performance approach). During the year ended December 31, 2006, we recognized $5,905,000 of revenue associated with our arrangements with Olympus. The revenue recognized in 2006 was a result of completing a pre-clinical study in the first quarter of 2006, receiving a CE mark for the first generation Celution™ System, and reaching three additional milestones in the fourth quarter of 2006. One milestone related to the completion of a pre-clinical study while the other two were results of product development efforts. There was no similar revenue in 2005.
• The research grant revenue relates to our agreement with the National Institutes of Health (“NIH”). Under this arrangement, the NIH reimburses us for “qualifying expenditures” related to research on Adipose-Derived Cell Therapy for Myocardial Infarction. To receive funds under the grant arrangement, we are required to (i) demonstrate that we incurred “qualifying expenses,” as defined in the grant agreement between the NIH and us, (ii) maintain a system of controls, whereby we can accurately track and report all expenditures related solely to research on Adipose-Derived Cell Therapy for Myocardial Infarction, and (iii) file appropriate forms and follow appropriate protocols established by the NIH.
• Upon notifying Senko of completion of the initial regulatory application to the MHLW for the Thin Film product, we were entitled to a nonrefundable payment of $1,250,000. We so notified Senko on September 28, 2004, received payment in October of 2004, and recorded deferred revenues of $1,250,000. As of December 31, 2006, of the amount deferred, we have recognized development revenues of $361,000 ($152,000 in 2006, $51,000 in 2005, and $158,000 in 2004).
The future : We expect to recognize revenues from our regenerative cell technology segment during 2007 as we complete certain pre-
clinical studies and certain phases of our product development performance obligations. If we are successful in achieving certain milestone points related to these activities, we will recognize approximately $2,500,000 in revenues in 2007. The exact timing of when amounts will be reported in revenue will depend on internal factors (for instance, our ability to complete the service obligations we have agreed to perform) as well as external considerations, including obtaining the necessary regulatory approvals for various therapeutic applications related to the Celution™ System. The cash for these performance obligations was received when the agreement was signed and no further related cash payments will be made to us.
We will continue to recognize revenue from the development work we are performing on behalf of Senko, based on the relative fair value
of the milestones completed as compared to the total efforts expected to be necessary to obtain regulatory clearance with the MHLW. Obtaining regulatory clearance with the MHLW for initial commercialization is expected in 2007. Accordingly, we expect to recognize approximately $1,139,000 (consisting of $889,000 in deferred revenues plus a non-refundable payment of $250,000 to be received upon commercialization) in revenues associated with this milestone arrangement in 2007. Moreover, we expect to recognize $500,000 per year associated with deferred Senko license fees over a three-year period following commercialization as the refund rights associated with the license payment expire.
• We are also entitled to a nonrefundable payment of $250,000 once we achieve commercialization.
• Finally, under this agreement, we also received a $1,500,000 license fee that was recorded as a component of deferred revenues in the accompanying balance sheet. Because the $1,500,000 in license fees is potentially refundable, such amounts will not be recognized as revenues until the refund rights expire. Specifically, half of the license fee is refundable if the parties agree commercialization is not achievable and a proportional amount is refundable if we terminate the arrangement, other than for material breach by Senko, before three years post-commercialization.
-30-
Research and development expenses
Research and development expenses include costs associated with the design, development, testing and enhancement of our products, regulatory fees, the purchase of laboratory supplies, pre-clinical studies, and in 2006, clinical studies. The following table summarizes the components of our research and development expenses for the years ended December 31, 2006, 2005 and 2004:
Total research and development expenses $ 21,977,000 $ 15,450,000 $ 10,384,000 $ 6,527,000 $ 5,066,000 42.2 % 48.8 %
• Regenerative cell technology expenses relate to the development of a technology platform that involves using adipose (fat) tissue as a source for autologous regenerative cells for therapeutic applications. These expenses, in conjunction with our continued development efforts related to our Celution™ System, result primarily from the broad expansion of our research and development efforts enabled by the funding we received from Olympus in 2005 and 2006. Labor-related expenses increased by $2,315,000 for the year ended December 31, 2006 as compared to the same period in 2005. This increase does not include the $948,000 increase in stock-based compensation for the year ended December 31, 2006 as compared to 2005. Professional services expense, which includes pre-clinical and clinical study costs, increased by $1,772,000 for the year ended December 31, 2006 as compared to the same period in 2005. Rent and utilities expense increased by $767,000 from 2005 to 2006 as a result of the addition of our new facility. Production and other supplies increased by $689,000 during the year ended December 31, 2006 as compared to 2005. Other notable increases included repairs and maintenance of $486,000 and depreciation expense increases of $581,000, for the year ended December 31, 2006, respectively, as compared to the same period in 2005. The remaining increase of $193,000 related to miscellaneous charges, such as regulatory costs.
The increase in regenerative cell technology expenses from 2004 to 2005 was due primarily to the hiring of additional researchers, engineers, and support staff. It was also a result of increased costs for pre-clinical studies conducted in 2005 as compared with 2004 as well as increased rent and utility expense due to the addition of our new facility during the latter half of 2005.
• Expenditures related to the Joint Venture with Olympus, which are included in the variation analysis above, include costs that are necessary to support the commercialization of future generation devices based on our Celution™ System. These development activities, which began in November 2005, include performing pre-clinical and clinical studies, seeking regulatory approval, and performing product development related to therapeutic applications for adipose stem and regenerative cells for multiple large markets. For the years ended December 31, 2006 and 2005, costs associated with the development of the device were $7,286,000 and $1,136,000, respectively. These expenses were composed of $3,663,000 and $565,000 in labor and related benefits, $2,405,000 and $571,000 in consulting and other professional services, $872,000 and $0 in supplies and $346,000 and $0 in other miscellaneous expense, respectively. There were no comparable expenditures in 2004.
• In 2004, we entered into an agreement with the NIH to reimburse us for up to $950,000 (Phase I $100,000 and Phase II $850,000) in “qualifying expenditures” related to research on Adipose-Derived Cell Therapy for Myocardial Infarction. For the years ended December 31, 2006, 2005, and 2004, we incurred $479,000, $306,000 and $339,000, respectively, of direct expenses relating entirely to Phase I and II. Of these expenses, $169,000 and $11,000 were not reimbursed in 2006 and 2004, respectively. To date, we have incurred $1,125,000 of direct expenses ($180,000 of which were not reimbursed) relating to both Phases I and II of the agreement. Our work under the NIH agreement was completed during 2006. �
• Stock-based compensation for the regenerative cell technology segment of research and development was $1,015,000 and $67,000 for the years ended December 31, 2006 and 2005. There was no similar expenditure in 2004. See stock-based compensation discussion below for more details.
-31-
MacroPore Biosurgery:
The future : Our strategy is to continue to increase our research and development efforts in the regenerative cell field and we anticipate
expenditures in this area of research to total approximately $22,000,000 to $24,000,000 in 2007. We are researching therapies for cardiovascular disease, new approaches for aesthetic and reconstructive surgery, gastrointestinal disorders and spine and orthopedic conditions. The expenditures have and will continue to primarily relate to developing therapeutic applications and conducting pre-clinical and clinical studies on adipose-derived stem and regenerative cells.
We continue to reduce research and development expenditures in the bioresorbable technology platform. We anticipate minimal further
expenditures in this area of research in 2007. We are currently seeking a buyer (or buyers) for this segment of our business.
Table of Contents
• Our bioresorbable surgical implants platform technology is used for development of spine and orthopedic products and Thin Film products. The decrease in research and development costs associated with bioresorbable implants for the year ended December 31, 2006 as compared with the same period in 2005 and 2004 was due primarily to our ongoing strategy of reallocating resources toward our regenerative cell technology segment. Labor and related benefits expense, including stock-based compensation, decreased by $778,000 for the year ended December 31, 2006 as compared to 2005. In July 2006, we laid off 29 employees, a portion of which related to the MacroPore Biosurgery business. Other notable decreases from 2005 to 2006 were caused by decreases in travel and entertainment, professional services, and depreciation expense.
Notable decreases from 2004 to 2005 were caused by decreases in labor and related benefit expense, as well as decreases in professional service expense and pre-clinical expense.
• Under a Distribution Agreement with Senko we are responsible for the completion of the initial regulatory application to the MHLW and commercialization of the Thin Film product line in Japan. Commercialization occurs when one or more Thin Film product registrations are completed with the MHLW. During the years ended December 31, 2006, 2005 and 2004, we incurred $178,000, $129,000 and $170,000, respectively, of expenses related to this regulatory and registration process.
• Stock-based compensation for the MacroPore Biosurgery segment of research and development for the years ended December 31, 2006, 2005, and 2004 was $25,000, $112,000 and $32,000, respectively. See stock-based compensation discussion below for more details.
-32-
Sales and marketing expenses
Sales and marketing expenses include costs of marketing personnel, tradeshows, and promotional activities and materials. Medtronic is responsible for the distribution, marketing and sales support of our spine and orthopedic devices. Our bioresorbable Thin Film product line (before the sale of the non-Japan Thin Film business to MAST in May 2004) was distributed domestically through a dedicated sales force, independent sales representatives and internationally through independent distributors. The following table summarizes the components of our sales and marketing expenses for the years ended December 31, 2006, 2005 and 2004:
Total sales and marketing $ 2,055,000 $ 1,547,000 $ 2,413,000 $ 508,000 $ (866,000 ) 32.8 % (35.9 )%
• International sales and marketing expenditures for the years ended December 31, 2006 and 2005 relate primarily to salaries expense for employees involved in business development. The main emphasis of these newly-formed functions is to seek strategic alliances and/or co-development partners for our regenerative cell technology, which we began to focus on in the third quarter of 2005. There were no similar expenses in 2004.
• Stock-based compensation for the regenerative cell segment of sales and marketing for the year ended December 31, 2006 was $517,000. There was no similar expense in 2005 or 2004. See stock-based compensation discussion below for more details.
• General corporate marketing expenditures relate to expenditures for maintaining our corporate image and reputation within the research and surgical communities. The decrease from the year ended December 31, 2006 as compared to 2005 was due to a strategic decision to allocate resources towards our regenerative cell technology marketing, which in turn prompted a reduction in headcount in biomaterials and general corporate marketing. The decrease in 2005 as compared to 2004 was due to one-time costs incurred for an educational program we created in 2004 to inform end-users and distributors of the benefits and surgical applications for our biomaterials products.
• Domestic sales and marketing expenditures related to expenses associated with managing our domestic bioresorbable Thin Film product distribution, which included independent sales representatives and our domestic Thin Film sales consultants and marketing staff. The elimination of such expenses in 2005 was due to the transfer of our sales force and marketing staff to MAST upon the sale of the Thin Film product line to MAST in May 2004.
• International sales and marketing expenditures relate to costs associated with developing an international bioresorbable Thin Film distributor and supporting a bioresorbable Thin Film sales office in Japan. The decreased spending in 2006 and 2005 as compared to 2004 relates to a significant headcount decrease in this marketing group as MHLW approval for commercialization has been
The future . We expect sales and marketing expenditures related to the regenerative cell technology to increase as we continue to expand
our pursuit of strategic alliances and co-development partners, as well as market our Celution™ System expected to be commercialized in 2008.
delayed from our original expectation.
• Stock-based compensation for the MacroPore Biosurgery segment of sales and marketing for the years ended December 31, 2006, 2005 and 2004 was $9,000, $113,000 and $22,000, respectively. See stock-based compensation discussion below for more details.
-33-
General and administrative expenses
General and administrative expenses include costs for administrative personnel, legal and other professional expenses and general corporate expenses. The following table summarizes the general and administrative expenses for the years ended December 31, 2006, 2005 and 2004:
The future . We expect general and administrative expenses of approximately $9,000,000 to $11,000,000 in 2007. We are seeking ways to
minimize the ratio of these expenses to research and development expenses. As a result, we have begun efforts to restrain general and administrative expense.
We have incurred, and expect to continue to incur, substantial legal expenses in connection with the University of Pittsburgh’s 2004
lawsuit. Although we are not litigants and are not responsible for any settlement costs, if the University of Pittsburgh wins the lawsuit our license rights to the patent in question could be nullified or rendered non-exclusive and our regenerative cell strategy could be affected. The amended UC license agreement signed in the third quarter of 2006 clarified that we are responsible for all patent prosecution and litigation costs related to this lawsuit.
Table of Contents
Years ended $ Differences % Differences
2006 2005 2004 2006 to 2005
2005 to 2004
2006 to 2005
2005 to 2004
General and administrative $ 10,967,000 $ 10,096,000 $ 6,480,000 $ 871,000 $ 3,616,000 8.6 % 55.8 %
Total general and administrative expenses $ 12,547,000 $ 10,208,000 $ 6,551,000 $ 2,339,000 $ 3,657,000 22.9 % 55.8 %
• General and administrative expense, for the year ended December 31, 2006 as compared to the same period in 2005 increased by $2,339,000. This was a result of increased stock-based compensation of $1,468,000 as well as increases in other salary and related benefit expense of $677,000. Professional services for the year ended December 31, 2006 as compared with 2005 increased by $935,000, which includes an increase of $777,000 in legal expenses partly incurred in connection with the University of Pittsburgh’s lawsuit challenging the inventorship of our licensor’s U.S. patent relating to adult stem cells isolated from adipose tissue. Also contributing $487,000 to the lincrease in legal expense was the issuance of 100,000 shares of stock to the Regents of the University of California ("UC") at a stock price of $4.87 per share. This was a result of an amended technology license agreement that was finalized in the third quarter of 2006.
Salary and related benefit expense increased by $981,000 during the year ended December 31, 2005, with respect to the same period in 2004. This increase was primarily caused by the addition of seven managerial employees. Legal expenses also increased for the year ended December 31, 2005 as compared to the same period in 2004 primarily in connection with the lawsuit mentioned above. Other notable expenditures were additional professional services costs and higher travel expenditures.
• In the second and fourth quarters of 2006, we recorded an additional $118,000 and $103,000 of depreciation expense to accelerate the estimated remaining lives for certain assets determined to be no longer in use. The second quarter assets related to furniture and fixtures no longer in use due to our recent relocation as well as outdated computer software and related equipment. The assets related to both our regenerative cell technology and MacroPore Biosurgery operating segments. We recorded the charge as an increase to general and administrative expenses. The fourth quarter assets related to leasehold improvements that had a shortened useful life due to the termination of one of our leases. The charge was allocated to each department based on square footage occupied at this terminated location.
• Stock-based compensation related to general and administrative expense for the years ended December 31, 2006, 2005 and 2004 was $1,580,000, $112,000 and $71,000, respectively. See stock-based compensation discussion below for more details.
-34-
Stock-based compensation expenses
As noted previously, we adopted SFAS 123R on January 1, 2006. Prior period figures have not been restated and therefore are not comparable to the current year presentation.
Stock-based compensation expenses include charges related to options issued to employees, directors and non-employees. Prior to January
1, 2006, the stock-based compensation expenditures connected to options granted to employees and directors (in their capacity as board members) is the difference between the exercise price of the stock based awards and the market value of our underlying common stock on the date of the grant. Unearned employee stock-based compensation is amortized over the remaining vesting periods of the options, which generally vest over a four-year period from the date of grant. From January 1, 2006 onwards, we adopted FASB No. 123 (revised 2004), “Share-based payments.” Under this pronouncement, we measure stock-based compensation expense based on the grant-date fair value of any awards granted to our employees. Such expense is recognized over the period of time that employees provide service to us and earn all rights to the awards.
Stock-based compensation expense related to common stock issued to non-employees is the fair value of the stock on the date of issuance,
even if such stock contains sales restrictions. The following table summarizes the components of our stock-based compensation for the years ended December 31, 2006, 2005 and 2004:
Regenerative cell technology:
General and Administrative:
Table of Contents
Years ended $ Differences % Differences
2006 2005 2004 2006 to 2005
2005 to 2004
2006 to 2005
2005 to 2004
Regenerative cell technology : Research and development related $ 1,015,000 $ 67,000 $ — $ 948,000 $ 67,000 1,414.9 % — Sales and marketing related 517,000 — — 517,000 — — — Total regenerative cell technology 1,532,000 67,000 — 1,465,000 67,000 2,186.6 % — MacroPore Biosurgery : Cost of product revenues 74,000 — 3,000 74,000 (3,000 ) — — Research and development related 25,000 112,000 32,000 (87,000 ) 80,000 (77.7 )% 250.0 % Sales and marketing related 9,000 113,000 22,000 (104,000 ) 91,000 (92.0 )% 413.6 %
• In the first quarter of 2006, we issued 2,500 shares of restricted common stock to a non-employee scientific advisor. Similarly, in the second quarter of 2005, we issued 20,000 shares of restricted common stock to a non-employee scientific advisor. The stock is restricted in that it cannot be sold for a specified period of time. There are no vesting requirements. Because the shares issued are not subject to additional future vesting or service requirements, the stock-based compensation expense of $18,000 recorded in the first quarter of 2006 (and $63,000 recorded in the second quarter of 2005) constitutes the entire expense related to these grants, and no future period charges will be reported. The scientific advisors also receive cash consideration as services are performed.
• Of the $3,220,000 charge to stock-based compensation for the year ended December 31, 2006, $567,000 related to extensions and cancellations of awards previously granted to (a) our former Senior Vice President of Finance and Administration, who retired in May 2006, and (b) (i) our former Senior Vice President, Business Development, (ii) our former Vice President, Marketing and Development, and (iii) the position of a less senior employee, whose positions were eliminated during 2006. The charge reflects the incremental fair value of the extended vested stock options over the fair value of the original awards at the modification date as well as the acceleration of unrecognized compensation cost associated with cancelled option awards that would have been recognized if the four individuals continued to vest in their options until the end of their employment term. There will be no further charges related to these modifications.
The future . We will continue to grant options (which will result in an expense) to our employees and, as appropriate, to non-employee
service providers. In addition, previously-granted options will continue to vest in accordance with their original terms. As of December 31, 2006, the total compensation cost related to non-vested stock options not yet recognized for all our plans is approximately $4,123,000. These costs are expected to be recognized over a weighted average period of 1.86 years.
• In August 2005, our Chief Operating Officer (“COO”), ceased employment with us. We agreed to pay the former COO a lump sum cash severance payment of $155,164 and extended the exercise period for two years on 253,743 vested stock options. The incremental value of the options due to the modification was $337,000. We recorded an expense in the third quarter of 2005 to reflect the lump sum cash severance payment and the value of the vested stock options, which constitutes the entire expense related to these options, and no future period charges will be required. This $337,000 was allocated in the table above in equal portions among three departmental categories, consistent with previous allocations of the former COO’s compensation expense.
-35-
Change in fair value of option liabilities
The following is a table summarizing the change in fair value of option liabilities for the years ended December 31, 2006, 2005 and 2004:
The following assumptions were employed in estimating the value of the Put:
The future . The Put has no expiration date. Accordingly, we will continue to recognize a liability for the Put until it is exercised or until
the arrangements with Olympus are amended.
Table of Contents
Years ended $ Differences % Differences
2006 2005 2004 2006 to 2005
2005 to 2004
2006 to 2005
2005 to 2004
Change in fair value of option liability $ (3,731,000 ) $ 3,545,000 $ — $ (7,276,000 ) $ 3,545,000 (205.2 )% — Change in fair value of put option liability (700,000 ) 100,000 — (800,000 ) 100,000 (800.0 )% — Total change in fair value of option liabilities $ (4,431,000 ) $ 3,645,000 $ — $ (8,076,000 ) $ 3,645,000 (221.6 )% —
• We granted Olympus an option to acquire 2,200,000 shares of our common stock which expired December 31, 2006. The exercise price of the option shares was $10 per share. We had accounted for this grant as a liability because had the option been exercised, we would have been required to deliver listed shares of our common stock to settle the option shares. In accordance with EITF 00-19, “Accounting for Derivative Financial Instruments Indexed to, and Potentially Settled in, a Company’s Own Stock,” the fair value of this option was re-measured at the end of each quarter, using the Black-Scholes option pricing model, with the movement in fair value reported in the statement of operations as a change in fair value of option liabilities.
• In reference to the Joint Venture, the Shareholders’ Agreement between Cytori and Olympus provides that in certain specified circumstances of insolvency or if we experience a change in control, Olympus will have the rights to (i) repurchase our interests in the Joint Venture at the fair value of such interests or (ii) sell its own interests in the Joint Venture to us at the higher of (a) $22,000,000 or (b) the Put’s fair value. The Put value has been classified as a liability.
The valuations of the Put were completed by an independent valuation firm using an option pricing theory based simulation analysis (i.e., a Monte Carlo simulation). The valuations are based on assumptions as of the valuation date with regard to the market value of Cytori and the estimated fair value of the Joint Venture, the expected correlation between the values of Cytori and the Joint Venture, the expected volatility of Cytori and the Joint Venture, the bankruptcy recovery rate for Cytori, the bankruptcy threshold for Cytori, the probability of a change of control event for Cytori, and the risk free interest rate.
December 31, 2006
December 31, 2005
November 4, 2005
Expected volatility of Cytori 66.00 % 63.20 % 63.20 % Expected volatility of the Joint Venture 56.60 % 69.10 % 69.10 % Bankruptcy recovery rate for Cytori 21.00 % 21.00 % 21.00 % Bankruptcy threshold for Cytori $ 10,110,000 $ 10,780,000 $ 10,780,000 Probability of a change of control event for Cytori 1.94 % 3.04 % 3.04 % Expected correlation between fair values of Cytori and the Joint Venture in the future 99.00 % 99.00 % 99.00 % Risk free interest rate 4.71 % 4.39 % 4.66 %
-36-
Restructuring charges
The following table summarizes the restructuring charges for the years ended December 31, 2006, 2005 and 2004:
A restructuring charge of $107,000 was recorded in 2004 as a result of a negotiated settlement related to our remaining lease obligation for
the property in Germany. The future . It is possible that we may incur a restructuring charge related to our remaining lease obligation at our Top Gun facility;
however, at this time this facility is still in use. We will continue analysis of this contingency each quarter. Equipment impairment charges
The following table summarizes the components of equipment impairment charges for the years ended December 31, 2006, 2005, and 2004:
During the fourth quarter of 2004, as a result of our normal periodic fixed asset review, we determined that certain biomaterials production
assets were impaired. We recorded an impairment charge that represented the excess of the net book value over the estimated fair value of the assets; as the production assets were held for sale, fair value was based on the estimated net proceeds we expect to receive upon the sale of these assets, net of selling costs. Other income (expense)
The following table summarizes the gain on sale of assets for the years ended December 31, 2006, 2005 and 2004:
Table of Contents
Years ended $ Differences % Differences 2006 2005 2004 2006 to 2005 2005 to 2004 2006 to 2005 2005 to 2004 Restructuring charge $ — $ — $ 107,000 $ — $ (107,000 ) — —%
Years ended $ Differences % Differences 2006 2005 2004 2006 to 2005 2005 to 2004 2006 to 2005 2005 to 2004 Equipment impairment charge $ — $ — $ 42,000 $ $ (42,000 ) — —
Years ended $ Differences % Differences
2006 2005 2004 2006 to 2005
2005 to 2004
2006 to 2005
2005 to 2004
Gain on the sale of assets $ — $ 5,526,000 $ — $ (5,526,000 ) $ 5,526,000 — — Gain on the sale of assets, related party — — 13,883,000 — (13,883,000 ) — — Total $ — $ 5,526,000 $ 13,883,000 $ (5,526,000 ) $ (8,357,000 ) — (60.2 )%
• The $5,526,000 gain on sale of assets recorded in the third quarter of 2005 was related to the sale of the majority of our Thin Film product line in May 2004 to MAST. As part of the disposal arrangement, we agreed to complete certain performance obligations which prevented us from recognizing the gain on sale of assets when the cash was initially received. In August 2005, following the settlement of arbitration proceedings related to the sale agreement, we were able to recognize the gain on sale of assets of $5,650,000, less $124,000 of related deferred costs, in the statement of operations.
• The gain on sale of assets, related party related to the initial payment as well as milestone payments from Medtronic for the disposition of our CMF product line in 2002. Specifically, as part of the disposal arrangement, we agreed to complete clinical research regarding Faster Resorbable Polymer, an area that directly relates to the CMF product line we transferred to Medtronic. In January 2004, we received the $5,000,000 payment after fulfilling the research requirements set out in the CMF sale agreement. We were also obliged to transfer certain “know-how,” including manufacturing processes, patents, and other intellectual property, to Medtronic. This obligation was fulfilled and in the third quarter of 2004 we received $1,500,000 from
The future . No additional gains will be recognized related to either sale.
Medtronic. These milestones represented the last of all remaining performance obligations and therefore, we were able to recognize the remaining deferred gain on the sale of assets, related party, of $7,383,000, in the statement of operations.
-37-
Financing items
The following table summarizes interest income, interest expense, and other income and expenses for the years ended December 31, 2006, 2005, and 2004:
The future . Interest income earned in 2007 will be dependent on our levels of funds available for investment as well as general economic
conditions. We expect interest expense to increase slightly in 2007 due to the addition of the newest promissory note. Equity loss from investment in Joint Venture
The following table summarizes equity loss from investment in joint venture for the years ended December 31, 2006, 2005, and 2004:
The loss in 2006 relates entirely to our 50% equity interest in the Joint Venture, which we account for using the equity method of
accounting. The 2005 loss related to the payment of a portion of the original capital which Olympus invested in the Joint Venture back to Olympus, in exchange for a development services agreement.
The future . We do not expect to recognize significant losses from the activities of the Joint Venture in the foreseeable future. Over the next two to three years, the Joint Venture is expected to incur modest general and administrative expenses, offset by royalty income expected to begin in 2008 when Cytori commercializes its Celution™ System in Europe. Though we have no obligation to do so, we and Olympus plan to jointly fund the Joint Venture to cover any costs should the Joint Venture deplete its cash balance.
• Interest income increased in 2006 as compared to 2005 due to a larger balance of funds available for investment, which was a result of the transactions with Olympus, as well as the sale of common stock in the third quarter of 2006. Interest income also increased from 2004 to 2005 due to a larger balance of funds available for investment as well as higher returns on investments.
• Interest expense increased in 2006 as compared to 2005 due to higher principal balances on our long-term equipment-financed borrowings. In late 2005, we executed an additional promissory note, with approximately $1,380,000 in principal. Our newest promissory note, with approximately $600,000 in principal, was executed in December 2006.
• The changes in other income (expense) in 2006, 2005 and 2004 resulted primarily from changes in foreign currency exchange rates.
Years ended $ Differences % Differences
2006 2005 2004 2006 to 2005
2005 to 2004
2006 to 2005
2005 to 2004
Equity loss from investment in joint venture $ 74,000 $ 4,172,000 $ — $ (4,098,000 ) $ 4,172,000 (98.2 )% —
-38-
Liquidity and Capital Resources
Short-term and long-term liquidity The following is a summary of our key liquidity measures at December 31, 2006, 2005, and 2004:
In order to provide greater financial flexibility and liquidity, and in view of the substantial cash needs of our regenerative cell business
during its development stage, we have an ongoing need to raise additional capital (notwithstanding the proceeds received from the Olympus collaboration agreements, which were entered into in November 2005). In the third quarter of 2006, we received net proceeds of $16,200,000 from the sale of common stock pursuant to a shelf registration statement, of which Olympus purchased $11,000,000; the remaining shares were purchased by other institutional investors. Additionally, in the first quarter of 2007, we received net proceeds of $19,700,000 from the sale of units consisting of 3,746,000 shares of common stock and 1,873,000 common stock warrants (with an exercise price of $6.25 per share) under the shelf registration statement. Also, near the end of the first quarter of 2007, we entered into an agreement to sell 1,000,000 shares of common stock to Green Hospital Supply, Inc. in a private placement. We expect this sale to close early in the second quarter of 2007.
We also implemented certain cost containment measures and are actively seeking a buyer (or buyers) for our spine and orthopedics
business. With consideration of these endeavors as well as existing funds, cash generated by operations, and other accessible sources of financing, we believe our cash position is adequate to satisfy our working capital, capital expenditures, debt service and other financial commitments at least through December 31, 2007.
From inception to December 31, 2006, we have financed our operations primarily by:
Table of Contents
Years ended $ Differences % Differences
2006 2005 2004 2006 to 2005
2005 to 2004
2006 to 2005
2005 to 2004
Cash and cash equivalents $ 8,902,000 $ 8,007,000 $ 2,840,000 $ 895,000 $ 5,167,000 11.2 181.9 % Short-term investments, available for sale 3,976,000 7,838,000 10,579,000 (3,862,000 ) (2,741,000 ) (49.3 )% (25.9 )%
Total cash and cash equivalents and short-term investments, available for sale $ 12,878,000 $ 15,845,000 $ 13,419,000 $ (2,967,000 ) $ 2,426,000 (18.7 )% 18.1 %
• Issuing our stock in pre-IPO transactions, in our 2000 initial public offering in Germany, and upon stock option exercises,
• Generating revenues,
• Selling the bioresorbable implant CMF product line in September 2002,
• Selling the bioresorbable implant Thin Film product line (except for the territory of Japan), in May 2004,
• Entering into a Distribution Agreement for the distribution rights to Thin Film in Japan, in which we received an upfront license fee in July 2004 and an initial development milestone payment in October 2004,
• Obtaining a modest amount of capital equipment long-term financing,
• Issuing 1,100,000 shares of common stock to Olympus under a Stock Purchase Agreement which closed in May 2005,
• Entering into a collaborative arrangement with Olympus in November 2005, including the formation of a joint venture called Olympus-Cytori, Inc.,
• Receiving funds in exchange for granting Olympus an exclusive right to negotiate in February 2006, and
• Issuing $16,800,000 of registered common stock under our shelf registration statement in August 2006.
-39-
We entered into a strategic development and manufacturing joint venture as well as other agreements with Olympus in November 2005. Under the collaborative arrangements, we formed the Joint Venture with Olympus to develop and manufacture future generation devices based on our Celution™ System. Pursuant to the terms of the agreements, we received $11,000,000 in cash upon closing in the fourth quarter of 2005; this cash is incremental to the proceeds received under the May 2005 Olympus equity investment.
In January 2006, we also received an additional $11,000,000 upon our receipt of a CE mark for the first generation Celution™ System and
received an additional $1,500,000 in the first half of 2006 in exchange for the grant to Olympus of an exclusive right to negotiate a commercialization collaboration for the use of adipose stem and regenerative cells for a specific therapeutic area outside of cardiovascular disease.
In August 2006, we sold 2,918,000 shares of our common stock at $5.75 per share for an aggregate of approximately $16,800,000.
Olympus purchased $11,000,000 of these shares and the remaining balance was purchased by certain institutional investors. We received proceeds of approximately $16,200,000, net of related offering costs and fees.
In February 2007, we sold units consisting of 3,746,000 shares of common stock and 1,873,000 common stock warrants (with an exercise
price of $6.25 per share) to institutional and accredited investors. We received proceeds of approximately $19,700,000, net of related offering costs and fees.
We expect to receive net proceeds of $6,000,000 from the common stock private placement to Green Hospital Supply, Inc. in April 2007. We don’t expect significant capital expenditures in 2007; however, if necessary, we may borrow under our Amended Master Security
Agreement. Any excess funds will be invested in short-term available-for-sale investments. Our cash requirements for 2007 and beyond will depend on numerous factors, including the resources we devote to developing and
supporting our investigational cell therapy products, market acceptance of any developed products, regulatory approvals and other factors. We expect to incur research and development expenses at high levels in our regenerative cell platform for an extended period of time and have therefore positioned ourselves to expand our cash position through actively pursuing co-development and marketing agreements, research grants, and licensing agreements related to our regenerative cell technology platform. Further, we are actively seeking a buyer (or buyers) for our remaining MacroPore Biosurgery assets. This decision is based on the change in our strategic focus as well as the continuing negative profit margins being realized from the MacroPore Biosurgery segment.
The following summarizes our contractual obligations and other commitments at December 31, 2006, and the effect such obligations could
have on our liquidity and cash flow in future periods:
Cash (used in) provided by operating, investing and financing activities for the years ended December 31, 2006, 2005 and 2004, is
summarized as follows:
Table of Contents
Payments due by period
Contractual Obligations
Total
Less than 1
year 1 - 3 years 3 - 5 years More than
5 years Long-term obligations $ 2,158,000 $ 999,000 $ 1,159,000 $ — $ — Interest commitment on long-term
obligations 277,000 172,000 105,000 — —
Operating lease obligations 5,108,000 1,677,000 3,431,000 — — Pre-clinical research study obligations
2006 2005 2004 Net cash used in operating activities
$ (16,483,000 ) $ (1,101,000 ) $ (12,574,000 ) Net cash provided by investing activities 591,000 911,000 13,425,000 Net cash provided by (used in) financing activities 16,787,000 5,357,000 (831,000 )
-40-
Operating activities
Net cash used in operating activities for all periods presented resulted primarily from expenditures related to our regenerative cell research and development efforts.
Research and development efforts, other operational activities, and a comparatively small amount of product sales generated a $25,447,000
net loss for the year ended December 31, 2006. The cash impact of this loss was $16,483,000, after adjusting for the $11,000,000 cash we received in 2006 from the Joint Venture upon obtaining the CE Mark in the first quarter of 2006, the $1,500,000 received from Olympus mentioned above, $2,120,000 of non-cash depreciation and amortization and $4,431,000 non-cash change in the fair value of option liabilities, along with other changes in working capital due to timing of product shipments (accounts receivable) and payment of liabilities.
Research and development efforts, other operational activities, and a comparatively small amount of product sales generated a $26,538,000
net loss for the year ended December 31, 2005. The cash impact of this loss was $1,101,000, after adjusting for the $17,311,000 we received from Olympus as discussed previously. Other adjustments include material non-cash activities, such as the gain on sale of assets, depreciation and amortization, changes in the fair value of the Olympus option liabilities, stock based compensation expense, equity loss from investment in Joint Venture, as well as for changes in working capital due to the timing of product shipments (accounts receivable) and payment of liabilities.
Research and development efforts, other operational activities, and a comparatively small amount of product sales generated a $2,090,000
net loss for the year ended December 31, 2004. The cash impact of this loss was $12,574,000, after adjusting for the $13,883,000 gain on sale of assets, related party and changes in working capital due to the timing of product shipments and payment of liabilities. The net cash used in operations was partially offset by the $1,500,000 upfront license fee and $1,250,000 development milestone payment received from Senko in 2004.
Investing activities
Net cash provided by investing activities for the year ended December 31, 2006 resulted primarily from net proceeds from the purchase and sale of short-term investments, offset in part by expenditures for leasehold improvements.
Net cash provided by investing activities for the year ended December 31, 2005 resulted primarily from net proceeds from the sale of
short-term investments. Net cash provided by investing activities for the year ended December 31, 2004 resulted in part from the receipt of a non-recurring
payment of $6,500,000 related to the 2002 sale of the CMF Product Line to Medtronic. In addition, we received net proceeds of $6,931,000 from the sale of our Thin Film product line (except for the territory of Japan) to MAST.
Capital spending is essential to our product innovation initiatives and to maintain our operational capabilities. For the years ended
December 31, 2006, 2005 and 2004, we used cash to purchase $3,138,000, $1,846,000 and $789,000, respectively, of property and equipment to support manufacturing of our bioresorbable implants and for the research and development of the regenerative cell technology platform. The increase in 2006 capital spending was caused primarily by expenditures for leasehold improvements made to our new facilities. Financing Activities
The net cash provided by financing activities for the year ended December 31, 2006 related mainly to the issuance of 2,918,255 shares of our common stock in cash transactions in exchange for approximately $16,200,000 (net). It was also related to the exercise of employee stock options and offset to some extent by the principal payments on long-term obligations.
The net cash provided by financing activities for the year ended December 31, 2005 related mainly to the proceeds received from Olympus
as noted above. Sale proceeds were recorded as $3,003,000 for the sale of common stock and $1,686,000 for the issuance of options. The net cash used in financing activities for the year ended December 31, 2004 related to the repurchase of 290,252 shares of our common
stock for $1,052,000 as well as the payment of $847,000 on our long term obligations. Net cash used in financing activities in 2004 was offset by proceeds from an Amended Master Security Agreement we entered in
September 2003 to provide financing for equipment purchases. In connection with this agreement, we issued promissory notes with principal amounts totaling approximately $1,039,000 for the year ended December 31, 2004.
Table of Contents
-41-
Critical Accounting Policies and Significant Estimates
The preparation of financial statements in conformity with accounting principles generally accepted in the United States requires us to make estimates and assumptions that affect the reported amounts of our assets, liabilities, revenues and expenses, and that affect our recognition and disclosure of contingent assets and liabilities.
While our estimates are based on assumptions we consider reasonable at the time they were made, our actual results may differ from our
estimates, perhaps significantly. If results differ materially from our estimates, we will make adjustments to our financial statements prospectively as we become aware of the necessity for an adjustment.
We believe it is important for you to understand our most critical accounting policies. These are our policies that require us to make our
most significant judgments and, as a result, could have the greatest impact on our future financial results. Revenue Recognition
We derive our revenue from a number of different sources, including but not limited to:
A number of our revenue generating arrangements are relatively simple in nature, meaning that there is little judgment necessary with
regard to the timing of when we recognize revenues or how such revenues are presented in the financial statements. However, we have also entered into more complex arrangements, including but not limited to our contracts with Olympus, Senko, and the
NIH. Moreover, some of our non-recurring transactions, such as our disposition of the majority of our Thin Film business to MAST, contain elements that relate to our product revenue producing activities.
As a result, some of our most critical accounting judgments relate to the identification, timing, and presentation of revenue related
activities. These critical judgments are discussed further in the paragraphs that follow. Multiple-elements
Some of our revenue generating arrangements contains a number of distinct revenue streams, known as “elements.” For example, our Distribution Agreement with Senko contains direct or indirect future revenue streams related to:
Emerging Issues Task Force Issue 00-21, “Revenue Arrangements with Multiple Deliverables” (“EITF 00-21”), governs whether each of
the above elements in the arrangement should be accounted for individually, or whether the entire contract should be treated as a single unit of accounting.
EITF 00-21 indicates that individual elements may be separately accounted for only when:
Table of Contents
• Fees for achieving certain defined milestones under research and/or development arrangements.
• Product sales, and
• Payments under license or distribution agreements.
• A distribution license fee (which was paid at the outset of the arrangement),
• Milestone payments for achieving commercialization of the Thin Film product line in Japan,
• Training for representatives of Senko,
• Sales of Thin Film products to Senko, and
• Payments in the nature of royalties on future product sales made by Senko to its end customers.
• The delivered element has stand alone value to the customer,
• There is objective evidence of the fair value of the remaining undelivered elements, and
• If the arrangement contains a general right of return related to any products delivered, delivery of the remaining goods and services is probable and within the complete control of the seller.
-42-
In the case of the Senko Distribution Agreement, we determined that (a) the milestones payments for achieving commercialization and (b) the future sale of Thin Film products to Senko were “separable” elements. That is, each of these elements, upon delivery, will have stand alone value to Senko and there will be objective evidence of the fair value of any remaining undelivered elements at that time. The arrangement does not contain any general right of return, and so this point is not relevant to our analysis.
On the other hand, we concluded that (a) the upfront distribution license fee, (b) the revenues from training for representatives of Senko,
and (c) the payments in the form of royalties on future product sales are not separable elements under EITF 00-21. In arriving at our conclusions, we had to consider whether our customer, Senko, would receive stand alone value from each delivered
element. We also, in some cases, had to look to third party evidence to support the fair value of certain undelivered elements - notably, training - since we as a company do not routinely deliver this service on a stand alone basis. Finally, we had to make assumptions about how the non-separable elements of the arrangement are earned, particularly the estimated period over which Senko will benefit from the arrangement (refer to the “Recognition” discussion below for further background).
We also agreed to perform multiple services under the November 4, 2005 agreements we signed with Olympus, including:
We concluded that the license and development services must be accounted for as a single unit of accounting. In reaching this conclusion,
we determined that the license would not have stand alone value to the Joint Venture. This is because Cytori is the only party that could be reasonably expected to perform the development services, including pre-clinical and clinical studies, regulatory filings, and product development, necessary for the Joint Venture to derive any value from the license. Recognition
Besides determining whether to account separately for components of a multiple-element arrangement, we also use judgment in determining the appropriate accounting period in which to recognize revenues that we believe (a) have been earned and (b) are realizable. The following describes some of the recognition issues we have considered during the reporting period.
Table of Contents
• Granting the Joint Venture (which Olympus is considered to control) an exclusive and perpetual manufacturing license to our device technology, including the Celution™ System and certain related intellectual property; and
• Performing development activities in relation to certain therapeutic applications associated with our Celution™ System, including completing pre-clinical and clinical trials, seeking regulatory approval as appropriate, and assisting with product development.
• Upfront License Fees/Milestones
o As part of the Senko Distribution Agreement, we received an upfront license fee upon execution of the arrangement, which, as noted previously, was not separable under EITF 00-21. Accordingly, the license has been combined with the development (milestones) element, which was separable, to form a single accounting unit. This single element of $3,000,000 in fees includes $1,500,000 which is potentially refundable. We have recognized, and will continue to recognize, the non-contingent fees allocated to this combined element as revenues as we complete each of the performance obligations associated with the milestones component of this combined deliverable. Note that the timing of when we have recognized revenues to date does not correspond with the cash we received upon achieving certain milestones. For example, the first such milestone payment for $1,250,000 became payable to us when we filed a commercialization application with the Japanese regulatory authorities. However, we determined that the payment received was not commensurate with the level of effort expended, particularly when compared with other steps we believe are necessary to commercialize the Thin Film product line in Japan. Accordingly, we did not recognize the entire $1,250,000 received as revenues, but instead all but $361,000 of this amount is classified as deferred revenues. Approximately $361,000 ($152,000 in 2006, $51,000 in 2005 and $158,000 in 2004) has been recognized to date as development revenues based on our estimates of the level of effort expended for completed milestones as compared with the total level of effort we expect to incur under the arrangement to successfully achieve regulatory approval of the Thin Film product line in Japan. These estimates were subject to judgment and there may be changes in estimates regarding the total level of effort as we continue to seek regulatory approval. In fact there can be no assurance that commercialization in Japan will ever be achieved, although our latest understanding is that regulatory approval will be received in 2007.
o We also received upfront fees as part of the Olympus arrangements (although, unlike in the Senko agreement, these fees were non-refundable). Specifically, in exchange for an upfront fee, we granted the Joint Venture an exclusive, perpetual license to certain of our intellectual property and agreed to perform additional development activities. This upfront fee has been recorded in the liability account entitled deferred revenues, related party, on our consolidated balance sheet. Similar to the Senko agreement, we have elected an accounting policy to recognize revenues from the combined license/development
accounting unit as we perform the development services, as this represents our final obligation underlying the combined accounting unit. Specifically, we plan to recognize revenues from the license/development accounting unit using a “proportional performance” methodology, resulting in the de-recognition of amounts recorded in the deferred revenues, related party, account as we complete various milestones underlying the development services. For instance, we have and will continue to recognize some of the deferred revenues, related party as revenues, related party, when we complete a pre-clinical trial, or obtain regulatory approval in a specific jurisdiction. Determining what portion of the deferred revenues, related party balance to recognize as each milestone is completed involves substantial judgment. In allocating the balance of the deferred revenues, related party to various milestones, we had in-depth discussions with our operations personnel regarding the relative value of each milestone to the Joint Venture and Olympus. We also considered the cost of completing each milestone relative to the total costs we plan to incur in completing all of the development activities, since we believe that the relative cost of completing a milestone is a reasonable proxy for its fair value. The accounting policy described above could result in revenues being recorded in an earlier accounting period than had other judgments or assumptions been made by us.
-43-
Presentation
We have presented amounts earned under our NIH research arrangement as research grant revenue. We believe that the activities underlying the NIH agreement constituted a portion of our ongoing major or central operations. Moreover, the government obtains rights under the arrangement, in the same manner (but perhaps not to the same extent) as a commercial customer that similarly contracts with us to perform research activities. For instance, the government and any authorized third parties may use our federally funded research and/or inventions without payment of royalties to us.
Table of Contents
• Government Grants
o We are eligible to receive grants from the NIH related to our research on adipose derived cell therapy to treat myocardial infarctions. There are no specific standards under U.S. GAAP that prescribe the recognition or classification of these grants in the statement of operations. Absent such guidance, we have established an accounting policy to recognize NIH grant revenues at the lesser of:
� Qualifying costs incurred (and not previously recognized), plus any allowable grant fees, for which Cytori is entitled to grant funding; or,
� The amount determined by comparing the research outputs generated to date versus the total outputs that are expected to be achieved under the entire arrangement.
o Our accounting policy could theoretically defer revenue recognition beyond the period in which we have earned the rights to such fees. However, we selected this accounting policy to counteract the possibility of recognizing revenues from the NIH arrangement too early. For instance, if our policy permitted revenues to be recognized solely as qualifying costs were incurred, we could alter the amount of revenue recognized by incurring more or less cost in a given period, irrespective of whether these costs correlate to the research outputs generated. On the other hand, if revenue recognition were based on output measures alone, it would be possible to recognize revenue in excess of costs actually incurred; this is not appropriate since qualifying costs remain the basis of our funding under the NIH grant. The application of our accounting policy, nonetheless, involves significant judgment, particularly in estimating the percentage of outputs realized to date versus the total outputs expected to be achieved under the grant arrangement.
• Back-up Supply Arrangement
We agreed to serve as a back-up supplier of products in connection with our dispositions of specific Thin Film assets to MAST. Specifically, we agreed to supply Thin Film product to MAST at our cost for a defined period of time, which has since then expired. When we actually delivered products under the back-up supply arrangements in 2004, however, we recognized revenues in the financial statements at the estimated selling price which we would receive in the marketplace. We used judgment, based on historical data and expectations about future market trends, in determining the estimated market selling price of products subject to the back-up supply arrangements. The amount of the deferred gain recognized as revenue is equal to the excess of the fair value of products sold, based on historical selling prices of similar products, over our manufacturing cost.
-44-
Goodwill Impairment Testing
In late 2002, we purchased StemSource, Inc. and recognized over $4,600,000 in goodwill associated with the acquisition, of which $4,387,000 remains on our balance sheet as of December 31, 2006. As required by Statement of Financial Accounting Standard No. 142, “Goodwill and Other Intangible Assets” (“SFAS 142”), we must test this goodwill at least annually for impairment as well as when an event occurs or circumstances change such that it is reasonably possible that impairment may exist. Moreover, this testing must be performed at a level of the organization known as the reporting unit. A reporting unit is at least the same level as a company’s operating segments, and sometimes even one level lower. Our two reporting units are, in fact, our two operating segments.
Specifically, the process for testing goodwill for impairment under SFAS 142 involves the following steps:
When we last completed our goodwill impairment testing in 2006, the fair values of our two reporting units each exceeded their respective
carrying values. Accordingly, we determined that none of our reported goodwill was impaired.
The application of the goodwill impairment test involves a substantial amount of judgment. For instance, SFAS 142 requires that assets and liabilities be assigned to a reporting unit if both of the following criteria are met:
We developed mechanisms to assign company-wide assets like shared property and equipment, as well as company-wide obligations such
as borrowings under our GE loan facility, to our two reporting units. In some cases, certain assets were not allocable to either reporting unit and were left unassigned.
The most complex and challenging asset to assign to each reporting unit was our acquired goodwill. As noted previously, all of our
recorded goodwill was generated in connection with our acquisition of StemSource in 2002. However, when we first acquired StemSource, we determined that a portion of the goodwill related to the MacroPore Biosurgery reporting unit. The amount of goodwill allocated represented our best estimate of the synergies (notably future cost savings from shared research and development activities) that the MacroPore Biosurgery reporting unit would obtain by virtue of the acquisition.
Finally, with the consultation and assistance of a third party, we estimated the fair value of our reporting units by using various estimation
techniques. In particular, in 2006, we estimated the fair value of our MacroPore Biosurgery reporting unit based on an equal weighting of the market values of comparable enterprises and discounted projections of estimated future cash flows. Clearly, identifying comparable companies and estimating future cash flows as well as appropriate discount rates involve judgment. On the contrary, we estimated the fair value of our regenerative cell reporting unit solely using an income approach, as we believe there are no comparable enterprises on which to base a valuation. The assumptions underlying this valuation method involve a substantial amount of judgment, particularly since our regenerative cell business has yet to generate any revenues and does not have a commercially viable product. The combined value of our goodwill is consistent with the market’s valuation.
Again, the manner in which we assigned assets, liabilities, and goodwill to our reporting units, as well as how we determined the fair value
of such reporting units, involves significant uncertainties and estimates. The judgments employed may have an effect on whether a goodwill impairment loss is recognized.
Table of Contents
• Company assets and liabilities, including goodwill, are allocated to each reporting unit for purposes of completing the goodwill impairment test.
• The carrying value of each reporting unit - that is, the sum of all of the net assets allocated to the reporting unit - is then compared to its fair value.
• If the fair value of the reporting unit is lower than its carrying amount, goodwill may be impaired - additional testing is required.
• The asset will be employed in or the liability relates to the operations of a reporting unit.
• The asset or liability will be considered in determining the fair value of the reporting unit.
-45-
Dispositions
In 2004, we sold most of the assets and intellectual property rights in our (non-Japan) Thin Film product line to MAST. As is common in the life sciences industry, the sale agreements contained provisions beyond the simple transfer of net assets to the
acquiring enterprises for a fixed price. Specifically, as part of the arrangement, we also agreed to perform the following services:
Disposing of assets and product lines is not one of our core ongoing or central activities. Accordingly, determining the appropriate
accounting for these transactions involved some of our most difficult, subjective and complex judgments. In particular, we made assumptions around the appropriate manner and timing in which to recognize the gain on disposal for each transaction in the statement of operations.
We initially deferred recognition of the gain related to our disposition of certain Thin Film assets, which occurred in May 2004. Again, the
Asset Purchase Agreement governing the Thin Film sale obligated us to perform certain actions for the benefit of the buyer - MAST - for a defined period of time, such as serving as a back-up supplier. We concluded, due to the arbitration proceedings settled in August 2005 that we completed our remaining performance obligations during the third quarter of 2005. Accordingly, we recognized the remaining deferred gain on sale of assets as gain on sale of assets.
We also recognized a portion of the deferred gain when we sold products to MAST under the back-up supply agreement in 2004. Refer to
the “Revenue Recognition” section of this Critical Accounting Policies and Significant Estimates discussion for further details. Variable Interest Entity (Olympus-Cytori Joint Venture)
FASB Interpretation No. 46 (revised 2003), “Consolidation of Variable Interest Entities - An Interpretation of ARB No. 51” (“FIN 46R”) requires a variable interest entity (“VIE”) to be consolidated by its primary beneficiary. Evaluating whether an entity is a VIE and determining its primary beneficiary involves significant judgment.
In concluding that the Olympus-Cytori Joint Venture was a VIE, we considered the following factors:
Because the Joint Venture is undercapitalized, and because one of the Joint Venture’s decision makers may be protected from losses, we
have determined that the Joint Venture is a VIE under FIN 46R. Because of the complexities in applying FIN 46R, it is reasonable to expect that others may reach a different conclusion.
As noted previously, a VIE is consolidated by its primary beneficiary. The primary beneficiary is defined in FIN 46R as the entity that
would absorb the majority of the VIE’s expected losses or be entitled to receive the majority of the VIE’s residual returns (or both). Significant judgment was involved in determining the primary beneficiary of the Joint Venture. Under FIN 46R, we believe that Olympus
and Cytori are “de facto agents” and, together, will absorb more than 50% of the Joint Venture’s expected losses and residual returns. Ultimately, we concluded that Olympus, and not Cytori, was the party most closely related with the joint venture and, hence, its primary beneficiary. Our conclusion was based on the following factors:
Table of Contents
• Provide training to MAST personnel on production and other aspects of the Thin Film product lines, and
• Provide a back-up supply of Thin Film products to MAST, at cost, for a specified period of time.
• Under FIN 46R, an entity is a VIE if it has insufficient equity to finance its activities. We recognized that the initial cash contributed to the Joint Venture formed by Olympus and Cytori ($30,000,000) would be completely utilized by the first quarter of 2006. Moreover, it was highly unlikely that the Joint Venture would be able to obtain the necessary financing from third party lenders without additional subordinated financial support - such as personal guarantees by one or both of the Joint Venture stockholders. Accordingly, the joint venture will require additional financial support from Olympus and Cytori to finance its ongoing operations, indicating that the Joint Venture is a VIE. In fact, in the first quarter of 2006, we contributed $150,000 each to fund the Joint Venture’s ongoing operations.
• Moreover, Olympus has a contingent put option that would, in specified circumstances, require Cytori to purchase Olympus’s interests in the Joint Venture for a fixed amount of $22,000,000. Accordingly, Olympus is protected in some circumstances from absorbing all expected losses in the Joint Venture. Under FIN 46R, this means that Olympus may not be an “at-risk” equity holder, although Olympus clearly has decision rights over the operations of the Joint Venture.
• The business operations of the Joint Venture will be most closely aligned to those of Olympus (i.e., the manufacture of devices).
The application of FIN 46R involves substantial judgment, and others may arrive at a conclusion that Cytori should consolidate the Joint
Venture. Had we consolidated the Joint Venture, though, there would be no effect on our net loss or shareholders’ equity at December 31, 2006 or for the year then ended. However, certain balance sheet and income statement captions would have been presented in a different manner. For instance, we would not have presented a single line item entitled investment in joint venture in our balance sheet but, instead, would have performed a line by line consolidation of each of the Joint Venture’s accounts into our financial statements.
• Olympus controls the Board of Directors, as well as the day-to-day operations of the Joint Venture.
-46-
Net Operating Loss and Tax Credit Carryforwards
We have established a valuation allowance against our net deferred tax asset due to the uncertainty surrounding the realization of such assets. We periodically evaluate the recoverability of the deferred tax asset. At such time as it is determined that it is more likely than not that deferred assets are realizable, the valuation allowance will be reduced. We have recorded a valuation allowance of $38,505,000 as of December 31, 2006 to reflect the estimated amount of deferred tax assets that may not be realized. We increased our valuation allowance by approximately $10,675,000 during the year ended December 31, 2006. The valuation allowance includes approximately $579,000 related to stock option deductions, the benefit of which, if realized, will eventually be credited to equity and not to income.
At December 31, 2006, we had federal and state tax loss carryforwards of approximately $57,515,000 and $50,529,000 respectively. The
federal and state net operating loss carryforwards begin to expire in 2019 and 2007 respectively, if unused. At December 31, 2006, we had federal and state tax credit carryforwards of approximately $1,755,000 and $1,445,000 respectively. The federal credits will begin to expire in 2017, if unused, and $160,000 of the state credits will begin to expire in 2009 if unused. The remaining state credits carry forward indefinitely. In addition, we had a foreign tax loss carryforward of $1,741,000 and $179,000 in Japan and the United Kingdom, respectively.
The Internal Revenue Code limits the future availability of net operating loss and tax credit carryforwards that arose prior to certain
cumulative changes in a corporation’s ownership resulting in a change of control of Cytori. Due to prior ownership changes as defined in IRC Section 382, a portion of our net operating loss and tax credit carryforwards are limited in their annual utilization. In September 1999, we experienced an ownership change for purposes of the IRC Section 382 limitation. At December 31, 2006, the remaining 1999 pre-change federal net operating loss carryforward of $400,000 is subject to an annual limitation of approximately $400,000. It is estimated that these pre-change net operating losses and credits will be fully available by 2007.
Additionally, in 2002 when we purchased StemSource, we acquired federal and state net operating loss carryforwards of approximately
$2,700,000 and $2,700,000 respectively. This event triggered an ownership change for purposes of IRC Section 382. As of December 31, 2006, the remaining pre-change federal and state net operating loss carryforward of $499,000 is subject to an annual limitation of approximately $460,000. It is estimated that the pre-change net operating losses and credits will be fully available by 2008.
We are in the process of updating our IRC Section 382 study analysis for the tax year ended December 31, 2006. The extent of any
additional limitation, if any, on the availability to use net operating losses and credits, is not known at this time.
Recent Accounting Pronouncements
In February 2006, the FASB issued Statement of Financial Accounting Standards No. 155, “Accounting for Certain Hybrid Instruments - An Amendment of FASB Statements Nos. 133 and 140” (“SFAS 155”). SFAS 155 allows companies to elect an accounting policy choice for so-called “hybrid instruments”. A hybrid instrument is a contract that contains one or more embedded derivatives. In many cases, Statement of Financial Accounting Standards No. 133, “Accounting for Derivative Instruments and Hedge Accounting” (“SFAS 133”) requires that an embedded derivative be separated from the “host contract” and accounted for at fair value in the financial statements. SFAS 155 removes the mandatory requirement to bifurcate an embedded derivative if the holder elects to account for the entire instrument - that is, both the host contract and the embedded derivative - at fair value, with subsequent changes in fair value recognized in earnings. SFAS 155 is effective for all hybrid instruments acquired or issued on or after September 15, 2006 and may be applied to hybrid financial instruments that had been bifurcated under SFAS 133 in the past. The adoption of SFAS 155 has not had a significant effect on our financial statements.
In June 2006, the FASB issued Interpretation No. 48, “Accounting for Uncertainty in Income Taxes” (“FIN 48”). This is an interpretation
of Statement of Financial Accounting Standards No. 109, “Accounting for Income Taxes." It prescribes a recognition threshold and measurement attribute for the financial statement recognition and measurement of a tax position taken or expected to be taken in a tax return. FIN 48 also provides guidance on derecognition, classification, interest and penalties, accounting in interim periods, disclosure and transition. This interpretation is effective for fiscal years beginning after December 15, 2006. The adoption of FIN 48 is not expected to have a significant effect on our financial statements.
In June 2006, the FASB ratified the consensus reached by the Emerging Issues Task Force on Issue No. 06-3, “How Sales Taxes Collected
From Customers and Remitted to Governmental Authorities Should Be Presented in the Income Statement” (“EITF 06-3”). EITF 06-3 requires a company to disclose its accounting policy (i.e. gross vs. net basis) relating to the presentation of taxes within the scope of EITF 06-3. Furthermore, for taxes reported on a gross basis, an enterprise should disclose the amounts of those taxes in interim and annual financial statements for each period for which an income statement is presented. The guidance is effective for all periods beginning after December 15, 2006. The adoption of EITF 06-3 is not expected to have a significant effect on our financial statements.
In September 2006, the SEC issued Staff Accounting Bulletin No. 108, “Considering the Effects of Prior Year Misstatements when
Quantifying Misstatements in Current Year Financial Statements” (“SAB 108”). SAB 108 provides interpretive guidance on how the effects of
Table of Contents
prior-year uncorrected misstatements should be considered when quantifying misstatements in the current year financial statements. SAB 108 requires registrants to quantify misstatements using both an income statement (“rollover”) and balance sheet (“iron curtain”) approach and evaluate whether either approach results in a misstatement that, when all relevant quantitative and qualitative factors are considered, is material. If prior year errors that had been previously considered immaterial now are considered material based on either approach, no restatement is required so long as management properly applied its previous approach and all relevant facts and circumstances were considered. If prior years are not restated, the cumulative effect adjustment is recorded in opening accumulated earnings (deficit) as of the beginning of the fiscal year of adoption. SAB 108 is effective for fiscal years ending on or after November 15, 2006, with earlier adoption encouraged. The adoption of SAB 108 has not had a significant effect on our financial statements.
In September 2006, the FASB issued SFAS No. 157, “Fair Value Measurements” (“SFAS 157”). SFAS 157 defines fair value, establishes
a framework for measuring fair value and expands disclosure of fair value measurements. SFAS 157 applies under other accounting pronouncements that require or permit fair value measurements and accordingly, does not require any new fair value measurements. SFAS 157 is effective for financial statements issued for fiscal years beginning after November 15, 2007. We do not believe that the adoption of SFAS 157 will have a significant effect on our financial statements.
-47-
Item 7A. Quantitative and Qualitative Disclosures About Market Risk
We are exposed to market risk related to fluctuations in interest rates and in foreign currency exchange rates. Interest Rate Exposure
We are not subject to market risk due to fluctuations in interest rates on our long-term obligations as they bear a fixed rate of interest. Our exposure relates primarily to short-term investments. These short-term investments, reported at an aggregate fair market value of $3,976,000 as of December 31, 2006, consist primarily of investments in debt instruments of financial institutions and corporations with strong credit ratings and United States government obligations. These securities are subject to market rate risk as their fair value will fall if market interest rates increase. If market interest rates were to increase immediately and uniformly by 100 basis points from the levels prevailing at December 31, 2006, for example, and assuming average investment duration of seven months, the fair value of the portfolio would not decline by a material amount. We do not use derivative financial instruments to mitigate the risk inherent in these securities. However, we do attempt to reduce such risks by generally limiting the maturity date of such securities, diversifying our investments and limiting the amount of credit exposure with any one issuer. While we do not always have the intent, we do currently have the ability to hold these investments until maturity and, therefore, believe that reductions in the value of such securities attributable to short-term fluctuations in interest rates would not materially affect our financial position, results of operations or cash flows. Changes in interest rates would, of course, affect the interest income we earn on our cash balances after re-investment. Foreign Currency Exchange Rate Exposure
Our exposure to market risk due to fluctuations in foreign currency exchange rates relates primarily to our cash balances in Europe and Japan. Transaction gains or losses resulting from cash balances and revenues have not been significant in the past and we are not engaged in any hedging activity in the Euro, the Yen or other currencies. Based on our cash balances and revenues derived from markets other than the United States for the year ended December 31, 2006, a hypothetical 10% adverse change in the Euro or Yen against the U.S. dollar would not result in a material foreign currency exchange loss. Consequently, we do not expect that reductions in the value of such sales denominated in foreign currencies resulting from even a sudden or significant fluctuation in foreign exchange rates would have a direct material impact on our financial position, results of operations or cash flows.
Notwithstanding the foregoing, the indirect effect of fluctuations in interest rates and foreign currency exchange rates could have a
material adverse effect on our business, financial condition and results of operations. For example, foreign currency exchange rate fluctuations may affect international demand for our products. In addition, interest rate fluctuations may affect our customers’ buying patterns. Furthermore, interest rate and currency exchange rate fluctuations may broadly influence the United States and foreign economies resulting in a material adverse effect on our business, financial condition and results of operations.
Under our Japanese Thin Film agreement with Senko, we would receive payments in the nature of royalties based on Senko’s net sales,
which would be Yen denominated. We expect such sales or royalties to begin in 2007.
Table of Contents
-48-
Table of Contents
Item 8. Financial Statements and Supplementary Data Report of Independent Registered Public Accounting Firm Consolidated Balance Sheets as of December 31, 2006 and 2005 Consolidated Statements of Operations and Comprehensive Loss for the years ended December 31, 2006, 2005 and 2004 Consolidated Statements of Stockholders’ Deficit for the years ended December 31, 2006, 2005 and 2004 Consolidated Statements of Cash Flows for the years ended December 31, 2006, 2005 and 2004 Notes to Consolidated Financial Statements
-49-
Report of Independent Registered Public Accounting Firm
The Board of Directors and Stockholders Cytori Therapeutics, Inc.: We have audited the accompanying consolidated balance sheets of Cytori Therapeutics, Inc. and subsidiaries (the Company) as of December 31, 2006 and 2005, and the related consolidated statements of operations and comprehensive loss, stockholders’ equity (deficit), and cash flows for each of the years in the three-year period ended December 31, 2006. In connection with our audits of the consolidated financial statements, we have also audited the financial statement schedule for each of the years in the three-year period ended December 31, 2006. These consolidated financial statements and financial statement schedule are the responsibility of the Company’s management. Our responsibility is to express an opinion on these consolidated financial statements and financial statement schedule based on our audits. We conducted our audits in accordance with the auditing standards of the Public Company Accounting Oversight Board (United States). Those standards require that we plan and perform the audit to obtain reasonable assurance about whether the financial statements are free of material misstatement. An audit includes examining, on a test basis, evidence supporting the amounts and disclosures in the financial statements, assessing the accounting principles used and significant estimates made by management, as well as evaluating the overall financial statement presentation. We believe that our audits provide a reasonable basis for our opinion. In our opinion, the consolidated financial statements referred to above present fairly, in all material respects, the financial position of Cytori Therapeutics, Inc. and subsidiaries as of December 31, 2006 and 2005, and the results of their operations and their cash flows for each of the years in the three-year period ended December 31, 2006, in conformity with U.S. generally accepted accounting principles. Also, in our opinion, the related financial statement schedule for each of the years in the three-year period ended December 31, 2006, when considered in relation to the basic consolidated financial statements taken as a whole, presents fairly, in all material respects, the information set forth therein. As discussed in note 2 to the consolidated financial statements, the Company derives a substantial portion of its revenues from related parties, and effective January 1, 2006, adopted Statement of Financial Accounting Standards No. 123(R), “Share-Based Payment.”
Table of Contents
PART I. FINANCIAL INFORMATION Item 1. Financial Statements
/s/ KPMG LLP
San Diego, California
March 29, 2007
-50-
CYTORI THERAPEUTICS, INC.
CONSOLIDATED BALANCE SHEETS
Table of Contents
As of December 31, 2006 2005 Assets Current assets:
Cash and cash equivalents $ 8,902,000 $ 8,007,000 Short-term investments, available-for-sale 3,976,000 7,838,000 Accounts receivable, net of allowance for doubtful accounts of $2,000 and $9,000 in 2006 and
2005, respectively 225,000 816,000 Inventories, net 164,000 258,000 Other current assets 711,000 621,000
Total current assets 13,978,000 17,540,000
Property and equipment held for sale, net 457,000 — Property and equipment, net 4,242,000 4,260,000 Investment in joint venture 76,000 — Other assets 428,000 458,000 Intangibles, net 1,300,000 1,521,000 Goodwill 4,387,000 4,387,000
Total assets $ 24,868,000 $ 28,166,000 Liabilities and Stockholders’ Deficit Current liabilities:
Accounts payable and accrued expenses $ 5,587,000 $ 6,129,000 Current portion of long-term obligations 999,000 952,000
Total current liabilities 6,586,000 7,081,000
Deferred revenues, related party 23,906,000 17,311,000 Deferred revenues 2,389,000 2,541,000 Option liabilities 900,000 5,331,000 Long-term deferred rent 741,000 573,000 Long-term obligations, less current portion 1,159,000 1,558,000
Total liabilities 35,681,000 34,395,000 Commitments and contingencies Stockholders’ deficit:
Preferred stock, $0.001 par value; 5,000,000 shares authorized; -0- shares issued and outstanding in 2006 and 2005 — —
Common stock, $0.001 par value; 95,000,000 shares authorized; 21,612,243 and 18,194,283 shares issued and 18,739,409 and 15,321,449 shares outstanding in 2006 and 2005, respectively
22,000 18,000
Additional paid-in capital 103,053,000 82,196,000 Accumulated deficit (103,460,000 ) (78,013,000 ) Treasury stock, at cost (10,414,000 ) (10,414,000 ) Accumulated other comprehensive income (loss) 1,000 (16,000 )
Amount due from exercises of stock options (15,000 ) —
THE ACCOMPANYING NOTES ARE AN INTEGRAL PART OF THESE CONSOLIDATED FINANCIAL STATEMENTS
Total stockholders’ deficit (10,813,000 ) (6,229,000 )
Total liabilities and stockholders’ deficit $ 24,868,000 $ 28,166,000
-51-
CYTORI THERAPEUTICS, INC.
CONSOLIDATED STATEMENTS OF OPERATIONS AND COMPREHEN SIVE LOSS
Table of Contents
For the Years Ended December 31, 2006 2005 2004 Product revenues:
Sales to related party $ 1,451,000 $ 5,634,000 $ 4,085,000 Sales to third parties — — 2,237,000
1,451,000 5,634,000 6,322,000
Cost of product revenues 1,634,000 3,154,000 3,384,000
Gross profit (loss) (183,000 ) 2,480,000 2,938,000 Development revenues:
Development, related party 5,905,000 — — Development 152,000 51,000 158,000 Research grants and other 419,000 320,000 338,000
6,476,000 371,000 496,000 Operating expenses:
Research and development 21,977,000 15,450,000 10,384,000 Sales and marketing 2,055,000 1,547,000 2,413,000 General and administrative 12,547,000 10,208,000 6,551,000 Change in fair value of option liabilities (4,431,000 ) 3,645,000 — Restructuring charge — — 107,000 Equipment impairment charge — — 42,000
Total operating expenses 32,148,000 30,850,000 19,497,000
Operating loss (25,855,000 ) (27,999,000 ) (16,063,000 )
Other income (expense):
Gain on sale of assets — 5,526,000 — Gain on sale of assets, related party — — 13,883,000 Interest income 708,000 299,000 252,000 Interest expense (199,000 ) (137,000 ) (177,000 ) Other income (expense), net (27,000 ) (55,000 ) 15,000 Equity loss from investment in joint venture (74,000 ) (4,172,000 ) —
Total other income, net 408,000 1,461,000 13,973,000
Net loss (25,447,000 ) (26,538,000 ) (2,090,000 )
Other comprehensive income (loss) - unrealized holding income (loss) 17,000 16,000 (58,000 )
For the Years Ended December 31, 2006 2005 2004 Cash flows from operating activities: Net loss $ (25,447,000 ) $ (26,538,000 ) $ (2,090,000 ) Adjustments to reconcile net loss to net cash used in operating activities:
Depreciation and amortization 2,120,000 1,724,000 1,752,000 Inventory provision 88,000 280,000 242,000 Warranty provision (reversal) (23,000 ) 53,000 86,000 (Reduction) increase in allowance for doubtful accounts (7,000 ) 1,000 (44,000 ) Change in fair value of option liabilities (4,431,000 ) 3,645,000 — Loss on disposal of assets — — 3,000 Equipment impairment charge — — 42,000 Restructuring charge — — — Amortization of gain on sale of assets — — (772,000 ) Amortization of gain on sale of assets, related party — — (156,000 ) Gain on sale of assets — (5,526,000 ) — Gain on sale of assets, related party — — (13,883,000 ) Stock-based compensation 3,220,000 404,000 119,000 Stock issued for license amendment 487,000 — — Equity loss from investment in joint venture 74,000 4,172,000 — Increases (decreases) in cash caused by changes in operating assets and
liabilities: Accounts receivable 598,000 46,000 472,000 Inventories 6,000 (159,000 ) 33,000 Other current assets (90,000 ) 363,000 (458,000 ) Other assets 30,000 (346,000 ) 8,000 Accounts payable and accrued expenses 281,000 3,027,000 (527,000 ) Deferred revenues, related party 6,595,000 17,311,000 — Deferred revenues (152,000 ) (51,000 ) 2,592,000 Long-term deferred rent 168,000 493,000 7,000
Net cash used in operating activities (16,483,000 ) (1,101,000 ) (12,574,000 )
Cash flows from investing activities: Proceeds from the sale and maturity of short-term investments 67,137,000 56,819,000 51,132,000 Purchases of short-term investments (63,258,000 ) (54,062,000 ) (50,321,000 ) Proceeds from the sale of assets, net — — 6,931,000 Proceeds from sale of assets, related party — — 6,500,000 Purchases of property and equipment (3,138,000 ) (1,846,000 ) (789,000 ) Investment in joint venture (150,000 ) — — Acquisition costs — — (28,000 )
Net cash provided by investing activities 591,000 911,000 13,425,000
Cash flows from financing activities: Principal payments on long-term obligations (952,000 ) (936,000 ) (847,000 ) Proceeds from long-term obligations 600,000 1,380,000 1,039,000 Proceeds from exercise of employee stock options and warrants 920,000 224,000 29,000 Proceeds from sale of common stock 16,219,000 3,003,000 — Proceeds from issuance of options, related party — 1,686,000 —
Purchase of treasury stock — — (1,052,000 )
Net cash provided by (used in) financing activities 16,787,000 5,357,000 (831,000 )
Net increase in cash and cash equivalents 895,000 5,167,000 20,000
Cash and cash equivalents at beginning of year 8,007,000 2,840,000 2,820,000 Cash and cash equivalents at end of year $ 8,902,000 $ 8,007,000 $ 2,840,000
-54-
THE ACCOMPANYING NOTES ARE AN INTEGRAL PART OF THESE CONSOLIDATED FINANCIAL STATEMENTS
Table of Contents
For the Years Ended December 31, 2006 2005 2004 Supplemental disclosure of cash flows information:
Cash paid during period for: Interest $ 201,000 $ 135,000 $ 176,000 Taxes 1,000 13,000 7,000
Supplemental schedule of non-cash investing and financing activities:
Transfer of intangible assets to joint venture (note 4) $ — $ 343,000 $ — Accretion of interest in joint venture (note 4) — 3,829,000 — Additions to leasehold improvements included in accounts payable and
accrued expenses — 800,000 — Amount due from exercise of stock options 15,000 — —
-55-
CYTORI THERAPEUTICS, INC. NOTES TO C ONSOLIDATED FINANCIAL STATEMENTS
DECEMBER 31, 2006 1. Organization and Operations
The Company Cytori Therapeutics, Inc. is developing and seeks to commercialize stem and regenerative cell therapies for cardiovascular disease, reconstructive surgery and many other serious, chronic, and life threatening conditions and disorders. We plan to commercialize these therapies through the sale of the Celution™ System, a device that quickly removes stem and regenerative cells from a patient’s own adipose tissue, and its related single-use consumables. We also own manufacturing rights to two product families that are no longer central to our business focus. The HYDROSORB™ family of bioresorbable spine and orthopedic implants is distributed worldwide exclusively by Medtronic, Inc. (“Medtronic”). Moreover, our Thin Film product line will be marketed exclusively in Japan by Senko Medical Trading Co. (“Senko”) following regulatory approval of the product in Japan, which is expected in 2007. We have subsidiaries located in Japan and the United Kingdom. Principles of Consolidation The consolidated financial statements include our accounts and those of our subsidiaries. All significant intercompany transactions and balances have been eliminated. Management evaluates its investments on an individual basis for purposes of determining whether or not consolidation is appropriate. In instances where we do not demonstrate control through decision-making ability and/or a greater than 50% ownership interest, we account for the related investments under the cost or equity method, depending upon management’s evaluation of our ability to exercise and retain significant influence over the investee. Our investment in the Olympus-Cytori, Inc. joint venture has been accounted for under the equity method of accounting (see note 4 for further details). Certain Risks and Uncertainties We have a limited operating history and our prospects are subject to the risks and uncertainties frequently encountered by companies in the early stages of development and commercialization, especially those companies in rapidly evolving and technologically advanced industries such as the biotech/medical device field. Our future viability largely depends on the ability to complete development of new products and receive regulatory approvals for those products. No assurance can be given that our new products will be successfully developed, regulatory approvals will be granted, or acceptance of these products will be achieved. The development of medical devices for specific therapeutic applications is subject to a number of risks, including research, regulatory and marketing risks. There can be no assurance that our development stage products will overcome these hurdles and become commercially viable and/or gain commercial acceptance. For the years ended December 31, 2006, 2005 and 2004, we recorded bioresorbable product revenue from Medtronic of $1,451,000, $5,634,000 and $4,085,000, respectively, which represented 18.3%, 93.8% and 59.9% of total product and development revenues, respectively. Our future revenue generated from our bioresorbable products will continue to depend to a significant extent on Medtronic’s (our sole distributor of spine and orthopedics implants) efforts in the bioresorbable spine and orthopedics arena. Since we have concern about Medtronic’s level of commitment, we are actively seeking a buyer (or buyers) for our bioresorbable product line (see note 3 for further details). Capital Availability We have a limited operating history and recorded the first sale of our products in 1999. We incurred losses of $25,447,000, $26,538,000 and $2,090,000 for the years ended December 31, 2006, 2005 and 2004, respectively, and have an accumulated deficit of $103,460,000 as of December 31, 2006. Additionally, we have used net cash of $16,483,000, $1,101,000 and $12,574,000 to fund our operating activities for the years ended December 31, 2006, 2005 and 2004, respectively.
Table of Contents
Management recognizes the need to generate positive cash flows in future periods and/or to obtain additional capital from various sources. In the continued absence of positive cash flows from operations, no assurance can be given that we can generate sufficient revenue to cover operating costs or that additional financing will be available to us and, if available, on terms acceptable to us in the future. See note 21 for discussion of financing arrangements made subsequent to December 31, 2006.
-56-
2. Summary of Significant Accounting Policies
Use of Estimates The preparation of consolidated financial statements in conformity with accounting principles generally accepted in the United States requires management to make estimates and assumptions affecting the reported amounts of assets and liabilities and disclosure of contingent assets and liabilities at the date of the financial statements, and the reported amounts of revenue and expenses during the reporting period. Actual results could differ from these estimates. Estimates and assumptions are reviewed periodically, and the effects of revisions are reflected in the consolidated financial statements in the periods they are determined to be necessary. Our most significant estimates and critical accounting policies involve revenue recognition, evaluating goodwill for impairment, accounting for product line dispositions, and assessing how to report our investment in Olympus-Cytori, Inc. Presentation Certain prior period amounts have been reclassified to conform to current period presentation, such as the classification of legal expenses. Concentration of Credit Risk Financial instruments which potentially subject us to concentrations of credit risk consist of short-term available-for-sale investments and accounts receivable. Substantially all of our accounts receivable is due from Medtronic (see note 19). Cash and Cash Equivalents We consider all highly liquid investments with maturities of three months or less at the time of purchase to be cash equivalents. Investments with original maturities of three months or less that were included with and classified as cash and cash equivalents totaled $7,500,000 and $6,415,000 as of December 31, 2006 and 2005, respectively. Short-term Investments We invest excess cash in highly liquid debt instruments of financial institutions and corporations with strong credit ratings and in United States government obligations. We have established guidelines relative to diversification and maturities that maintain safety and liquidity. These guidelines are periodically reviewed and modified to take advantage of trends in yields and interest rates. We evaluate our investments in accordance with the provisions of Statement of Financial Standards (“SFAS”) No. 115, “Accounting for Certain Investments in Debt and Equity Securities.” Based on our intent, our investment policies and our ability to liquidate debt securities, we classify short-term investment securities within current assets. Available-for-sale securities are carried at fair value, with unrealized gains and losses reported as accumulated other comprehensive income (loss) within stockholders’ equity. The amortized cost basis of debt securities is periodically adjusted for amortization of premiums and accretion of discounts to maturity. Such amortization is included as a component of interest income or interest expense. The amortized cost basis of securities sold is based on the specific identification method and all such realized gains and losses are recorded as a component within other income (expense). Based on such evaluation, management has determined that all investment securities (other than those classified as cash equivalents) are properly classified as available-for-sale. We review the carrying values of our investments and write down such investments to estimated fair value by a charge to the statements of operations when the severity and duration of a decline in the value of an investment is considered to be other than temporary. The cost of securities sold or purchased is recorded on the settlement date. At December 31, 2006, the excess of carrying cost over the fair value of our short-term investments is immaterial. Fair Value of Financial Instruments The carrying amounts of our cash and cash equivalents, accounts receivable, accounts payable and accrued expenses approximate their fair value due to the short-term nature of these balances. The carrying amounts of our current portion of long-term obligations and long-term obligations approximate fair value as the terms and rates of interest for these instruments approximate terms and market rates of interest currently available to us for similar instruments. The carrying amount for our option liability approximates fair value based on established option pricing theory and assumptions (note 4). Our short-term investments are already reported at fair value in the financial statements.
Table of Contents
-57-
Inventories Inventories include the cost of material, labor and overhead, and are stated at the lower of average cost, determined on the first-in, first-out (FIFO) method, or market. We periodically evaluate our on-hand stock and make appropriate provisions for any stock deemed as excess or obsolete. During the years ended December 31, 2006 and 2005, we recorded provisions of $88,000 and $280,000, respectively, for excess and slow-moving inventory. The inventory was produced in anticipation of stocking orders from Medtronic which did not materialize. The provisions have been charged to cost of sales. During the first quarter of 2004, we recorded a provision of approximately $242,000 for excess inventory. Such excess inventory was produced in consideration of our responsibility to be a back-up supplier for the craniomaxillofacial (“CMF”) product line. We sold the assets related to this product line to an affiliate of Medtronic on September 30, 2002. In April of 2004, Medtronic indicated that it would no longer purchase CMF inventory from us under the back-up supply arrangement, leading to the determination that the remaining CMF inventory on hand would not be recoverable. Property and Equipment Property and equipment is stated at cost, net of accumulated depreciation. Depreciation expense, which includes the amortization of assets recorded under capital leases, is provided for on a straight-line basis over the estimated useful lives of the assets, or the life of the lease, whichever is shorter, and range from three to seven years. When assets are sold or otherwise disposed of, the cost and related accumulated depreciation are removed from the accounts and the resulting gain or loss is included in operations. Leasehold improvements are amortized on a straight-line basis over the shorter of the estimated useful life of the asset or the lease term. Maintenance and repairs are charged to operations as incurred. In the second and fourth quarters of 2006, we recorded an additional $118,000 and $103,000 of depreciation expense to accelerate the estimated remaining lives for certain assets determined to be no longer in use. The second quarter charge related to furniture and fixtures no longer in use due to our headquarters relocation, as well as outdated computer software and related equipment. The assets related to both our regenerative cell technology and MacroPore Biosurgery operating segments. We recorded the charge as an increase to general and administrative expenses. The fourth quarter charge related to leasehold improvements that had a shortened useful life due to the termination of one of our leases. The charge was allocated to each department based on square footage occupied at this terminated location. Impairment In accordance with SFAS No. 144, “Accounting for Impairment or Disposal of Long-Lived Assets,” we assess certain of our long-lived assets, such as property and equipment and intangible assets other than goodwill, for potential impairment when there is a change in circumstances that indicates carrying values of assets may not be recoverable. Such long-lived assets are deemed to be impaired when the undiscounted cash flows expected to be generated by the asset (or asset group) are less than the asset’s carrying amount. Any required impairment loss would be measured as the amount by which the asset’s carrying value exceeds its fair value, and would be recorded as a reduction in the carrying value of the related asset and a charge to operating expense. During the year ended December 31, 2004, we recorded an equipment impairment charge of $42,000 related to production assets which were used in multiple product lines. Assets held for sale In the third quarter of 2006, we classified certain assets as held for sale, including certain tangible assets related to our MacroPore Biosurgery product line (note 3). We stopped depreciating these assets in September 2006. Goodwill and Intangibles SFAS No. 142, “Goodwill and Other Intangible Assets,” establishes financial accounting and reporting standards for acquired goodwill and other intangible assets. Under SFAS No. 142, goodwill and indefinite-lived intangible assets are not amortized but are reviewed at least annually for impairment. Separable intangible assets that have finite useful lives will continue to be amortized over their respective useful lives. SFAS No. 142 requires that goodwill be tested for impairment on at least an annual basis or whenever events or changes in circumstances
Table of Contents
indicate that the carrying value of goodwill may not be recoverable. We last completed this testing as of November 30, 2006 and concluded that no impairment existed. Intangibles, consisting of patents and core technology purchased in the acquisition of StemSource, Inc. in 2002, are being amortized on a straight-line basis over their expected lives of ten years. In 2005, we licensed a portion of our patents and core technology to a joint venture which we formed with Olympus Corporation (“Olympus”), named Olympus-Cytori, Inc. (the “Joint Venture”). Of the $1,735,000 previously allocated to patents and core technology, $343,000 (net of accumulated amortization of $136,000), was transferred to the Joint Venture (see note 4).
-58-
The changes in the carrying amounts of other indefinite and finite-life intangible assets and goodwill for the years ended December 31, 2006 and 2005 are as follows:
As of December 31, 2006, future estimated amortization expense for these other intangible assets is expected to be as follows:
Revenue Recognition Product Sales We sell our (non-Thin Film) MacroPore Biosurgery products to Medtronic, Inc., a related party, under a Distribution Agreement dated January 5, 2000 and amended December 22, 2000 and October 8, 2002, as well as a Development and Supply Agreement dated January 5, 2000 and amended December 22, 2000 and September 30, 2002. These revenues are classified as sales to related party in our statements of operations. We recognize revenue on product sales to Medtronic only after both (a) the receipt of a purchase order from Medtronic and (b) shipment of ordered products to Medtronic, as title and risk of loss pass upon shipment. On occasion, we will offer Medtronic extended payment terms. In these circumstances, we do not recognize revenues under these arrangements until the payment becomes due or is received, if that occurs earlier. Moreover, we warrant that our products are free from manufacturing defects at the time of shipment. We have recorded a reserve for the estimated costs we may incur under our warranty program (see below). In September 2002, we entered into various agreements with Medtronic and a subsidiary of Medtronic for the sale of our CMF product line. Moreover, in May 2004, we sold most, but not all, of our intellectual property rights and tangible assets related to our Thin Film product line to MAST Biosurgery AG, a Swiss corporation (“MAST”) and a subsidiary of MAST. In both cases, the net proceeds received initially were recorded as deferred gain on sale of assets (see notes 5 and 6). As part of the sale agreements, we agreed to act as a back-up supplier to Medtronic and MAST until those respective parties could integrate the acquired assets into their own manufacturing operations. Specifically, the back-up supply agreements required us to sell products ordered by Medtronic and MAST at our manufacturing cost. Accordingly, we recognized a portion of the deferred gains as revenues upon the sale of products to Medtronic and MAST under the back-up supply arrangements. The amount of the deferred gain recognized as revenues was equal to the excess of (a) the fair value of products sold, based on historical selling prices of similar products, over (b) our manufacturing cost. In the case of Medtronic, we recognized $156,000 of the deferred gain as revenues in 2004. In the case of MAST, we recognized $772,000 of the deferred gain as revenues in 2004. License/Distribution Fees If separable under Emerging Issues Task Force Issue 00-21, “Revenue Arrangements with Multiple Deliverables” (“EITF 00-21”), we recognize any upfront payments received from license/distribution agreements as revenues ratably over the period in which the customer benefits from the license/distribution agreement. To date, we have not received any upfront license payments that are separable under EITF 00-21. Accordingly, such license revenues have been combined with other elements, such as research and development activities, for purposes of revenue recognition. For instance, we account for the license fees and milestone payments under the Distribution Agreement with Senko as a single unit of accounting. Similarly, we have attributed the upfront fees received under the arrangements with Olympus Corporation, a related party (see note 4), to a combined unit of accounting comprising a license we granted to Olympus-Cytori, Inc. (the “Joint Venture”), a related party, as well as development services we agreed to perform for this entity. In the first quarter of 2006, we granted Olympus an exclusive right to negotiate a commercialization collaboration for the use of adipose stem and regenerative cells for a specific therapeutic area outside of cardiovascular disease. In exchange for this right, we received $1,500,000 from Olympus, which is non-refundable but may be applied towards any definitive commercial collaboration in the future. As part of this agreement, Olympus will conduct market research and pilot clinical studies in collaboration with us over a 12 to 18 month period for the therapeutic area. The $1,500,000 payment was received in the second quarter of 2006 and recorded as deferred revenues, related party. The deferred revenues, related party will be recognized as revenue in the statement of operations either (i) in connection with other consideration received as part of a definitive commercial collaboration in the future, or (ii) when the exclusive negotiation period expires. In the third quarter of 2004, we entered into a Distribution Agreement with Senko. Under this agreement, we granted to Senko an exclusive license to sell and distribute certain Thin Film products in Japan and received a $1,500,000 upfront license fee from them in return for this right. We have recorded the $1,500,000 received as a component of deferred revenues in the accompanying balance sheet. Half of the license fee is refundable if the parties agree commercialization is not achievable and a proportional amount is refundable if we terminate the arrangement, other than for material breach by Senko, before three years post-commercialization.
Table of Contents
-60-
Research and Development We earn revenue for performing tasks under research and development agreements with both commercial enterprises, such as Olympus and Senko, and governmental agencies like the National Institutes of Health (“NIH”). Revenue earned under development agreements is classified as either research grant or development revenues in our statements of operations, depending on the nature of the arrangement. The costs associated with earning these revenues are typically recorded as research and development expense. We received a total of $22,000,000 from Olympus and Olympus-Cytori, Inc. during 2005 in two separate but related transactions (see note 4). Approximately $4,689,000 of this amount related to common stock that we issued, as well as two options we granted, to Olympus (see note 4 for further details). Moreover, during the first quarter of 2006, we received $11,000,000 from the Joint Venture upon achieving the CE Mark on the Celution™ System. Considering the $4,689,000 initially allocated to the common stock issued and the two options, we recorded upfront fees totaling $28,311,000 as deferred revenues, related party. In exchange for these proceeds, we agreed to (a) provide Olympus-Cytori, Inc. an exclusive and perpetual license to our therapeutic device technology, including the Celution™ System and certain related intellectual property, and (b) perform future development services related to commercializing the Celution™ System (see note 4). As noted above, the license and development services are not separable under EITF 00-21. Accordingly, we will recognize the $28,311,000 allocated to deferred revenues, related party, using a proportional performance methodology- that is, as we complete substantive milestones related to the development component of the combined accounting unit. As of December 31, 2006, we have recognized $5,905,000 of the deferred revenues, related party as development revenues. All related development costs are expensed as incurred and are included in research and development expense on the statement of operations.
In the third quarter of 2004, we entered into a Distribution Agreement with Senko. Under this agreement, we granted to Senko an exclusive license to sell and distribute certain Thin Film products in Japan. We have also earned or will be entitled to earn additional payments under the Distribution Agreement based on achieving the following defined research and development milestones:
Of the amounts received and deferred, we recognized development revenues of $152,000, $51,000, and $158,000 in the years ended December 31, 2006, 2005 and 2004, respectively, representing the fair value of the completed milestones relative to the fair value of the total efforts expected to be necessary to achieve regulatory approval by the MHLW. As noted above, the license and the milestone components of the Senko Distribution Agreement are accounted for as a single unit of accounting. This single element includes a $1,500,000 license fee which is potentially refundable. We have recognized, and will continue to recognize, the non-contingent fees allocated to this combined deliverable as we complete performance obligations under the Distribution Agreement with Senko. We will not recognize the potentially refundable portion of the fees until the right of refund expires. See note 7 for further details.
Under our agreement with the NIH, we were reimbursed for “qualifying expenditures” related to research on adipose-derived cell therapy for myocardial infarction. To receive funds under the grant arrangement, we were required to (i) demonstrate that we incurred “qualifying expenses,” as defined in the grant agreement between the NIH and us, (ii) maintain a system of controls, whereby we could accurately track and report all expenditures related solely to research on Adipose-Derived Cell Therapy for Myocardial Infarction, and (iii) file appropriate forms and follow appropriate protocols established by the NIH. When we were reimbursed for costs incurred under grant arrangements with the NIH, we recognized revenues for the lesser of:
In 2006, we recognized NIH grant revenue of $310,000 and incurred costs of $479,000 ($169,000 of which were not qualified). In 2005, we recognized NIH grant revenue of $312,000 and incurred costs of $306,000 for the same period. In 2004 we recognized NIH grant revenue of $328,000 and incurred costs of $339,000 ($11,000 of which were not qualified). Warranty We provide a limited warranty under our agreements with our customers for products that fail to comply with product specifications. We
Table of Contents
• In 2004, we received a nonrefundable payment of $1,250,000 from Senko after filing an initial regulatory application with the Japanese Ministry of Health, Labour and Welfare (“MHLW”) related to the Thin Film product line. We initially recorded this payment as deferred revenues of $1,250,000.
• Upon the achievement of commercialization (i.e., regulatory approval by the MHLW), we will be entitled to an additional nonrefundable payment of $250,000.
• Qualifying costs incurred (and not previously recognized) to date, plus any allowable grant fees for which we are entitled to funding from the NIH; or
• The outputs generated to date versus the total outputs expected to be achieved under the research arrangement.
have recorded a reserve for estimated costs we may incur under our warranty program. The following summarizes the movements in our warranty reserve, which is included in accounts payable and accrued expenses, at December 31, 2006 and 2005:
In August 2003, as part of our ongoing product monitoring process, we determined that some of the products sold to Medtronic did not meet certain expectations, based on criteria we previously communicated to Medtronic. We agreed to a “no charge” replacement of the affected inventory in the possession of Medtronic. In the first half of 2004, we incurred claims of $251,000 related to the replacement of this product. There were no similar claims made in 2005 or 2006.
Research and Development Research and development expenditures, which are charged to operations in the period incurred, include costs associated with the design, development, testing and enhancement of our products, regulatory fees, the purchase of laboratory supplies, pre-clinical and clinical studies. Included in these expenditures are salaries and benefits related to these efforts, which were approximately $9,166,000 in 2006. Also included in research and development are costs incurred to support research grant reimbursement and costs incurred in connection with our development arrangements with Olympus and Senko. Expenditures related to the Joint Venture with Olympus include costs that are necessary to support the commercialization of future generation devices based on our Celution™ System. These development activities, which began in November 2005, include performing pre-clinical and clinical trials, seeking regulatory approval, and performing product development related to therapeutic applications for adipose stem and regenerative cells for multiple large markets. For the years ended December 31, 2006 and 2005, costs associated with the development of the device were $7,286,000 and $1,136,000. There were no comparable expenditures in 2004. Our agreement with the NIH entitled us to qualifying expenditures of up to $950,000 for Phase I and Phase II related to research on Adipose-Derived Cell Therapy for Myocardial Infarction. We incurred $479,000 ($169,000 of which were not reimbursed), $306,000 and $339,000 ($11,000 of which were not reimbursed) of direct expenses for the years ended December 31, 2006, 2005 and 2004, respectively. Under a Distribution Agreement with Senko we are responsible for the completion of the initial regulatory application to the MHLW and commercialization of the Thin Film product line in Japan. During the years ended December 31, 2006, 2005 and 2004, we incurred $178,000, $129,000 and $170,000, respectively, of expenses related to this regulatory and registration process. Income Taxes Income taxes are accounted for under the asset and liability method. Deferred tax assets and liabilities are recognized for the future tax consequences attributable to differences between the financial statement carrying amounts of existing assets and liabilities and their respective tax bases and operating loss and tax credit carry forwards. Deferred tax assets and liabilities are measured using enacted tax rates expected to apply to taxable income (loss) in the years in which those temporary differences are expected to be recovered or settled. Due to our current loss position, a full valuation allowance was recognized against deferred tax assets. Stock Based Compensation Accounting Policy On January 1, 2006, we adopted the provisions of Financial Accounting Standards Board Statement No. 123R, “Share-Based Payment” (“SFAS 123R”) using the modified prospective transition method. SFAS 123R requires us to measure all share-based payment awards granted after January 1, 2006, including those with employees, at fair value. Under SFAS 123R, the fair value of stock options and other equity-based compensation must be recognized as expense in the statements of operations over the requisite service period of each award. In addition, beginning January 1, 2006, we have recognized compensation expense under SFAS 123R for the unvested portions of outstanding share-based awards previously granted under our (a) 2004 Equity Incentive Plan and (b) 1997 Stock Option and Stock Purchase Plan, over the periods these awards continue to vest. This compensation expense is recognized based on the fair values and attribution methods that were previously disclosed in our prior period financial statements under Financial accounting Standards Board Statement No. 123, “Accounting for Stock-Based Compensation” (“SFAS 123”). Prior to January 1, 2006, we applied the intrinsic value-based method of accounting for share-based payment transactions with our employees, as prescribed by Accounting Principles Board (“APB”) Opinion No. 25, “Accounting for Stock Issued to Employees,” and related interpretations including Financial Accounting Standards Board (“FASB”) Interpretation No. 44, “Accounting for Certain Transactions Involving Stock Compensation-An Interpretation of APB Opinion No. 25.” Under the intrinsic value method, compensation expense was recognized only if the current market price of the underlying stock exceeded the exercise price of the share-based payment award as of the measurement date (typically the date of grant). SFAS 123 established accounting and disclosure requirements using a fair value-based method of accounting for stock-based employee compensation plans. As permitted by SFAS 123 and by Statement of Financial Accounting Standards No. 148, “Accounting for Stock-Based Compensation—Transition and Disclosure,” we disclosed on a pro forma basis the net loss and loss per share that would have resulted had we adopted SFAS 123 for measurement purposes. Fair value under SFAS 123 is determined using the Black-Scholes option-pricing model with the following assumptions:
Table of Contents
For the year ended December 31, 2005
For the year ended December 31, 2004
Expected term 8 years 6 years Risk free interest rate 3.9-4.4 % 3.3-4.4 %
Volatility 80 % 85 %
Dividends — — Resulting weighted average grant date fair value $ 3.25 $ 3.26
-62-
Had compensation expense been recognized for stock-based compensation plans in accordance with SFAS 123, we would have recorded the following net loss and net loss per share amounts:
Other Comprehensive Income (Loss) Comprehensive income (loss) is the total of net income (loss) and all other non-owner changes in equity. Other comprehensive income (loss) refers to these revenues, expenses, gains, and losses that, under generally accepted accounting principles, are included in comprehensive income (loss) but excluded from net income (loss). During the years ended December 31, 2006, 2005 and 2004, our only element of other comprehensive income (loss) resulted from unrealized gains (losses) on available-for-sale investments, which are reflected in the statements of changes in stockholders’ equity as accumulated other comprehensive income (loss).
Table of Contents
For the year ended
December 31, 2005
For the year ended December 31, 2004
Net loss:
As reported $ (26,538,000 ) $ (2,090,000 ) Add: Employee stock-based compensation expense included in
reported net loss, net of related tax effects 341,000 96,000
Deduct: Total employee stock-based compensation expense determined under the fair value method for all awards, net of
related tax effects (2,675,000 ) (2,586,000 )
Pro forma $ (28,872,000 ) $ (4,580,000 )
Basic and diluted loss per common share:
As reported $ (1.80 ) $ (0.15 )
Pro forma $ (1.96 ) $ (0.33 )
-63-
Segment Information On July 11, 2005, we announced the reorganization of our business based on two distinct operating segments - (a) Regenerative cell technology and (b) MacroPore Biosurgery, which manufactures bioresorbable implants. In the past, our resources were managed on a consolidated basis. However, in an effort to better reflect our focus and significant progress in the development of regenerative therapies, we are now evaluating and therefore reporting our financial results in two segments. Our regenerative cell technology segment is developing and seeks to commercialize stem and regenerative cell therapies for cardiovascular disease, reconstructive surgery and many other serious, chronic, and life threatening conditions and disorders. We plan to commercialize these therapies through the sale of the Celution™ System, a device that quickly removes stem and regenerative cells from a patient’s own adipose (fat) tissue, and its related single-use consumables. Our MacroPore Biosurgery unit manufactures and distributes the HYDROSORB™ family of FDA-cleared bioresorbable spine and orthopedic implants; it also develops Thin Film bioresorbable implants for sale in Japan through Senko Medical Trading Company (“Senko”), which has exclusive distribution rights to these products in Japan. We measure the success of each operating segment based on operating profits and losses and, additionally, in the case of the regenerative cell technology segment, the achievement of key research objectives. In arriving at our operating results for each segment, we use the same accounting policies as those used for our consolidated company and as described throughout this note. However, segment operating results exclude allocations of company-wide general and administrative costs, restructuring charges and changes in fair value of our option liabilities. Prior year results presented below have been developed on the same basis as the current year amounts. For all periods presented, we did not have any intersegment transactions. The following tables provide information regarding the performance and assets of our operating segments:
Total operating loss $ (25,855,000 ) $ (27,999,000 ) $ (16,063,000 )
As of December 31, 2006 2005 Assets: Regenerative cell technology $ 9,792,000 $ 9,152,000 MacroPore Biosurgery 1,758,000 2,206,000 Corporate assets 13,318,000 16,808,000 Total assets $ 24,868,000 $ 28,166,000
-64-
We derived our revenues from the following products, research grants, development and service activities:
The following table provides geographical information regarding our sales to external customers:
At December 31, 2006 and 2005, our long-lived assets, excluding goodwill and intangibles (all of which are domiciled in the U.S.), are located in the following jurisdictions:
Table of Contents
Years ended December 31, 2006 2005 2004 Regenerative cell technology: Development revenues:
Milestone revenue (Olympus) $ 5,905,000 $ — $ — Research grant (NIH) 310,000 312,000 328,000 Regenerative cell storage services 7,000 8,000 10,000 Other 102,000 — —
U.S. Domiciled Total 2006 $ 4,995,000 $ 208,000 $ 5,203,000 2005 $ 4,539,000 $ 179,000 $ 4,718,000
-65-
Loss Per Share We compute loss per share based on the provisions of SFAS No. 128, “Earnings Per Share.” Basic per share data is computed by dividing net income or loss available to common stockholders by the weighted average number of common shares outstanding during the period. Diluted per share data is computed by dividing net income or loss available to common stockholders by the weighted average number of common shares outstanding during the period increased to include, if dilutive, the number of additional common share equivalents that would have been outstanding if potential common shares had been issued using the treasury stock method. Potential common shares were related entirely to outstanding but unexercised option awards and warrants for all periods presented. We have excluded all potentially dilutive securities from the calculation of diluted loss per share attributable to common stockholders for the years ended December 31, 2006, 2005 and 2004, as their inclusion would be antidilutive. Potentially dilutive common shares excluded from the calculations of diluted loss per share were 5,934,029, 7,984,741, and 5,023,796 for the years ended December 31, 2006, 2005 and 2004, respectively. Potential common shares in 2005 include a now-expired option to purchase 2,200,000 shares related to the Olympus equity agreement (see note 4). Recent Accounting Pronouncements In February 2006, the FASB issued Statement of Financial Accounting Standards No. 155, “Accounting for Certain Hybrid Instruments - An Amendment of FASB Statements Nos. 133 and 140” (“SFAS 155”). SFAS 155 allows companies to elect an accounting policy choice for so-called “hybrid instruments.” A hybrid instrument is a contract that contains one or more embedded derivatives. In many cases, Statement of Financial Accounting Standards No. 133, “Accounting for Derivative Instruments and Hedge Accounting” (“SFAS 133”) requires that an embedded derivative be separated from the “host contract” and accounted for at fair value in the financial statements. SFAS 155 removes the mandatory requirement to bifurcate an embedded derivative if the holder elects to account for the entire instrument - that is, both the host contract and the embedded derivative - at fair value, with subsequent changes in fair value recognized in earnings. SFAS 155 is effective for all hybrid instruments acquired or issued on or after September 15, 2006 and may be applied to hybrid financial instruments that had been bifurcated under SFAS 133 in the past. The adoption of SFAS 155 did not have a significant effect on our financial statements. In June 2006, the FASB issued Interpretation No. 48, “Accounting for Uncertainty in Income Taxes” (“FIN 48”). This is an interpretation of Statement of Financial Accounting Standards No. 109, “Accounting for Income Taxes. It prescribes a recognition threshold and measurement attribute for the financial statement recognition and measurement of a tax position taken or expected to be taken in a tax return. FIN 48 also provides guidance on derecognition, classification, interest and penalties, accounting in interim periods, disclosure and transition. This interpretation is effective for fiscal years beginning after December 15, 2006. We do not believe that the adoption of FIN 48 will have a significant effect on our financial statements. In June 2006, the FASB ratified the consensus reached by the Emerging Issues Task Force on Issue No. 06-3, “How Sales Taxes Collected From Customers and Remitted to Governmental Authorities Should Be Presented in the Income Statement” (“EITF 06-3”). EITF 06-3 requires a company to disclose its accounting policy (i.e. gross vs. net basis) relating to the presentation of taxes within the scope of EITF 06-3. Furthermore, for taxes reported on a gross basis, an enterprise should disclose the amounts of those taxes in interim and annual financial statements for each period for which an income statement is presented. The guidance is effective for all periods beginning after December 15, 2006. We do not expect the adoption of EITF 06-3 to have a significant effect on our financial statements. In September 2006, the SEC issued Staff Accounting Bulletin No. 108, “Considering the Effects of Prior Year Misstatements when Quantifying Misstatements in Current Year Financial Statements” (“SAB 108”). SAB 108 provides interpretive guidance on how the effects of prior-year uncorrected misstatements should be considered when quantifying misstatements in the current year financial statements. SAB 108 requires registrants to quantify misstatements using both an income statement (“rollover”) and balance sheet (“iron curtain”) approach and evaluate whether either approach results in a misstatement that, when all relevant quantitative and qualitative factors are considered, is material. If prior year errors that had been previously considered immaterial now are considered material based on either approach, no restatement is required so long as management properly applied its previous approach and all relevant facts and circumstances were considered. If prior years are not restated, the cumulative effect adjustment is recorded in opening accumulated earnings (deficit) as of the beginning of the fiscal year of adoption. SAB 108 is effective for fiscal years ending on or after November 15, 2006, with earlier adoption encouraged. The adoption of SAB 108 has not had a significant effect on our financial statements. In September 2006, the FASB issued SFAS No. 157, “Fair Value Measurements” (“SFAS 157”). SFAS 157 defines fair value, establishes a framework for measuring fair value and expands disclosure of fair value measurements. SFAS 157 applies under other accounting pronouncements that require or permit fair value measurements and accordingly, does not require any new fair value measurements. SFAS
Table of Contents
157 is effective for financial statements issued for fiscal years beginning after November 15, 2007. We do not believe that the adoption of SFAS 157 will have a significant effect on our financial statements.
-66-
3. Assets Held for Sale
We have begun to focus our efforts exclusively on the regenerative cell therapy segment of our business. As a result, in 2006, the Board of Directors decided to divest and is actively seeking a buyer (or buyers) for our remaining MacroPore Biosurgery assets as a means to fund our continuing efforts in our regenerative cell therapy segment. This decision is based on the change in our strategic focus as well as the continuing negative profit margins being realized from the MacroPore Biosurgery segment. We expect to complete the disposal no later than the third quarter of 2007. As of December 31, 2006, the remaining assets were comprised of machinery and equipment used for manufacturing, with a net book value of $457,000.
4. Transactions with Olympus Corporation
Initial Investment by Olympus Corporation in Cytori In the second quarter of 2005, we entered into a Common Stock Purchase Agreement (the “Purchase Agreement”) with Olympus in which we received $11,000,000 in cash proceeds. Under this agreement, we issued 1,100,000 newly issued shares of common stock to Olympus. We reflected the common stock issued to Olympus in our financial statements at the market value of our common stock at the time of the Purchase Agreement ($2.73 per share, or $3,003,000 in the aggregate). In addition, we also granted Olympus an immediately exercisable option to acquire 2,200,000 shares of our common stock at $10 per share, which expired on December 31, 2006. Before its expiration, we accounted for this grant as a liability in accordance with EITF 00-19, “Accounting for Derivative Financial Instruments Indexed to, and Potentially Settled in, a Company's Own Stock” because from the date of grant through the expiration, we would have been required to deliver listed common stock to settle the option shares upon exercise. At the time we entered into the Purchase Agreement, we estimated the fair value of the option liability to be $186,000 based on the following assumptions:
As of December 31, 2006 and December 31, 2005, we re-estimated the fair value of the option liability to be $0 and $3,731,000, respectively, based on the following assumptions:
The decrease in the fair value by $3,731,000 for the year ended December 31, 2006 and the increase in the fair value by $3,545,000 for the year ended December 31, 2005 were recorded in the statements of operations as a component of change in fair value of option liabilities. The decrease in 2006 was attributable to the expiration of the option. The $11,000,000 in total proceeds we received in the second quarter of 2005 exceeded the sum of (i) the market value of our stock as well as (ii) the fair value of the option at the time we entered into the share purchase agreement. The $7,811,000 difference between the proceeds received and the fair values of our common stock and option liability is recorded as a component of deferred revenues, related party in the accompanying balance sheet. In August 2006, we received an additional $11,000,000 from Olympus for the issuance of approximately 1,900,000 shares of our common stock at $5.75 per share under the shelf registration statement filed in May 2006. The purchase price was determined by our closing price on August 9, 2006. As of December 31, 2006, Olympus holds approximately 16.08% of our issued and outstanding shares. Additionally, Olympus has a right, which it has not yet exercised, to designate a director to serve on our Board of Directors.
Table of Contents
• Contractual term of 1.67 years,
• Risk-free interest rate of 3.46%, and
• Estimated share-price volatility of 59.7%
• Contractual term of 0 years and 1 year,
• Risk-free interest rate of 0% and 4.38%, and
• Estimated share-price volatility of 0% and 65.1%, respectively.
Formation of the Olympus-Cytori Joint Venture On November 4, 2005, we entered into a joint venture and other related agreements (the “Joint Venture Agreements”) with Olympus. The Joint Venture is owned equally by Olympus and us.
-67-
Under the Joint Venture Agreements:
As a result of the $30,000,000 cash contribution to the Joint Venture by Olympus, we realized an immediate appreciation in the carrying value of our interests in the Joint Venture. As a result, we reported accretion of interests in the Joint Venture of $3,829,000 as a credit directly to additional paid-in capital in the fourth quarter of 2005. This accounting treatment is required by Securities and Exchange Commission Staff Accounting Bulletin No. 51, “Accounting for Sales of Stock by a Subsidiary,” which prohibits gains from equity transactions (in this case, the non-cash accretion of the interests held in an investment issuing additional shares to another shareholder) when such entity is a “newly-formed, non-operating entity” or a “research and development stage company.”
We have determined that the Joint Venture is a variable interest entity (“VIE”) pursuant to FASB Interpretation No. 46 (revised 2003), “Consolidation of Variable Interest Entities - An Interpretation of ARB No. 51” (“FIN 46R”), but that Cytori is not the VIE’s primary beneficiary. Accordingly, we have accounted for our interests in the Joint Venture using the equity method of accounting, since we can exert significant influence over the Joint Venture’s operations. At December 31, 2006, the carrying value of our investment in the Joint Venture is $76,000. We are under no obligation to provide additional funding to the Joint Venture, but may choose to do so. In the first quarter of 2006, we contributed $150,000 to the Joint Venture.
Put/Calls and Guarantees The Shareholders’ Agreement between Cytori and Olympus provides that in certain specified circumstances of insolvency or if we experience a change in control, Olympus will have the rights to (i) repurchase our interests in the Joint Venture at the fair value of such interests or (ii) sell its own interests in the Joint Venture to Cytori at the higher of (a) $22,000,000 or (b) the Put’s fair value. As of November 4, 2005, the fair value of the Put was determined to be $1,500,000. At December 31, 2006 and 2005, the fair value of the Put was $900,000 and $1,600,000, respectively. Fluctuations in the Put value are recorded in the statements of operations as a component of change in fair value of option liabilities. The Put value itself, which is perpetual, has been recorded as a long-term liability in the caption option liabilities in the balance sheet. The valuations of the Put were completed by an independent valuation firm using an option pricing theory based simulation analysis (i.e., a Monte Carlo simulation). The valuations are based on assumptions as of the valuation date with regard to the market value of Cytori and the estimated fair value of the Joint Venture, the expected correlation between the values of Cytori and the Joint Venture, the expected volatility of Cytori and the Joint Venture, the bankruptcy recovery rate for Cytori, the bankruptcy threshold for Cytori, the probability of a change of control event for Cytori, and the risk free interest rate. The following assumptions were employed in estimating the value of the Put:
Table of Contents
• Olympus paid $30,000,000 for its 50% interest in the Joint Venture. Moreover, Olympus simultaneously entered into a License/Joint Development Agreement with the Joint Venture and us to develop a second generation commercial system and manufacturing capabilities.
• We licensed our device technology, including the Celution™ System and certain related intellectual property, to the Joint Venture for use in future generation devices. These devices will process and purify adult stem and regenerative cells residing in adipose (fat) tissue for various therapeutic clinical applications. In exchange for this license, we received a 50% interest in the Joint Venture, as well as an initial $11,000,000 payment from the Joint Venture; the source of this payment was the $30,000,000 contributed to the Joint Venture by Olympus. Moreover, upon receipt of a CE mark for the first generation Celution™ System in January 2006, we received an additional $11,000,000 development milestone payment from the Joint Venture.
December 31, 2006
December 31, 2005
November 4, 2005
Expected volatility of Cytori 66.00 % 63.20 % 63.20 % Expected volatility of the Joint Venture 56.60 % 69.10 % 69.10 % Bankruptcy recovery rate for Cytori 21.00 % 21.00 % 21.00 % Bankruptcy threshold for Cytori $ 10,110,000 $ 10,780,000 $ 10,780,000 Probability of a change of control event for Cytori 1.94 % 3.04 % 3.04 % Expected correlation between fair values of Cytori and the Joint Venture in the future 99.00 % 99.00 % 99.00 %
Risk free interest rate 4.71 % 4.39 % 4.66 %
-68-
The Put has no expiration date. Accordingly, we will continue to recognize a liability for the Put and mark it to market each quarter until it is exercised or until the arrangements with Olympus are amended. The Joint Venture has exclusive access to our technology for the development, manufacture, and supply of the devices (second generation and beyond) for all therapeutic applications. Once a second generation Celution™ System is developed and approved by regulatory agencies, the Joint Venture may sell such systems exclusively to us at a formula-based transfer price; we have retained marketing rights to the second generation devices for all therapeutic applications of adipose stem and regenerative cells. As part of the various agreements with Olympus, we will be required, following commercialization of the Celution™ System, to provide monthly forecasts to the Joint Venture specifying the quantities of each category of devices that we intend to purchase over a rolling six-month period. Although we are not subject to any minimum purchase requirements, we are obliged to buy a minimum percentage of the products forecasted by us in such reports. Since we can effectively control the number of devices we will agree to purchase and because no commercial devices have yet been developed to trigger the forecast requirement, we estimate that the fair value of this guarantee is de minimis as of December 31, 2006. Deferred revenues, related party As of December 31, 2006, the deferred revenues, related party account primarily consists of the consideration we have received in exchange for future services that we have agreed to perform on behalf of Olympus and the Joint Venture. These services include completing pre-clinical and clinical studies, product development and seeking regulatory approval for the treatment of various therapeutic conditions with adult stem and regenerative cells residing in adipose (fat) tissue. These services also include providing an exclusive and perpetual license to our device technology, including the Celution™ System and certain related intellectual property. Pursuant to EITF 00-21, we have concluded that the license and development services must be accounted for as a single unit of accounting. Refer to note 2 for a full description of our revenue recognition policy. Other Related Party Transactions As part of the formation of the Joint Venture and as discussed above, the Joint Venture agreed to purchase development services from Olympus. In December 2005, the Joint Venture paid to Olympus $8,000,000 as a payment for those services. The payment has been recognized in its entirety as an expense on the books and records of the Joint Venture as the expenditure represents a payment for research and development services that have no alternative future uses. Our share of this expense has been reflected within the account, Equity loss from investment in joint venture, within the consolidated statement of operations for the year ended December 31, 2005. Condensed financial information for the Joint Venture A summary of the unaudited condensed financial information for the Joint Venture as of December 31, 2006 and 2005 and for the period from January 1, 2006 to December 31, 2006 and November 4, 2005 (inception) to December 31, 2005 is as follows:
Total liabilities and stockholders’ equity $ 188,000 $ 11,000,000
Period from January 1,
2006 to
Period from November 4,
2005 (inception) to
December 31,
2006 December 31,
2005 Statement of Operation
Research and development expense $ 11,000,000 $ 19,343,000 General and administrative expense 174,000 —
Net loss $ (11,174,000 ) $ (19,343,000 )
-69-
5. Gain on Sale of Assets, Related Party
In January 2004, we received a $5,000,000 milestone payment from Medtronic relating to the 2002 disposition of our CMF product line. As part of the disposition arrangement, we had agreed to complete clinical research regarding Faster Resorbable Polymers, an area that directly relates to the CMF product line transferred to Medtronic. We became entitled to the $5,000,000 payment after fulfilling the research requirements set out in the CMF sale agreement. The $5,000,000 payment was recognized during the first half of 2004 as gain on sale of assets, related party in the accompanying statement of operations. During the third quarter of 2004, we completed all remaining performance obligations related to the 2002 sale of the CMF product line to Medtronic. Accordingly, we recorded $7,383,000 as a component of gain on sale of assets, related party, representing the remaining balance that had theretofore been reported as deferred gain on sale of assets, related party. Pursuant to the sale of the CMF product line, we were obliged to transfer certain “know-how,” including manufacturing processes, patents, and other intellectual property, to Medtronic. If such know-how was transferred within a certain time frame defined in the CMF Asset Purchase Agreement dated September 30, 2002 (the “APA”), we would become entitled to a $2,000,000 milestone payment. In the second quarter of 2004, we provided notice to Medtronic that the requisite know-how associated with the transferred CMF product line had been transferred, pursuant to the terms of, and within the timeframe specified by, the APA. Medtronic did not agree that know-how transfer had been completed and asserted that, in any case, that the maximum payment due to us was $1,000,000 rather than $2,000,000. To avoid the risk and expense of arbitration, in the third quarter of 2004 we agreed to accept a negotiated settlement with Medtronic in the amount of $1,500,000 related to the know-how transfer. The $1,500,000 payment was recognized as gain on sale of assets, related party in 2004. Accordingly, the total gain on sale of assets, related party, recognized in 2004 was $13,883,000.
6. Gain on Sale of Assets, Thin Film Product Line
In May 2004, we sold most, but not all, of our intellectual property rights and tangible assets related to our Thin Film product line to MAST (see note 7). The carrying value of the assets transferred to MAST prior to disposition totaled $634,000, and was comprised of the following:
Under this agreement we were contractually entitled to the following additional consideration (none of this consideration has been recognized in the financial statements):
MAST did not make the payments specified above. Therefore, on June 14, 2005, we initiated arbitration proceedings against MAST, asserting that MAST was in breach of the Asset Purchase Agreement by failing to pay the final $2,000,000 in purchase price (among other issues). MAST responded asserting its own claims on or about June 23, 2005. MAST’s claims included but were not limited to the
Table of Contents
• Finished goods inventory of $177,000,
• Manufacturing and development equipment of $217,000, and
• Goodwill of $240,000.
• $200,000, payable only upon receipt of 510(k) clearance from the U.S. Food and Drug Administration (“FDA”) for a hernia wrap product (thin film combined product); and
• $2,000,000 on or before the earlier of (i) May 31, 2005, known as the “Settlement Date,” or (ii) 15 days after the date upon which MAST has hired a Chief Executive Officer (“CEO”), provided the CEO held that position for at least four months and met other requirements specified in the sale agreement. Note that clause (ii) effectively means that we would not have received payment of $2,000,000 before May 31, 2005 unless MAST had hired a CEO on or before January 31, 2005 (four months prior to the Settlement Date). Moreover, in the event that MAST had not hired a CEO on or before January 31, 2005, MAST may have (at its sole option and subject to the requirements of the sale agreement) alternatively provided us with a 19% equity interest in the MAST business that is managing the Thin Film assets at May 31, 2005 in lieu of making the $2,000,000 payment. Our contention was that MAST did in fact hire a CEO on or before January 31, 2005, and thus, we were entitled to a $2,000,000 cash payment on or before May 31, 2005.
following allegations: (i) we inadequately transferred know-how to MAST, (ii) we misrepresented the state of the distribution network, (iii) we provided inadequate product instructions to users, and (iv) we failed to adequately train various distributors. In August 2005, the parties settled the arbitration proceedings and gave mutual releases of all claims, excepting those related to the territory of Japan, and agreed to contractual compromises, the most significant of which is our waiving of the obligation for MAST to either pay the final cash purchase installment of $2,000,000 or to deliver 19% of its shares. Moreover, if MAST exercises its Purchase Right (see note 7) and Thin Film products are marketed in Japan, MAST would no longer be obliged to share certain gross profits and royalties with us. In exchange, MAST agreed to supply - at no cost to us - all required product for any necessary clinical study for the territory of Japan and to cooperate in the planning of such study. However, if MAST exercises its Purchase Right or if we enter into a supply agreement with MAST for the territory of Japan, we would be obliged to reimburse MAST for any Thin Film product supplied in connection with the Japanese study at a cost of $50 per sheet. As a result of the arbitration settlement, we recognized the remaining deferred gain on sale of assets of $5,650,000, less $124,000 of related deferred costs, in the statement of operations in the third quarter of 2005.
-70-
7. Thin Film Japan Distribution Agreement
In the third quarter of 2004, we entered into a Distribution Agreement with Senko. Under this agreement, we granted to Senko an exclusive license to sell and distribute certain Thin Film products in Japan. Specifically, the license covers Thin Film products with the following indications:
The Distribution Agreement with Senko commences upon “commercialization.” In simplest terms, commercialization occurs when one or more Thin Film product registrations are completed with the MHLW. Following commercialization, the Distribution Agreement has a duration of five years and is renewable for an additional five years after reaching mutually agreed minimum purchase guarantees. The Distribution Agreement also provides for us to supply certain products to Senko at fixed prices over the life of the agreement once we have received approval to market these products in Japan. In addition to the product price, Senko will also be obligated to make royalty payments to us of 5% of the sales value of any products Senko sells to its customers during the first three years post-commercialization. At the inception of this arrangement, we received a $1,500,000 license fee which was recorded as deferred revenues in 2004. We have also received $1,250,000 in milestone payments from Senko. See “Revenue Recognition” under note 2 above for our policies with regard to the timing of when these amounts will be recognized as revenues. As part of the Thin Film sales agreement (see note 6), we granted MAST a right to acquire our Thin Film-related interest in Japan (the “Purchase Right”) during the time period and according to the following terms:
We have agreed to provide back-up supply of products to Senko subject to the terms of the Distribution Agreement in the event that (a) MAST exercises its Purchase Right and (b) MAST materially fails to deliver product to Senko. In this circumstance, Senko would pay any amounts due for purchases of product, as well as make royalty payments directly to us. We would be obliged to remit 5% of the gross margin to MAST on any products sold to Senko. We believe that it is unlikely in practice that this contingency will materialize. Accordingly, we estimate the fair value of this guarantee to be de minimis as of the end of the current reporting period.
Table of Contents
• Anti-adhesion,
• Soft tissue support, and
• Minimization of the attachment of soft tissues throughout the body.
• From May 31, 2005 to May 31, 2007, the exercise price of the Purchase Right will be equal to the fair market value of the Japanese business, but in no event will be less than $3,000,000.
• Moreover, between May 31, 2005 and May 31, 2007, MAST will have a right of first refusal to match the terms of any outside offer to buy our Japanese Thin Film business.
-71-
8. Short-term Investments
As of December 31, 2006 and 2005, all short-term investments were classified as available-for-sale, which consisted of the following:
As of December 31, 2006 and 2005, investments available-for-sale had the following maturities:
Proceeds from sales and maturity of short term investments for the year ended December 31, 2006, 2005 and 2004 were $67,137,000, $56,819,000, and $51,132,000, respectively. Gross realized losses for such sales in 2006 were approximately $1,000. Gross realized losses for such sales in 2005 were approximately $12,000. Gross realized gains on such sales in 2004 were approximately $4,000. Based on our ability and intent to hold the investments for a reasonable period of time sufficient for a forecasted recovery of fair value and the low severity of impairment, we do not consider these investments to be other-than-temporarily impaired as of December 31, 2006.
Table of Contents
December 31, 2006
Less than 12 months
temporary impairment Greater than 12 months temporary impairment Total
with maturity of less than 1 year $ 599,000 $ 599,000 $ 1,984,000 $ 1,982,000
with maturity of 1 to 2 years — — — — Agency securities:
with maturity of less than 1 year 3,377,000 3,377,000 5,870,000 5,856,000 with maturity of 1 to 2 years — — — —
$ 3,976,000 $ 3,976,000 $ 7,854,000 $ 7,838,000
-72-
9. Composition of Certain Financial Statement Captions Inventories, net As of December 31, 2006 and 2005, inventories, net, were comprised of the following:
Other Current Assets As of December 31, 2006 and 2005, other current assets were comprised of the following:
Property and Equipment, net As of December 31, 2006 and 2005, property and equipment, net, were comprised of the following:
Accounts Payable and Accrued Expenses As of December 31, 2006 and 2005, accounts payable and accrued expenses were comprised of the following:
Table of Contents
December 31, December 31, 2006 2005 Raw materials $ 136,000 $ 232,000 Finished goods 28,000 26,000 $ 164,000 $ 258,000
December 31, December 31, 2006 2005 Prepaid expenses $ 648,000 $ 506,000 Accrued interest receivable 19,000 77,000 Other receivables 44,000 38,000 $ 711,000 $ 621,000
December 31, December 31, 2006 2005 Manufacturing and development equipment $ 2,980,000 $ 4,681,000 Office and computer equipment 2,653,000 2,682,000 Leasehold improvements 3,085,000 3,359,000 8,718,000 10,722,000 Less accumulated depreciation and amortization (4,476,000 ) (6,462,000 )
We have contractual obligations to make payments on leases of office and manufacturing space as follows:
On May 24, 2005, we entered into a lease for 91,000 square feet of space located at 3020 and 3030 Callan Road, San Diego, California. The majority of our operations are located in this facility. The agreement bears monthly rent at an initial rate of $1.15 per square foot, with annual increases of 3%. The lease term is 57 months, commencing on October 1, 2005 and expiring on June 30, 2010. Payments for our Callan Road location commenced in June 2006. The lease contains a provision whereby we could be required to remove some or all of the leasehold improvements we have constructed at the end of the lease term. We believe the costs that could be incurred pursuant to this provision would be immaterial, and therefore we have not recorded a liability for them as of December 31, 2006. We also have a facility located at 6740 Top Gun Street, San Diego, California. Until it was amended and terminated on December 31, 2006, we leased approximately 27,000 square feet of space at this location of which approximately 6,000 square feet was laboratory space, 12,000 square feet was office space and 9,000 square feet was manufacturing space. We will continue to occupy a portion of the building and pay rent to the new lessee until June 30, 2007. We also lease:
Rent expense, which includes common area maintenance, for the years ended December 31, 2006, 2005 and 2004 was $2,397,000, $1,632,000 and $801,000, respectively. We have entered into agreements with various clinical research organizations for pre-clinical and clinical development studies, which have provisions for cancellation. Under the terms of these agreements, the vendors provide a variety of services including conducting pre-clinical development research, enrolling patients, recruiting patients, monitoring studies and data analysis. Payments under these agreements typically include fees for services and reimbursement of expenses. The timing of payments due under these agreements was estimated based on current schedules of pre-clinical and clinical studies in progress. As of December 31, 2006, we have pre-clinical research study obligations of $902,000 (all of which are expected to be complete within a year) and clinical research study obligations of $6,631,000 ($4,796,000 of which are expected to be complete within a year). We are subject to various claims and contingencies related to legal proceedings. Due to their nature, such legal proceedings involve inherent uncertainties including, but not limited to, court rulings, negotiations between affected parties and governmental actions. Management assesses the probability of loss for such contingencies and accrues a liability and/or discloses the relevant circumstances, as appropriate. Management believes that any liability to us that may arise as a result of currently pending legal proceedings will not have a material adverse effect on our financial condition, liquidity, or results of operations as a whole. Refer to note 11 for a discussion of our commitments and contingencies related to our interactions with the University of California. Refer to note 4 for a discussion of our commitments and contingencies related to our transactions with Olympus, including (a) our obligation to the Joint Venture in future periods and (b) certain put and call rights embedded in the arrangements with Olympus. Refer to note 7 for a discussion of our commitments and contingencies related to our arrangements with MAST and Senko.
• 16,000 additional square feet for research and development activities located at 6749 Top Gun Street, San Diego, California that has been amended to terminate on April 30, 2007.
• 4,027 square feet of office space located at 9-3 Otsuka 2-chome, Bunkyo-ku, Tokyo, Japan. The agreement bears rent at a rate of $3.66 per square foot, for a term of two years expiring on November 30, 2007.
-74-
11. License Agreement
On October 16, 2001, StemSource, Inc. entered into an exclusive worldwide license agreement with the Regents of the University of California (“UC”), licensing all of UC’s rights to certain pending patent applications being prosecuted by UC and (in part) by the University of Pittsburgh, for the life of these patents, with the right of sublicense. The exclusive license relates to an issued patent (“Patent 6,777,231”) and various pending applications relating to adipose derived stem cells. In November 2002, we acquired StemSource, and the license agreement was assigned to us. The agreement, which was amended and restated in September 2006 to better reflect our business model, calls for various periodic payments until such time as we begin commercial sales of any products utilizing the licensed technology. Upon achieving commercial sales of products or services covered by the UC license agreement, we will be required to pay variable earned royalties based on the net sales of products sold. Minimum royalty amounts will increase annually with a plateau in the fourth year. In addition, there are certain due diligence milestones that are required to be reached as a result of the agreement. Failure to fulfill these milestones may result in a reduction of or loss of the specific rights to which the effected milestone relates. In connection with the amendment of the agreement in the third quarter of 2006, we agreed to issue 100,000 shares of our common stock to UC in the fourth quarter of 2006. At the time the agreement was reached, our shares were trading at $4.87 per share. The expense was charged to general and administrative expense. Additionally, we are obligated to reimburse UC for patent prosecution and other legal costs on any patent applications contemplated by the agreement. In particular, the University of Pittsburgh filed a lawsuit in the fourth quarter of 2004, naming all of the inventors who had not assigned their ownership interest in Patent 6,777,231 to the University of Pittsburgh. It was seeking a determination that its assignors, rather than UC’s assignors, are the true inventors of Patent 6,777,231. This lawsuit has subjected us to and could continue to subject us to significant costs and, if the University of Pittsburgh wins the lawsuit, our license rights to this patent could be nullified or rendered non-exclusive with respect to any third party that might license rights from the University of Pittsburgh. Accordingly, it could have a negative effect on us if the University of Pittsburgh were to win the lawsuit. We are not named as a party to the lawsuit but our president, Marc Hedrick, is one of the inventors identified on the patent and therefore is a named individual defendant. We are providing substantial financial and other assistance to the defense of the lawsuit. In the years ended December 31, 2006, 2005 and 2004, we expensed $2,189,000, $1,303,000 and $190,000, respectively, for legal fees related to this license. These expenses have been classified as general and administrative expense in the accompanying consolidated financial statements. We believe that the amount accrued as of December 31, 2006 is a reasonable estimate of our liability for the expenses incurred to date. We reimbursed UC for $240,000 in the second quarter of 2006 for legal fees incurred related to this patent prosecution.
12. Restructuring Event
In September 2003, we closed an administrative office in Königstein, Germany in an effort to reduce costs and consolidate operations in the United States. The Königstein, Germany office was rented under an operating lease. As of September 30, 2003, we ceased using the office space, but continued to remain liable for monthly rent payments of approximately $12,500 per month under a lease agreement that would have expired in February 2006. We sought to sublease the entire facility for the remaining term of the lease agreement. However, due to the unique nature of the office building and the depressed rental market in and around Frankfurt, Germany, we originally expected that a sublease of the entire facility in 2003 would yield approximately 65% of our monthly rental obligation if successfully negotiated. In the second quarter of 2004, we re-assessed the expected range of probable sublease rates and determined that we could potentially sublease the entire facility (if one was successfully negotiated) for only 45% of our current monthly rental obligation and recorded additional restructuring expense of $70,000. In the third quarter of 2004, we negotiated a settlement of the remaining lease payments with the lessor and as a result, recorded additional restructuring expense of $37,000. The following outlines the restructuring activity recorded to the liability account during the year ended December 31, 2004:
________________________________________ * All amounts recorded as Restructuring charge in the accompanying statements of operations. ** Revaluation of monetary liability denominated in a foreign currency, which was charged to other income (expense)
during the period.
-75-
13. Long-term Obligations
In 2003, we entered into an Amended Master Security Agreement to provide financing for new equipment purchases. In connection with the agreement, we issued three promissory notes to our lender in an aggregate principal amount of approximately $1,120,000. In 2004, we issued three additional promissory notes in an aggregate principal amount of approximately $1,039,000 and in 2005, we issued one additional promissory note for an amount of approximately $1,380,000. Our newest promissory note, with approximately $600,000 in principal, was executed in December 2006. All notes are secured by equipment with an aggregate cost of approximately $4,139,000. Additional details relating to the above promissory notes are presented in the following table:
________________________________________ * Includes principal and interest
As of December 31, 2006, the future contractual principal payments on all of our promissory notes are as follows:
Our interest expense for the years ended December 31, 2006, 2005 and 2004 (all of which related to these promissory notes) was $199,000, $137,000 and $177,000, respectively.
Table of Contents
Origination Date
Interest Rate
Current Monthly
Payment* Term Remaining Principal
October 2003 8.6 % 6,000 48 Months $ 54,000 October 2003 8.8 % 12,000 48 Months 122,000 March 2004 8.2 % 16,000 48 Months 166,000 April 2004 9.0 % 3,000 48 Months 44,000 September 2004 9.0 % 9,000 48 Months 130,000 December 2005 10.75 % 42,000 35 Months 1,042,000 December 2006 11.05 % 20,000 36 Months 600,000 $ 2,158,000
Years Ending December 31, 2007 $ 999,000 2008 741,000 2009 399,000 2010 19,000 Total $ 2,158,000
-76-
14. Income Taxes
Due to our net loss position for the years ended December 31, 2006, 2005 and 2004, and since we have recorded a full valuation allowance against deferred tax assets, there was no provision or benefit for income taxes recorded. There were no components of current or deferred federal or state income tax provisions for the years ended December 31, 2006, 2005, and 2004. A reconciliation of the total income tax provision tax rate to the statutory federal income tax rate of 34% for the years ended December 31, 2006, 2005 and 2004 is as follows:
The tax effects of temporary differences that give rise to significant portions of the deferred tax assets and deferred tax liabilities as of December 31, 2006 and 2005 are as follows:
We have established a valuation allowance against our net deferred tax asset due to the uncertainty surrounding the realization of such assets. Management periodically evaluates the recoverability of the deferred tax asset. At such time as it is determined that it is more likely than not that deferred assets are realizable, the valuation allowance will be reduced. We have recorded a valuation allowance of $38,505,000 as of December 31, 2006 to reflect the estimated amount of deferred tax assets that may not be realized. We increased our valuation allowance by approximately $10,675,000 for the year ended December 31, 2006. The valuation allowance includes approximately $579,000 related to stock option deductions, the benefit of which will be credited to equity if ever utilized. At December 31, 2006, we had federal and state tax net operating loss carryforwards of approximately $57,515,000 and $50,529,000, respectively. The federal and state net operating loss carryforwards begin to expire in 2019 and 2007, respectively, if unused. At December
Table of Contents
2006 2005 2004 Income tax expense (benefit) at federal statutory rate (34.00 )% (34.00 )% (34.00 )% Stock based compensation 0.99 % 0.05 % 1.54 % Credits (2.72 )% (0.59 )% (3.58 )% Change in federal valuation allowance 34.52 % 23.46 % 31.05 % Equity loss on investment in Joint Venture 0.12 % 5.35 — Gain on intangible property —% 4.74 — Other, net 1.09 % 0.99 % 4.99 %
0.00 % 0.00 % 0.00 %
2006 2005 Deferred tax assets:
Allowances and reserves $ 163,000 $ 190,000 Accrued expenses 625,000 275,000 Deferred revenue and gain on sale of assets 7,971,000 5,784,000 Stock based compensation 1,933,000 1,604,000 Net operating loss carryforwards 24,410,000 17,917,000 Income tax credit carryforwards 3,201,000 2,195,000 Capitalized assets and other 720,000 435,000
Total deferred tax assets, net of allowance 518,000 570,000
Deferred tax liabilities:
Property and equipment, principally due to differences in depreciation — 174,000 Intangibles (518,000 ) (738,000 ) Other — (6,000 )
Total deferred tax liability (518,000 ) (570,000 )
Net deferred tax assets (liability) $ — $ —
31, 2006, we had federal and state tax credit carryforwards of approximately $1,755,000 and $1,445,000, respectively. The federal credits will begin to expire in 2017, if unused, and $160,000 of the state credits will begin to expire in 2009 if unused. The remaining state credits carry forward indefinitely. In addition, we had a foreign tax loss carryforward of $1,741,000 and $179,000 in Japan and the United Kingdom, respectively.
-77-
The Internal Revenue Code limits the future availability of net operating loss and tax credit carryforwards that arose prior to certain cumulative changes in a corporation’s ownership resulting in a change of our control. Due to prior ownership changes as defined in IRC Section 382, a portion of the net operating loss and tax credit carryforwards are limited in their annual utilization. In September 1999, we experienced an ownership change for purposes of the IRC Section 382 limitation. As of December 31, 2006, the remaining 1999 pre-change federal net operating loss carryforward of $400,000 is subject to an annual limitation of approximately $400,000. It is estimated that the pre-change net operating losses and credits will be fully available by 2007. Additionally, in 2002 when we purchased StemSource, we acquired federal and state net operating loss carryforwards of approximately $2,700,000 and $2,700,000, respectively. This event triggered an ownership change for purposes of IRC Section 382. As of December 31, 2006, this remaining pre-change federal and state net operating loss carryforward of $499,000 is subject to an annual limitation of approximately $460,000. It is estimated that the pre-change net operating losses and credits will be fully available by 2008. We have not updated our IRC Section 382 study analysis for the tax year ended December 31, 2006. The extent of any additional limitation, if any, on the availability to use net operating losses and credits, is not known at this time. As a result of the adoption of SFAS 123R, we recognize windfall tax benefits associated with the exercise of stock options directly to stockholders’ equity only when realized. Accordingly, deferred tax assets are not recognized for net operating loss carryforwards resulting from windfall tax benefits occurring from January 1, 2006 onward. At December 31, 2006, deferred tax assets do not include $845,000 of excess tax benefits from stock-based compensation.
15. Employee Benefit Plan
We implemented a 401(k) retirement savings and profit sharing plan (the “Plan”) effective January 1, 1999. We may make discretionary annual contributions to the Plan, which is allocated to the profit sharing accounts based on the number of years of employee service and compensation. At the sole discretion of the Board of Directors, we may also match the participants’ contributions to the Plan. We made no discretionary or matching contributions to the Plan in 2006, 2005 and 2004.
Table of Contents
-78-
16. Stockholders’ Equity
Preferred Stock We have authorized 5,000,000 shares of $.001 par value preferred stock, with no shares outstanding as of December 31, 2006 and 2005. Our Board of Directors is authorized to designate the terms and conditions of any preferred stock we issue without further action by the common stockholders. Treasury Stock On August 11, 2003, the Board of Directors amended the April 3, 2001 authorization to purchase treasury stock and authorized the repurchase of up to 3,000,000 shares of our common stock in the open market, from time to time until August 10, 2004 at a purchase price per share not to exceed €15.00, based on the exchange rate in effect on August 11, 2003. During 2003, we repurchased 614,099 shares of our Common Stock at an average cost of $3.69 per share for a total of $2,266,000. In 2003, we sold 150,500 shares of treasury stock for $542,000 at an average price of $3.60 per share. The basis of the treasury stock sold was the weighted average purchase price or $3.67 per share with the difference of $10,000 accounted for as a reduction to additional paid-in capital. On December 6, 2003, we exchanged 1,447,755 shares of common stock (all listed on the Frankfurt Stock Exchange) held in our treasury for 1,447,755 of our unlisted outstanding common stock issued to former StemSource shareholders. $104,000 was accounted for as a charge against additional paid-in capital relating to the difference between the weighted average purchase price and fair market value of the listed shares held in treasury at the time of the exchange. In 2004, we repurchased 27,650 shares of our common stock for $76,000 on the open market at a price of $2.75 per share. Additionally in 2004, we repurchased 262,602 shares of our common stock for $976,000 from a former director and officer of StemSource at a price of $3.72 per share. Our repurchase program expired on August 10, 2004. We have no plans to initiate a new repurchase program at this time.
17. Stockholders Rights Plan
On May 28, 2003, the Board of Directors declared a dividend distribution of one preferred share purchase right (a “Right”) for each outstanding share of our Common Stock. The dividend is payable to the stockholders of record on June 10, 2003, and with respect to shares of Common Stock issued thereafter until the Distribution Date (as defined below) and, in certain circumstances, with respect to shares of Common Stock issued after the Distribution Date. Except as set forth below, each Right, when it becomes exercisable, entitles the registered holder to purchase from us one one-thousandth (1/1000th) of a share of our Series RP Preferred Stock, $0.001 par value per share (the “Preferred Stock”), at a price of $25.00 per one one-thousandth (1/1000th) of a share of Preferred Stock, subject to adjustment. Each share of the Preferred Stock would entitle the holder to Common Stock with a value of twice that paid for the Preferred Stock. The description and terms of the Rights are set forth in a Rights Agreement (the “Rights Agreement”) between us and Computershare Trust Company, Inc., as Rights Agent, dated as of May 29, 2003, and as amended on May 12, 2005. The Rights attach to all certificates representing shares of our Common Stock outstanding, and are evidenced by a legend on each share certificate, incorporating the Rights Agreement by reference. The Rights trade with and only with the associated shares of the Company’s Common Stock and have no impact on the way in which holders can trade the Company’s shares. Unless the Rights Agreement were to be triggered, it would have no effect on the Company’s balance sheet or income statement and should have no tax effect on the Company or its stockholders. The Rights Agreement is triggered upon the earlier to occur of (i) a person or group of affiliated or associated persons having acquired, without the prior approval of the Board, beneficial ownership of 15% or more of the outstanding shares of Common Stock or (ii) 10 days, or such later date as the Board may determine, following the commencement of or announcement of an intention to make, a tender offer or exchange offer the consummation of which would result in a person or group of affiliated or associated persons becoming an Acquiring Person (as defined in the Rights Agreement) except in certain circumstances (the “Distribution Date”). The Rights are not exercisable until the Distribution Date and will expire at the close of business on May 29, 2013, unless we redeem them earlier.
Table of Contents
-79-
18. Stock-based Compensation During 2004, we adopted the 2004 Equity Incentive Plan (the “2004 Plan”), which provides our employees, directors and consultants the opportunity to purchase our common stock through non-qualified stock options, stock appreciation rights, restricted stock units, or restricted stock and cash awards. The 2004 Plan initially provides for issuance of 3,000,000 shares of our common stock, which number may be cumulatively increased (subject to Board discretion) on an annual basis beginning January 1, 2005, which annual increase shall not exceed 2% of our then outstanding stock. During 1997, we adopted the 1997 Stock Option and Stock Purchase Plan (the “1997 Plan”), which provides for the direct award or sale of shares and for the grant of incentive stock options (“ISOs”) and non-statutory options to employees, directors or consultants. The 1997 Plan, as amended, provides for the issuance of up to 7,000,000 shares of our common stock. The exercise price of ISOs cannot be less than the fair market value of the underlying shares on the date of grant. ISOs can be granted only to employees. Generally, awards issued under the 2004 Plan or the 1997 Plan are subject to four-year vesting, and have a contractual term of 10 years. Most awards contain one of the following two vesting provisions:
A summary of activity for the options under the 2004 and 1997 Plans for the year ended December 31, 2006 is as follows :
The following table summarizes information about options outstanding under the 2004 and 1997 Plans as of December 31, 2006:
Table of Contents
• 25% of a granted award will vest after one year of service, while an additional 1/48 of the award will vest at the end of each month thereafter for 36 months, or
• 1/48 of the award will vest at the end of each month over a four-year period.
Options
Weighted Average Exercise
Price Balance as of January 1, 2006 5,784,741 $ 4.12
The total intrinsic value of stock options exercised was $1,913,000, $1,049,000 and $122,000 for the years ended December 31, 2006, 2005 and 2004, respectively. The fair value of each option awarded during the year ended December 31, 2006 was estimated on the date of grant using the Black-Scholes-Merton option valuation model based on the following weighted-average assumptions:
The expected term assumption was estimated using the “simplified method,” as described in Staff Accounting Bulletin No. 107, “Share-Based Payment” (“SAB 107”). This method estimates the expected term of an option based on the average of the vesting period and the contractual term of an option award. The expected volatility assumption is based on the historical volatility of our common stock since the first day we became publicly traded (August 2000). The weighted average risk-free interest rate represents the interest rate for treasury constant maturity instruments published by the Federal Reserve Board. If the term of available treasury constant maturity instruments is not equal to the expected term of an employee option, we use the weighted average of the two Federal Reserve securities closest to the expected term of the employee option. The dividend yield has been assumed to be zero as we (a) have never declared or paid any dividends and (b) do not currently anticipate paying any cash dividends on our outstanding shares of common stock in the foreseeable future. The following summarizes the total compensation cost recognized in the accompanying financial statements:
As of December 31, 2006, the total compensation cost related to non-vested stock options not yet recognized for all of our plans is approximately $4,123,000. These costs are expected to be recognized over a weighted average period of 1.86 years. In calculating the fair value of option awards granted after January 1, 2006, we generally used the same methodologies and assumptions employed prior to our adoption of SFAS 123R. For instance, our estimate of expected volatility is based exclusively on our historical volatility, since we have granted options that vest purely based on the passage of time and otherwise meet the criteria to exclusively rely on historical volatility, as set out in SAB 107. We did, however, change our policy of attributing the cost of share-based payment awards granted after January 1, 2006 from the “graded vesting approach” to the “straight-line” method. We believe that this change more accurately reflects the manner in which our employees vest in an option award. In connection with convertible bridge financing in 1998 and 1999, we issued warrants to purchase 25,000 shares of our Series C convertible preferred stock. Upon conversion of our outstanding preferred stock in August 2000, the warrants became immediately exercisable into shares of our common stock. As of December 31, 2004, 2,777 of these warrants had been exercised. The remaining 22,223 warrants were exercised in the third quarter of 2005, resulting in cash proceeds to us of approximately $50,000. Cash received from stock option and warrant exercises for the years ended December 31, 2006, 2005 and 2004 was approximately $920,000, $224,000, and $29,000, respectively. SFAS 123R requires that cash flows resulting from tax deductions in excess of the
Table of Contents
Expected term 6 years Risk-free interest rate 4.50 %
Volatility 78.61 %
Dividends — Resulting weighted average grant date fair value
$ 5.26
For the years ended December 31, 2006 2005 2004 Total compensation cost for share-based payment arrangements recognized in the statement of operations (net
of tax of $0)
$ 3,220,000 $ 404,000 $ 128,000 Total compensation cost capitalized as part of the cost of an
asset — — —
cumulative compensation cost recognized for options exercised (excess tax benefits) be classified as cash inflows provided by financing activities and cash outflows used in operating activities. No income tax benefits have been recorded related to the stock option exercises. SFAS 123R prohibits recognition of tax benefits for exercised stock options until such benefits are realized. As we presently have tax loss carryforwards from prior periods and expect to incur tax losses in 2007, we are not able to benefit from the deduction for exercised stock options in the current reporting period. In November 2005, the FASB issued Staff Position (FSP) No. FAS 123(R)-3, “Transition Election Related to Accounting for Tax Effects of Share-Based Payment Awards” (FSP 123R-3). We have elected to adopt the alternative transition method provided in the FSP 123R-3 for calculating the tax effects of stock-based compensation pursuant to SFAS 123R. The alternative transition method includes simplified methods to establish the beginning balance of the APIC pool related to the tax effects of employee stock-based compensation, and to determine the subsequent impact on the APIC pool and Consolidated Statements of Cash Flows of the tax effects of employee stock-based compensation awards that are outstanding upon adoption of SFAS 123R. To settle stock option awards that have been exercised, we will issue new shares of our common stock. At December 31, 2006, we have an aggregate of 76,260,591 shares authorized and available to satisfy option exercises under our plans. Cash used to settle equity instruments granted under share-based payment arrangements amounted to $0 in all periods presented.
-81-
Award Modification In May 2006, our Senior Vice President of Finance and Administration, Treasurer, and Principal Accounting Officer terminated full-time employment with us. In connection with his full-time employment termination, we extended the exercise period of his 204,997 vested stock options as of May 31, 2006 to December 31, 2007. Moreover, we entered into a part-time employment agreement with him according to which all stock option vesting ceased as of May 31, 2006, resulting in the cancellation of 75,003 non-vested stock options on May 31, 2006. In connection with a broader reduction in force, we eliminated the positions of our Senior Vice President, Business Development, and Vice President, Marketing & Development, on July 25, 2006. We subsequently entered into short-term employment agreements with the individuals formerly holding these positions. These individuals continued to provide service to us following the elimination of their former positions on July 25, 2006. At the time these positions were eliminated, 142,686 non-vested stock options held by these two employees were forfeited. Moreover, subject to certain restrictions, we extended the exercise period for 328,564 vested stock options held by these employees to December 31, 2007. We also eliminated the position of a less senior employee on July 31, 2006. Simultaneously, we continued the individual’s employment in a new capacity; however, we cancelled 8,125 non-vested stock options held by this individual on July 31, 2006. In connection with the above modifications and in accordance with SFAS 123R, we recorded additional expense of $567,000 in the year ended December 31, 2006, respectively, as components of research and development, general and administrative and sales and marketing expense. This charge constitutes the entire expense related to these options, and no future period charges will be required.
In August 2005, our Chief Operating Officer (“COO”), ceased employment with us. We paid the former COO a lump sum cash severance payment of $155,164 and extended the post-separation exercise period for two years on 253,743 vested stock options. In addition to the cash severance payment, we recorded stock based compensation expense of $337,000 in the third quarter of 2005, which represents the intrinsic value of the options held by the COO at the date of the modification.
Non-Employee Stock Based Compensation In the first quarter of 2006, we granted 2,500 shares of restricted common stock to a non-employee scientific advisor. Because the shares granted are not subject to additional future vesting or service requirements, the stock based compensation expense of approximately $18,000 recorded in the first quarter of 2006 constitutes the entire expense related to this award, and no future period charges will be required. The stock is restricted only in that it cannot be sold for a specified period of time. There are no vesting requirements. This scientific advisor will also be receiving cash consideration as services are performed. The fair value of the stock granted was $7.04 per share based on the market price of our common stock on the date of grant. There were no discounts applied for the effects of the restriction, since the value of the restriction is considered to be de minimis. The entire charge of $18,000 was reported as a component of research and development expenses.
In the second quarter of 2005, we granted 20,000 shares of restricted common stock to a non-employee scientific advisor. Because the shares granted are not subject to additional future vesting or service requirements, the stock based compensation expense of approximately $63,000 recorded in the second quarter of 2005 as a component of research and development expense constitutes the entire expense related to this grant, and no future period charges will be required. The fair value of the stock granted was $3.15 per share based on the market price of our common stock on the date of grant. The stock is restricted only in that it cannot be sold for a specified period of time. There are no vesting requirements. This scientific advisor will also be receiving cash consideration as services are performed. We issued 10,000 stock options to a non-employee for consulting services for the year ended December 31, 2004. The fair value per share of these stock options was $3.17. As a result, we recorded stock based compensation expense of $32,000 for the year ended December 31, 2004. The expense recorded constitutes the entire expense related to these options, and no future period charges will be required. The fair value of the grant was estimated using the Black-Scholes option-pricing model with the following weighted average assumptions for the year ended December 31, 2004: expected dividend yield of 0.0%, risk-free interest rate of 4.3%, expected volatility factor of 87% and life of 7 years.
Table of Contents
-82-
19. Related Party Transactions
Refer to note 4 for a discussion of related party transactions with Olympus. As of December 31, 2006, Medtronic holds 1,000,000 shares of our common stock, which constitutes approximately 5.34% of our outstanding common stock at December 31, 2006. For the years ended December 31, 2006, 2005 and 2004, we had sales to Medtronic of $1,451,000, $5,634,000 and $4,085,000, respectively, which represented 18.3%, 93.8% and 59.9% of total product and development revenues, respectively. At December 31, 2006, 2005, and 2004, we had gross amounts due from Medtronic of $224,000, $721,000, and $767,000, respectively.
20. Quarterly Information (unaudited)
The following unaudited quarterly financial information includes, in management’s opinion, all the normal and recurring adjustments necessary to fairly state the results of operations and related information for the periods presented.
In February 2007, we entered into a Placement Agency Agreement with Piper Jaffray & Co. (“Piper Jaffray”) pursuant to which Piper Jaffray agreed to act as our placement agent for the offering and sale of shares to certain institutional and accredited investors of units consisting of 3,745,645 shares of common stock and 1,872,823 common stock warrants (with an exercise price of $6.25 per share) for proceeds of approximately $19,700,000, net of agency placement and financial advisor fees and other expenses totaling approximately $1,800,000. The offering was made pursuant to a Form S-3 shelf registration statement and was successfully completed on February 28, 2007. Also in March 2007, we entered into a Common Stock Purchase Agreement to sell 1,000,000 shares of unregistered common stock to Green Hospital Supply, Inc. for $6,000,000 cash. In the Common Stock Purchase Agreement we agreed to seek SEC registration of the shares for resale if so requested. The closing of the sale of shares is expected to occur early in the second quarter of 2007.
Net loss $ (4,527,000 ) $ (5,359,000 ) $ (2,288,000 ) $ (14,364,000 )
Basic and diluted net loss per share $ (0.32 ) $ (0.37 ) $ (0.15 ) $ (0.96 )
21. Subsequent Events
-83-
Item 9. Changes in and Disagreements with Accountants on Accounting and Financial Disclosure
Not applicable. Item 9A. Controls and Procedures
Christopher J. Calhoun, our Chief Executive Officer, and Mark E. Saad, our Chief Financial Officer, after evaluating the effectiveness of our “disclosure controls and procedures” (as defined in Securities Exchange Act Rule 13a-15(e)), have concluded that as of December 31, 2006, our disclosure controls and procedures are effective. Item 9B. Other Information
None
PART III Item 10. Directors, Executive Officers and Corporate Governance
The information called for by Item 10 is incorporated herein by reference to the material under the captions “Election of Directors” and “Directors, Executive Officers and Corporate Governance” in our proxy statement for our 2007 annual stockholders’ meeting, which will be filed with the SEC on or before April 30, 2007. Item 11. Executive Compensation
The information called for by Item 11 is incorporated herein by reference to the material under the caption “Executive Compensation” in our proxy statement for our 2007 annual stockholders’ meeting, which will be filed with the SEC on or before April 30, 2007. Item 12. Security Ownership of Certain Beneficial Owners and Management and Related Stockholder Matters
The information called for by Item 12 is incorporated herein by reference to the material under the caption “Security Ownership of Certain Beneficial Owners and Management” in our proxy statement for our 2007 annual stockholders’ meeting, which will be filed with the SEC on or before April 30, 2007. Item 13. Certain Relationships and Related Transactions, and Director Independence
The information called for by Item 13 is incorporated herein by reference to the material under the caption “Information Concerning Directors and Executive Officers- Certain Relationships and Related Transactions” in our proxy statement for our 2007 annual stockholders’ meeting, which will be filed with the SEC on or before April 30, 2007. Item 14. Principal Accountant Fees and Services
The information called for by Item 14 is incorporated herein by reference to the material under the caption “Principal Accountant Fees and Services” in our proxy statement for our 2007 annual stockholders meeting, which will be filed with the SEC on or before April 30, 2007.
Table of Contents
-84-
PART IV Item 15. Exhibits and Financial Statement Schedules
(a) (2) Financial Statement Schedules
SCHEDULE II — VALUATION AND QUALIFYING ACCOUNTS
For the years ended December 31, 2006, 2005 and 2004 (in thousands of dollars)
Table of Contents
(a) (1) Financial Statements Report of KPMG LLP, Independent Registered Public Accounting Firm Consolidated Balance Sheets as of December 31, 2006 and 2005 Consolidated Statements of Operations and Comprehensive Loss for the years ended December 31, 2006, 2005 and 2004 Consolidated Statements of Stockholders’ Deficit for the years ended December 31, 2006, 2005 and 2004 Consolidated Statements of Cash Flows for the years ended December 31, 2006, 2005 and 2004 Notes to Consolidated Financial Statements
Balance at
beginning of year
Additions/(Reductions)
((charges)/ credits to expense)
Charged to Other
Accounts Deductions Balance at end of year
Allowance for doubtful accounts :
Year ended December 31, 2006 $ 9 $ — $ — $ (7 ) $ 2
Year ended December 31, 2005 $ 8 $ 1 $ — $ — $ 9
Year ended December 31, 2004 $ 62 $ (44 ) $ — $ (10 ) $ 8
-85-
Table of Contents (a)(3) Exhibits
Table of Contents
Exhibit Number Description 3.1
Amended and Restated Certificate of Incorporation (filed as Exhibit 3.1 to our Form 10-Q Quarterly Report
as filed on August 13, 2002 and incorporated by reference herein) 3.2
Amended and Restated Bylaws of Cytori Therapeutics, Inc. (filed as Exhibit 3.2 to our Form 10-Q Quarterly
Report, as filed on August 14, 2003 and incorporated by reference herein) 3.3
Certificate of Ownership and Merger (effecting name change to Cytori Therapeutics, Inc.) (filed as Exhibit
3.1.1 to our Form 10-Q, as filed on November 14, 2005 and incorporated by reference herein) 4.1
Rights Agreement, dated as of May 19, 2003, between Cytori Therapeutics, Inc. and Computershare Trust Company, Inc. as Rights Agent, which includes: as Exhibit A thereto, the Form of Certificate of Designation, Preferences and Rights of Series RP Preferred Stock of Cytori Therapeutics, Inc.; as Exhibit B thereto, the Form of Right Certificate; and, as Exhibit C thereto, the Summary of Rights to Purchase Series RP Preferred Stock (filed as Exhibit 4.1 to our Form 8-A which was filed on May 30, 2003 and incorporated by reference herein)
4.2
Amendment No. 1 to Rights Agreement dated as of May 12, 2005, between Cytori Therapeutics, Inc. and Computershare Trust Company, Inc. as Rights Agent (filed as Exhibit 4.1.1 to our Form 8-K, which was filed on May 18, 2005 and incorporated by reference herein).
10.1#
Amended and Restated 1997 Stock Option and Stock Purchase Plan (filed as Exhibit 10.1 to our Form 10
registration statement, as amended, as filed on March 30, 2001 and incorporated by reference herein) 10.1.1#
Board of Directors resolution adopted November 9, 2006 regarding determination of fair market value for
stock option grant purposes (incorporated by reference to Exhibit 10.10.1 filed herewith) 10.2+
Development and Supply Agreement, made and entered into as of January 5, 2000, by and between the Company and Medtronic (filed as Exhibit 10.4 to our Form 10 registration statement, as amended, as filed on June 1, 2001 and incorporated by reference herein)
10.3+
Amendment No. 1 to Development and Supply Agreement, effective as of December 22, 2000, by and between the Company and Medtronic (filed as Exhibit 10.5 to our Form 10 registration statement, as amended, as filed on June 1, 2001 and incorporated by reference herein)
10.4+
License Agreement, effective as of October 8, 2002, by and between the Company and Medtronic PS Medical, Inc. (filed as Exhibit 2.2 to our Current Report on Form 8-K which was filed on October 23, 2002 and incorporated by reference herein)
10.5+
Amendment No. 2 to Development and Supply Agreement, effective as of September 30, 2002, by and between the Company and Medtronic, Inc. (filed as Exhibit 2.4 to our Current Report on Form 8-K which was filed on October 23, 2002 and incorporated by reference herein)
10.7
Amended Master Security Agreement between the Company and General Electric Corporation, September, 2003 (filed as Exhibit 10.1 to our Form 10-Q Quarterly Report, as filed on November 12, 2003 and incorporated by reference herein)
10.8#
Asset Purchase Agreement dated May 7, 2004 between Cytori Therapeutics, Inc. and MAST Biosurgery AG (filed as Exhibit 2.1 to our Form 8-K Current Report, as filed on May 28, 2004 and incorporated by reference herein.)
10.8.1
Settlement Agreement dated August 9, 2005, between MAST Biosurgery AG, MAST Biosurgery, Inc. and the Company (filed as Exhibit 10.26 to our Form 10-Q, which was filed on November 14, 2005 and incorporated by reference herein)
10.9#
Offer Letter for the Position of Chief Financial Officer dated June 2, 2004 between the Company and Mark Saad (filed as Exhibit 10.18 to our Form 10-Q Quarterly Report, as filed on August 16, 2004 and incorporated by reference herein)
10.10#
2004 Equity Incentive Plan of Cytori Therapeutics, Inc. (filed as Exhibit 10.1 to our Form 8-K Current
Report, as filed on August 27, 2004 and incorporated by reference herein) 10.10.1#
Board of Directors resolution adopted November 9, 2006 regarding determination of fair market value for
stock option grant purposes (filed herewith) 10.11
Exclusive Distribution Agreement, effective July 16, 2004 by and between the Company and Senko Medical Trading Co. (filed as Exhibit 10.25 to our Form 10-Q Quarterly Report, as filed on November 15, 2004 and incorporated by reference herein)
10.12#
Notice and Agreement for Stock Options Grant Pursuant to Cytori Therapeutics, Inc. 1997 Stock Option and Stock Purchase Plan; (Nonstatutory) (filed as Exhibit 10.19 to our Form 10-Q Quarterly Report, as filed on November 15, 2004 and incorporated by reference herein)
10.13#
Notice and Agreement for Stock Options Grant Pursuant to Cytori Therapeutics, Inc. 1997 Stock Option and Stock Purchase Plan; (Nonstatutory) with Cliff (filed as Exhibit 10.20 to our Form 10-Q Quarterly Report, as filed on November 15, 2004 and incorporated by reference herein)
10.14#
Notice and Agreement for Stock Options Grant Pursuant to Cytori Therapeutics, Inc. 1997 Stock Option and Stock Purchase Plan; (Incentive) (filed as Exhibit 10.21 to our Form 10-Q Quarterly Report, as filed on November 15, 2004 and incorporated by reference herein)
10.15#
Notice and Agreement for Stock Options Grant Pursuant to Cytori Therapeutics, Inc. 1997 Stock Option and Stock Purchase Plan; (Incentive) with Cliff (filed as Exhibit 10.22 to our Form 10-Q Quarterly Report, as filed on November 15, 2004 and incorporated by reference herein)
10.16#
Form of Options Exercise and Stock Purchase Agreement Relating to the 2004 Equity Incentive Plan (filed as Exhibit 10.23 to our Form 10-Q Quarterly Report, as filed on November 15, 2004 and incorporated by reference herein)
10.17#
Form of Notice of Stock Options Grant Relating to the 2004 Equity Incentive Plan (filed as Exhibit 10.24 to
our Form 10-Q Quarterly Report, as filed on November 15, 2004 and incorporated by reference herein) 10.18#
Separation Agreement and General Release dated July 15, 2005, between John K. Fraser and the Company (filed as Exhibit 10.25 to our Form 10-Q Quarterly Report as filed on November 14, 2005 and incorporated by reference herein)
10.19# Consulting Agreement dated July 15, 2005, between John K. Fraser and the Company (filed as Exhibit
10.28 to our Form 10-Q Quarterly Report as filed on November 14, 2005 and incorporated by reference
herein) 10.20
Agreement Between Owner and Contractor dated October 10, 2005, between Rudolph and Sletten, Inc. and the Company (filed as Exhibit 10.20 to our Form 10-K Annual Report as filed on March 30, 2006 and incorporated by reference herein)
10.21#
Severance Agreement and General Release dated August 10, 2005, between Sharon V. Schulzki and the Company (filed as Exhibit 10.27 to our Form 10-Q Quarterly report as filed on November 14, 2005 and incorporated by reference herein)
10.22
Common Stock Purchase Agreement dated April 28, 2005, between Olympus Corporation and the Company (filed as Exhibit 10.21 to our Form 10-Q Quarterly Report as filed on August 15, 2005 and incorporated by reference herein)
10.23
Sublease Agreement dated May 24, 2005, between Biogen Idec, Inc. and the Company (filed as Exhibit 10.21 to our Form 10-Q Quarterly Report as filed on August 15, 2005 and incorporated by reference herein)
10.24#
Employment Offer Letter to Doug Arm, Vice President of Development—Biologics, dated February 1, 2005 (filed as Exhibit 10.21 to our Form 10-Q Quarterly Report as filed on August 15, 2005 and incorporated by reference herein)
10.25#
Employment Offer Letter to Alex Milstein, Vice-President of Clinical Research, dated May 1, 2005 (filed as Exhibit 10.21 to our Form 10-Q Quarterly Report as filed on August 15, 2005 and incorporated by reference herein)
10.26#
Employment Offer Letter to John Ransom, Vice-President of Research, dated November 15, 2005 (filed as Exhibit 10.26 to our Form 10-K Annual Report as filed on March 30, 2006 and incorporated by reference herein)
10.27+
Joint Venture Agreement dated November 4, 2005, between Olympus Corporation and the Company (filed as Exhibit 10.27 to our Form 10-K Annual Report as filed on March 30, 2006 and incorporated by reference herein)
10.28+
License/ Commercial Agreement dated November 4, 2005, between Olympus-Cytori, Inc. and the Company (filed as Exhibit 10.28 to our Form 10-K Annual Report as filed on March 30, 2006 and incorporated by reference herein)
10.29+
License/ Joint Development Agreement dated November 4, 2005, between Olympus Corporation, Olympus-Cytori, Inc. and the Company (filed as Exhibit 10.29 to our Form 10-K Annual Report as filed on March 30, 2006 and incorporated by reference herein)
10.30+
Shareholders Agreement dated November 4, 2005, between Olympus Corporation and the Company (filed as Exhibit 10.30 to our Form 10-K Annual Report as filed on March 30, 2006 and incorporated by reference herein)
10.31+
Exclusive Negotiation Agreement with Olympus Corporation, dated February 22, 2006 (filed as Exhibit 10.31 to our Form 10-Q Quarterly Report as filed on May 15, 2006 and incorporated by reference herein)
10.32
Common Stock Purchase Agreement, dated August 9, 2006, by and between Cytori Therapeutics, Inc. and Olympus Corporation (filed as Exhibit 10.32 to our Form 8-K Current Report as filed on August 15, 2006 and incorporated by reference herein)
10.33
Form of Common Stock Subscription Agreement, dated August 9, 2006 (Agreements on this form were signed by Cytori and each of respective investors in the Institutional Offering) (filed as Exhibit 10.33 to our Form 8-K Current Report as filed on August 15, 2006 and incorporated by reference herein)
10.34
Placement Agency Agreement, dated August 9, 2006, between Cytori Therapeutics, Inc. and Piper Jaffray & Co. (filed as Exhibit 10.34 to our Form 8-K Current Report as filed on August 15, 2006 and incorporated by reference herein)
10.35#
Stock Option Extension Agreement between Bruce A. Reuter and Cytori Therapeutics, Inc. effective July 25, 2006 (filed as Exhibit 10.35 to our Form 10-Q Quarterly Report as filed on November 145, 2006 and incorporated by reference herein)
10.36#
Stock Option Extension Agreement between Elizabeth A. Scarbrough and Cytori Therapeutics, Inc. effective July 25, 2006 (filed as Exhibit 10.36 to our Form 10-Q Quarterly Report as filed on November 14, 2006 and incorporated by reference herein)
10.37#
Employment Agreement between Bruce A. Reuter and Cytori Therapeutics, Inc. effective July 25, 2006 (filed as Exhibit 10.37 to our Form 10-Q Quarterly Report as filed on November 14, 2006 and incorporated by reference herein)
10.38#
Employment Agreement between Elizabeth A. Scarbrough and Cytori Therapeutics, Inc. effective July 25, 2006 (filed as Exhibit 10.38 to our Form 10-Q Quarterly Report as filed on November 14, 2006 and incorporated by reference herein)
10.39+
Exclusive License Agreement between us and the Regents of the University of California dated October 16, 2001 (filed as Exhibit 10.10 to our Form 10-K Annual Report as filed on March 31, 2003 and incorporated by reference herein)
10.39.1 +
Amended and Restated Exclusive License Agreement, effective September 26, 2006, by and between The Regents of the University of California and Cytori Therapeutics, Inc. (filed as Exhibit 10.39 to our Form 10-Q Quarterly Report as filed on November 14, 2006 and incorporated by reference herein)
10.40#
Stock Option Extension Agreement between Charles Galetto and Cytori Therapeutics, Inc. signed on May 24, 2006 and effective as of June 1, 2006 (filed as Exhibit 10.20 to our Form 10-Q Quarterly Report as filed on August 14, 2006 and incorporated by reference herein)
10.41#
Part-time Employment Agreement between Charles Galetto and Cytori Therapeutics, Inc. signed on May 24, 2006 and effective as of June 1, 2006 (filed as Exhibit 10.21 to our Form 10-Q Quarterly Report as filed on August 14, 2006 and incorporated by reference herein)
10.42
Placement Agency Agreement, dated February 23, 2007, between Cytori Therapeutics, Inc. and Piper Jaffray & Co. (filed as Exhibit 10.1 to our Form 8-K Current Report as filed on February 26, 2007 and incorporated by reference herein).
14.1
Code of Ethics (filed as Exhibit 14.1 to our Annual Report on Form 10-K which was filed on March 30,
2004 and incorporated by reference herein) 23.1 Consent of KPMG LLP, Independent Registered Public Accounting Firm (filed herewith).
_______________________________________ + Portions of these exhibits have been omitted pursuant to a request for confidential treatment. # Indicates management contract or compensatory plan or arrangement.
31.1
Certification of Principal Executive Officer Pursuant to Securities Exchange Act Rule 13a-14(a), as adopted
pursuant to Section 302 of the Sarbanes-Oxley Act of 2002 (filed herewith). 31.2
Certification of Principal Financial Officer Pursuant to Securities Exchange Act Rule 13a-14(a), as adopted
pursuant to Section 302 of the Sarbanes-Oxley Act of 2002 (filed herewith). 32.1
Certifications Pursuant to 18 U.S.C. Section 1350/ Securities Exchange Act Rule 13a-14(b), as adopted
pursuant to Section 906 of the Sarbanes - Oxley Act of 2002 (filed herewith).
-86-
SIGNATURES
Pursuant to the requirements of Section 13 or 15(d) of the Securities Exchange Act of 1934, the registrant has duly caused this registration statement to be signed on its behalf by the undersigned, thereunto duly authorized.
Pursuant to the requirements of the Securities Exchange Act of 1934, this annual report has been signed below by the following persons on behalf of the registrant and in the capacities and on the dates indicated.
Table of Contents
CYTORI THERAPEUTICS, INC. By: /s/ Christopher J. Calhoun Christopher J. Calhoun Chief Executive Officer March 30, 2007
SIGNATURE TITLE DATE /s/ Marshall G. Cox Chairman of the Board of Directors March 30, 2007 Marshall G. Cox /s/ Christopher J. Calhoun Chief Executive Officer, Director (Principal Executive Officer) March 30, 2007 Christopher J. Calhoun /s/ Marc H. Hedrick, MD President, Director March 30, 2007 Marc H. Hedrick, MD /s/ Mark E. Saad Chief Financial Officer (Principal Financial Officer) March 30, 2007 Mark E. Saad /s/ John W. Townsend Chief Accounting Officer March 30, 2007 John W. Townsend /s/ David M. Rickey Director March 30, 2007 David M. Rickey /s/ Ronald D. Henriksen Director March 30, 2007 Ronald D. Henriksen /s/ E. Carmack Holmes, MD Director March 30, 2007 E. Carmack Holmes, MD /s/ Paul W. Hawran Director March 30, 2007 Paul W. Hawran
EXHIBIT 10.10.1
As of January 1, 2007, the Board of Directors adopted the policy that the fair market value of the Company’s common stock for the purposes of granting stock options under the Company’s 1997 Stock Option and Purchase Plan and the 2004 Equity Incentive Plan shall be the closing price of the Company’s common stock as quoted on the NASDAQ Stock Market on the day of such grant.
EXHIBIT 23.1
Consent of Independent Registered Public Accounting Firm The Board of Directors Cytori Therapeutics, Inc.: We consent to the incorporation by reference in Registration Statement Nos. (333-82074 and 333-122691) on Form S-8 and in the registration statements Nos. (333-140875 and 333-134129) on Form S-3 of Cytori Therapeutics, Inc., of our report dated March 29, 2007, with respect to the consolidated balance sheets of Cytori Therapeutics, Inc. and subsidiaries as of December 31, 2006 and 2005, and the related consolidated statements of operations and comprehensive loss, stockholders’ equity (deficit), and cash flows for each of the years in the three-year period ended December 31, 2006, and the related financial statement schedule, which report appears in the December 31, 2006 annual report on Form 10-K of Cytori Therapeutics, Inc. Our report on the consolidated financial statements refers to the Company deriving a substantial portion of its revenues from related parties and the Company’s adoption of Statement of Financial Accounting Standards No. 123(R), “Share-Based Payment,” effective January 1, 2006.
/s/ KPMG San Diego, California March 30, 2007
EXHIBIT 23.1
Consent of Independent Registered Public Accounting Firm The Board of Directors Cytori Therapeutics, Inc.: We consent to the incorporation by reference in Registration Statement Nos. (333-82074 and 333-122691) on Form S-8 and in the registration statements Nos. (333-140875 and 333-134129) on Form S-3 of Cytori Therapeutics, Inc., of our report dated March 28, 2007, with respect to the consolidated balance sheets of Cytori Therapeutics, Inc. and subsidiaries as of December 31, 2006 and 2005, and the related consolidated statements of operations and comprehensive loss, stockholders’ equity (deficit), and cash flows for each of the years in the three-year period ended December 31, 2006, and the related financial statement schedule, which report appears in the December 31, 2006 annual report on Form 10-K of Cytori Therapeutics, Inc. Our report on the consolidated financial statements refers to the Company deriving a substantial portion of its revenues from related parties and the Company’s adoption of Statement of Financial Accounting Standards No. 123(R), “Share-Based Payment,” effective January 1, 2006.
/s/ KPMG LLP San Diego, California March 30, 2007
EXHIBIT 31.2
Certification of Chief Financial Officer Pursuant to Securities Exchange Act Rule 13a-14(a)
As Adopted Pursuant to Section 302 of the Sarbanes-Oxley Act of 2002
I, Mark E. Saad, the Chief Financial Officer of Cytori Therapeutics, Inc., certify that: 1. I have reviewed this annual report on Form 10-K of Cytori Therapeutics, Inc.; 2. Based on my knowledge, this report does not contain any untrue statement of a material fact or omit to state a material fact necessary to make the statements made, in light of the circumstances under which such statements were made, not misleading with respect to the period covered by this report; 3. Based on my knowledge, the financial statements, and other financial information included in this report, fairly present in all material respects the financial condition, results of operations and cash flows of the registrant as of, and for, the periods presented in this report; 4. The registrant’s other certifying officer and I are responsible for establishing and maintaining disclosure controls and procedures (as defined in Exchange Act Rules 13a-15(e) and 15d-15(e)) for the registrant and have:
(a) designed such disclosure controls and procedures, or caused such disclosure controls and procedures to be designed under our supervision, to ensure that material information relating to the registrant, including its consolidated subsidiaries, is made known to us by others within those entities, particularly during the period in which this report is being prepared;
(b) evaluated the effectiveness of the registrant’s disclosure controls and procedures and presented in this report our conclusions about the effectiveness of the disclosure controls and procedures, as of the end of the period covered by this report based on such evaluation; and
(c) disclosed in this report any change in the registrant’s internal control over financial reporting that occurred during the registrant’s most recent fiscal quarter that has materially affected, or is reasonably likely to materially affect, the registrant’s internal control over financial reporting; and
5. The registrant’s other certifying officer and I have disclosed, based on our most recent evaluation of internal control over financial reporting, to the registrant’s auditors and the audit committee of the registrant’s board of directors (or persons performing the equivalent functions):
(a) all significant deficiencies and material weaknesses in the design or operation of internal control over financial reporting which are reasonably likely to adversely affect the registrant’s ability to record, process, summarize and report financial information; and
(b) any fraud, whether or not material, that involves management or other employees who have a significant role in the registrant’s internal control over financial reporting.
Date: March 30, 2007 /s/ Mark E. Saad Mark E. Saad, Chief Financial Officer
EXHIBIT 32.1
CERTIFICATIONS PURSUANT TO 18 U.S.C. SECTION 1350/ SECURITIES EXCHANGE ACT RULE 13a-14(b), AS ADOPTED PURSUANT TO SECTION 906 OF THE SARBANES - OXLEY ACT OF 2002 In connection with the Annual Report on Form 10-K of Cytori Therapeutics, Inc. for the year ended December 31, 2006 as filed with the Securities and Exchange Commission on the date hereof, Christopher J. Calhoun, as Chief Executive Officer of Cytori Therapeutics, Inc., and Mark E. Saad, as Chief Financial Officer of Cytori Therapeutics, Inc., each hereby certifies, respectively, that: 1. The Form 10-K report of Cytori Therapeutics, Inc. that this certification accompanies fully complies with the requirements of
section 13(a) of the Securities Exchange Act of 1934. 2. The information contained in the Form 10-K report of Cytori Therapeutics, Inc. that this certification accompanies fairly presents, in
all material respects, the financial condition and results of operations of Cytori Therapeutics, Inc.
By: /s/ Christopher J. Calhoun Dated: March 30, 2007 Christopher J. Calhoun Chief Executive Officer By: /s/ Mark E. Saad Dated: March 30, 2007 Mark E. Saad Chief Financial Officer