Page 1
Luminescent ions in silica-based optical fibers
Bernard Dussardier*, Wilfried Blanc and Gérard Monnom
Laboratoire de Physique de la Matière Condensée, Université de Nice Sophia-Antipolis -
CNRS, UMR 6622, Parc Valrose - F-06108 NICE CEDEX 2 – France
* Corresponding author: email: [email protected] , tél: +33 492 076 748
Abstract
We present some of our research activities dedicated to doped silica-based optical fibers,
aiming at understanding the spectral properties of luminescent ions, such as rare-earth and
transition metal elements. The influence of the local environment on dopants is extensively
studied: energy transfer mechanisms between rare-earth ions, control of the valence state of
Chromium ions, effect of the local phonon energy on Thulium ions emission efficiency and
broadening of Erbium ions emission induced by oxide nanoparticles. Knowledge of these
effects is essential for photonics applications.
keywords
optical fiber, silica, spectroscopy, rare-earths, transition metals, energy transfer, valence
state, phonon energy, local environment
1. Introduction
During the last two decades, the development of sophisticated optical systems and
devices based on fiber optics have benefited from the development of very performant optical
fiber components. In particular, optical fibers doped with 'active' elements such as rare-earth
(RE) ions have allowed the extremely fast development of optical telecommunications [1,2],
lasers [3] industries and the development of temperature sensors [4]. The most frequently used
Page 2
RE ions (Nd3+, Er3+, Yb3+, Tm3+) have applications in three main spectral windows: around 1, 1.5
and 2µm in fiber lasers and sensors based on absorption/fluorescence and around 1.5 µm for
telecommunications and temperature sensors. RE-doped fibers are either doped with one
element (e.g. Er3+ in line amplifiers for long haul telecommunications) or two elements (e.g.
Yb3+ and Er3+ in booster amplifiers or powerful 1.5 µm lasers). In the second case, the non-
radiative energy transfer mechanism from donor to acceptor is implemented to benefit from the
good pump absorption capacity of the donor (e.g. Yb3+ around 0.98 µm) and from the good
stimulated emission efficiency of the acceptor (e.g. Er3+ around 1.5 µm). All the developed
applications of amplifying optical fibers are the result of long and careful optimization of the
material properties, particularly in terms of dopant incorporation in the glass matrix,
transparency and quantum efficiency.
The exploited RE-doped fibers are made of a choice of glasses: silica is the most widely
used, sometimes as the result of some compromises. Alternative glasses, including low
Maximum Phonon Energy (MPE) ones, are also used because they provide better quantum
efficiency or emission bandwidth to some RE ions particular optical transition. The icon
example is the Tm3+-Doped Fiber Amplifier (TDFA) for telecommunications in the S-band
(1.48-1.53 µm) [5], for which low MPE glasses have been developed: oxides [6,7], fluorides [8],
chalcogenides [9]… However, these glasses have some drawbacks not acceptable at a
commercial point of view: high fabrication costs, low reliability, difficult connection to silica
components and, in the case of fiber lasers, low optical damage threshold and resistance to heat.
To our knowledge, silica glass is the only material able to meet most of applications
requirements, and therefore the choice of vitreous silica for the active fiber material is of critical
importance. However a pure silica TDFA would suffer strong non-radiative de-excitation
(NRD) caused by multiphonon coupling from Tm3+ ions to the matrix. Successful insulation of
Tm3+-ions from matrix vibrations by appropriate ion-site 'engineering' would allow the
development of a practical silica-based TDFA.
Page 3
Other dopants have recently been proposed to explore amplification over new wavelength
ranges. Bi-doped glasses with optical gain [10] and fiber lasers operating around 1100-1200 nm
have been developed [11,12], although the identification of the emitting center is still not clear,
and optimization of the efficiency is not yet achieved. Transition metal (TM) ions of the Ti-Cu
series would also have interesting applications as broad band amplifiers, super-fluorescent or
tunable laser sources, because they have in principle ten-fold spectrally larger and stronger
emission cross-sections than RE ions. However, important NRD strongly reduces the emission
quantum efficiency in silica. Bi- and TM-doped fibers optical properties are extremely sensitive
to the glass composition and/or structure to a very local scale. As for Tm3+ ions, practical
applications based on silica would be possible when the 'ion site engineering' will be performed
in a systematic approach. This approach is proposed via 'encapsulation' of dopants inside glassy
or crystalline nanoparticles (NP) embedded in the fiber glass, like reported for oxyfluoride
fibers [13] and multicomponent silicate fibers [14]. In NP-doped-silica fibers, silica would act as
support giving optical and mechanical properties to the fiber, whereas the dopant spectroscopic
properties would be controlled by the NP nature. The NP density, mean diameter and diameter
distribution must be optimized for transparency [15].
In this context, our group has made contributions in various aspects introduced above.
Our motivations are both fundamental and application oriented. First, the selected dopants act as
probes of the local matrix environment, via their spectroscopic variations versus ligand field
intensity, site structure, phonon energy, statistical proximity to other dopants,… The studies are
always dedicated to problems or limitation in applications, such as for Erbium-Doped Fiber
Amplifier (EDFA) and TDFA, or high temperature sensors. It is also important to use a
commercially derived fabrication technique, here the Modified Chemical Vapor Deposition
(MCVD), to assess the potential of active fiber components for further development.
The aim of this paper is reviewing our contributions to improving the spectroscopic
properties of some RE and TM ions doped into silica. The article is organized as follows:
Section 2 describes the MCVD fabrication method of preform and fiber samples, and the
Page 4
common characterization techniques used in all studies. Section 3 is devoted to the study of
energy transfers in Erbium ion (Er3+) and Ytterbium:Erbium (Yb3+:Er3+) heavily (co)doped fibers
and the applications to fiber temperature sensors, whereas Section 4 summarizes our original
investigations on Chromium (Cr3+ and Cr4+) in silica-based fibers. In Section 5, we report on the
spectroscopic investigations of Thulium- (Tm3+) doped fibers versus the material composition,
including phonon interactions and non-radiative relaxations. In section 6 are reported our recent
discoveries in RE-doped dielectric nanoparticles, grown by phase separation.
2. Experimental
2.1 Preforms and fibers fabrication
All the fibers investigated in this article were drawn from preforms prepared by the
Modified Chemical Vapor Deposition (MCVD) technique [16] at Laboratoire de Physique de la
Matière Condensée (Nice). In this process, chemicals (such as O2, SiCl4) are mixed inside a
glass tube that is rotating on a lathe. Due to the flame of a burner moving along the tube, they
react and extremely fine silica particles are deposited on the inner side of the tube. These soot
are transformed into a glass layer (thickness is about few µm) when the burner is passing over.
The cladding layers are deposited inside the substrate tube, followed by the core layers.
Germanium and Phosphorus can be incorporated directly through the MCVD process. They are
added to raise the refractive index. Moreover, this last element is also added as a melting agent,
decreasing the melting temperature of the glass. All the other elements (rare-earths, transition
metals, aluminium, …) are incorporated through the solution doping technique [17]. The last
core layer is deposited at lower temperature than the preceding cladding layers, so that they are
not fully sintered and left porous. Then the substrate tube is filled with an alcoholic solution of
salts and allowed to impregnate the porous layers. After 1-2 hours, the solution is removed, the
porous layer is dried and sintered. When the deposition is complete, the tube is collapsed at
2000°C into a preform. In our case, the typical length of the preform is about 30 cm and the
diameter is 10 mm. The preform is then put into a furnace for drawing into fiber. The preform
Page 5
tip is heated to about 2000°C. As the glass softens, a thin drop falls by gravity and pulls a thin
glass fiber. The diameter of the fiber is adjusted by varying the capstan speed. A UV-curable
polymer is used to coat the fiber.
2.2 Material characterizations
Refractive index profiles (RIP) of the preforms were measured using a York Technology
refractive index profiler (P101), while the RIPs of the optical fibers were determined using a
York Technology refractive index profiler (S14). The oxide core compositions of the samples
were deduced from measurement of the RIP in the preform, knowing the correspondence
between index rising and AlO3/2, GeO2, PO5/2 concentration in silica glass from the literature
[18,19]. The composition was also directly measured on some preforms using electron probe
microanalysis technique in order to compare results. A good agreement was found. The
concentration of these elements is generally around few mol%. Luminescent ions concentrations
are too low to be measured through the RIP. They were measured through absorption spectra.
For example, Tm3+ ion concentration has been deduced from the 785 nm (3H6=>3H4) absorption
peak measured in fibers and using absorption cross-section reported in [20]: abs(785 nm) =
8.7x10⁻²⁵ m2.
3. Energy transfers in Er3+ and Yb3+:Er3+ heavily doped silica fibers
The non-radiative energy transfer processes are well-known phenomena that influence the
optical properties of doped-materials. The first theoretical basis appears in the 50's with the
18 Vienne, G. 1996. Fabrication and characterization of ytterbium:erbium codoped
phosphosilicate fibers for optical amplifiers and lasers", PhD thesis, Southampton, UK.
19 Schultz, P.C. 1977. Proc 11th Int. Cong. Glass, 3:155.
20 Jackson, S.D. and T.A. King. 1999. Theoretical modelling of Tm-doped silica fiber
lasers. J. Light. Technol. 17(5):948.
Page 6
Förster-Dexter's model [21,22] that treats this process as the result of dipole-dipole and multipole-
multipole interactions. Two energy transfer processes are described in Fig. 1. When pumping a
co-doped material some ions are promoted in one of their excited level. If some ions are close to
each other, their wave-functions interpenetrate and the energy stored in the excited level of the
donor ions is non-radiatively transferred to a resonant level of the acceptor ions. This process
was turned to good account in Yb3+:Er3+ co-doped silica fibers for high power fiber amplifier [23]
and laser [24] applications : it takes advantage of the strong absorption cross-section of Yb 3+ at
980 nm and of the high efficiency of the energy transfer. In the case of high doping levels for
both species, another non-radiative energy transfer process can take place and allows exciting a
higher level of the acceptor ion : it is the double energy transfer process (DET) described by
Auzel [25]. This process was first used to convert infrared light from LED to visible emission or
to detect weak infrared signals with photomultipliers [26,27].
3.1 Double energy transfer in Er3+-doped fibers
The clustering effect in Er3+-doped silica fibers is now a well-accepted phenomenon, and
its detrimental influence on the 1550-nm gain transition of such fibers is well established [28].
For simplicity, modeling of clusters has consisted of considering that a fraction of the dopants
were organized in ion pairs [29], in which an immediate energy transfer leads to an instantaneous
relaxation of one excited ion. This model is in very good agreement with the experimental
results obtained for saturable absorption and for gain measurements at low Er3+ doping levels as
in fiber amplifiers. At higher doping levels, Ainslie et al. [30] showed that, in addition to the ions
dispersed in the host, regions in which concentrations of rare-earth exceeding 40 wt% - called
clusters – appear : in such a material the ion-pair model cannot be applied. We have developed a
cluster model [31] that differs from the ion-pair one by the fact that we consider that each ion of
a cluster can efficiently transfer its energy to any of the other ions of the same cluster. When n
ions of a cluster are excited, a succession of (n-1) fast relaxations by energy transfer leads to a
situation in which all the ions of a cluster but one are de-excited. This model permits the
Page 7
determination of the proportion of the dopants organized in clusters and the transfer rate. In
order to validate the model we realized a pump-absorption-versus-pump-power experiment with
two fiber samples, Er-1 and Er-2, doped with 100 ppm and 2,500 ppm of Er3+, respectively (Fig.
2). This shows that the non-saturable absorption (NSA) grows dramatically with the Er3+
concentration. We have attributed this behaviour to the presence of clusters containing a
significant percentage of the dopants and in which efficient energy transfers allow these ions to
relax rapidly after the absorption of a first pump photon.
3.2 Double energy transfer in highly Yb3+:Er3+-co-doped fibers
The green fluorescence of Er3+-doped optical fiber is a well-known phenomenon in 800
nm-pumped erbium-doped fibers. This emission results from the excited state absorption
phenomenon and is characteristic of the emission from the 2H11/2 and 4S3/2-levels and
consequently can be observed with any pumping scheme leading to the population of these
levels. We have studied how these levels can be excited by DET [32] and a schematic energy
diagram is shown in Fig. 3.
At low rare-earth concentrations, the large inter-ionic distances permit efficient single
energy transfers, but the second energy transfer is very inefficient. For applications in which the
green fluorescence is desirable, this second energy transfer must be enhanced. For that the rare-
earth concentration must be as high as possible to reduce the distance between neighboring ions.
In this case, a second phase, referred to as clusters, can appear in which the rare-earth ions
concentration is particularly high. In order to quantify the fraction of active ions into clusters,
we have studied the Yb3+ and Er3+ fluorescence dynamics in a highly co-doped fiber
([Yb]=[Er]=2,500 ppm) : the 1040 nm-fluorescence decay represents the population decay from
the 2F5/2-metastable level of Yb3+, and that of the green-fluorescence represents the evolution of
the 2H11/2 and 4S3/2-populations of Er3+. Our setup allows simultaneous measurements of the
counter-propagative visible emission and the lateral infrared emission. The experimental curves
show two typical decays. Fitted with our rate equations model [Error: Reference source not
Page 8
found], they revealed that roughly 50% of both ions are organized in clusters in the co-doped
fiber. This high percentage must be associated with very high Yb-Er transfer rates (3x10⁶ s-1),
one order of magnitude superior to the Er3+:4I11/2 intermediate level relaxation rate (3.7x10⁵ s-1):
Er3+ ions placed in their short lived 4I11/2 state have a higher probability to be excited to the 4F7/2
upper state than to relax spontaneously. The strong percentage of ions organized in clusters and
the very high transfer rates are at the origin of the very good up-conversion efficiency.
3.3 Thermalization effects between excited levels in doped fibers: temperature
sensor based on fluorescence of Er3+
Though the rare-earth ions are never in thermodynamical equilibrium because of the
metastability of some levels, it has been demonstrated that the populations of the 2H11/2 and 4S3/2
levels responsible for the green emission in Er3+-doped fibers are in quasi-thermal equilibrium.
This effect has been observed for the first time in fluoride glass fibers [ 33] and can be attributed
to the relatively long lifetime of these levels (400 µs) in that host. In silica, in spite of the two
orders of magnitude shorter lifetime, a fast thermal coupling between both levels has been
proposed [34] and confirmed experimentally [35] (Fig. 4). Indeed these levels can be considered
to be in quasi-thermal equilibrium, because of the small energy gap between them, about
800 cm-1, compared to the high energy gap between them and the nearest lower level, about
3000 cm-1. In this case, the lifetime of these levels is sufficient (1 µs) to allow populating the
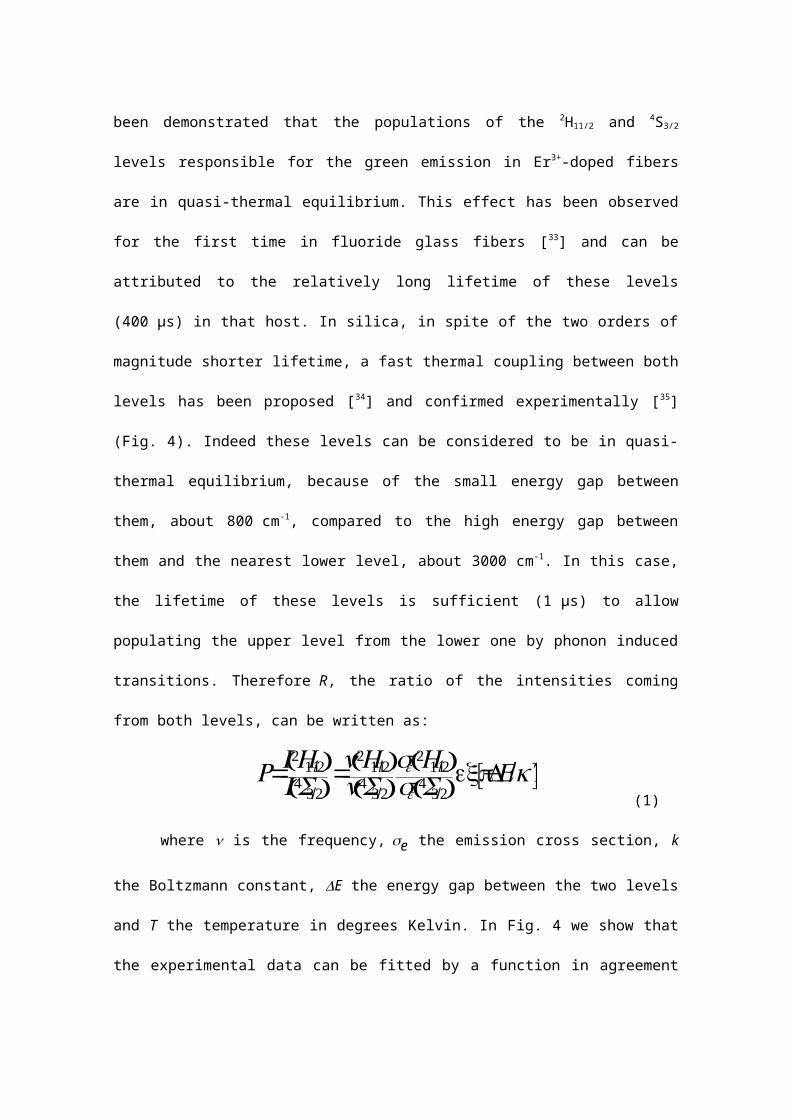
upper level from the lower one by phonon induced transitions. Therefore R, the ratio of the
intensities coming from both levels, can be written as:
€
R=I2H11/2( )I4S3/2( )
=ν2H11/2( )ν4S3/2( )
e 2H11/2( )e 4S3/2( )
exp−ΔE/kT[ ](1)
where ν is the frequency, e the emission cross section, k the Boltzmann constant, ΔE
the energy gap between the two levels and T the temperature in degrees Kelvin. In Fig. 4 we
show that the experimental data can be fitted by a function in agreement with Equation (1). This
is another example of an energy transfer process, this one being assisted by phonons.
Page 9
In order to take advantage of the high efficiency of the DET in highly co-doped Yb-Er
doped fiber and of the thermalisation effect between the higher levels involved in the green
fluorescence in this kind of fiber, we have developed a new temperature sensor, unsensitive for
strain. The dynamic obtained was 11 dB in Fig. 4 over the shown temperature range, leading to
a mean rate of change of the green intensity ratio of approximately 0.016 dB/K at 300 K.
Several temperature cycles have been carried out and we have observed a good repeatability. As
for the stability, no modifications have been observed on the two intensities when the fiber was
1 Desurvire, E. 1994. in Erbium Doped Fiber Amplifiers: principles and applications.
Wiley Interscience. ISBN 0-471-58977-2.
2 Desurvire, E., D. Bayart, B. Desthieux, S. Bigo. 2002. in Erbium Doped Fiber
Amplifiers: device and system developments. Wiley Interscience. ISBN 0-471-41903-6.
3 Digonnet, M. 2001. in Rare-Earth-Doped Fiber Lasers and Amplifiers (2nd ed.) CRC.
ISBN 0-824-70458-2.
4 Grattan, K.T.V., T. Sun T. 2000. Fiber optic sensor technology: an overview. Sens.
Actuators A: Phys. 82:40.
5 Komukai, T., T. Yamamoto, T. Sugawa and Y. Miyajima, 1995. Upconversion pumped
Thulium-doped fluoride fiber amplifier and laser operating at 1.47 µm. IEEE J. Quant.
Electron. 31:1880.
6 Minelly, J and A.Ellison. 2002. Applications of antimony-silicate glasses for fiber optic
amplifiers. Opt. Fib. Tech. 8:123.
7 Lin, H., S. Tanabe, L. Lin, Y.Y. Hou, K. Liu, D.L. Yang, T.C. Ma, J.Y. Yu and E.Y.B.
Pun. 2007. Near-infrared emissions with widely different widths in two kinds of Er 3+-
doped oxide glasses with high refractive indices and low phonon energies. J. Lum.
124:167.
Page 10
heated during several hours at temperatures up to 600°C. Due to the strong absorption of the
doped fiber in the signal wavelength range - the green emissions corresponding to transitions
downto the fundamental level - and to the 15 dB/km intrinsic absorption of the transparent fiber
in the same wavelength range, such a device would be limited to a point sensor.
We have developed a new sensor based on the 1.13 µm and 1.24 µm emission lines,
coming from the same levels [36]. These lines present the same temperature behaviour as the
green ones. As the lower level of these transitions is the 4I11/2-level and not the fundamental one
8 Durteste, Y., M. Monerie, J.-Y. Allain, and H. Poignant. 1991. Amplification and lasing
at 1.3 pm in praseodymium-doped fluoridezirconate fibers. Electron. Lett. 27:626
9 Hewak, D.W., R.S. Deol, J. Wang, G. Wylangowski, J.A. Mederios Neto, B.N. Samson,
R.I. Laming, W.S. Brocklesby, D.N. Payne, A. Jha, M. Poulain, S. Otero, S. Surinach,
and M.D. Baro. 1993. Low phonon-energy glasses for efficient 1.3 µm optical fiber
amplifiers. Electron. Lett. 29:237.
10 Murata, K., Y. Fujimoto, T. Kanabe, H. Fujita, and M. Nakatsuka. 1999. Bi-doped SiO2
as a new laser material for an intense laser. Fusion Engineering and Design 44:437.
11 Dianov, E.M., V.V. Dvoyrin, V.M. Mashinsky, A.A. Umnikov, M.V. Yashkov and A.N.
Gur'yanov. 2005. CW bismuth fiber laser. Quantum Electronics 35:1083.
12 Razdobreev, I., L. Bigot, V. Pureur, A. Favre, G. Bouwmans and M. Douay. 2007.
Efficient all-fiber bismuth-doped laser. Appl. Phys. Lett. 90:031103.
13 Samson, B.N., P.A. Tick, and N.F. Borrelli. 2001. Efficient neodymium-doped glass-
ceramic fiber laser and amplifier. Opt. Lett. 26(3):145.
14 Samson, B.N., L.R. Pinckney, J. Wang, G.H. Beall, and N.F. Borrelli. 2002. Nickel-doped
nanocrystalline glass-ceramic fiber. Opt. Lett. 27(15):1309.
Page 11
(Fig. 3), the signals are absorption free and their wavelengths correspond to a transparency
region of the intermediate fibers. These arguments have permitted the development of an
efficient quasi-distributed configuration without limitation on the sensing line length : the short
lifetime of upper levels (1 µs) could allow realizing a sensors network. Each sensitive head is
separated from its neighbors by a 100-meter long transparent silica fiber in order to time-resolve
the counter-propagative signals.
15 Tick, P.A., N.F. Borrelli, L.K. Cornelius, and M.A. Newhouse. 1995. Transparent glass
ceramics for 1300 nm amplifier applications. J. Appl. Phys. 78 (ll):6367.
16 see for example: Nagel, S.R., J.B. MacChesney and K.L. Walker. 1985. Modified
chemical vapor deposition. in Optical Fiber Communications: Vol 1 'Fiber Fabrication',
ed. T. Li, Orlando: Academic Press
17 Townsend, J.E., S.B. Poole and D.N. Payne. 1987. Solution doping technique for
fabrication of rare earth doped optical fibers. Electron. Lett. 23:329.
21 Förster, T. 1948. Zwischenmolekulare Energiewanderung und Fluoreszenz. Ann. Phys.
(Leipzig) B 2:55.
22 Dexter, D.L. 1953. A Theory of Sensitized Luminescence in Solids. J. Chem. Phys.
21(5):836.
23 Grubb, S.G., W.F. Humer, R.S. Cannon, T.H. Windhorn, S.W. Vendetta, K.L. Sweeney,
P.A. Leilabady, W.L. Barnes, K.P. Jedrzejewski and J.E. Townsend. 1992. +21-dbm
erbium power-amplifier pumped by a diode-pumped Nd-YAG laser. IEEE Photon. Tech.
Lett. 4(6):553.
24 Barnes, W.L., S.B. Poole, J.E. Townsend, L. Reekie, D.J. Taylor and D.N. Payne. 1989.
Er3+-Yb3+ and Er3+ Doped Fiber Lasers. J. Lightwave Technol. 7(10):1461.
Page 12
3.4 Conclusion
Energy transfer processes in rare-earth-doped materials have been studied since the
middle of the 20th century. At the beginning, the applications of DET were mainly conversion of
infrared light to visible emission or detection of weak infrared signals with photomultipliers. A
renewal interest appears with the development of optical fibers in which high power density can
25 Auzel, F. 1990. Upconversion Processes In Coupled Ion Systems. J. Lumin. 45(1-6):341.
26 Wright, J.C.. 1976. Up conversion and excited state energy transfer in rare-earth doped
materials. in Topics in applied physics, vol. 15, ed. F.K. Fong, Springer Verlag, N.Y.
27 Reisfeld, R. and C.K. Jorgensen. 1977. in Lasers and Excited States of Rare Earths.
Springer-Verlag, Berlin Heidelberg.
28 Delevaque, E., T. Georges, M. Monerie, P. Lamouler and J.-F. Bayon. 1993. Modeling
of pair-induced quenching in erbium-doped silicate fibers. IEEE Photon. Tech. Lett. 5:73.
29 Wagener, J.L., P.F. Wysocki, M.J.F. Digonnet and H.J. Shaw. 1994. Modeling of ion-
pairs in erbium-doped fiber amplifiers. Opt. Lett. 19:347.
30 Ainslie, B.J., S. P. Craig and R. Wyatt and K. Moulding. 1989. Optical and structural-
analysis of a neodymium-doped silica-based optical fiber. Mater. Lett. 8:204.
31 Maurice, E., G. Monnom, B. Dussardier and D.B. Ostrowsky. 1995. Clustering induced
non-saturable absorption phenomenon in heavily erbium-doped silica fibers. Opt. Lett.
20:2487.
32 Maurice, E., G. Monnom, B. Dussardier and D.B. Ostrowsky. 1996. Clustering effects
on double energy transfer in heavily Ytterbium-Erbium-codoped silica fibers. J. Opt. Soc.
Am., 13:693.
Page 13
be achieved: single energy transfer allows improvement of high power fiber amplifiers and laser
and DET permits realizing point and quasi-distributed fiber sensors.
4. Local structure, valency states and spectroscopy of transition metal ions
Optical fiber materials with very broad-band gain are of great interest for many
applications. Tunability in RE-doped fiber devices is already well established, but limited by
shielding of the optically active electronic orbitals of RE ions. Optically active, unshielded
orbitals are found in transition metal (TM) ions. Some TM-doped bulk solid-state lasers
materials, such as Cr4+:YAG, have demonstrated very good results as broad-band gain media
[37]. Tentatives with other TM ions, like Ni2+ in vitroceramics fiber are also promising [Error:
Reference source not found]. More recently, a 400-nm emission bandwidth was observed from a
fiber whose Cr-doped core was made of Y2O3:A2O3:SiO2 obtained by a rod-in-tube technique
using a Cr4+:YAG rod as core material and a silica tube as cladding material [38].
Little literature exists on chromium- and other TM-doped vitreous bulk silica, although
this issue was addressed in the 70’s [39] to improve transmission of silica optical fibers. Some
reports on chromium-doped glasses have already shown evidence of absorption and near-
infrared (NIR) fluorescence due to Cr4+ in these materials [40,41]. However their compositions
and preparation techniques greatly differ from those of silica optical fibers. Therefore, some
basic studies on the optical properties of TM ions in silica-based optical fibers are needed. In
particular, the final TM oxidation state(s) in the fiber core strongly depend(s) on the preparation
process. Also, the optical properties (absorption and luminescence) of one particular oxidation
33 Berthou, H. and C.K. Jörgensen. 1990. Optical-fiber temperature sensor based on
upconversion-excited fluorescence. Opt. Lett, 15:1100.
36 Maurice, E., G. Monnom , D.B. Ostrowsky and G.W. Baxter. 1995. 1.2 µm-Transitions
in Erbium-doped fibers: the Possibility of Quasi-Distributed Temperature Sensors. Appl.
Optics, 34:4196.
Page 14
state of a TM ion varies from one host composition and structure to another, due to variations of
the crystal-field (so-called ligand field in glass) [42]. Hence the interpretation of absorption and
emission spectroscopy is difficult. Because no luminescence spectroscopy of the TM-doped
silica fibers had been reported before, we have contributed to explore this field. We have
studied the influence of the chemical composition of the doped region on the Cr-oxidation states
and on the spectroscopic properties of the samples. We have also studied the optical properties
versus the experimental conditions (temperature and pump wavelength). We describe the
experimental details specifically used for TM-doped fibers, then we summarize all results and
interpretations.
4.1 Fabrication and characterization of Chromium-doped samples
The preforms and fibers were prepared as described in §2.1, using Cr3+-salt alcoholic
doping solution and oxygen or nitrogen (neutral) atmosphere for the drying-to-collapse stages.
Three different types of samples containing Ge or/and Al were prepared, referred to as Cr(Ge),
Cr(Ge-Al) and Cr(Al), respectively. The total chromium concentration ([Cr]) was varied from
below 50 mol-ppm to several thousands mol ppm. Above several 100s mol ppm, preform
samples had evidence of phase separation causing high background optical losses, whereas
fibers (few 10s mol ppm) did not show phase separation and had low background losses
(<1 dB/m). The oxidation states of Cr and their relative concentrations were analyzed by
Electron Paramagnetic Resonance, whereas the absolute content of all elements (including Cr)
was analyzed by Plasma Emission Spectroscopy.
Absorption spectra were analyzed using the Tanabe-Sugano (T.-S.) formalism [43] to
compare our assignments to optical transitions with reports on Cr3+- and Cr4+-doped materials.
This formalism helps predicting the energy of electronic states of a TM in a known ligand field
symmetry as a function of the field strength Dq and the phenomenologic B and C so-called
Racah parameters (all in cm-1, Fig. 5). The Dq/B ratio allows the qualitative determination of
some optical properties of TM ions, such as strength, energy and bandwidth of optical
Page 15
transitions. We have also estimated the absorption cross-sections using results from composition
and valency measurements. Absorption and emission spectroscopies including decay
measurements were performed on both preforms and fibers, at room temperature (RT) and low
temperature (LT, either 12 or 77 K), using various pump wavelengths: 673, 900 and 1064 nm.
Full details of the experimental procedures are given in [44,45,46].
4.2 Principal results
By slightly modifying the concentration in germanium and/or aluminium in the core of
the samples, their optical properties are greatly modified. In particular, we have shown that:
i) Only Cr3+ and Cr4+ oxidation states are stabilized. Cr3+ is favoured by Ge co-
doping, and lies in octahedral site symmetry (O), as in other oxide glasses [47]. Cr4+ is present in
all samples. This valency is promoted by Al co-doping or when [Cr] is high, and lies in a
distorded tetrahedral site symmetry (Cs) [48,49]. The low-doped Cr(Al) samples contain only Cr4+
and their absorption spectra are similar to those of aluminate [Error: Reference source not
found] and alumino-silicate glasses [Error: Reference source not found] and even crystalline
YAG (Y3Al5O12) [50]. Glass modifiers like Al induce major spectroscopic changes, even at low
concentrations (~1-2 mol%). This would help engineering the Chromium optical properties in
silica-based fibers, using possibly alternative modifiers.
ii) The absorption spectra have been interpreted and optical transitions assigned for
each present valency state (Fig. 6). The absorption cross sections curves (abs) were estimated.
For Cr3+, abs(Cr3+, 670 nm)= 43 x 10-24 m2 is consistent with reported values in other materials,
such as ruby [51] and silica glass [Error: Reference source not found], while abs(Cr4+, 1000
nm)~3.5 x 10⁻²⁴ m2 is lower than in reference crystals for lasers [52] or saturable absorbers [53],
but consistent with estimated values in alumino-silicate glass [Error: Reference source not
found].
iii) Using the T.-S. formalism, we found Dq/B = 1.43 which is lower than the value
were 3T2 and 1E levels cross (Dq/B = 1.6, Fig. 5). As a consequence, the expected emission is
Page 16
along the 3T23A2 transition as a broad featureless NIR band. No narrow emission line from the
1E state is expected, in agreement with fluorescence measurements. Dq/B is lower than those
reported for Cr4+ in laser materials like YAG and Forsterite [Error: Reference source not found].
iv) The LT fluorescence from Cr4+ spreads over a broad spectral domain, from 850 to
1700 nm, and strongly varies depending on core chemical composition, [Cr] and p (pump
wavelength). The observed bands were all attributed to Cr4+ ions, in various sites. Fig. 7 shows
the fluorescence spectra of Cr4+ in two different types of samples and in various experimental
conditions. Possible emission from other centers (Cr3+, Cr5+, Cr6+) was discussed, but rejected
[45]. The fluorescence sensitivity to [Cr] and p suggests that Cr-ions are located in various
host sites, and that several sites are simultaneously selected by an adequate choice of p (like in
Cr(Ge-Al)). It is also suggested that although Al promotes Cr4+ over Cr3+ when [Cr] is low, Cr4+
is also promoted in Ge-modified fibers at high [Cr].
v) The strong decrease of fluorescence from LT to RT is attributed to temperature
quenching caused by multiphonon relaxations, like in crystalline materials where the emission
drops by typically an order of magnitude from 77 K to 293 K [Error: Reference source not
found].
vi) The LT fluorescence decays are non-exponential (Fig. 8) and depend on [Cr] and
s. The fast decay part is assigned to Cr clusters or Cr4+-rich phases within the glass. The 1/e-
lifetimes () at s = 1100 nm are all within the 15-35 s range in Al-containing samples,
whereas ~ 3-11 s in Cr(Ge) samples, depending on [Cr]. The lifetime of isolated ions (iso),
measured on the exponential tail decay curves (not shown) reach high values: iso~200 to 300 µs
at s~1100 nm, iso~70 µs at s~1400 nm. In the heavily-doped Cr(Ge) samples, iso is an order
of magnitude less. Hence, Cr4+ ions are hosted in various sites: the lowest energy ones suffer
more non-radiative relaxations than the higher energy ones. Also presence of Al improves the
lifetime, even at high [Cr]. It is estimated that at RT, lifetime would be of the order of 1 µs or
less. This fast relaxation time, compared to RE ions (~1 ms) has been implemented as a
fiberized saturable absorber in a passively Q-switched all-fiber laser [54].
Page 17
4.3 Conclusion
The observed LT fluorescence of Cr4+ is extremely sensitive to glass composition, total Cr
concentration and excitation wavelength. Using Aluminum as a glass network modifier has
advantages: longer excited state lifetime and broader fluorescence bandwidth than in
Germanium-modified silica. A combination of Al and Ge glass modification induces the
broadest fluorescence emission in the NIR range, to our knowledge, exhibiting a 550 nm-
bandwidth. However, increasing the quantum efficiency is now necessary for practical fiber
amplifiers and light sources. Further investigations concluded to the necessity of local
surrounding TM ions with a different material, i.e. having sensibly different chemical and
physical properties compared to pure silica, in order to improve the local site symmetry and
hence minimize NRD. Preliminary implementation of this principle was reported recently,
concerning Cr3+ ions in post-heat-treated Ga-modified silica fibers [55]. When engineering of the
local dopant environment will be possible, then practical TM-doped silica-based amplifying
devices will be at hand.
5. Phonon interactions / non-radiative relaxations: improvement of Tm3+ efficiency
Thulium-doped fibers have been widely studied in the past few years. Because of Tm3+
ion rich energy diagram, lasing action and amplification at multiple infrared and visible
47 Rasheed, F., K.P. O’Donnell, B. Henderson and D.B. Hollis. 1991. Disorder and the
optical spectroscopy of Cr3+-doped glasses: I. Silicate glasses. J. Phys.: Condens. Matter.
3:1915.
48 Anino, C., J. Théry and D. Vivien. 1997. New Cr4+ activated compounds in tetrahedral
sites for tunable laser applications. Opt. Mat. 8:121.
49 note: In the following the energy states are referred to by their irreductible representation
in the Td symmetry coordination (ground state is 3A2)).
Page 18
wavelengths are allowed. Thanks to the possible stimulated emission peaking at 1.47 µm (3H4
=> 3F4, see Fig. 9), discovered by Antipenko et al. [56], one of the most exciting possibilities of
Tm3+ ion is amplifying optical signal in the S-band (1.47–1.52 µm), in order to increase the
available bandwidth for future optical communications. Unfortunately, the upper 3H4 level of
this transition is very close to the next lower 3H5 level so non-radiative de-excitations (NRD) are
likely to happen in high phonon energy glass host, causing detrimental gain quenching.
38 Chen, J.-C., Y.-S. Lin, C.-N. Tsai, K.-Y. Huang, C.-C. Lai, and W.-Z. Su.
2007. 400-nm-bandwidth emission from a Cr-doped glass fiber. IEEE
Phot. Technol. Lett. 19(8):595.
39 Schultz, P.C.. 1974. Optical Absorption of the Transition Elements in Vitreous Silica, J.
Am. Ceram. Soc. 57:309.
40 Cerqua-Richardson, K., B. Peng and T. Izumitani. 1992. Spectroscopic Investigation of
Cr4+-doped glasses. in OSA Proc. Advanced Solid-State Lasers (1992), eds. L.L. Chase
and A.A. Pinto (Optical Society of America), 13:52.
41 Hömmerich, U., H. Eilers, W.M. Yen, J.S. Hayden and M.K. Aston. 1994. Near infrared
emission at 1.35 m in Cr doped glass. J. Lum. 60&61:119.
42 Henderson, B. and G.F. Imbush, in Optical Spectroscopy of Inorganic Solids (Clarendon,
Oxford, 1989).
43 Sugano, S., Y. Tanabe and H. Kamimura, in Multiplets of Transition-Metal Ions in
Crystals (Academic Press, New York, 1970).
44 Felice, V., B. Dussardier, J.K. Jones, G. Monnom and D.B. Ostrowsky. 2001. Chromium-
doped silica optical fibers : influence of the core composition on the Cr oxidation states
and crystal field. Opt. Mat. 16:269.
Page 19
5.1 Oxide modifiers influence on the 3H4-level lifetime
To address this problem, we have studied the effect of some modifications of Tm3+ ion
local environment. Keeping the overall fiber composition as close as possible to that of a
standard silica fiber, we expect to control the rare-earth spectroscopic properties by co-doping
with selected modifying oxides. We have studied the incorporation of modifying elements
compatible with MCVD. GeO2 and AlO3/2 are standard refractive index raisers in silica. AlO3/2 is
also known to improve some spectroscopic properties of Er3+ ion for C-band amplification
[Error: Reference source not found] and to reduce quenching effect through clustering in highly
rare-earth-doped silica [57]. Both oxides have a lower maximum phonon energy than silica. We
use high phonon energy PO5/2 as opposite demonstration. GeO2 and PO5/2 concentrations are 20
and 8 mol%, respectively. AlO3/2 concentration is varied from 5.6 to 17.4 mol%. Tm3+
concentration is less than 200 mol ppm.
To investigate the role of the modification of the local environment, decay curves of the
810 nm fluorescence from the 3H4 level were recorded. All decay curves measured are non-
exponential. This can be attributed to several phenomena and will be discussed in this article.
Here, we study the variations of 1/e lifetimes () versus concentration of oxides of network
45 Felice, V., B. Dussardier, J.K. Jones, G. Monnom and D.B. Ostrowsky. 2000. Cr4+-doped
silica optical fibers : absorption and fluorescence properties. Eur. Phys. J. AP, 11:107.
46 Dussardier, B., Y. Guyot, V. Felice, G. Monnom and G. Boulon. 2002. Cr4+-doped silica-
based optical fibers fluorescence from 0.8 µm to 1.7 µm. in Proc. Advanced Solid State
Lasers, in Trends in Optics and Photonics Series (OSA), ISBN: 1-55752-697-4, 68:104.
50 Moncorgé, R., H. Manaa and G. Boulon. 1994. Cr4+ and Mn5+ actives centers for new
solid state laser materials. Opt. Mat. 4:139.
54 Tordella, L., H. Djellout, B. Dussardier, A. Saïssy and G. Monnom. High repetition rate
passively Q-switched Nd3+:Cr4+ all-fiber laser. Electron. Lett., 39:1307.
Page 20
modifiers (Al or P) and formers (Ge). The lifetime strongly changes with the composition of the
glass host. The most striking results are observed within the Tm(Al) sample series: linearly
increases with increasing AlO3/2 content, from 14 µs in pure silica to 50 µs in sample Tm(Al)
containing 17.4 mol% of AlO3/2. The lifetime was increased about 3.6 times. The lifetime of the
20 mol% GeO2 doped fiber Tm(Ge) was increased up to 28 µs whereas that of the 8 mol% PO5/2
doped fiber Tm(P) was reduced down to 9 µs. We see that aluminum codoping seems the most
interesting route among the three tested codopants.
5.2 Non-exponential shape of the 810-nm emission decay curves
All fluorescence decay curves from the 3H4 level are non-exponential. We have
investigated the reasons for this non-exponential shape in various silica glass compositions. We
observed that the decay curve shape depends only on the Al-concentration, even in the presence
of Ge or P in samples Tm(Ge) and Tm(P), respectively [58]. It is thought that Tm3+ ions are
inserted in a glass which is characterized by a multitude of different sites available for the rare-
earth ion, leading to a multitude of decay constants. This phenomenological model was first
proposed by Grinberg et al. and applied to Cr3+ in glasses [59]. Here we apply this model, for the
first time to our knowledge, to Tm3+-doped glass fibers. In this method, a continuous
distribution of lifetime rather than a number of discrete contributions is used. The advantage of
this method is that no luminescence decay model or physical model of the material is required a
priori. The luminescence decay is given by:
€
I()≈ Aiexp−/i[ ]i∑
(2)
where A() is the continuous distribution of decay constant.
55 Dvoyrin, V.V., V.M. Mashinsky, V.B. Neustruev, E.M. Dianov, A.N. Guryanov and A.A.
Umnikov. 2003. Effective room-temperature luminescence in annealed chromium-doped
silicate optical fibers. J. Opt. Soc. Am. B. 20:280.
Page 21
The procedure for calculating A() and the fitting algorithm are described in detail in
[Error: Reference source not found]. For the fitting procedure, we considered 125 different
values for i, logarithmically spaced from 1 to 1000 µs. By applying this procedure to all the
decay curves, a good matching was generally obtained. For a given composition (Fig. 10), we
can notice two main distributions of the decay constant. With the aluminium concentration, they
increase from 6 to 15 µs and from 20 to 50 µs, respectively. For the highest aluminium
concentration (9 mol%, in Tm(Ge) and Tm(P)), these two bands are still present (not shown in
the figure). One is around 10 µs and the second one spreads from 30 to 100 µs, for both
compositions (Tm(Ge) and Tm(P)). According to the phenomenological model, the width of the
decay constants distribution is related to the number of different sites. The large distribution
around 80 µs is then due to a large number of sites available with different environments. It is
however remarkable that this distribution at 80 µs is very similar in both sample types. From
the Tm3+ ion point of view (considering luminescence kinetics), Tm(Ge) and Tm(P) glasses
seem to offer the same sites.
The meaning of the decay constant values is now discussed. Lifetime constants obtained
from the fitting can be correlated with the one expected for Thulium located in a pure silica or
pure Al2O3 environment. The 3H4 lifetime is calculating by using this equation:
€
1=1rad+Wνr (3)
where rad corresponds to the radiative lifetime which is given to be 670 µs in silica [60].
Wnr is the non-radiative decay rate, expressed as [61]:
€
Wνr=W0×exp−a(ΔE−2Ep)[ ] (4)
57 Arai, K., H. Namikawa, K. Kumata, T. Honda, Y. Ishii, and T. Handa. 1986. Aluminium
or phosphorus co-doping effects on the fluorescence and structural properties of
neodymium-doped silica glass. J. Appl. Phys. 59(10):3430.
Page 22
where W0 and a are constants depending on the material, ΔE is the energy difference
between the 3H4 and 3H5 levels and Ep is the phonon energy of the glass. W0 and a were
estimated for different oxide glasses [Error: Reference source not found, 62]. The energy
difference ΔE was estimated by measuring the absorption spectrum of the fibers. When Al
concentration varies, this value is almost constant around 3700 cm-1 [63].
63 Faure, B., W. Blanc, B. Dussardier, and G. Monnom. 2007. Improvement of the
Tm3+:3H4 level lifetime in silica optical fibers by lowering the local phonon energy. J.
Non-Cryst. Solids 353(29):2767.
34 Krug, P.A., M.G. Sceats, G.R. Atkins, S.C. Guy and S.B. Poole. 1991. Intermediate
excited-state absorption in erbium-doped fiber strongly pumped at 980 nm.. Opt. Lett,
16(24):1976.
35 Maurice, E., G. Monnom, A. Saissy, D.B. Ostrowsky and G.W. Baxter. 1994.
Thermalization effects between upper levels of green fluorescence in Er-doped silica
fibers. Opt. Lett, 19:990.
37 Sennaroglu, A., C.R. Pollock and H. Nathel. 1995. Efficient continuous-wave chromium-
doped YAG laser. J. Opt. Soc. Am. B. 12:930.
51 Cronemeyer, D.C. 1966. Optical absorption characteristics of pink ruby. J. Opt. Soc.
Am. 56:1703.
52 Sennaroglu, A., U. Demirbas, S. Ozharar and F. Yaman. 2006. Accurate determination of
saturation parameters for Cr4+-doped solid-state saturable absorbers. J. Opt. Soc. Am. B
23(2):241.
53 Lipavsky, B., Y. Kalisky, Z. Burshtein, Y. Shimony and S. Rotman. 1999. Some optical
properties of Cr4+-doped crystals. Opt. Mat. 13:117.
Page 23
With these considerations, the 3H4 expected lifetime can be calculated. In the case of
silica glass, silica = 6 µs and for an Al2O3 environment, alumina = 110 µs. These two values are in
accordance with the ones we obtained from the fitting procedure. The distribution of decay
constant around 10 µs corresponds to Tm3+ ions located in almost pure silica environment while
the second distribution is attributed to Tm3+ located in Al2O3 -rich sites.
56 Antipenko, B.M., A.A. Mak, O.B. Raba, K.B. Seiranyan, and T.V. Uvarova. 1983.
"New lasing transition in the Tm3+ ion", New lasing transition in the Tm3+ ion. Sov. J.
Quant. Electron. 13(4):558.
58 Blanc, W., T.L. Sebastian, B. Dussardier, C. Michel, B. Faure, M. Ude, and G.
Monnom. 2008. Thulium environment in a silica doped optical fiber. J. Non-Cryst. Solids
354(2-9):435.
59 Grinberg, M., D.L. Russell, K. Holliday, K. Wisniewski, and Cz. Koepke. 1998.
Continuous function decay analysis of a multisite impurity activated solid. Opt. Comm.
156(4-6):409.
60 Walsh, B.M. and N.P. Barnes. 2004. Comparison of Tm:ZBLAN and Tm:silica fiber
lasers: Spectroscopy and tunable pulsed laser operation around 1.9 µm. Appl. Phys. B.
78 (3-4):325.
61 Van Dijk, J.M.F. and M.F.H. Schuurmans. 1983. On the nonradiative and radiative
decay rates and a modified exponential energy gap law for 4f–4f transitions in rare-earth
ions. J. Chem. Phys. 78(9):5317.
62 Layne, C.B., W.H. Lowdermilk and M.J. Weber. 1977. Multiphonon relaxation of rare-
earth ions in oxide glasses. Phys. Rev. B 16:10.
Page 24
5.3 Conclusion
By adding oxide network modifiers or formers, we demonstrated that aluminium is the
most efficient to improve the 3H4 level-lifetime. This was attributed to a lower local phonon
energy. Potential of the amplification in the S-band was then investigated. In the fiber with the
highest aluminium concentration, gain curve was measured. Although excitation wavelength
(1060 nm), refractive index profile and Thulium concentration were not optimized, a gain of 0.9
dB was obtained at 1500 nm [64]. With a numerical model of the TDFA that we developed [65],
we estimated that a gain higher than 20 dB is reachable in a silica-based TDFA.
6. Rare-earth-doped dielectric nanoparticles
Erbium-doped materials are of great interest in optical telecommunications due to the Er3+
intra-4f emission at 1.54 µm. Erbium-Doped Fiber Amplifiers (EDFA) were developed in silica
glass because of the low losses at this wavelength and the reliability of this glass. Developments
of new rare-earth doped fiber amplifiers aim to control their spectroscopic properties: shape and
width of the gain curve, optical quantum efficiency, .... Standard silica glass modifiers, such as
aluminum, give very good properties to available EDFA. However, for more drastic
spectroscopic changes, more important modifications of the rare-earth ions local environment
are required. To this aim, we present a fiber fabrication route creating rare-earth doped calco-
silicate or calco-phospho-silicate nanoparticles (NP) embedded in silica glass.
6.1 Nanostructured fibers preparation
In the chosen route, NP are not prepared ex-situ and incorporated into the perform. To
prepare them, we take advantage of the heat treatement occurring during the MCVD process.
Their formation is based on the basic principle of phase separation. On the basis of
thermodynamical data such as activity coefficient, entropy of mixing, enthalpy of mixing and
Gibbs-free energy change, the phase diagram of the SiO2-CaO binary compound was derived
using Factstage software (Fig. 11). A miscibility gap is found when the CaO concentration is
between 2 and 30 mol%. In this region, CaO droplets are formed, like oil in water. Such
Page 25
phenomenon is expected during perform fabrication as temperature reaches 2000°C during
collapsing passes.
For Calcium doping, CaCl2 salt was added to the Er3+ containing soaking solution. Four
CaCl2 concentrations were studied (0, 0.001, 0.1 and 1 mol/l). Ge and P were also added by
MCVD. When the Ca concentration was increased in the doping solution, the aspect of the
central core of the preform turned from transparent to milky. This variation is explained by the
structural changes of the core. For preforms with calcium concentration higher than 0.01 mol/l,
NP were observed by Transmission Electron Microscopy (TEM) on preform samples (Fig. 12).
We can clearly observe polydisperse spherical NP with an estimated mean diameter of 50 nm.
Smaller particles of 10 nm are visible. The size of the biggest particles was around 200 nm (not
shown in Fig. 12). When the Ca concentration decreases, the size distribution of the particles is
nearly identical but the density is lower. The composition of the core was investigated by
Energy Dispersive X-ray analysis: the NP contained equal amounts of Ca, P and Si cations,
whereas only Si cations was detected in the surrounding matrix. Ge seemed to be
homogeneously distributed over the entire glass. The most important finding is that Er3+ ions
and Ca were detected only within the NP.
6.2 Erbium emission characterizations
Spectroscopic characterizations on the emission line associated to the 4I13/2-4I15/2 transition
at 1.54 µm were made at room temperature on Er-doped samples with (sample A) and without
(sample B) calcium. The results are shown in Fig. 13 where we evidence the fact that the
emission spectrum of sample A is broader than that of sample B. To explain these differences
we have studied the Er3+ local environment. EXAFS measurements at the Er-LIII edge (E=8358
eV) were carried out at the GILDA-CRG beamline at the European Synchrotron Radiation
Facility. In sample A the rare-earth is linked to O atoms in the first coordination shell and to Si
or P atoms (these two atoms can not be distinguished due to the similar backscattering
amplitude and phase) in the second shell in a way similar to that already observed in silicate
Page 26
glasses [66], phosphate glasses [67]. Also the structural parameters (about 7 O atoms at 2.26 Å
and Si (or P) atoms at 3.6 Å corresponding to a Er-O-Si (or P) bond angle of ≈140 deg) are in
good agreement with the cited literature. Si(or P) atoms are visible as they belong to the same
SiO4 (or PO4) tetrahedron as the first shell O atoms but no further coordination shells are
detected. This permits to state that an amorphous environment is realized around Er 3+ ions. On
the other hand sample B presents a completely different EXAFS signal that is well comparable
with the spectrum of ErPO4. This means that Er in this case is inserted in a locally well ordered
phase of about a few coordination shells (around 4-5 Å around the absorber). The fact that TEM
on this sample reveals a uniform sample is not in contradiction with this result; it just means that
this phase is not spatially extended to form nm-sized NP (in our TEM analyses the spatial
resolution is limited to few nm) but the ordering is extremely local, i.e. it is limited to only a
few shells around the rare-earth ion.
From these considerations, the broadening of the emission spectrum observed in
sample A can be attributed to an inhomogeneous broadening due to Er3+ ions located in a more
disordered environment compare to sample B. Here we see that the cumulated effects of Ca and
P within the Er-doped NP both amorphize the material structure around Er3+ ions and increase
the fluorescence inhomogeneous broadening.
6.3 Conclusion
In this paragraph, we have demonstrated that through the phase separation mechanism,
nanoparticles can be obtained in preforms by adding Calcium. Er3+ ions are found to be located
only into these nanoparticles. An inhomogeneous broadening of the emission band is observed,
associated to Er3+ ions located in a more disordered environment compare to silica. This feature
is particularly interesting in the production of materials for Wavelength Division Multiplexing
applications, such as Erbium-Doped Fiber Amplifier with a broader band gain.
Page 27
7. Perspectives and conclusion
The choice of a glass to develop new optical fiber component is most of the time a result
of compromises. Silica glass is the most widely used for its many advantages (reliability, low
cost fabrication, …). However, it suffers from different drawbacks, such as high phonon energy
or low luminescent ions solubility, which affect quantum efficiency or emission bandwidth of
luminescent ions, for example. We have shown in several cases that spectroscopic properties of
dopants are not directly related to the average properties of the doped glass, but to their local
environment. Indeed, by slightly modifying the silica composition, we succeeded to control the
Chromium valence state and improve the Thulium emission efficiency. Moreover, we present
interest of high doping level to take advantage of energy transfers. Then, nanostructuration of
doped fiber is proposed as a new route to ‘engineer’ the local dopant environment. All these
results will benefit to optical fiber components such as lasers, amplifiers and sensors, which can
now be realized with silica glass.
Page 29
Figures captions
Fig. 1: Schematic energy diagram of (a) single energy transfer between two ions, (b) double
energy transfer.
Fig. 2 : Absorption of the Er-1 and Er-2 fibers vs launched pump power. Squares: experimental
data; solid lines: cluster model for 0%, 10% and 52% of Er3+-ions in clusters; vertical
arrows: non-saturated absorption as a difference with simulation for 0% cluster.
Fig. 3 : Energy scheme for the DET process. Level energies are in cm-1; their lifetimes between
round brackets.
Fig. 4 : Natural logarithm of measured intensity ratio (R) plotted against the inverse of
temperature.
Fig. 5: Normalized Tanabe-Sugano energy level diagram for Cr4+ in tetrahedral ligand field (Td
symmetry) showing the energy states of interest, for C/B = 4.1. The free ion states are
shown on the left of the ordinate axis. The dashed line (Dq/B = 1.43) reveals the relative
positions of the states found for Cr4+ in the silica-based samples: the first excited state
level is 3T2(3F).
Fig. 6:. Background corrected absorption from (left) a Cr(Ge) preform ([Cr] = 1400 ppm) and
(right) a Cr(Al) fiber ([Cr] = 40 ppm). Circles: experimental data; Solid lines: adjusted
bands to Cr3+ (left) and Cr4+ (right) transitions, respectively; and resulting absorption
spectra. Assignments are indicated from the ground level Cr3+:4A2 or Cr4+:3A2 to the
indicated excited level, respectively. The Cr4+:3T2 level three-fold splitting is due to
distorsion from perfect tetrahedral symmetry. The spin-forbidden Cr3+:4A22E and
Cr4+:3A21E transitions are not visible and overlapping with the intense spin-allowed
transitions.
Page 30
Fig. 7: Fluorescence spectra: (a) fiber Cr(Al):[Cr] = 40 ppm, p = 900 nm, T=77 K, (b) preform
Cr(Ge-Al): [Cr] = 300 ppm, p = 673 nm, T=12K.
Fig. 8: Fluorescence decays from Cr(Al) samples, p = 673 nm, T=12 K: (a) s~1100 nm and
[Cr]=40 ppm, (b)s~1100 nm, [Cr]=4000 ppm, and (c) s~1400 nm, [Cr]=4000 ppm
Fig. 9: Schematic energy diagram of Tm3+ ion, showing the relevant multiplets. Solid arrows:
absorption and emission optical transitions; thick arrow: NRD (non-radiative de-
excitation) across the energy gap between the 3H4 and 3H5 multiplets, E~ 3700 cm-1.
Fig. 10 : Histograms of the recovered luminescence decay time distributions obtained for silica-
based Tm3+-doped fibers with phosphorus incorporated in the core and different Al2O3
concentration.
Fig. 11: Miscibility-gap in the derived phase-diagram of binary SiO2-CaO glass
Fig. 12: TEM image from preform sample doped with Ca and P.
Fig. 13 : Room temperature emission spectra of Er-doped preform with (sample A) and without
(sample B) Calcium. Samples were excited at 980 nm.
Page 31
Fig. 1: Schematic energy diagram of (a) single energy transfer between two ions, (b) double
energy transfer.
Page 32
0 10 20 30 40 50
0
1
2
3
4
A (dB)
0%
10%
52%
Er 2 fiber
Er 1 fiber
NSA
P (mW)in
Fig. 2 : Absorption of the Er-1 and Er-2 fibers vs launched pump power. Squares: experimental
data; solid lines: cluster model for 0%, 10% and 52% of Er3+-ions in clusters; vertical
arrows: non-saturated absorption as a difference with simulation for 0% cluster.
Page 33
Fig. 3 : Energy scheme for the DET process. Level energies are in cm -1; their lifetimes between
round brackets.
Page 34
1
-0 . 5
0 . 5
1 . 5
Ln ( R )
2 31000/ T ( K)
Fig. 4 : Natural logarithm of measured intensity ratio (R) plotted against the inverse of
temperature.
Page 35
0 2 41 3
60
30
0
Dq/B1.43
3F
1D3P
3T1 (3P) 3T1 (3F)
3T2 (3F)
3A2 (3F)
1E (1D)
Fig. 5: Normalized Tanabe-Sugano energy level diagram for Cr4+ in tetrahedral ligand field (Td
symmetry) showing the energy states of interest, for C/B = 4.1. The free ion states are
shown on the left of the ordinate axis. The dashed line (Dq/B = 1.43) reveals the relative
positions of the states found for Cr4+ in the silica-based samples: the first excited state
level is 3T2(3F).
Page 36
Fig. 6:. Background corrected absorption from (left) a Cr(Ge) preform ([Cr] = 1400 ppm) and
(right) a Cr(Al) fiber ([Cr] = 40 ppm). Circles: experimental data; Solid lines: adjusted
bands to Cr3+ (left) and Cr4+ (right) transitions, respectively; and resulting absorption
spectra. Assignments are indicated from the ground level Cr3+:4A2 or Cr4+:3A2 to the
indicated excited level, respectively. The Cr4+:3T2 level three-fold splitting is due to
distorsion from perfect tetrahedral symmetry. The spin-forbidden Cr3+:4A22E and
Cr4+:3A21E transitions are not visible and overlapping with the intense spin-allowed
transitions.
Page 37
Fig. 7: Fluorescence spectra: (a) fiber Cr(Al):[Cr] = 40 ppm, p = 900 nm, T=77 K, (b) preform
Cr(Ge-Al): [Cr] = 300 ppm, p = 673 nm, T=12K.
Page 38
0,001
0,01
0,1
1
0 100 200 300 400
Time (µs)
(a)
(c)
(b)
Fig. 8: Fluorescence decays from Cr(Al) samples, p = 673 nm, T=12 K: (a) s~1100 nm and
[Cr]=40 ppm, (b) s~1100 nm, [Cr]=4000 ppm, and (c) s~1400 nm, [Cr]=4000 ppm
Page 39
3H6
3F4
3H4
3H5
N RD
785 nm 810 nm
1 47 0 nm (S -b an d)
ΔE
Fig. 9: Schematic energy diagram of Tm3+ ion, showing the relevant multiplets. Solid arrows:
absorption and emission optical transitions; thick arrow: NRD (non-radiative de-
excitation) across the energy gap between the 3H4 and 3H5 multiplets, ΔE~ 3700 cm-1.
Page 40
Fig. 10 : Histograms of the recovered luminescence decay time distributions obtained for silica-
based Tm3+-doped fibers with phosphorus incorporated in the core and different Al 2O3
concentration.
Page 41
Fig. 11: Miscibility-gap in the derived phase-diagram of binary SiO2-CaO glass
Page 42
Fig. 12: TEM image from preform sample doped with Ca and P.
Page 43
64 Blanc W., P. Peterka, B. Faure, B. Dussardier, G. Monnom, I. Kasik, J. Kanka, D.
Simpson, and G. Baxter. 2006. Characterization of a thulium-doped silica-based optical
fiber for S-band amplification. SPIE Proc. 6180:181.
65 Peterka P., B. Faure, W. Blanc, M. Karasek, and B. Dussardier. 2004. Theoretical
modelling of S-band thulium-doped silica fiber amplifiers. Opt. Quant. Electron. 36(1-
3):201.
66 D'Acapito, F., S. Mobilio, L. Santos, and R. Almeida. 2001. Local environment of rare-
earth dopants in silica-titania-alumina glasses: an extended x-ray absorption fine
structure study at the K edges of Er and Yb. Appl. Phys. Lett. 78(18):2676.
67 D'Acapito, F., S. Mobilio, P. Bruno, D. Barbier, and J. Philipsen. 2001. Luminescent
properties of local atomic order of Er3+ and Yb3+ ions in aluminophosphate glasses. J.
Appl. Phys. 90(1):265.
Page 44
Fig. 13 : Room temperature emission spectra of Er-doped preform with (sample A) and without
(sample B) Calcium. Samples were excited at 980 nm.