The revised operational risk framework develops the Standardised Measurement Approach (SMA) providing a single non-model-based method for the estimation of operational risk capital
which will withdrawal the AMA
• Internationally active banks on
a consolidated basis.
• Supervisors could apply the SMA
framework to non-internationally
active institutions.
• International Convergence of Capital Measurement
and Capital Standards – Basel II, published by the
BCBS in June 2006.
• CP on operational risk - revision to the simpler
approaches, published by the BCBS in October 2014.
Scope of application
• Comments should be
uploaded by 3 June
2016.
• The BCBS will conduct
a QIS in 2016.
Next steps
Main content
• The revised operational risk framework will be based on the Standardised Measurement Approach (SMA) which is a
single non-model-based method for estimating the operational risk capital.
SMA for operational risk
Business Indicator (BI)
Executive summary
Executive Summary
BI Component Internal Loss Multiplier
Loss Component
• Banks in bucket 1: it
corresponds solely to
the BI component.
• Banks in buckets 2-5:
it results from
multiplying the BI
component by the
internal loss multiplier.
SMA requirement
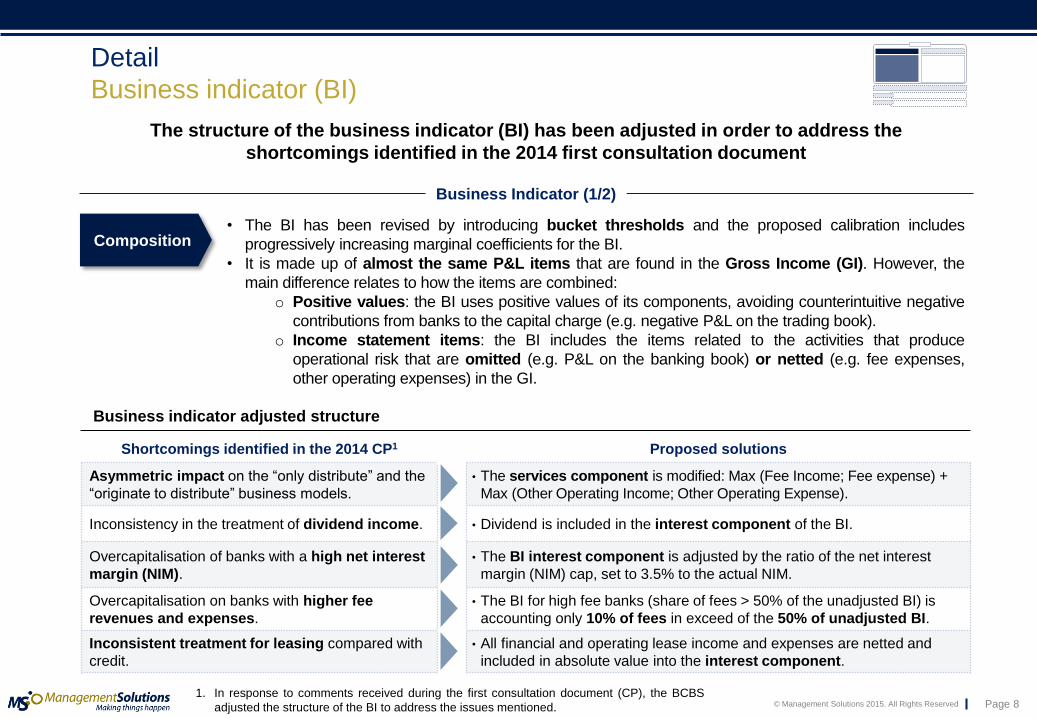
• Banks have to calculate their BI which is made up of almost the same P&L items that compose the Gross Income (GI), although the BI uses positive value of its components.
The SMA capital requirement will be calculated by considering the business indicator (BI) and the internal loss multiplier (ILM) as inputs. The formula used would vary
across buckets assigned to each entitry
Detail
SMA for operational risk
• The SMA combines the Business Indicator (BI), a simpler financial statement proxy of operational risk exposure, with
bank-specific operational loss data.
SMA framework
1. Banks with BI < €1.000m.
2. The amount of €100m corresponds to banks in bucket 2. For banks in buckets 3-5 the
amount will be different, as specified in the table of slide 11.
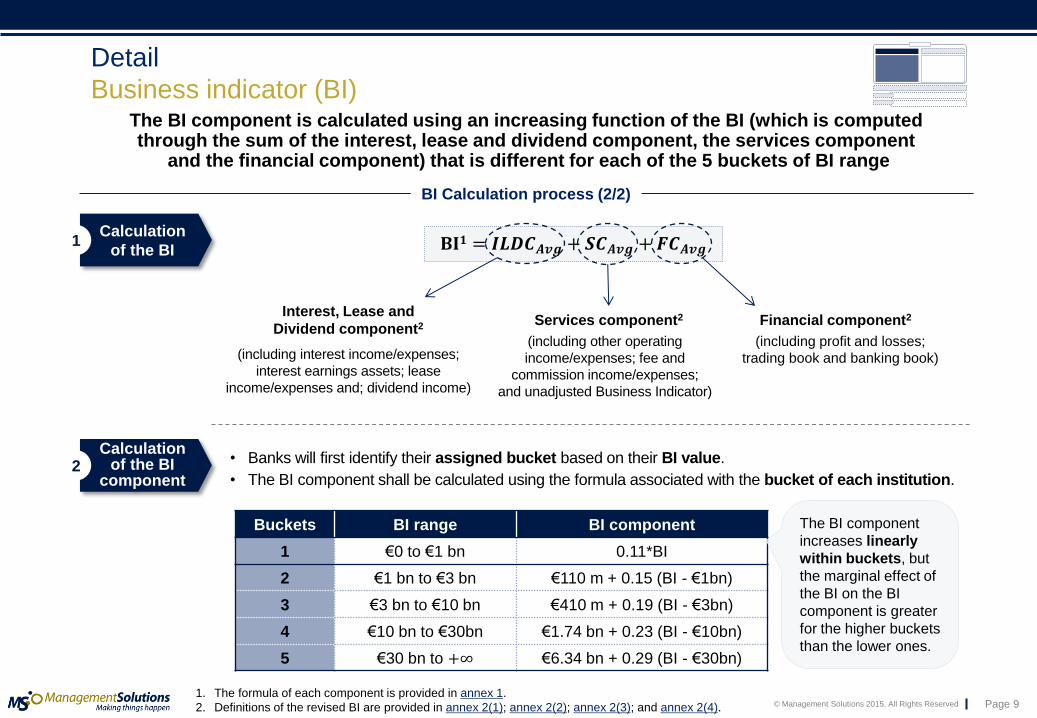
The BI component is calculated using an increasing function of the BI (which is computed through the sum of the interest, lease and dividend component, the services component
and the financial component) that is different for each of the 5 buckets of BI range
Detail
Business indicator (BI)
BI Calculation process (2/2)
Calculation
of the BI
1. The formula of each component is provided in annex 1.
2. Definitions of the revised BI are provided in annex 2(1); annex 2(2); annex 2(3); and annex 2(4).
Calculation of the BI
component
• Banks will first identify their assigned bucket based on their BI value.
• The BI component shall be calculated using the formula associated with the bucket of each institution.
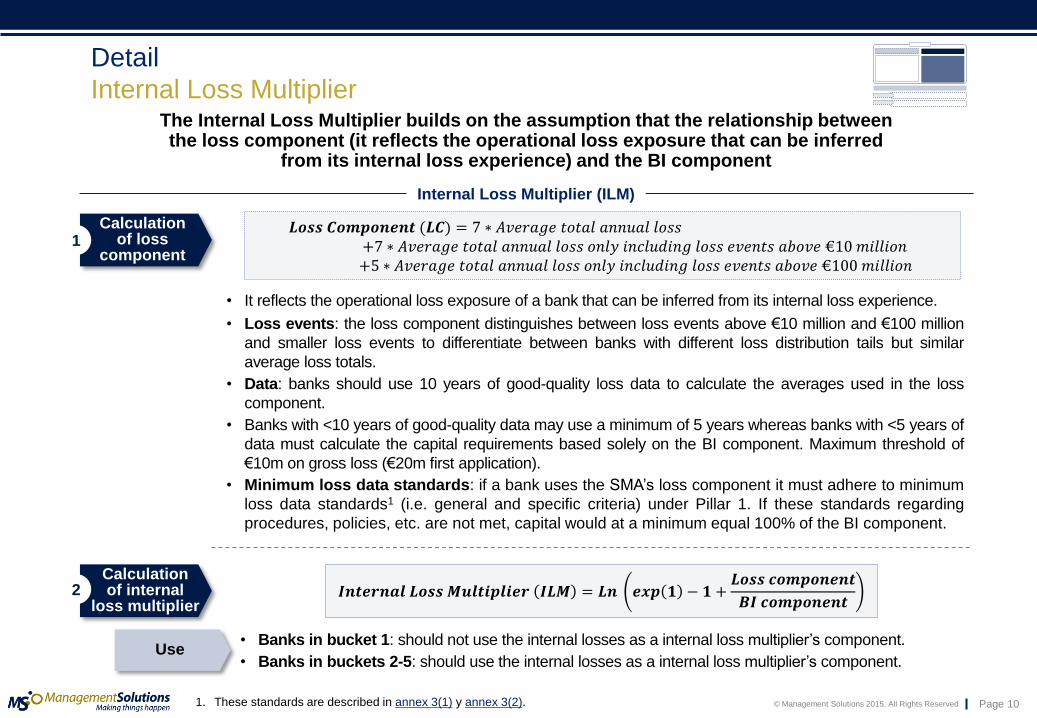
The Internal Loss Multiplier builds on the assumption that the relationship between the loss component (it reflects the operational loss exposure that can be inferred
from its internal loss experience) and the BI component
Internal Loss Multiplier (ILM)
Calculation of loss
component
• It reflects the operational loss exposure of a bank that can be inferred from its internal loss experience.
• Loss events: the loss component distinguishes between loss events above €10 million and €100 million
and smaller loss events to differentiate between banks with different loss distribution tails but similar
average loss totals.
• Data: banks should use 10 years of good-quality loss data to calculate the averages used in the loss
component.
• Banks with <10 years of good-quality data may use a minimum of 5 years whereas banks with <5 years of
data must calculate the capital requirements based solely on the BI component. Maximum threshold of
€10m on gross loss (€20m first application).
• Minimum loss data standards: if a bank uses the SMA’s loss component it must adhere to minimum
loss data standards1 (i.e. general and specific criteria) under Pillar 1. If these standards regarding
procedures, policies, etc. are not met, capital would at a minimum equal 100% of the BI component.
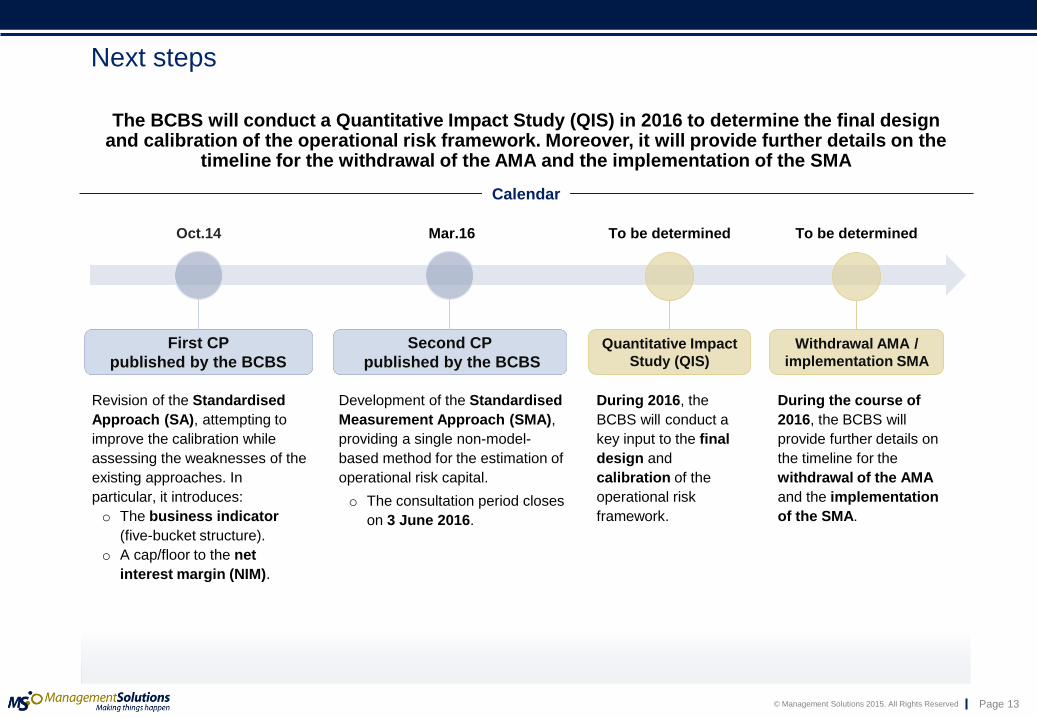
The BCBS will conduct a Quantitative Impact Study (QIS) in 2016 to determine the final design and calibration of the operational risk framework. Moreover, it will provide further details on the
timeline for the withdrawal of the AMA and the implementation of the SMA
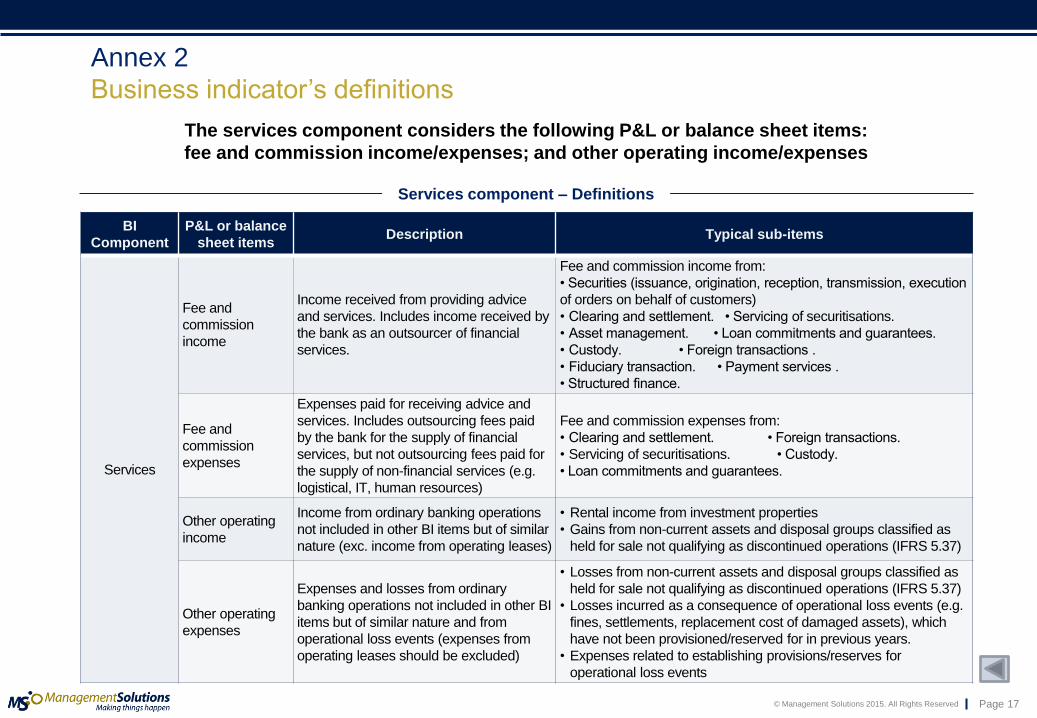
The interest, operating lease and dividend component (ILDC) considers the following P&L or balance sheet items: interest expense/income; interest earning assets;
financial and operating lease income/expenses and dividend income
Annex 2
Business indicator’s definitions
ILD component – Definitions
BI
Component
P&L or balance
sheet items Description Typical sub-items
Interest,
operating
lease and
dividend
Interest income,
except for financial
and operating lease
Interest income from all financial assets
and other interest income
(interest income from financial and
operating leases should be excluded)
• Interest income from loans and advances, assets
available for sale, assets held to maturity, and trading
assets.
• Interest income from hedge accounting derivatives.
• Other interest income.
Interest expenses,
except for financial
and operating lease
Interest expenses from all financial
liabilities and other interest expenses
(interest income from financial and
operating leases should be excluded)
• Interest expenses from deposits.
• Interest expenses from debt securities issued.
• Interest expenses from hedge accounting derivatives.
• Other interest expenses.
Interest earning
assets (balance sheet
item, not P&L)
Total gross outstanding loans, advances, and interest bearing securities (including government
bonds) measured at the end of each financial year.
Financial and
operating lease
income
• Interest income from financial leases.
• Interest income from operating leases.
• Profits from leased assets.
Financial and
operating lease
expenses
• Interest expenses from financial leases.
• Interest expenses from operating leases.
• Losses from leased assets.
• Depreciation and impairment of operating leased assets.
Dividend income
Dividend income from investments in stocks and funds not consolidated in the bank’s financial
statements, including dividend income from non-consolidated subsidiaries, associates and joint
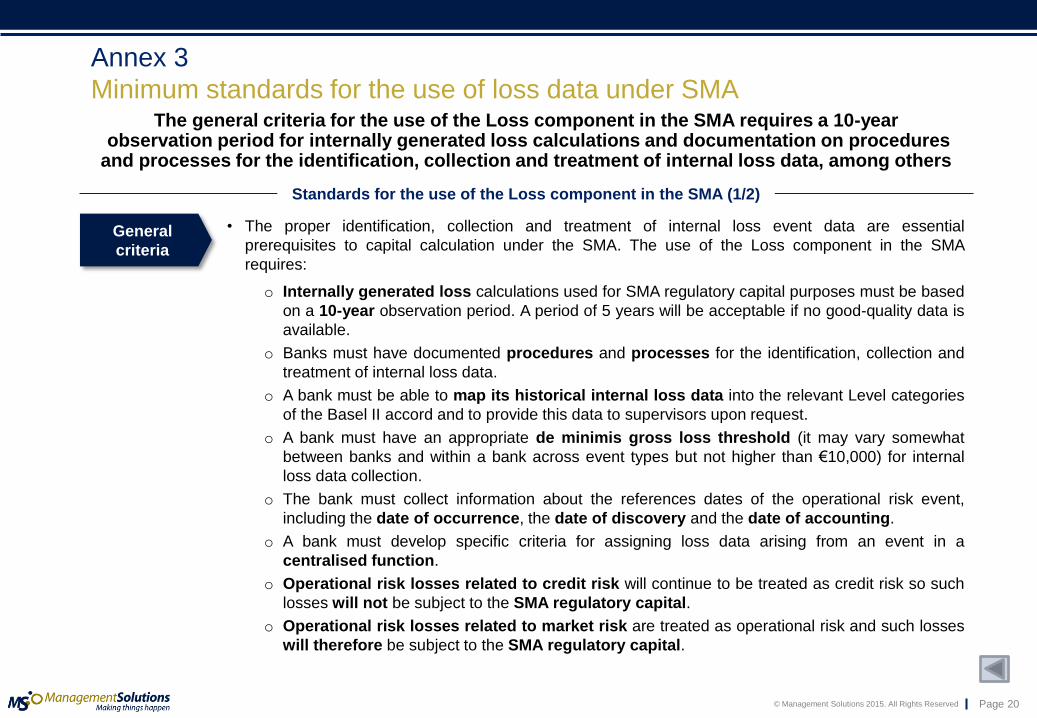
Minimum standards for the use of loss data under SMA
Standards for the use of the Loss component in the SMA (1/2)
The general criteria for the use of the Loss component in the SMA requires a 10-year observation period for internally generated loss calculations and documentation on procedures and processes for the identification, collection and treatment of internal loss data, among others
General
criteria
• The proper identification, collection and treatment of internal loss event data are essential
prerequisites to capital calculation under the SMA. The use of the Loss component in the SMA
requires:
o Internally generated loss calculations used for SMA regulatory capital purposes must be based
on a 10-year observation period. A period of 5 years will be acceptable if no good-quality data is
available.
o Banks must have documented procedures and processes for the identification, collection and
treatment of internal loss data.
o A bank must be able to map its historical internal loss data into the relevant Level categories
of the Basel II accord and to provide this data to supervisors upon request.
o A bank must have an appropriate de minimis gross loss threshold (it may vary somewhat
between banks and within a bank across event types but not higher than €10,000) for internal
loss data collection.
o The bank must collect information about the references dates of the operational risk event,
including the date of occurrence, the date of discovery and the date of accounting.
o A bank must develop specific criteria for assigning loss data arising from an event in a
centralised function.
o Operational risk losses related to credit risk will continue to be treated as credit risk so such
losses will not be subject to the SMA regulatory capital.
o Operational risk losses related to market risk are treated as operational risk and such losses
will therefore be subject to the SMA regulatory capital.
Minimum standards for the use of loss data under SMA
Standards for the use of the Loss component in the SMA (2/2)
The specific criteria is focused on building a proper SMA loss data set from the available internal data. This objective requires to develop policies and procedures to address several features such as gross loss definition, reference date and grouped losses
Specific
criteria
• SMA loss data set: the bank must have a policy that determines criteria for when a loss or an
operational risk event recorded in the internal loss event database should be included for the
calculation of SMA regulatory capital.
Reference
date • The bank must use either the date of discovery or date of accounting for building the SMA loss
data set.
Gross loss, net loss and
recovery
• Gross loss: is a loss before recoveries of any type.
• Net loss: is the loss after taking into account the impact of recoveries.
• Recovery: is an independent occurrence, related to the original loss event, separate in time, in
which funds or inflows of economic benefits are received from a third party.
• Items included in the gross loss computation of the SMA loss data set: direct charges; cost
incurred as a consequence of the event including external expenses with a direct link to the
operational risk event; provisions or reserves accounted for in the P&L against the potential
operational loss impact; losses stemming from operational risk events with a definitive financial
impact; and negative economic impacts booked in a financial accounting period.
• Items excluded from the gross loss computation of the SMA: cost of general maintenance
contracts on property, plan or equipment; internal or external expenditures to enhance the business
after the operational risk event; and insurance premiums.
Grouped
losses
• Losses caused by a common operational risk event or by related operational risk events over
time must be grouped and entered into the SMA loss data set as a single loss.