r i f " ' . ·'f.ii STUDY OF COMMUNITY OPINIONS CONCERNING THE SUMMER 1967 CIVIL DISTURBANCE IN MILWAUKEE by Jonathan A. Slesinger, Ph. D. Associate Professor DATA & PROGRAM LIBRARY SER!l'l Room 4451 Social Science Building University of Wisconsin Madison, Wisconsin 53706 THE UNIVERSITY OF WISCONSIN-MILWAUKEE Office of Applied Social Research School of Social Welfare and Institute of Human Relations April 1, 1968
Transcript
r i
~
f
~
~ "
'
. ·'f.ii
STUDY OF COMMUNITY OPINIONS CONCERNING THE SUMMER 1967 CIVIL DISTURBANCE IN MILWAUKEE
by
Jonathan A. Slesinger, Ph. D. Associate Professor
DATA & PROGRAM LIBRARY SER!l'l Room 4451 Social Science Building University of Wisconsin Madison, Wisconsin 53706
THE UNIVERSITY OF WISCONSIN-MILWAUKEE
Office of Applied Social Research School of Social Welfare
and
Institute of Human Relations
April 1, 1968
ACKNOWLEDGEMENTS
DATA & PROGRAM I.I8Uft-Room 4451 Social Science BuildintJ University of Wi&eonsiR Maditon, Wisconsin 53Jtl .•
The promptness and interest of the following persons made an impossible task not only feasible but successful. Without their sacrifice of personal time and energy as well as their expertise, this study would not exist.
Alan Deutch, Computer Programmer, Survey Research Laboratory, University Extension
Norah Donahoe, Supervisor of Milwaukee interviewers, Survey Research Laboratory, University Extension
Karl Flaming, Assistant Professor, Department of Sociology, UWM George Freskos, Assistant Professor of Sociology and Center for
Community Leadership Development, University Extension Reuban K. Harpole, Specialist, Center for Community Leadership
Development, University Extension Mina Hochstad, Head of Survey Research Laboratory Field
Section, University Extension C. David Hollister, Assistant Professor, Department of
Sociology and School of Social Welfare, ~~ George L. Kelling, Assistant Professor, School of Social
Welfare, UWM, and Department of Social Work, University Extension
Roy 0. Manning, Lecturer, Department of Sociology, UWM Tracy Noble, Assistant to Head of Survey Research Laboratory
Field Section, University Extension Charles Palit, Head of Sampling Section, Survey Research Labo
ratory Field Section, University Extension Steven I. Pflanczer, Assistant Professor, School of Social
Welfare, UWM Irwin D. Rinder, Professor, Department of Sociology, UWM Henry Schmandt, Professor, Department of Political Science
and Urban Affairs, UWM Virginia Schroeder, Head of Coding Section, Survey Research
Laboratory, University Extension David Schultz, Computer Programmer, Survey Research Labora
tory, University Extension Harry L. Sharp, Director, Survey Research Laboratory, University
Extension Margaret Siggelkow, Secretary, School of Social Welfare, ~~ Doris P. Slesinger, Research Specialist, School of Social
Welfare, Ul<JM Edward Wellin, Professor, Department of Anthropology and
Appendix B: A Guide to Statistical Significance in the Tables • • • • • • • • • • • • • • • • • • • Page 41
r \ .I
I
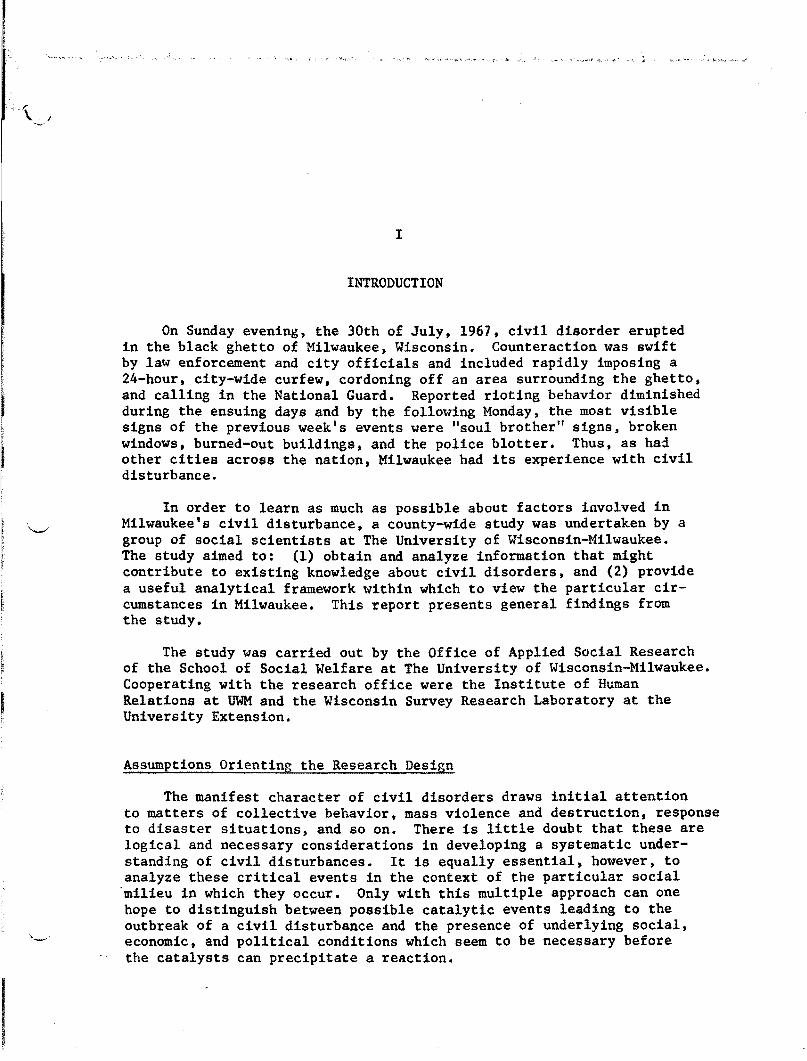
INTRODUCTION
On Sunday evening, the 30th of July, 1967, civil disorder erupted in the black ghetto of Milwaukee, Wisconsin. Counteraction was swift by law enforcement and city officials and included rapidly imposing a 24-hour. city-wide curfew, cordoning off an area surrounding the ghetto, and calling in the National Guard. Reported rioting behavior diminished during the ensuing days and by the follolving Monday, the most visible signs of the previous week's events were "soul brother11 signs, broken windows, burned-out buildings, and the police blotter. Thus, as had other cities across the nation, Milwaukee had its experience with civil disturbance.
In order to learn as much as possible about factors involved in Milwaukee's civil disturbance, a county-wide study was undertaken by a group of social scientists at The University of Wisconsin-Milwaukee. The study aimed to: (1) obtain and analyze information that might contribute to existing knowledge about civil disorders, and (2) provide a useful analytical framework within which to view the particular circumstances in Milwaukee. This report presents general findings from the study.
The study was carried out by the Office of Applied Social Research of the School of Social Welfare at The University of Wisconsin-Milwaukee. Cooperating with the research office were the Institute of Human Relations at UWM and the Wisconsin Survey Research Laboratory at the University Extension.
Assumptions Orienting the Research Design
The manifest character of civil disorders draws initial attention to matters of collective behavior, mass violence and destruction, response to disaster situations, and so on. There is little doubt that these are logical and necessary considerations in developing a systematic understanding of civil disturbances. It is equally essential, however, to analyze these critical events in the context of the particular social
'milieu in which they occur. Only with this multiple approach can one hope to distinguish between possible catalytic events leading to the outbreak of a civil disturbance and the presence of underlying social, economic, and political conditions which seem to be necessary before the catalysts can precipitate a reaction.
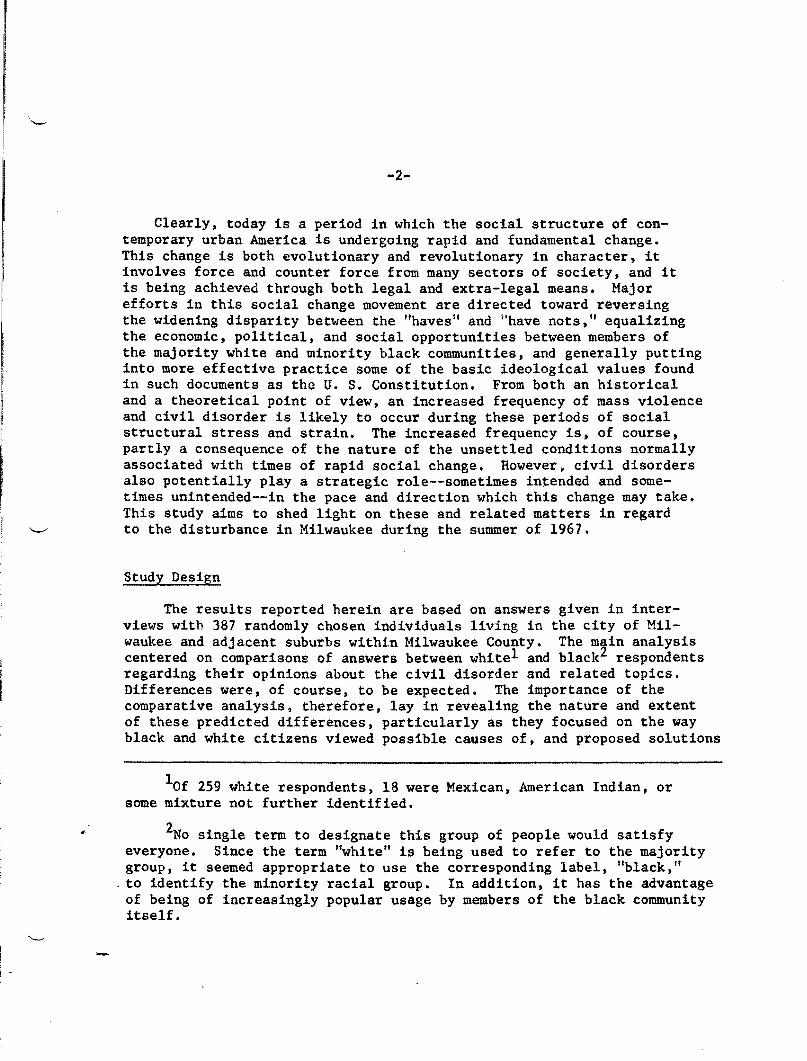
-2-
Clearly, today is a period in which the social structure of contemporary urban America is undergoing rapid and fundamental change. This change is both evolutionary and revolutionary in character, it involves force and counter force from many sectors of society, and it is being achieved through both legal and extra-legal means. Major efforts in this social change movement are directed toward reversing the widening disparity between the "haves 11 and 1'have nots," equalizing the economic, political, and social opportunities between members of the majority white and minority black communities, and generally putting into more effective practice some of the basic ideological values found in such documents as tho U. S. Constitution. From both an historical and a theoretical point of view, an increased frequency of mass violence and civil disorder is likely to occur during these periods of social structural stress and strain. The increased frequency is, of course, partly a consequence of the nature of the unsettled conditions normally associated with times of rapid social change. However. civil disorders also potentially play a strategic role--sometimes in~ended and sometimes unintended--in the pace and direction which this change may take. This study aims to shed light on these and related matters in regard to the disturbance in Milwaukee during the summer of 1967.
Study Design
The results reported herein are based on answers given in interviews with 387 randomly chosen individuals living in the city of Milwaukee and adjacent suburbs within Milwaukee County. The main analysis centered on comparisons of answers between whitel and black2 respondents regarding their opinions about the civil disorder and related topics. Differences were, of course, to be expected. The importance of the comparative analysis, therefore, lay in revealing the nature and extent of these predicted differences, particularly as they focused on the way black and white citizens viewed possible causes of, and proposed solutions
1of 259 white respondents, 18 were Mexican, American Indian, or some mixture not further identified.
2No single term to designate this group of people would satisfy everyone. Since the term 11white" is being used to refer to the majority group, it seemed appropriate to use the corresponding label, "black,n
. to identify the minority racial group. In addition, it has the advantage of being of increasingly popular usage by members of the black community itself.
I
. ..
-3-
to, civil disorders in Milwaukee. Knowledge of the areas in which black and white viewpoints diverge markedly should aid in identifying where new approaches are necessary if problem solving is to be effective.
A secondary comparative analysis was also carried out involving the place of residence of respondents. For this purpose, the county was divided into three areas: (1) the "inner city, 11 defined for purposes of this study as the a3ea cordoned off during the disturbance and subsequent curfew period; (2) the "outer city," the remainder of the city of Milwaukee; and (3) the 11suburbs,;1 the area outside the city limits but within Milwaukee County.
The sample of respondents was drawn so as to be representative of Milwaukee County. The inner city sample represents persons 16 years of age and older while the samples for the outer city and the suburbs represent individuals 18 years of age and older. The two additional teenage years were included in the inner city sample because of the increasingly significant social role being played by younger members of the black community.
Interviews were conducted in the fall, 1967, by professional staff members of the Wisconsin Survey Research Laboratory. The interview, consisting of over 250 questions, took about an hour to complete. The over-all response rate was 69 per cent with a variation of from 67 per cent for the outer city and .suburbs to 70 per cent for the inner city area.
A detailed description of the methodology of this study may be found in the appendix.
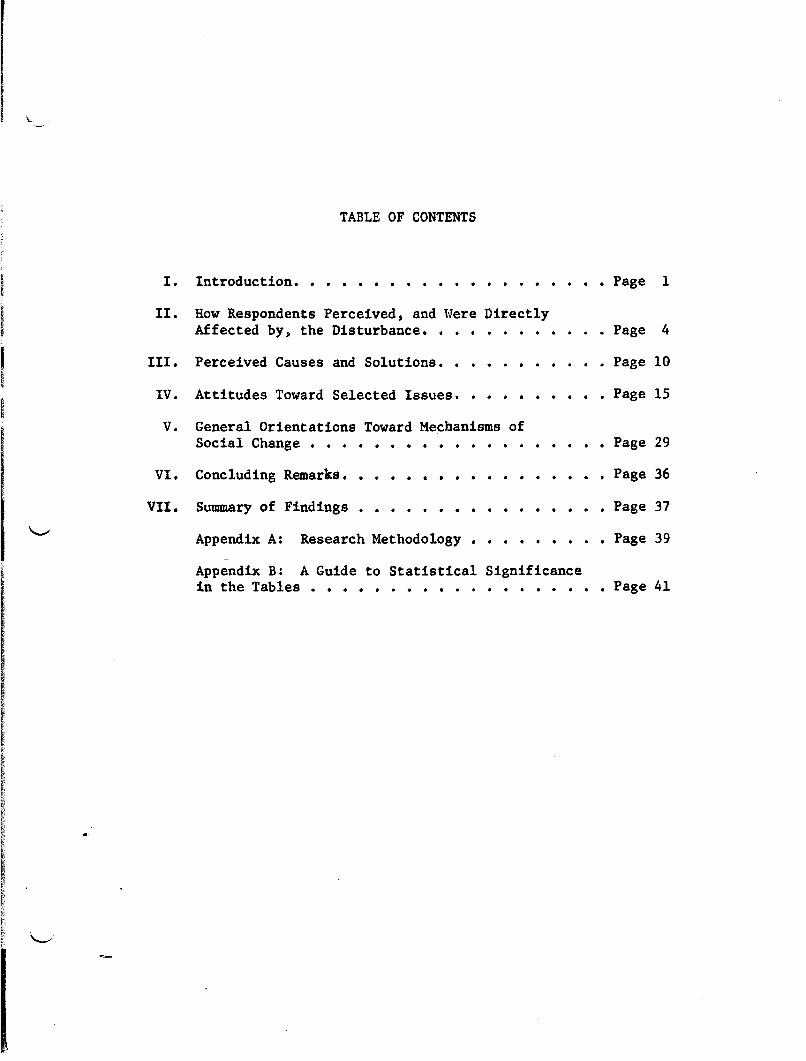
The report is arranged in the following sections: "Introduction," "How respondents perceived, and were directly affected by, the disturbance," "Perceived causes and solutions," "Attitudes toward selected issues," 11General orientations toward mechanisms of social change, 11
"Concluding remarks, 11 and "Summary of findings."
lrhe cordoned~off area was bounded by 1st and 27th streets, Capitol Drive and Juneau Avenue.
' -
\..._....
II
HOW RESPONDENTS PERCEIVED, AND WERE DIRECTLY AFFECTED BY, THE DISTURBANCE
Definition of the Situation
Respondents were asked which of several terms they felt best described the events of Sunday, July 30th (1967) and the several days which followed. Between one-third and nearly one-half of the whites chose the term "riot" whereas less than one-fourth of the black respondents checked this answer (see Table 1). On the other hand, almost one-fourth of the black respondents
Table 1
WHICH OF THE TERMS DO YOU THINK BEST DESCRIBES THE EVENTS OF SUNDAY, JULY 30th AND THE SEVERAL DAYS WHICH FOLLOWED:
Black White* Inner City Inner City Outer City (Per Cent) (Per Cent) (Per Cent)
* "White" includes 18 respondents who were ~fexican, American Indian, or some mixture not further identified.
** The total number of respondents in the study was 387. Three black respondents from the "Outer City" have been omitted. The number for each category shown above is the same for all subsequent tables, and will not be repeated.
\._.,-
. ...
-5-
thought 'civil rights struggle'• best described the events compared to only 10 per cent or fewer of the whites. "Civil disorder" and nracial conflict" were popular terms checked by both blacks and whites, while ''revolt" and "insurrection11 were not. Where there are differences between black and white respondents, blacks were more likely to see civil rights as a central factor while whites tended to see the events as disorderly behavior.
How Respondents Reported Direct Effects
As one would expect, the economic impact was greatest on respondents who live in the cordoned-off area (Table 2). They reported having been more
Table 2
PERCENTAGE GREATLY OR SOMEWHAT AFFECTED BY THE CIVIL DISORDER AND THE RESULTING CURFEW
Black White Inner City Inner City Outer City Suburbs
How were you affected by: (Per Cent) (Per Cent) (Per Cent) (Per Cent)
Unrecoverable financial loss because couldn't work 48 25 22 3
Business property in area damaged 19 11 1
Other real estate owned in area damaged 17 10
Personal injury to self or family 2
Being unable to obtain needed household items 39 15 16 7
Perso~al plans altered or cancelled 34 37 42 37
The stress of the situation caused anxiety, other symptoms of strain 48 53 53 50
Being directly involved as a policeman, fireman, medical person, etc. 2 2 5 2
Business plans altered or cancelled 25 16 29 37
-6-
greatly affected by unrecoverable financial loss because they couldn't work and by damage to business property and/or real estate. However, among those living in the inner city area, almost twice the proportion of blacks as whites reported having been affected. Moreover, more than two and one-half times the percentage of blacks as whites said they were unable to obtain needed household items.
Between 29 and 37 per cent of the whites who live outside the inner city said their business plans were altered or cancelled compared to 25 per cent of the blacks and 16 per cent of the whites living in the area. Once again, within the area, blacks were more affected than whites. Whites and blacks were pretty much alike in having had personal plans altered or cancelled (34 to 42 per cent) and in having felt anxiety due to the stress of the situation (48 to 53 per cent).
Kinds of People Thought to Have Supported/Opposed the Action
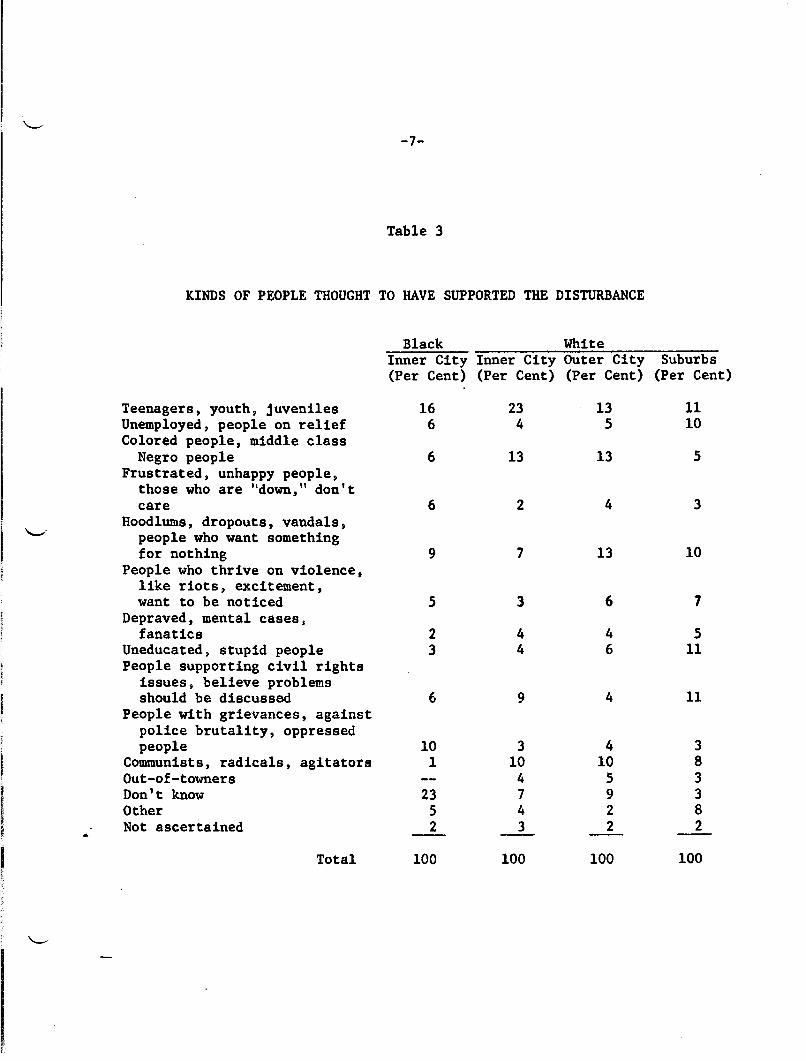
Blacks and whites were quite similar in citing "teenagers, youth, and/or juveniles" (ranging from 11 to 23 per cent) as having supported the action of the disturbance (Table 3). To a smaller degree, the hoodlum element was also perceived as a supporting group (7 to 13 per cent). Important differences appear in connection with two groupings: first, 10 per cent of the black respondents compared to between 3 and 4 per cent of the white respondents felt that supporters were oppressed people with grievances, some of the grievances being against police brutality; second, between 8 and 10 per cent of the whites compared to only 1 per cent of the blacks thought that communists, radicals and/or agitators, and no blacks compared to between 3 and 5 per cent of the whites thought that "out-of-towners" were the kinds of people who supported the action. This is one of several instances in which whites tend to see factors either which lie outside the community itself or, as will be shown later, that are part of large, complex social forces over which they could not be expected to exert much control and influence. Blacks, on the other hand, tend to identify specific issues and problems that are well within the immediate community and which apparently lend themselves to direct action for their resolution.
-7-
Table 3
-8-
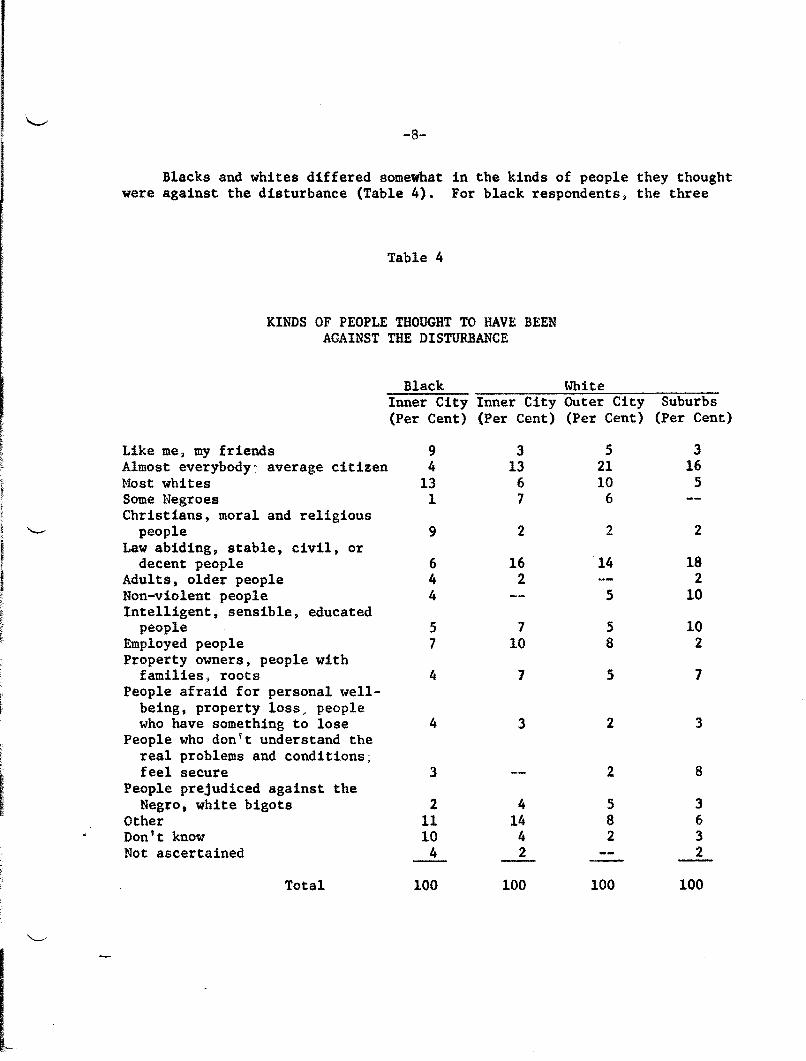
Blacks and whites differed somewhat in the kinds of people they thought were against the disturbance (Table 4). For black respondents, the three
Table 4
KINDS OF PEOPLE THOUGHT TO HAVE BEEN AGAINST THE DISTURBANCE
Black White Inner City Inner City Outer City Suburbs (Per Cent) (Per Cent) (Per Cent) (Per Cent)
Like me, my friends Almost everybody: average citizen Most whites Some Negroes Christians, moral and religious
people Law abiding, stable, civil, or
decent people Adults, older people Non-violent people Intelligent, sensible, educated
people Employed people Property owners, people with
families, roots People afraid for personal well
being, property loss, people who have something to lose
People who don't understand the real problems and conditions$ feel secure
People prejudiced against the Negro, white bigots
Other Don't know Not ascertained
Total
9 4
13 1
9
6 4 4
5 7
4
4
3
2 11 10
4
100
3 13
6 7
2
16 2
7 10
7
3
4 14
4 2
100
5 21 10
6
2
14
5
5 8
5
2
2
5 8 2
100
3 16
5
2
18 2
10
10 2
7
3
8
3 6 3 2
100
-9-
main categories of people against the disturbance were "most whites" (13 per cent), 1'moral (religious) people'' (9 per cent). and people like themselves such as their friends (9 per cent). Among white respondents, between 14 and 18 per cent felt "law abiding citizens~" and between 13 and 21 per cent said "almost everybody" was against the action. Thus, blacks saw racial and moral issues in the disturbance while whites emphasized more the ''violationff of legal and social norms of the total society.
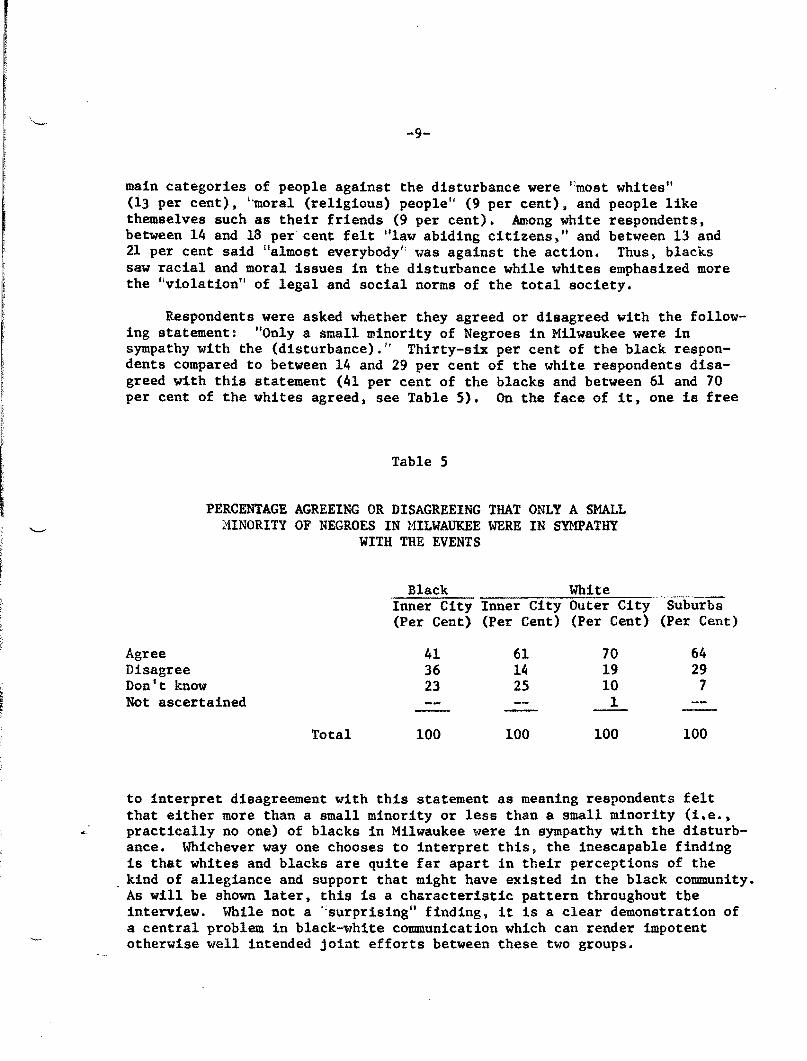
Respondents were asked whether they agreed or disagreed with the following statement: ''Only a small minority of Negroes in Milwaukee were in sympathy with the (disturbance)." Thirty-six per cent of the black respondents compared to between 14 and 29 per cent of the white respondents disagreed with this statement (41 per cent of the blacks and between 61 and 70 per cent of the whites agreed, see Table 5). On the face of it, one is free
Agree Disagree
Table 5
PERCENTAGE AGREEING OR DISAGREEING THAT ONLY A SMALL MINORITY OF NEGROES IN MILWAUKEE WERE IN SYMPATHY
WITH THE EVENTS
Black White Inner City Inner City Outer City (Per Cent) (Per Cent) (Per Cent)
41 61 70 36 lil 19
Don't know 23 25 10 Not ascertained 1
Total 100 100 100
Suburbs (Per Cent)
64 29 7
100
to interpret disagreement with this statement as meaning respondents felt that either more than a small minority or less than a small minority (i.e.~ practically no one) of blacks in Milwaukee were in sympathy with the disturbance. \~ichever way one chooses to interpret this, the inescapable finding is that whites and blacks are quite far apart in their perceptions of the
. kind of allegiance and support that might have existed in the black community. As will be shown later, this is a characteristic pattern throughout tbe interview. While not a •:surprising" finding, it is a clear demonstration of a central problem in black-white communication which can render impotent otherwise well intended joint efforts between these two groups.
\.
III
PERCEIVED CAUSES AND SOLUTIONS
What Caused the Disturbance
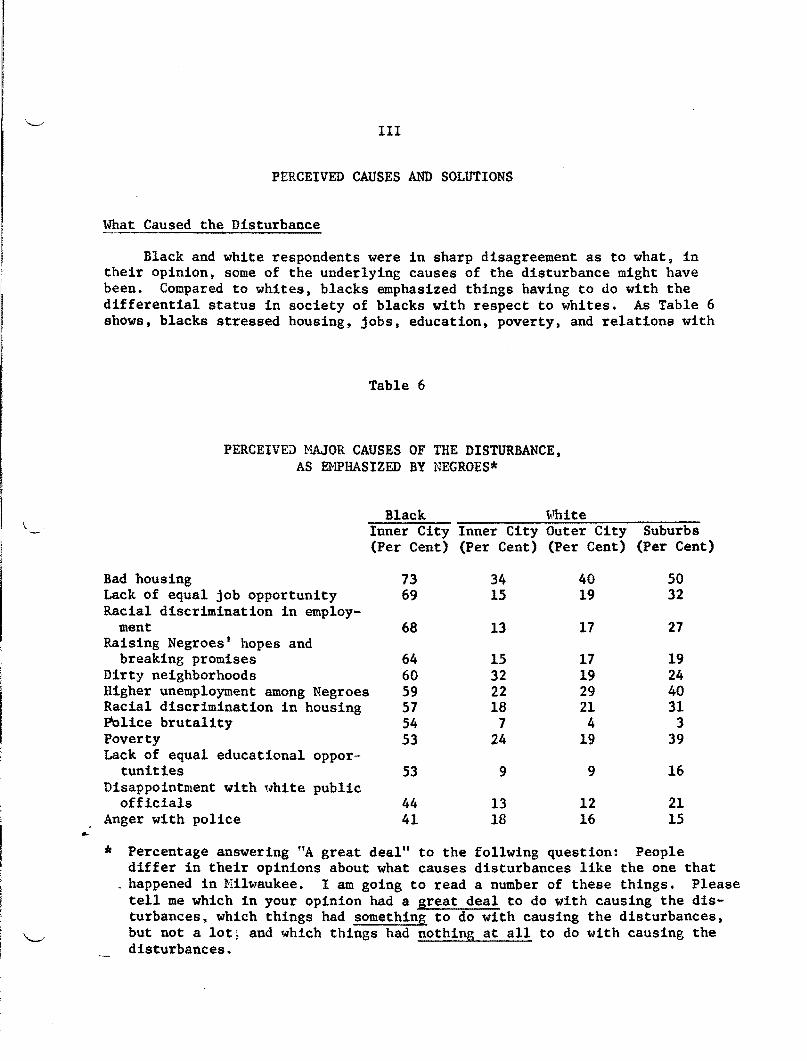
Black and white respondents were in sharp disagreement as to what, in their opinion~ some of the underlying causes of the disturbance might have been. Compared to whites, blacks emphasized things having to do with the differential status in society of blacks with respect to whites. As Table 6 shows, blacks stressed housing, jobs, education, poverty, and relations with
Table 6
PERCEIVED MAJOR CAUSES OF THE DISTURBANCE, AS ~~HASIZED BY NEGROES*
Bad housing Lack of equal job opportunity Racial discrimination in employ-
ment Raising Negroes• hopes and
breaking promises Dirty neighborhoods Higher unemployment among Negroes Racial discrimination in housing POlice brutality Poverty Lack of equal educational oppor-·
tunities Disappointment with 'tvhite public
officials Anger with police
Black ~fuite Inner City Inner City Outer City Suburbs (Per Cent) (Per Cent) (Per Cent) (Per Cent)
73 69
68
64 60 59 57 54 53
53
44 41
34 15
13
15 32 22 18
7 24
9
13 18
40 19
17
17 19 29 21 4
19
9
12 16
50 32
27
19 24 40 31
3 39
16
21 15
* Percentage answering "A great deal" to the follwing question: People differ in their opinions about what causes disturbances like the one that
_ happened in ~!ilwauke~. I am going to read a number of these things. Please tell me which in your opinion had a great deal to do with causing the disturbances, which things had something to do with causing the disturbances,
~ but not a lot; and which things had nothing at all to do with causing the disturbances.
\ ..... ./
....
-11-
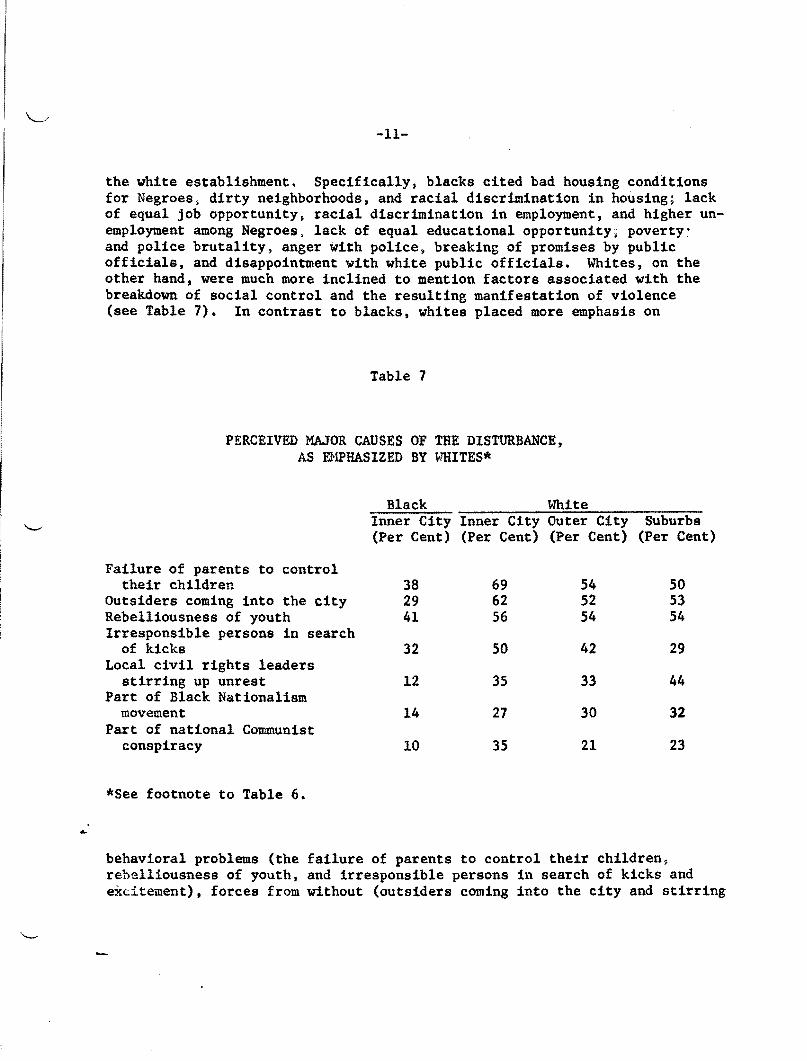
the white establishment. Specifically, blacks cited bad housing conditions for Negroes~ dirty neighborhoods, and racial discrimination in housing; lack of equal job opportunitys racial discrimination in employment, and higher unemployment among Negroes, lack of equal educational opportunity~ poverty: and police brutality~ anger with police» breaking of promises by public officials, and disappointment with white public officials. Whites, on the other hand, were much more inclined to mention factors associated with the breakdown of social control and the resulting manifestation of violence (see Table 7). In contrast to blacks, whites placed more emphasis on
Table 7
PERCEIVED MAJOR CAUSES OF THE DISTURBANCE, AS EHPHASIZED BY 1-.THITES*
Black White Inner City Inner City Outer City Suburbs (Per Cent) (Per Cent) (Per Cent) (Per Cent)
Failure of parents to control their children 38 69 54 50
Outsiders coming into the city 29 62 52 53 Rebelliousness of youth 41 56 54 54 Irresponsible persons in search
of kicks 32 50 42 29 Local civil rights leaders
stirring up unrest 12 35 33 44 Part of Black Nationalism
movement 14 27 30 32 Part of national Communist
conspiracy 10 35 21 23
*See footnote to Table 6 •
behavioral problems (the failure of parents to control their children, reb~lliousness of youth 1 and irresponsible persons in search of kicks and excitement), forces from without (outsiders coming into the city and stirring
-12-
up trouble, part of the Biack ~ationali~ movement, and part of a national Communist conspiracy), and civil rights agitation at the local level (local civil rights leaders stirring up unrest). As noted earlier, the black community continues to define the meaning of the disturbance in terms of the tangible, real-·life problems they face on a day-to-day basis. Whites prefer to see evidence of deviant behavior in violation of white middle class norms and values as the basic issue underlying the disturbance.
Attitudes Toward Proposed Preventive Heasures
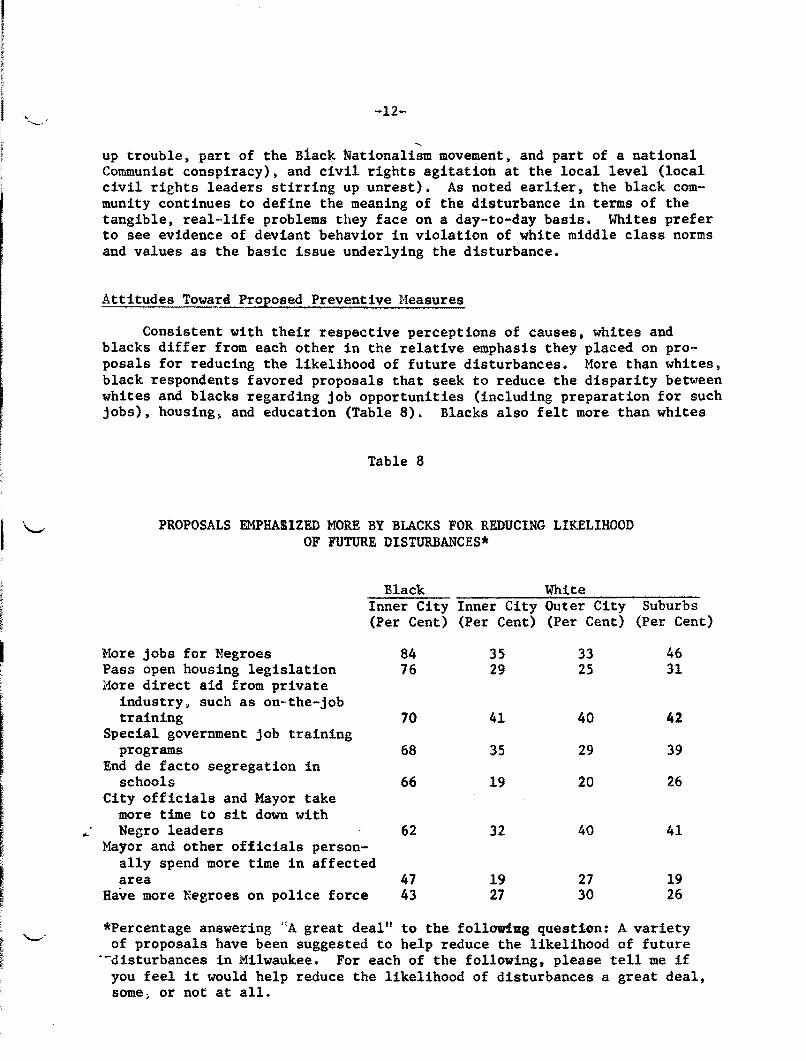
Consistent with their respective perceptions of causes, whites and blacks differ from each other in the relative emphasis they placed on proposals for reducing the likelihood of future disturbances. More than whites, black respondents favored proposals that seek to reduce the disparity between whites and blacks regarding job opportunities (including preparation for such jobs), housing, and education (Table 8). Blacks also felt more than whites
Table 8
PROPOSALS EMPHASIZED MORE BY BLACKS FOR REDUCING LIKELIHOOD OF FUTURE DISTURBANCES*
Black White Inner City Inner City Outer City Suburbs (Per Cent) (Per Cent) (Per Cent) (Per Cent)
More jobs for Negroes Pass open housing legislation Hare direct aid from private
industry. such as on-the-job training
Special government job training programs
End de facto segregation in schools
City officials and Mayor take more time to sit down with Negro leaders
Mayor and other officials personally spend more time in affected area
Have more Negroes on police force
84 76
70
68
66
62
47 43
35 29
41
35
19
32
19 27
33 25
40
29
20
40
27 30
46 31
42
39
26
41
19 26
*Percentage answering ':A great deal" to the follOW"!•g question: A variety of proposals have been suggested to help reduce the likelihood of future
·-disturbances in Milwaukee. For each of the following, please tell me if you feel it would help reduce the likelihood of disturbances a great deal, some; or not at all.
-13-
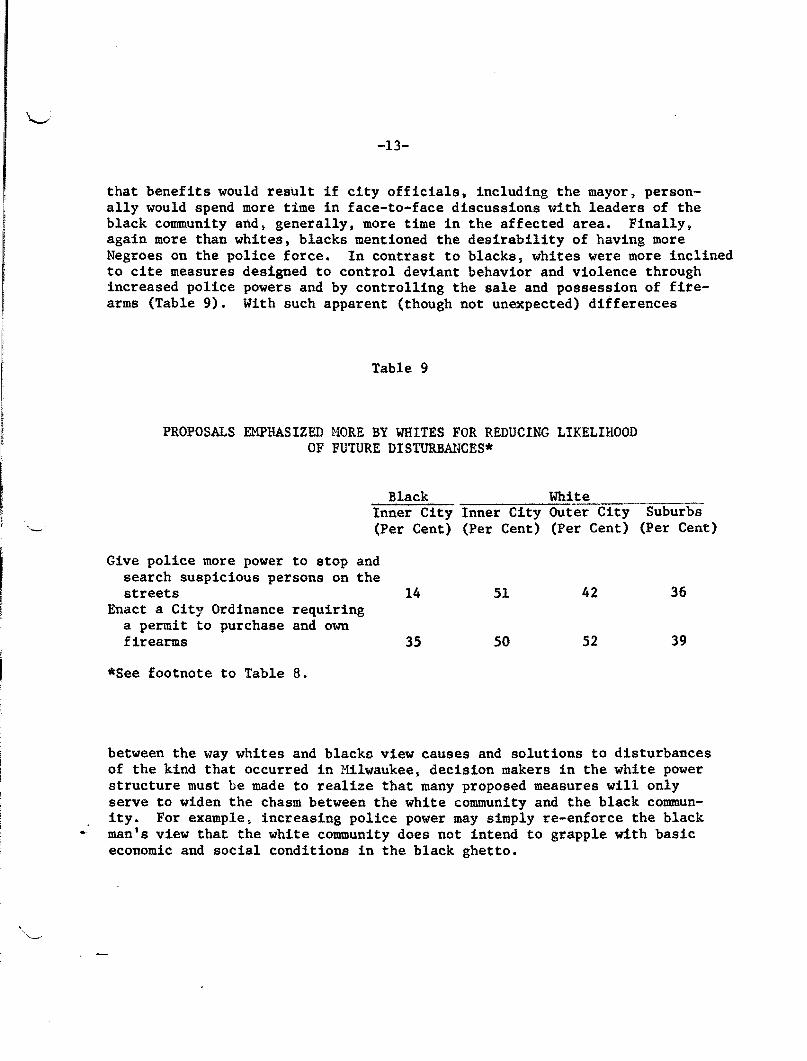
that benefits would result if city officials, including the mayor, personally would spend more time in face-to-face discussions with leaders of the black community and, generally, more time in the affected area. Finally, again more than whites, blacks mentioned the desirability of having more Negroes on the police force. In contrast to blacks, whites were more inclined to cite measures designed to control deviant behavior and violence through increased police powers and by controlling the sale and possession of firearms (Table 9). With such apparent (though not unexpected) differences
Table 9
PROPOSALS EMPHASIZED MORE BY WHITES FOR REDUCING LIKELIHOOD OF FUTURE DISTURBANCES*
Black White Inner City Inner City Outer City Suburbs (Per Cent) (Per Cent) (Per Cent) (Per Cent)
Give police more power to stop and search suspicious persons on the streets 14 51 42 36
Enact a City Ordinance requiring a permit to purchase and own firearms 35 50 52 39
*See footnote to Table 8.
between the way whites and blacka view causes and solutions to disturbances of the kind that occurred in Milwaukee, decision makers in the white power structure must be made to realize that many proposed measures will only serve to widen the chasm between the white community and the black community. For example, increasing police power may simply re-enforce the black man's view that the white community does not intend to grapple with basic economic and social conditions in the black ghetto.
-14-
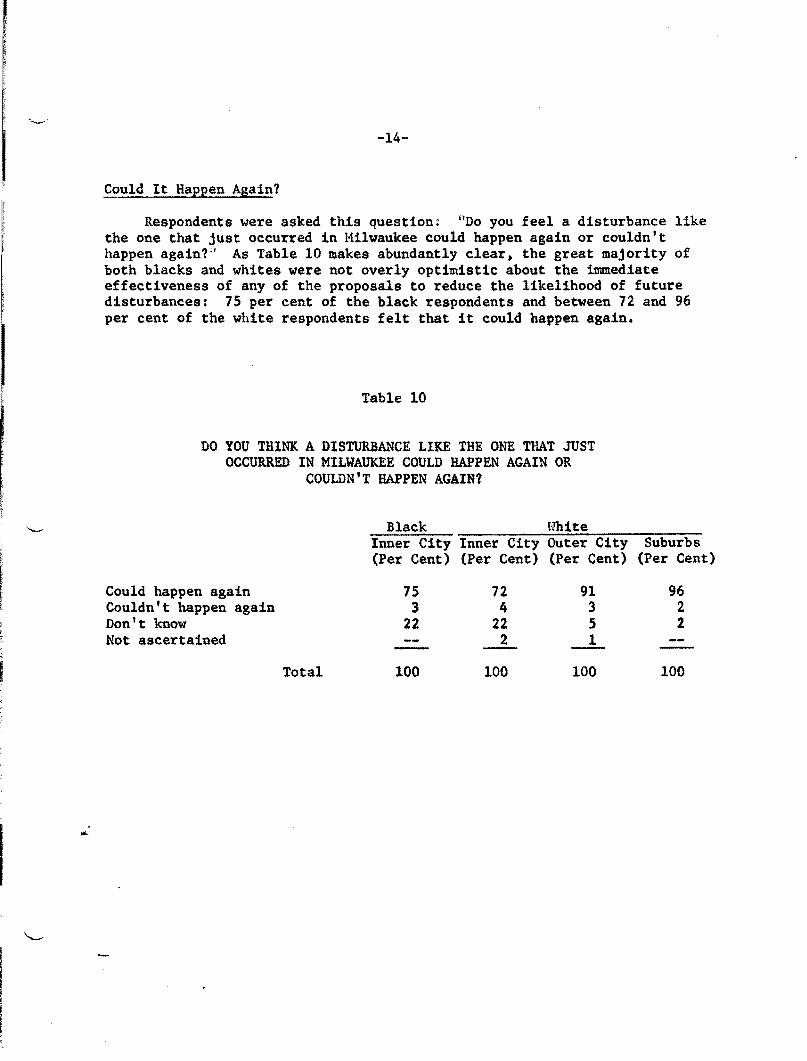
Could It Happen Again?
Respondents were asked this question: "Do you feel a disturbance like the one that just occurred in Milwaukee could happen again or couldn't happen again?" As Table 10 makes abundantly clear, the great majority of both blacks and whites were not overly optimistic about the immediate effectiveness of any of the proposals to reduce the likelihood of future disturbances: 75 per cent of the black respondents and between 72 and 96 per cent of the white respondents felt that it could happen again.
Table 10
DO YOU THINK A DISTURBANCE LIKE THE ONE TllAT JUST OCCURRED IN MILWAUKEE COULD HAPPEN AGAIN OR
COULDN'T HAPPEN AGAIN?
Black lVhite Inner City Inner City Outer City (Per Cent) (Per Cent) (Per Cent)
Could happen again 75 72 91 Couldn't happen again 3 4 3 Don't know 22 22 5 Not ascertained 2 1
Total 100 100 100
Suburbs (Per Cent)
96 2 2
100
IV
ATTITUDES TOWARD SELECTED ISSUES
The possible relationship to the disturbance of a number of specific issues has already been rai3ed :tn the p"::'evious sP..ction. In particull!lr, it was noted that blacks plac~d relatively g-ce2ter emphasis than lv-hites on the importance of such matters as equal job opportunities, housing, equal educational opportunities; police behavior, and general problems relat~d to civil rights. It is appropriate, therefore, to ask what factors might account for this difference of opinion between whites and blacks as to the relative importance of these social and economic conditions in the outbreak of lhe disturbance. In this section, an examination of attitudes toward a selection of these issues will be carried out in an effort to obtain a partial answer to this question.
Perceptions of Jobs and Incomes of Blacks in Milwaukee
Respondents were asked the following three questions:
CoQpared to Negroes in other northern cities, do you feel that Negroes in Milwaukee have better jobs, about the same kinds of jobs, or worse jobs?
Compared to Negroes in other northern cities, do you think Negroes in Milwaukee have more income, about the same income, or less income?
In Hilwaukee, if a Negro were employed at the same work as a white person, do you feel he would likely get less pay, about the same pay, or more pay?
The results are shown in Tables 11, 12 and 13. In each table, it will be noted that whites rarely answered with the negative answer (worse jobs, less income, or less pay) compared to from 17 to 29 per cent, respectively, of the black respondents who chose the negative comparison. The important finding in these tables is not the degree to which whites versus blacks may more accurately reflect the-real situations the important finding is that blacks perceived a greater relative deprivation and, therefore, a greater
' distance to go to equalize the disparity. Whites, on the other hand, were much less convinced that a real need exists here, hence were less likely to see any relation between the disturbance and any inequities that members of the black community may be experiencing in employment.
-16-
Table 11
COMPARISON OF PERCEPTION OF QUALITY OF JOBS FOR NEGROES IN 1-fiLWAUKEE AND NEGROES IN OTHER NORTHERN CITIES
Compared to Negroes in other Black l-lhite northern cities, Negroes in Inner City Inner City Outer Cit§·- Suburbs Milwaukee have: (Per Cent) (Per Cent) (Per Cent) (Per Cent')
Better jobs 7 32 23 19 Same kinds of jobs 52 47 66 68 Worse jobs 17 1 2 Don't know 24 21 9 11 Not ascertained _L
t Total 100 100 100 100
Table 12
COl~ARISON OF PERCEPTION OF INCOME OF NEGROES IN 11ILWAUKEE AND NEGROES IN OTHER NORTHERN CITIES
Compared to Negroes in other Black White northern cities) Negroes in Inner City Inner City Outer City Suburbs l1ilwaukee have: (Per Cent) (Per Cent) (Per Cent) (Per Cent)
Hore income 11 34 32 41 ~ The same income 41 40 54 36
Less income 18 2 2 5 Don't know 30 24 10 18 Not ascertained 2
Total 100 100 100 100
"
-17-
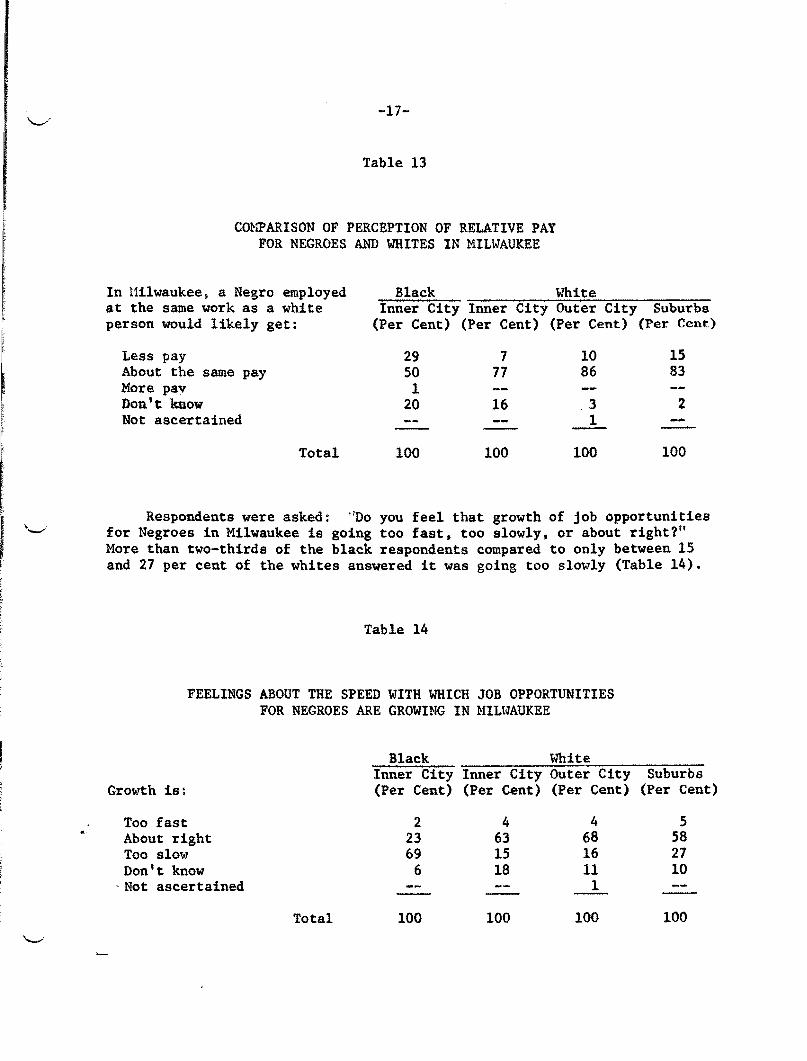
Table 13
CO~WARISON OF PERCEPTION OF RELATIVE PAY FOR NEGROES AND WHITES IN MILWAUKEE
In l1ilwaukee, a Negro employed Black White at the same work as a white Inner City Inner City Outer City Suburbs person would likely get: (Per Cent) (Per Cent) (Per Cent) (Per Cent)
Less pay 29 7 10 15 About the same pay 50 77 86 83 More pav 1 Don't know 20 16 3 2 Not ascertained 1
Total 100 100 100 100
Respondents were asked: 11Do you feel that growth of job opportunities for Negroes in Milwaukee is going too fast, too slowly, or about right?" More than two-thirds of the black respondents compared to only between 15 and 27 per cent of the whites answered it was going too slowly (Table 14).
Table 14
FEELINGS ABOUT THE SPEED WITH WHICH JOB OPPORTUNITIES FOR NEGROES ARE GROWING IN MILWAUKEE
Black White Inner City Inner City Outer City
Growth is: (Per Cent) (Per Cent) (Per Cent)
Too fast 2 4 4 About right 23 63 68 Too slow 69 15 16 Don't know 6 18 11
·Not ascertained 1
Total 100 100 100
Suburbs (Per Cent)
5 58 27 10
100
....
...........,.
-18-
This result underscores another basic difference between whites and blacks: the rate at which change is taking place, that is, the rate at which the gap in inequality is closing, is moving at too slow a pace for blacks. Irrespective of tlw legitimacy of blacks' desire for more rapid improvement, it can easily beccme a basis for taking action against the system which is perceived as moving too slowly.
In a related question, respondents were asked: ''If you had the chance to work with all Negroes, all whites, or a mixed group, which would you prefer?" Between two--thirds and three-quarters of the whites answered either "mixed" or "it makes no difference," and just over four out of five blacks answered this way. While the expected difference between racial preferences is revealed, it is worth noting that it is by no means a crucial difference. Failure to provide equal job opportunity for blacks cannot be justified on the basis that strong preferences exist among whites for avoiding racially mixed work groups.
Open Housing
Open housing continues to be an issue about which blacks and whites differ sharply, According to the results shown in Table 15, nine out of ten
Table 15
ATTITUDES TOWARD AN OPEN HOUSING LAW
Black \Thite Inner City Inner City Outer City Suburbs
blacks compared to roughly half of the whites favor an open housing law for the City of Milwaukee. Nearly nine out of ten blacks compared to roughly half the whites favor such a law for the County of Milwaukee. If these results reflect the possible stance of the electorate, it is apparent that such a question in a city-wide referendum would not be assured of passage.
This question was asked~ 11Do you think efforts to provide opportunities for Negroes to live where they want to here in ~~lwaukee are going too fast, too slowly, or about right?" Once more whites and blacks are markedly apart: four out of five blacks compared to approximately one out of five whites said too slow (Table 16). Again, the differential points up the basis for feelings of greater deprivation and frustration among blacks, a condition that may contribute to the outbreak of demonstrations and protest.
Rate is:
Too fast About right Too slow Don't know
Table 16
ATTITUDE TOHARD RATE WITH WHICH EFFORTS TO SECURE OPEN HOUSING ARE GOING
Black White Inner City Inner City Outer City (Per Cent} (Per Cent} (Per Cent)
19 9 12 53 60 78 16 20 10 12 10
Not ascertained
Total 100 100 100
Suburbs (Per Cent}
11 54 27 8
100
As an indicator of possible racial preferences in the matter of who one's neighbors are, respondents were asked~ "Do you think you would ever find it a little distasteful to live in the same neighborhood as (members of the other race}?" Blacks and whites in the inner city differed little in their acceptance of the other race (85 per cent and 78 per cent, respectively, said it made no difference), while whites in the outer city and suburbs were somewhat less accepting of the other race (57 per cent and 60 per cent, respectively, said it made no difference). Since open housing
-20~
legislation is consistently favored by a lower proportion of whites than those who say it makes no difference about the race of their neighbors, the existence of racial preferences among whites is not sufficient to account for the only moderate support of open housing legislation.
Equal Opportunity for Education
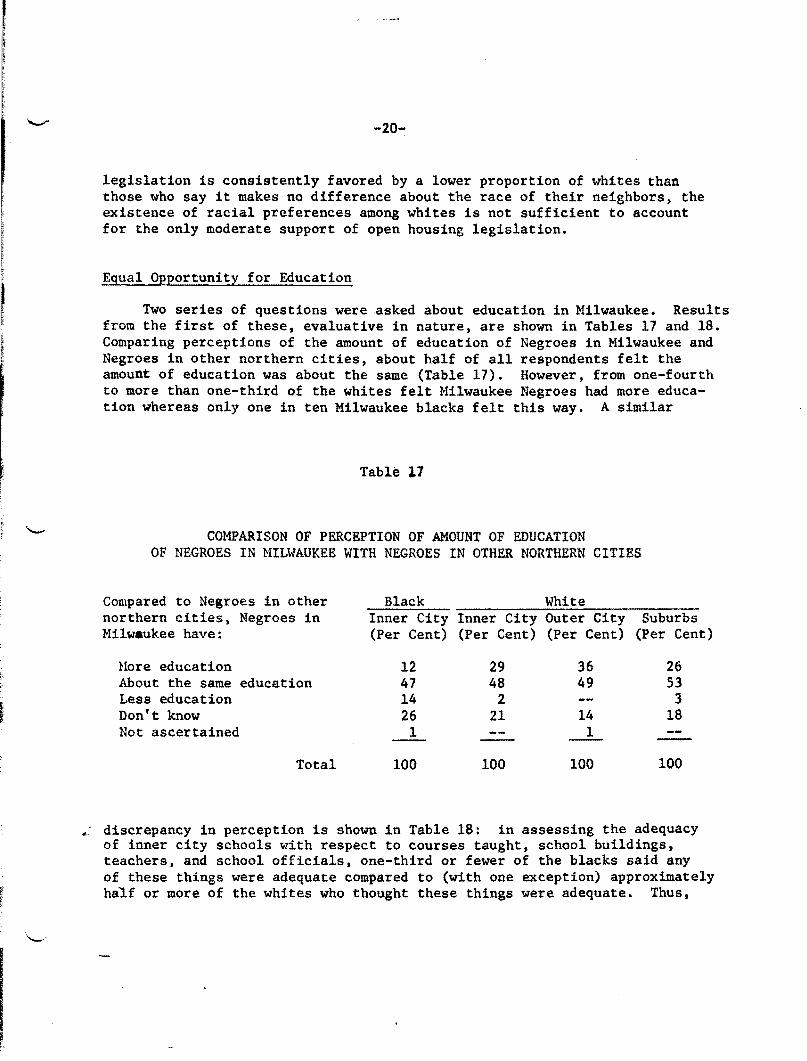
Two series of questions were asked about education in Milwaukee. Results from the first of these, evaluative in nature, are shown in Tables 17 and 18. Comparing perceptions of the amount of education of Negroes in Milwaukee and Negroes in other northern cities, about half of all respondents felt the amount of education was about the same (Table 17). However, from one-fourth to more than one-third of the whites felt Milwaukee Negroes had more education whereas only one in ten Milwaukee blacks felt this way. A similar
Table 17
COMPARISON OF PERCEPTION OF AMOUNT OF EDUCATION OF NEGROES IN MILHAUKEE WITH NEGROES IN OTHER NORTHERN CITIES
Compared to Negroes in other Black White northern cities, Negroes in Inner City Inner City Outer City Suburbs Milwaukee have: (Per Cent) (Per Cent) (Per Cent) (Per Cent)
Hore education 12 29 36 26 About the same education 47 48 49 53 Less education 14 2 3 Don't know 26 21 14 18 Not ascertained 1 1
Total 100 100 100 100
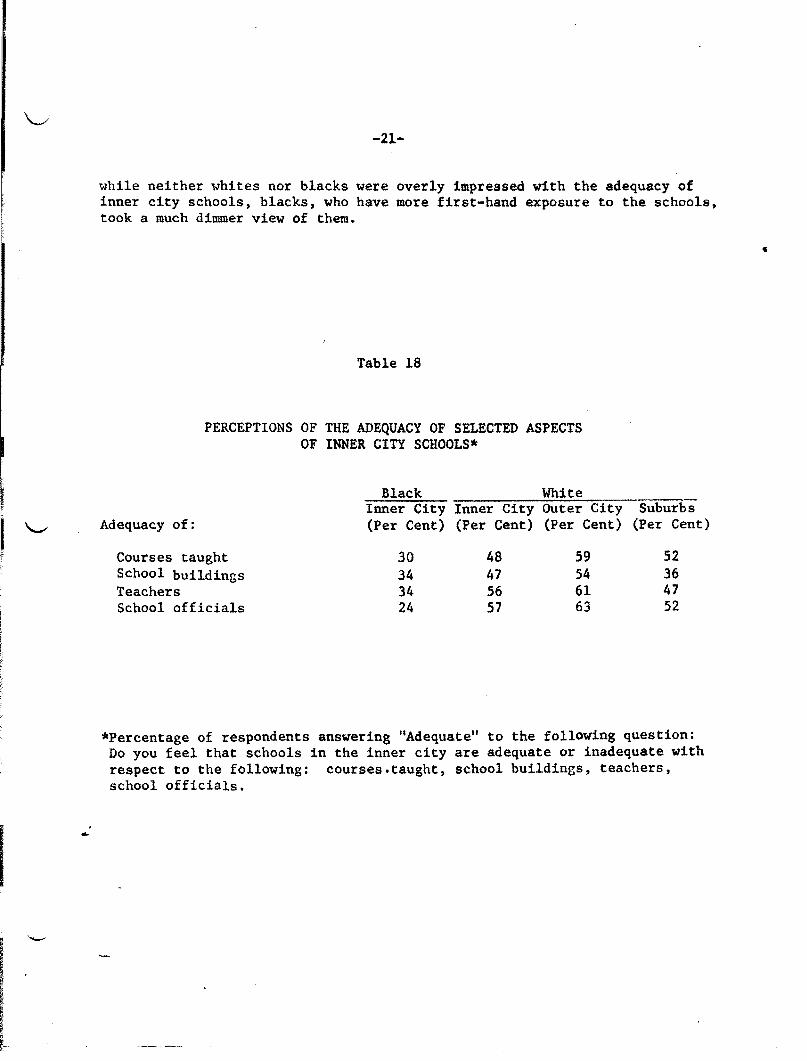
• discrepancy in perception is shown in Table 18: in assessing the adequacy of inner city schools with respect to courses taught, school buildings, teachers, and school officials, one-third or fewer of the blacks said any of these things were adequate compared to (with one exception) approximately half or more of the whites who thought these things were adequate. Thus,
-
-21-
while neither whites nor blacks were overly impressed with the adequacy of inner city schools, blacks, who have more first-hand exposure to the schools, took a much dimmer view of them.
Table 18
PERCEPTIONS OF THE ADEQUACY OF SELECTED ASPECTS OF INNER CITY SCHOOLS*
Black White Inner City Inner City Outer City
Adequacy of: (Per Cent) (Per Cent) (Per Cent)
Courses taught 30 48 59 School buildings 34 47 54 Teachers 34 56 61 School officials 24 51 63
Suburbs (Per Cent)
52 36 47 52
*Percentage of respondents answering 11Adequate" to the following question: Do you feel that schools in the inner city are adequate or inadequate with respect to the following: coursea.taught, school buildings, teachers, school officials.
'-
-22-
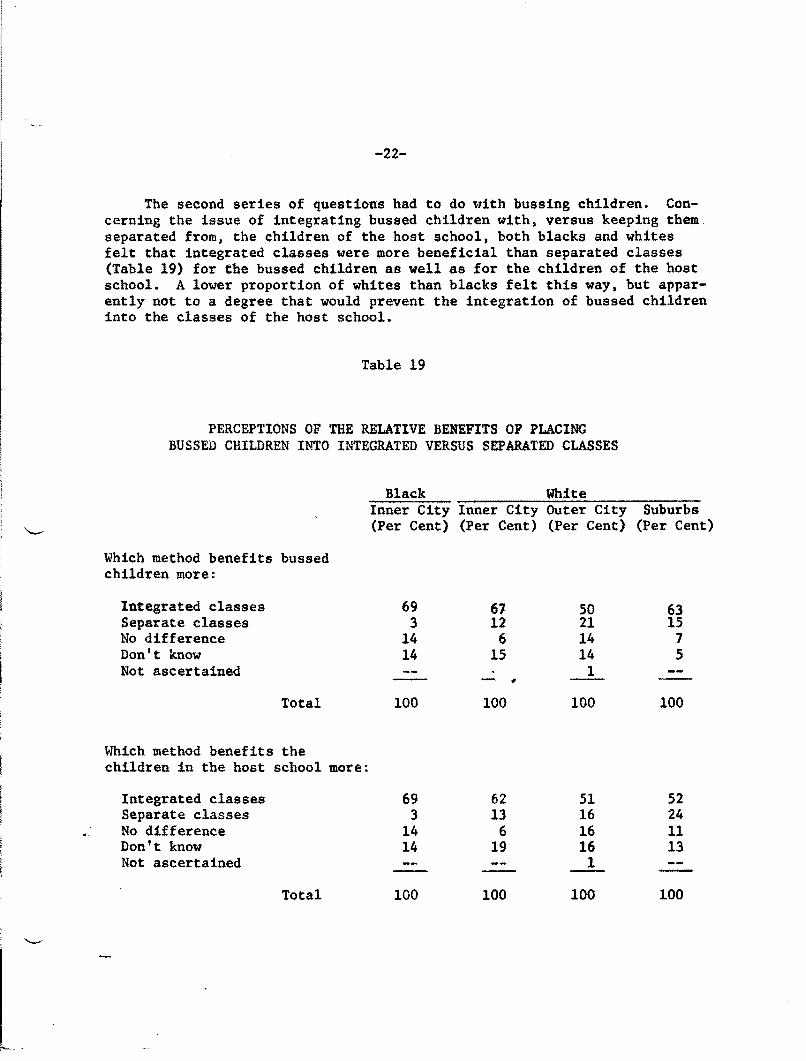
The second series of questions had to do "C-7ith bussing children. Concerning the issue of integrating bussed children with) versus keeping them separated from, the children of the host school, both blacks and whites felt that integrated classes were more beneficial than separated classes (Table 19) for the bussed children as well as for the children of the host school. A lower proportion of whites than blacks felt this way, but apparently not to a degree that would prevent the integration of bussed children into the classes of the host school.
Table 19
PERCEPTIONS OF THE RELATIVE BENEFITS OF PLACING BUSSED CHILDREN INTO INTEGRATED VERSUS SEPARATED CLASSES
Black White Inner City Inner City Outer City (Per Cent) (Per Cent) (Per Cent)
Which method benefits bussed children more:
Integrated classes 69 67 50 Separate classes 3 12 21 No difference 14 6 14 Don't know 14 15 14 Not ascertained 1 - ,
Total 100 100 100
lihich method benefits the children in the host school more:
Integrated classes 69 62 51 Separate classes 3 13 16 No difference 14 6 16 Don't know 14 19 16 Not ascertained 1
Total 100 100 100
Suburbs (Per Cent)
63 15
7 5
100
52 24 11 13
100
----
-23-
On the other hand, whites generally opposed while blacks generally favored the bussing of school children to obtain more racially balanced schools (Table 20). This would seem to be another of the many indicators that whites are reluctant to support moves that specifically aim to equalize some of the overt disparities between the races.
Table 20
ATTITUDE TOWARD BUSSING MILWAUKEE SCHOOL CHILDREN TO OBTAIN MORE RACIALLY BALANCED SCHOOLS
Black White Inner City Inner City Outer City (Per Cent) (Per Cent) (Per Cent)
One of the most sensitive, indeed, explosive controversies in race relations these days is the matter of police behavior with blacks. The present study cannot directly establish whether or not police brutality actually takes place. However, it can measure people's perceptions, and these perceptions, irrespective of their real-world validity, frequently are the basis for action and the formation of attitudes. And, of course, though capable of being grossly distorted, people's perceptions are almost never totally void of some truth about the objects and relationships which are their focus. As an approach to this issue, persons interviewed were asked; "Please tell me l-7hether you think that the police use any of the following kinds of treatment against Negroes in Milwaukee frequently, seldom, or never." There followed six kinds of treatment which are listed in Table 21. The most obvious and striking finding in this table is the almost complete disagreement between blacks and whites as to the frequency with which each form of treatment is perceived to occur. Over half of the black respondents said that insults, lack of respect, and unnecessary force in making arrests are kinds of treatment frequently used against Negroes by police in Milwaukee: fewer than one in five whites agreed. Nearly half the blacks said frisking and s~arching unnecessarily is a kind of treatment frequently used by Mil;.;r.•ukee police against Negroes; again, fewer than one in five whites agreed.
Table 21
PERCEIVED FREQUENCY OF SELECTED ASPECTS OF POLICE BEHAVIOR*
Black White Inner City Inner City Outer City Suburbs
necessarily 48 19 12 19 Stopping and searching cars
unnecessarily 41 13 7 5 Unnecessary force in making
arrests 54 16 5 8 Beating people up 38 6 3 7 Searching homes unnecessarily 29 2 3
*Percentage of respondents answering "Frequently'; to the following question: Please tell me whether you think that the police use any of the following kinds of treatment against Negroes in Milwaukee frequently, seldom or never.
\_/
. ....
-25-
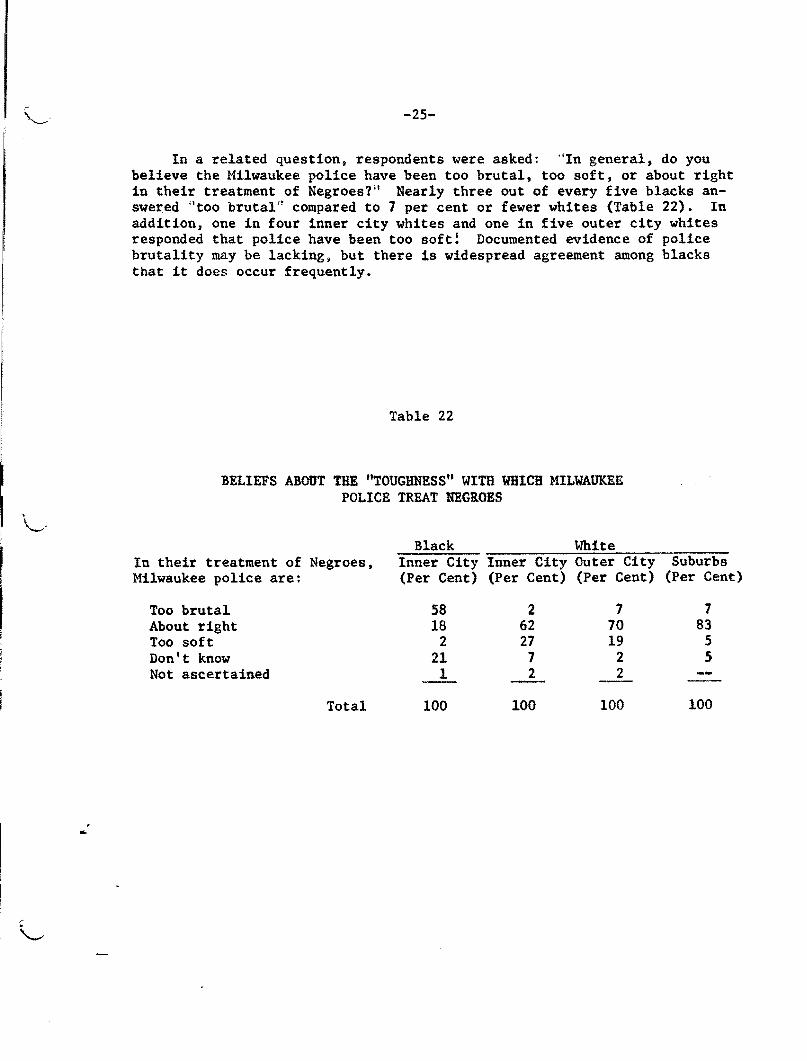
In a related question, respondents were asked: "In general, do you believe the Milwaukee police have been too brutal, too soft, or about right in their treatment of Negroes?;' Nearly three out of every five blacks answet:ed "too brutaln compared to 7 per cent or fewer whites (Table 22). In addition, one in four inner city whites and one in five outer city whites responded that police have been too soft! Documented evidence of police brutality may be lacking, but there is widespread agreement among blacks that it does occur frequently.
Table 22
BELIEFS ABOUT !BE "TOUGHNESS" WITH WHICH MILWAUKEE POLICE TREAT NEGROES
Black White In their treatment of Negroes, Inner City Inner City Outer City Suburbs Milwaukee police are: (Per Cent) (Per Cent) (Per Cent) (Per Cent)
Too brutal 58 2 1 7 About right 18 62 70 83 Too soft 2 27 19 5 Don't know 21 7 2 5 Not ascertained 1 2 2
Total 100 100 100 100
-26-
Some General Attitudes Toward Civil Rights and Integration
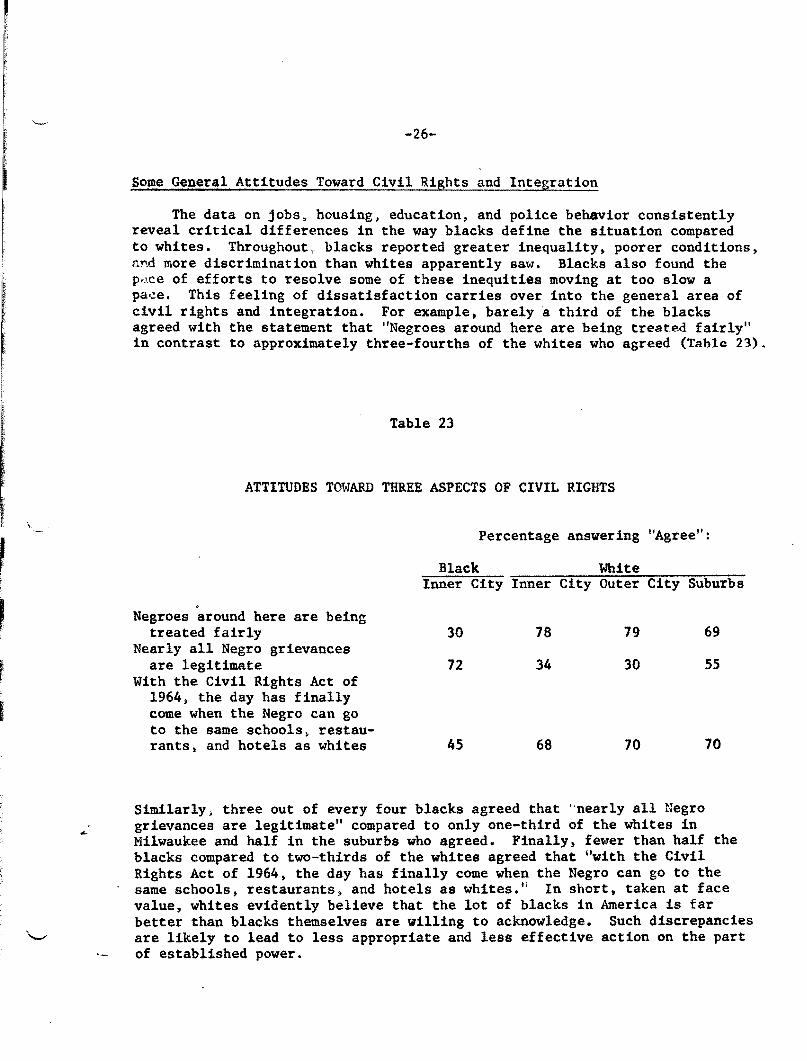
The data on jobs, housing, education, and police behavior consistently reveal critical differences in the way blacks define the situation compared to whites. Throughout,. blacks reported greater inequality t poorer conditions, nnd more discrimination than whites apparently saw. Blacks also found the piice of efforts to resolve some of these inequities moving at too slow a pa•!e. This feeling of dissatisfaction carries over into the general area of civil rights and integration. For example, barely a third of the blacks agreed with the statement that ''Negroes around here are being treated fairly" in contrast to approximately three-fourths of the whites who agreed (Table 23).
Table 23
ATTITUDES TOWARD THREE ASPECTS OF CIVIL RIGHTS
. Negroes around here are being
treated fairly Nearly all Negro grievances
are legitimate With the Civil Rights Act of
1964, the day bas finally come when the Negro can go to the same schools~ restaurants, and hotels as whites
Percentage answering
Black White Inner City Inner City Outer
30 78 79
72 34 30
45 68 70
uAgree'':
City Suburbs
69
55
70
Similarly, three out of every four blacks agreed that '·nearly all Negro grievances are legitimate" compared to only one-third of the whites in Milwaukee and half in the suburbs who agreed. Finally, fewer than half the blacks compared to two-thirds of the whites agreed that "with the Civil Rights Act of 1964, the day has finally come when the Negro can go to the same schools, restaurants. and hotels as whites.'' In short, taken at face value, whites evidently believe that the lot of blacks in America is far better than blacks themselves are willing to acknowledge. Such discrepancies are likely to lead to less appropriate and less effective action on the part of established power.
.....
-27-
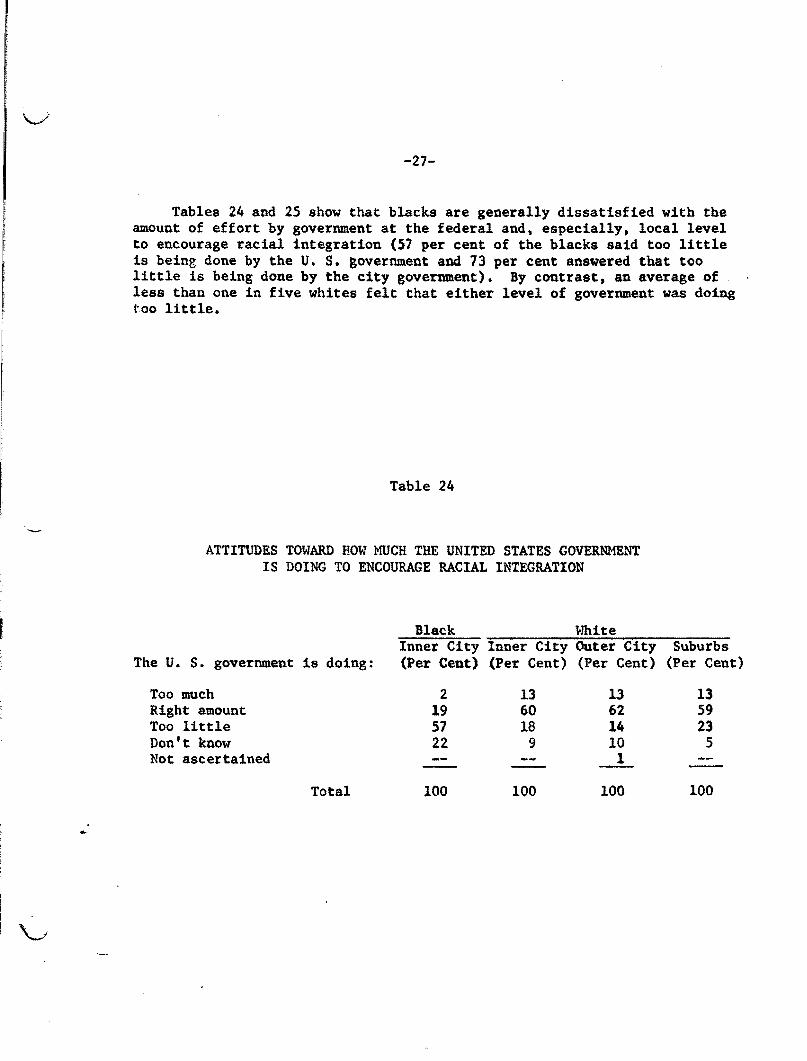
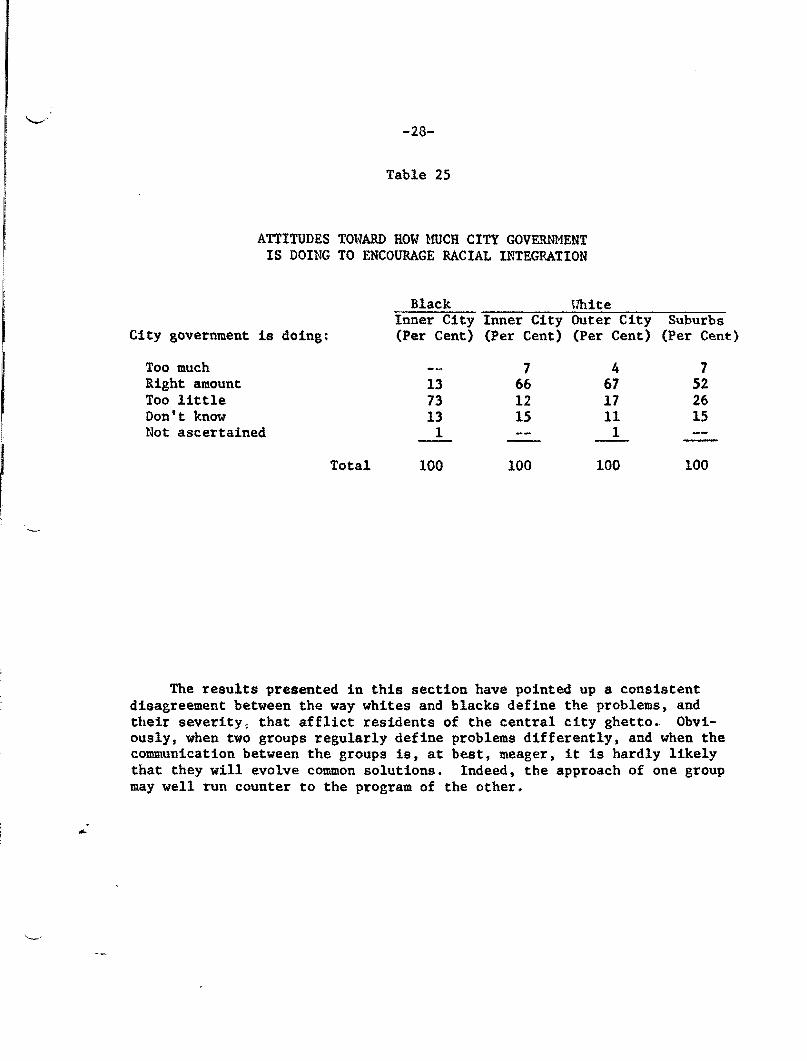
Tables 24 and 25 show that blacks are generally dissatisfied with the amount of effort by government at the federal and, especially, local level to encourage racial integration (57 per cent of the blacks said too little is being done by the U. S. government and 73 per cent answered that too little is being done by the city government). By contrast, an average of less than one in five whites felt that either level of government was doing too little.
Table 24
ATTITUDES TOWARD HOW MUCH THE UNITED STATES GOVERNMENT IS DOING TO ENCOURAGE RACIAL INTEGRATION
Black White Inner City Inner City Outer City
The u. s. government is doing: (Per Cent) (Per Cent) (Per Cent)
Too much 2 13 13 Right amount 19 60 62 Too little 57 18 14 Don't know 22 9 10 Not ascertained 1
Total 100 100 100
Suburbs (Per Cent)
13 59 23 5
100
City government
Too much Right amount Too little Don't know
-28-
Table 25
ATTITUDES TOWARD HOW UUCH CITY GOVERtiMENT IS DOING TO ENCOURAGE RACIAL INTEGP.ATION
Black t1hite Inner City Inner City Outer City
is doing; (Per Cent) (Per Cent) (Per Cent)
7 4 13 66 67 73 12 11 13 15 11
Not ascertained 1 1
Total 100 100 100
Suburbs (Per Cent:)
7 52 26 15
100
The results presented in this section have pointed up a consistent disagreement between the way whites and blacks define the problems, and their severity, that afflict residents of the central city ghetto. Obviously, when two groups regularly define problems differently, and when the communication between the groups is, at best, meager, it is hardly likely that they will evolve common solutions. Indeed, the approach of one group may well run counter to the program of the other.
!
I
v
GENERAL ORIENTATIONS TOWARD HECHANISMS OF SOCIAL CHANGE
The established mechanisms for change in our democratic society are many and varied. The ultimate act of change usually involves one or another branch and/or level of government: legislatures pass laws, executive branches develop policy and issue orders and proclamations; the courts enforce, interpret, and, occasionally, reject legislation and executive orders. The path to the act of change may originate from within the govermment or some sector of it, or it may have its origin outside. In the latter case, the origin may be from among individuals banded together for the sole purpose of effecting change, or change may be an incidental (albeit important) goal for an on-going enterprise. In any case, a selection of established or traditional procedures is available through which the group interested in change can channel its concerns and bring its power to bear. What are the normally available mechanisms for a group with a long list of dissatisfactions concerning its place in society? More specifically, through what means can black citizens in America attempt to reduce the deprivations and disparities that they feel in relation to what they justly feel they are entitled? One's first reaction is, well of course, they should turn to normal political processes: voting, dealing with representatives of government, and generally operating within the legally and ethically defined system.
Attitudes Toward Political Processes
Students of political behavior have developed numerous devices for measuring the attitudes of people toward political processes. In this study, interest lies in the degree to which respondents feel that they can have some impact on the system and that the system, in turn, has some basic integrity and utility so far as his own sphere of life is concerned, One assumption is that people who believe in the system's basic honesty and integrity and who feel that it is at least somewhat responsive to their attempts to influence (whether through the ballot box or by direct contact) will, in turn, resort to established avenues for seeking changes and improvements. On the other hand, persons who have little faith and confidence in the system will seek other means to effect change.
Four scales were employed in the present study. Each scale measures attitudes toward a distinct but closely related facet of the political process. The four scales measure 'political efficacy," "mistrust of public officials," ''political cynicism, i' and ''political alienation." Compared to whites, blacks consistently scored lowest on political efficacy and highest on mistrust of public officials, political cynicism, and political alienation
-
-30-
(Table 26). Without going into the technical and theoretical significance of this finding, the implications are clear cut: on the whole, blacks do not feel they can achieve anything on their own behalf through the usual political mechanisms. Thus, more than whites, they are fatalistic about the relatively little say they have in what the government does, ( 11 I don't think public officials care much what people like me think"), they tend not to trust public officials (' 1If people knew what was really going on in high places, it would blow the lid off things 1
'), they are cynical about politics (':People are frequently manipulated by politicians 11
), and they feel alienated from the system ("It doesn 1 t matter which party \o7ins the election, the interests of the little man don't count"). Whatever the reasons may be for this outcome, the fact that it is so means that Milwaukee blacks as a group are likely to rely less on their political and voting power and more on some other form of power to achieve the changes for which they feel so much need.
Table 26
ATTITUDES TOWARD THE POLITICAL PROCESS
Black White Attitude Scales Inner City Inner City Outer City Suburbs
Campbell 11Political Efficacy Scale'' Number of Respondents
Horton and Thompson 'Nistrust of Public Officials Scale" :Number of Respondents
Agger "Political Cynicism Scale" Number of Respondents
Horton and Thompson 11Political Alienation Scale" Number of Respondents
Total Number
0.83 (83)
3.33 (54)
4.66 (47)
1.43 (101)
(125)
1.75 (51)
2.18 (44)
3.18 (33)
1.36 (56)
(68)
2.04 (115)
1.30 (96)
2.34 (77)
1.07 (121)
(129)
· Note~ Higher scale score always means more of the named dimension.
2.52 (60)
1.27 (55)
2.41 (49)
1.16 (61)
(62)
. ......__.
>L
-31-
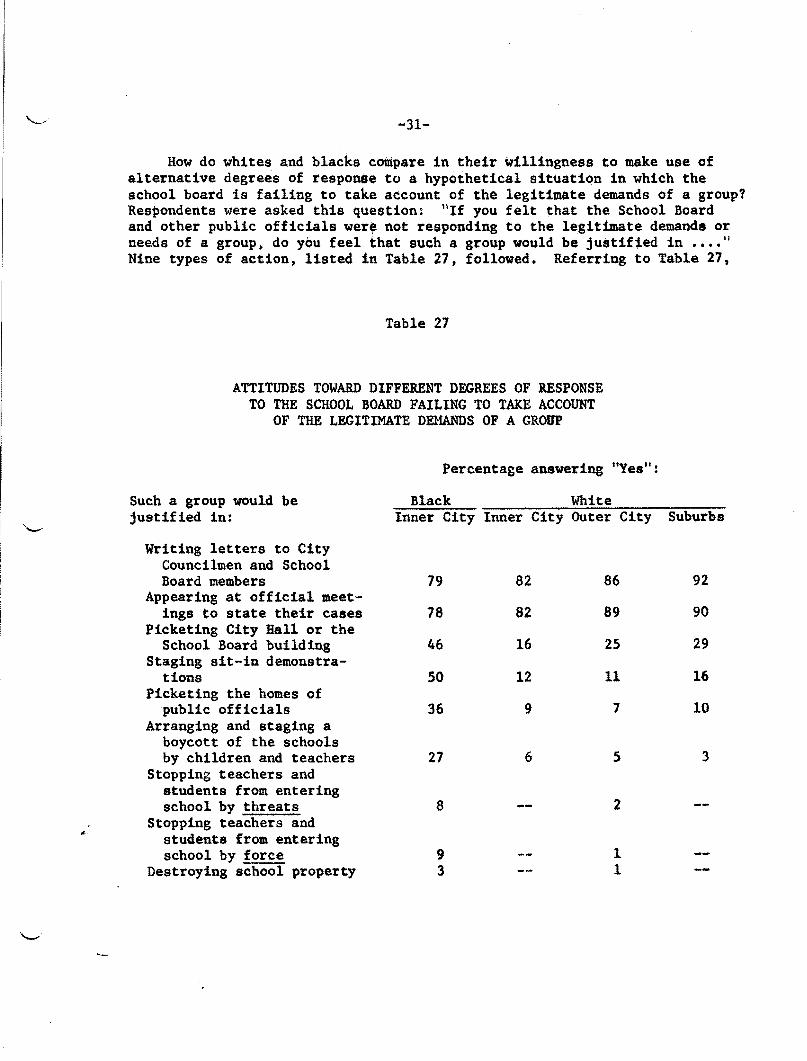
How do whites and blacks compare in their willingness to make use of alternative degrees of response to a hypothetical situation in which the school board is failing to take account of the legitimate demands of a group? Respondents were asked this question: 11If you felt that the School Board and other public officials wer• not responding to the legitimate demands or needs of a group~ do you feel that such a group would be justiU,.ed in •••• 11
Nine types of action, listed in Table 27, followed. Referring to Table 27,
Table 27
ATTITUDES TOWARD DIFFERENT DEGREES OF RESPONSE TO THE SCHOOL BOARD FAILING TO TAKE ACCOUNT
OF THE LEGITIMATE DEMANDS OF A GROUP
Percentage answering "Yes":
Such a group would be Black White justified in: Inner City Inner City Outer City Suburbs
Writing letters to City Councilmen and School Board members 79 82 86 92
Appearing at official meet-ings to state their cases 78 82 89 90
Picketing City Ball or the School Board building 46 16 25 29
Staging sit-in demonstra-tions 50 12 11 16
Picketing the homes of public officials 36 9 7 10
Arranging and staging a boycott of the schools by children and teachers 27 6 5 3
Stopping teachers and students from entering school by threats 8 2
Stopping teachers and students from entering school by force 9 1
Destroying school property 3 1
-32-
it will be noted that whites and blacks are in agreement only about the first two: fourout of five said "yes," the group would be justified in writing letters and appearing at official meetings. Although the percentage of blacks who answered 11yes" is quite a bit less for picketing and demonstrations (from 36 to SO per cent), the percentage of whites who said "yes" is much, much lower (between 7 and 29 per eent). A boycott was felt justifie4 by one in four blacks, but only one in twenty whites felt this way. Tbr~ts, force, and property destruction were not popular with either group although, again, blacks revealed a slightly greater willingness to tolerate this form of response. In sum, it seems that blacks are more willing than whites to resort to ''extra-legaln responses in making the wishes of this hypothetical group felt.
Attitudes Toward Demonstrations and Riots
The rather striking differences that we are coming to expect between black and white responses is shown in Table 28. With the exception that
Table 28
ATTITUDES TOWARD DEMONSTRATIONS AND RIOTS
Percentage answering "Agree":
Black White Inner City Inner City Outer City Suburbs
Demonstrations are a natural form of American polit~cs 62 35 51 63
Riots are unpopular but an effective method for bring-ing about desired changes 57 24 14 34
If it had not been for riots in the past$ Congress would not have paesed the Civil Rights law 51 38 35 32
Generally. in Milwaukee and Detroit, demonstration• and disturbances have set back the Negro's cause for civil rights 37 74 87 74
Negroes have more to gain (than lose) by resorting to violence in the civil rights movement 40 3 3 11
,..
-33-
euburban whites agreed with blacks that demonstrations are a natural form of American politics, blacks answered consistently to reveal their belief in the utility of demonstrations and riots. This is reflected most dramatically in the last two lists: only 37 per cent of the blacks compared to between 74 and 87 per cent of the whites agreed that the Milwaukee and Detroit demonstrations and disturbances have set back the Negro's cause for civil rights, and fully 40 per cent of the blacks in contrast to between 3 and 11 per cent of the whites agreed that Negroes have more to gain (than lose) by resorting to violence in the civil rights movement.
With respect to the effects of the Milwaukee disturbance per se, one out of three blacks felt that it helped the Negroes' cause, but only between 3 and 10 per cent of the whites felt this way (Table 29). On the negative side, three-fourths of the whites said it hurt the Negroes' cause, but only 18 per cent of the blacks felt this way (one-fourth of the blacks said they "didn't know"). Again, compared with whites, blacks see more good than bad from everts like the disturbance.
Table 29
PERCEPTION OF WHETHER THE HILWAUKEE DISTURBANCE HELPED OR HURT THE NEGRO'S CAUSE
Black t-lhite Inner City Inner City Outer City (Per Cent) (Per Cent) (Per Cent)
Helped 35 3 8 Both helped and hurt 16 12 12 Hurt 18 73 75 No difference 6 3 1 Don't know 25 7 2 Not ascertained 2 2
Total 100 100 100
Suburbs (Per Cent)
10 18 69
3
100
I'
-34-
The follning question was asked: "Do you think whites are more sympathetic to Negro problems, or less sympathetic, or have they not changed since the distur~ance?" The expected differences between whites and blacks appear in this table, too, but to a less dramatic degree (Table 30). Indeed, the most important finding in this table is that one out of five whites said whites were more sympathetic to Negro problems since the disturbance (compared to an average of less than one in ten whites who said the disturbance helped the Negroes' cause, Table 29).
Table 30
PERCEPTION OF lffiETHER WHITES ARE MORE OR LESS Sn1PATHETIC TO NEGRO PROBLEMS SINCE THE DISTURBANCE
Black White Inner City Inner City Outer City (Per Cent) (Per Cent) (Per Cent)
More sympathetic 38 21 20 No change 28 25 20 Less Sympathetic 16 36 54 Don't know 15 16 5 Not ascertained 3 2 1
Total 100 100 100
Suburbs (Per Cent)
19 18 55
8
100
. ...
-35-
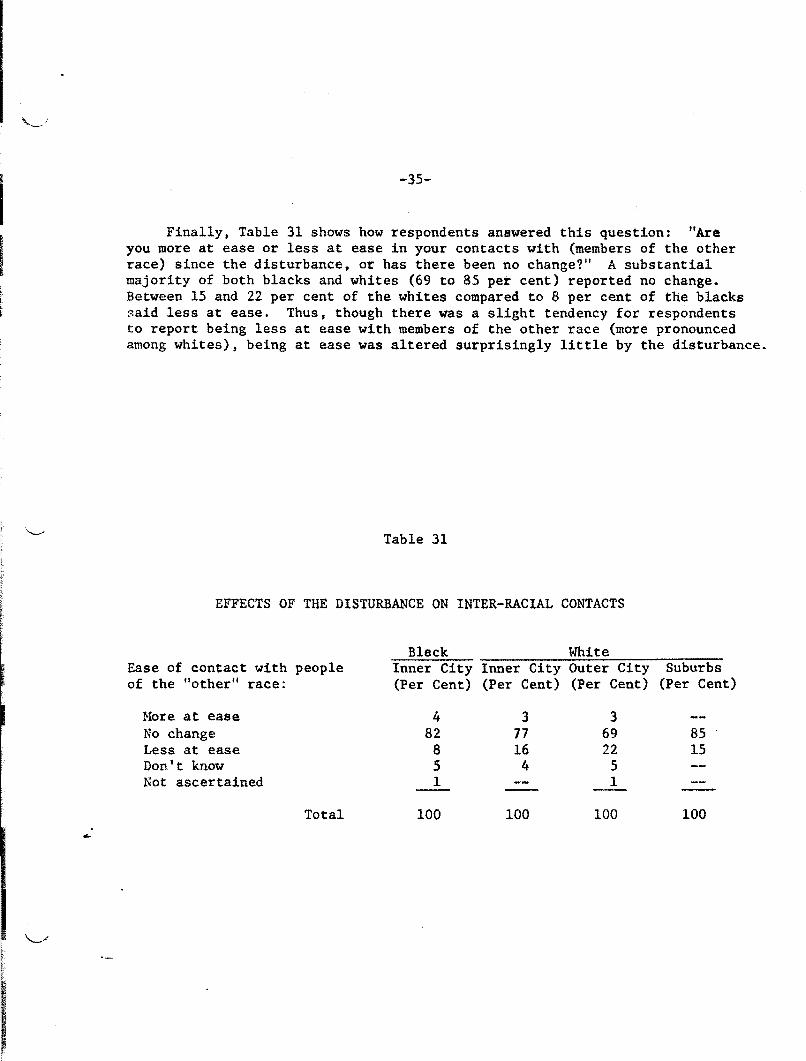
Finally, Table 31 shows how respondents answered this question: "Are you more at ease or less at ease in your contacts with (members of the other race) since the disturbance, or has there been no change? 11 A substantial majority of both blacks and whites (69 to 85 per cent) reported no change. Between 15 and 22 per cent of the whites compared to 8 per cent of the blacks said less at ease. Thus, though there was a slight tendency for respondents to report being less at ease with members of the other race (more pronounced among whites), being at ease was altered surprisingly little by the disturbance.
Table 31
EFFECTS OF THE DISTURBANCE ON INTER-RACIAL CONTACTS
Bleck White Ease of contact with people Inner City Inner City Outer City Suburbs of the "other11 race: (Per Cent) (Per Cent) (Per Cent) (Per Cent)
'Hore at ease 4 3 3 No change 82 77 69 85 Less at ease 8 16 22 15 Don.'t know 5 4 5 Not ascertained 1 1
Total 100 100 100 100
r VI
CONCLUDING REMARKS
Compared to whites, importantly larger proportions of blacks perceive inequalities and deprivations being suffered by members of the black community; proportionately more blacks feel less political power and more political alienation; and a consistently higher proportion of blacks see benefits to the Negroes' cause in civil rights as a result of demonstrations and riots. One cannot fail to recognize the conditions for continued and persisting unrest, for blacks have been separate and unequal for such a long time that demonstrations and riots may be the only effective means available to them for exerting pressure for change. Moreover, the perceptions of a substantial proportion of whites as to the causes and desired solutions to outbreaks of disturbances, that is, the focus on the control of behavior which deviates from traditional white middle class norms and values, would probably widen the schism and increase the likelihood of more and greater violence.
What, then, is the prognosis? From a perfectly logical and rational point of view, until the frwits of efforts to reduce the inequalities and deprivations of black citizens are visible and experienced satisfactorily and predictably by blacks in the ghetto, there will continue to be pressures to use extra-legal means as a mechanism for the survival of a minority group in an alien society. For the immediate future, then, one must predict that protests, demonstrations, and riots will continue to be seen as an effective device for presenting a bill of particulars. In addition, these kinds of activities aerve the latent function of developing the cohesiveness of the black community and the self-identity of its members.
....
VII
SUMMARY OF FINDINGS
Blacks and whites differed markedly in their perceptions of the C'auses of the civil disturbance in Milwaukee during the summer of 1967:
--Blacks were more likely to cite factors reflecting their second class citizenship in American society such as poor housing, job discrimination, unemployment, unequal educational opportunities, and police brutality directed against blacks;
--whites were more inclined to mention things depicting the breakdown of social control (rebellious youth who lack adequate parental control), forces from outside the city (including Communists and Black Nationalists), and civil rights agitation at the local level.
Consistent with their perceptions of causes, blacks favored solutions that seek to reduce the disparities between blacks and whites, while whites supported measures designed to control deviant behavior and violence.
Blacks and whites also differed in the way they assessed the character and severity of social and economic conditions afflicting the central city ghetto. Thus, in contrast to whites, blacks were more likely to answer:
--unfavorable regarding the quality and income of jobs available to Milwaukee blacks compared to blacks elsewhere, and whites in Milwaukee;
--that the pace of the growth of job opportunities for Milwaukee blacks is too slow;
--that in addition to being more favorable toward the enactment of open housing legislation (both city and county), the pace is too slow in efforts to obtain such legislation;
--that inner city schools are inadequate with regard to courses taught, school buildings, teachers, and school officials;
--that police brutality against Milwaukee blacks occurs frequently;
--that blacks have not achieved the improved status intended by much civil rights legislation; and
--that they are in general dissatisfied with the efforts by government at both federal and local levels to encourage racial integration in our society.
I.
-38-
Finally. blacks and whites were not in agreement in their general orientations toward mechanisms for social change:
--by and large, blacks expressed more alienation from and cynicism toward the political system;
--blacks consistently indicated greater belief in the utility of demonstrations and riots and were less likely to feel that r~cent disturbances have set back the black's cause;
--a majority of blacks answered that riots are an unpopular but effective means for bringing about desired changes.
on~ ~atter on which blacks and whites do agree: civil disturbances cc·t!ld happen again in Milwaukee.
...
APPENDIX A
Research Methodology
This report is based on data from 387 interviews conducted with Milwaukee County residents. For analysis purposes~ the county was divided into three parts: (1) the "inner city, 11 the area cordoned off by law enforcement officials (between let and 27th streets, Juneau Avenue, and Capitol Drive), an area which includes the black ghetto; (2) the "outer city," the rest of the city of Milwaukee; and (3) the "suburbs," the county outside the city limits.
A probability sample of households was drawn from the Milwaukee City Directory and relevant suburban listings by the Sampling Section of the Wisconsin Survey Research Laboratory. A supplementary block sample was also drawn to check Directory errors that might arise from changing usage of structures since the compilation of the Directory. In order to assure an adequate number of black respondents, a higher sampling rate was utilized for the cordoned-off area: approximately one out of 140 housing units for the cordoned-off area and one out of 975 for the remainder of the county.
At each household, interviewers were instructed to list all persons living in the dwelling who were 16 years of age and older in the cordoned-off area, and 18 years of age and older in the rest of the sample. The age limit in the inner city area was lowered because it was felt that a significant population in the ghetto would be passed over if there was no representation of 16 and 17 year olds. Respondents within each household (typically, one to a household) were selected by reference to a "selection table" developed by Dr. Leslie Kish at The University of Michigan. Upon recommendation of Dr. Kish, the selection tables were appropriately modified to compensate for possible bias introduced because of the lower age limit in the Milwaukee sample (the tables are designed for use with populations aged 21 and higher). When respondents are grouped, this procedure yields a representative sample of the total population •
r .
. .
'
!'
t f
I; -40-
Table A shows the number of households chosen in each area, the .number of completed interviews obtained, and the response rate of each group. This latter figure is determined by subtracting the number of addresses chosen, which turned out not to be dwelling units (e.g., abandoned houses, empty lots, churches, stores, etc.) from the total number of addresses, and dividing the resulting number into the number of completed interviews. Interviewers were instructed to make as many as six call-backs if necessary.
Total Number Milwaukee of __!~ea Addresses
Inner city 354
Outer city 226
County outside of city 94
Table A
Total Number of Non-Sample
Units
87
28
2
Total Number of Housing Units
Contacted
267
198
92
Total Number of Completed Interviews
193
132
62
Response Rate
70%
67%
67%
The distribution of black and white respondents in these areas is shown in Table B.
Table B
Black White Total
Inner City 125 68 193
Outer City 3 129 132
County Outside of City 0 62 62
\ ! -
200
100
75
50
200
100
75
50
200
100
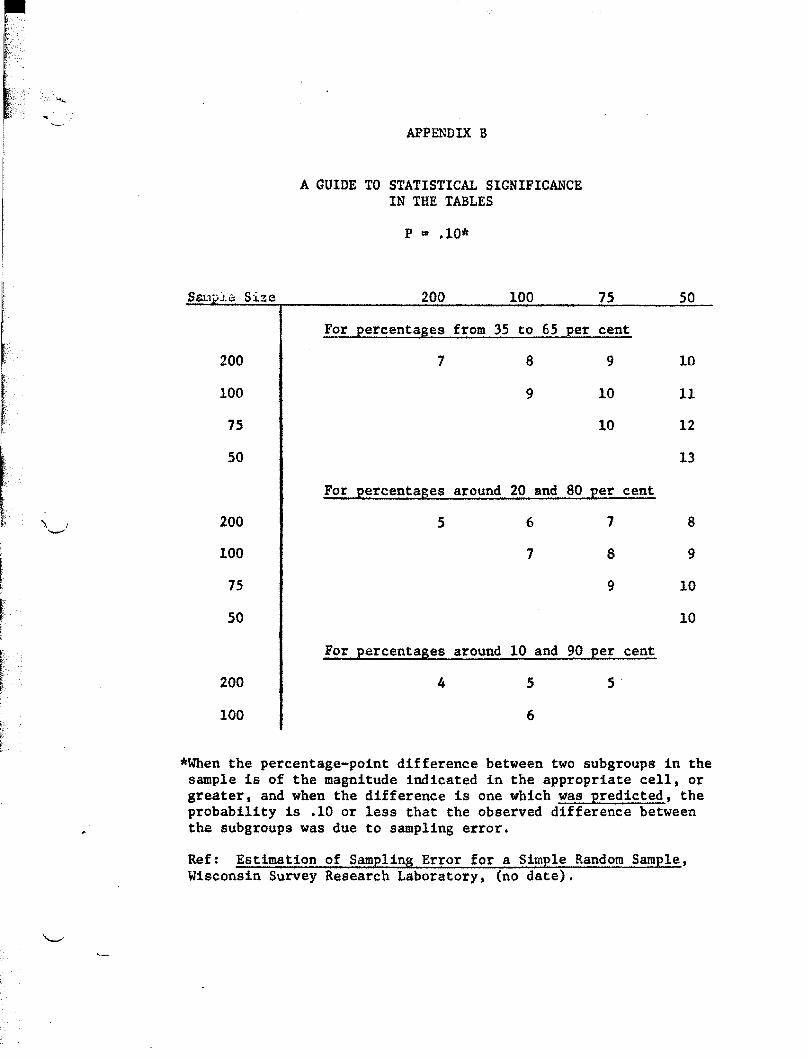
APPENDIX B
A GUIDE TO STATISTICAL SIGNIFICANCE IN THE TABLES
p •• 10*
200 100 75
For percentages from 35 to 65 per cent
7 8 9
9 10
10
For percentages around 20 and 80 per cent
5 6 7
7 8
9
For percentages around 10 and 90 per cent
4 5 5
6
50
10
11
12
13
8
9
10
10
*When the percentage-point difference between two subgroups in the sample is of the magnitude indicated in the appropriate cell, or greater, and when the difference is one which was predicted, the probability is .10 or less that the observed difference between the subgroups was due to sampling error.
Ref: Estimation of Sampling Error for a Simple Random Sample, Wisconsin Survey Research Laboratory, (no date).