215
Document Separator D S 000 Document ID Number 64263 DS000 64263

Document Separator
D S 0 0 0
Document ID Number
64263
DS000
64263

WWW.INTEGRAL-CORP.COM
2017 S it e R e m e d ia t io n
R e p o r t
Former Ashland Lease Area Soo Line Shoreham Yard MPCA Superfund Program SR380
Prepared for Ashland Inc.5200 Blazer Pkwy Dublin, OH 43017
Prepared byIntegral Consulting Inc.285 Century Place Suite 190Louisville, CO 80027
May 21, 2018
UNCOMMON SYNERGIES | TECHNICAL INTEGRITY ! EXCEPTIONAL RESULTS

2017 S ite R em ed ia t io n R epo r t
Former Ashland Lease Area, Soo Line Shoreham Yard MPCA Superfund Program SR380
Prepared for Ashland LLC
5200 Blazer Pkwy Dublin, OH 43017
Prepared by
285 Century Place Suite 190
Louisville, CO 80027
2017 Site Remediation ReportFormer Ashland Lease Area May 21,2018
CONTENTS
LIST OF FIGURES............................................................................................................................................iv
LIST OF TABLES..............................................................................................................................................vi
ACRONYMS AND ABBREVIATIONS....................................................................................................vii
1 INTRODUCTION................................................................................................................................... 1-1
2 SOIL VAPOR EXTRACTION/BIO VENTING................................................................................ 2-1
2.1 M ON ITORING................................................................................................................................... 2-1
2.1.1 Field Screening....................................................................................................................2-1
2.1.2 SVE System Sampling...................................................................................................... 2-2
2.2 OPERATION....................................................................................................................................... 2-2
2.3 RECOVERY......................................................................................................................................... 2-2
2.4 SH U TDO W N ...................................................................................................................................... 2-3
3 LNAPL RECOVERY................................................................................................................................3-1
3.1 M ON ITORING...................................................................................................................................3-1
3.1.1 Field Screening................................................................................................................... 3-1
3.1.2 LNAPL Sam pling..............................................................................................................3-2
3.2 OPERATION....................................................................................................................................... 3-2
3.3 RECOVERY......................................................................................................................................... 3-2
4 TILL GROUNDWATER BIOREMEDIATION.............................................................................. 4-1
4.1 M ON ITORING.................................................................................................................................. 4-1
4.2 OPERATION.......................................................................................................................................4-1
4.3 WELL REHABILITATION............................................................................................................. 4-1
4.4 RESULTS...............................................................................................................................................4-2
5 OUTWASH GROUNDWATER PUMPING SYSTEM.................................................................5-1
5.1 M ON ITORING.................................................................................................................................. 5-15.2 OPERATION.......................................................................................................................................5-15.3 RECOVERY.........................................................................................................................................5-2
6 ASSESSMENT OF F ALA REMEDIATION ACTIVITIES.......................................................... 6-1
7 2018 OPERATIONS.................................................................................................................................7-1
8 REFERENCES........................................................................................................................................... 8-1
Integral Consulting Inc. ii

2017 Site Remediation ReportFormer Ashland Lease Area - May 21,2018
Appendix A. SVE Shutdown Evaluation Report
Appendix B. Air Emissions Screening
Appendix C. Total cVOCs and Total TEX in FALA Monitoring Wells
Appendix D. Chlorinated Ethenes in FALA Monitoring Wells
Appendix E. Chlorinated Ethanes in FALA Monitoring Wells
Appendix F. Toluene, Ethylbenzene, and Xylenes in FALA Monitoring Wells
Appendix G. Data Tables
Appendix H. Analytical Data Reports
Appendix I. Well Rehabilitation Work Plan
Integral Consulting Inc. in

2017 Site Remediation ReportFormer Ashland Lease Area May 21,2018
LIST OF FIGURES
Figure 1-1. Location Map
Figure 2-1. Location of SVE Vapor Extraction Wells and Monitoring Points at the FormerAshland Lease Area
Figure 2-2a-b. VOCs Measured at Individual Alluvium VEWs
Figure 2-3. VOCs Measured at Alluvium Manifold
Figure 2-4. Emission Rate from SVE Stack
Figure 2-5. Cumulative VOC and CO2 Mass Removal from SVE
Figure 2-6. VOC Mass Removal Rate in SVE
Figure 2-7. Total Concentration of VOCs in SVE
Figure 2-8. Concentrations of Chlorinated and Non-chlorinated VOCs in SVE Manifolds
Figure 3-1. Location of LNAPL Monitoring and Recovery Wells around the FormerAshland Lease Area
Figure 3-2. LNAPL Composition
Figure 3-3. Yearly LNAPL Volumes Removed by Well
Figure 3-4. Cumulative LNAPL Volume Removed by Active Methods through 2017
Figure 4-1. Site Map Showing Network of Bioremediation Injection and Monitoring Wells
Figure 4-2. Initial FALA Till Groundwater Plume Zones
Figure 4-3. Concentrations of Chlorinated Ethenes in Peripheral Zone Wells MW05-21-T,MW06-258-I, MW07-02-I, and MW-401S
Figure 4-4. Concentrations of Chlorinated Ethenes in Source Zone Wells MW-309 andMW-402S
Figure 4-5. Concentrations of Chlorinated Ethenes and TEX in Intermediate Zone WellMWO6-257-1
Figure 4-6. Concentration of Chlorinated Ethenes and TEX in Source Zone Wells MW-318and MW10-03-T
Figure 5-1. Site Map Showing Location of Outwash Pumping and Monitoring Wells
Figure 5-2. Site Map Showing Monitoring Wells Grouped by Plume Location
Figure 5-3. Upper Outwash Water Level Contour Plot, 1st Quarter 2017
Figure 5-4. Upper Outwash Water Level Contour Plot, 2nd Quarter 2017
Figure 5-5. Upper Outwash Water Level Contour Plot, 3rd Quarter 2017
Integral Consulting Inc. iv

2017 Site Remediation ReportFormer Ashland Lease Area May 21,2018
Figure 5-6. Upper Outwash Water Level Contour Plot, 4th Quarter 2017
Figure 5-7. Total Concentration of VOCs and Annual Volume Pumped, Outwash Pumpand Treat System
Figure 5-8. Cumulative Mass and Volume Removed, Outwash Pump and Treat System
Figure 5-9. Plume Distribution in Upper Outwash, VOCs
Integral Consulting Inc.

2017 Site Remediation ReportFormer Ashland Lease Area May 21,2018
Table 2-1.
Table 2-2.
Table 2-3.
Table 2-4.
Table 2-5a.
Table 2-5b.
Table 2-5c.
Table 2-6a.
Table 2-6b.
Table 2-7.
Table 3-1.
Table 3-2.
Table 3-3.
Table 3-4.
Table 3-5.
Table 3-6.
Table 4-1.
Table 4-2a.
Table 4-2b.
Table 4-3.
Table 5-1.
Table 5-2a.
Table 5-2b.
Table 5-2c.
Table 5-3.
Table 5-4.
LIST OF TABLES
Field Screening Results, Till SVE
Field Screening Results, Alluvium SVE
Vacuum Levels Measured in Till and Alluvium SVE Monitoring Points
Water Levels Measured in Till Vapor Extraction Wells
VOCs Measured (Method TO-15) in the Till Manifold
VOCs Measured (Method TO-15) in the Alluvium Manifold
VOCs Measured (Method TO-15) in the Carbon Vessel Exhaust (Stack)
Gas Composition (ASTM Method D-1945) Results for the Till Manifold
Gas Composition (ASTM Method D-1945) Results for the Carbon Vessel Exhaust (Stack)
SVE System Information and Monitoring Results
Summary of LNAPL Monitoring and Recovery
Product Thickness Data for 15 Monitoring Wells
Product Thickness and Volume Removed from MW04-192-T
Summary of LNAPL Monitoring 2006 through 2017
LNAPL Hydrocarbon Concentrations
LNAPL VOC Concentrations
Summary of Injections of the Full-Scale Enhanced Bioremediation System
Summary of 2017 Monitoring of the Enhanced Bioremediation System
Summary of 2017 Monitored Natural Attenuation Parameters
Summary of Well Rehabilitation Slug Testing
Outwash Monitoring and Pumping Well Network
Pump and Treat System Influent Concentrations
Pump and Treat System Intermediate Concentrations
Pump and Treat System Effluent Concentrations
Extraction Rates and Volumes Withdrawn from Outwash Wells
Concentration Trends in Extraction Wells for Toluene and Trichloroethene
vi

2017 Site Remediation ReportFormer Ashland Lease Area May 21, 2018
ACRONYMS AND ABBREVIATIONS
AMEC AMEC Foster Wheeler
ASTM ASTM International
bgs below ground surface
ds-DCE ds-l,2-dichloroethene
cVOC chlorinated volatile organic compound
DRO diesel-range organics
EPA U.S. Environmental Protection Agency
FALA Former Ashland Lease Area
GAC granular activated carbon
GES Groundwater & Environmental Services, Inc.
gpm gallons per minute
GRO gasoline-range organics
LNAPL light, nonaqueous-phase liquid
MCES Metropolitan Council Environmental Services
MPCA Minnesota Pollution Control Agency
PID photoionization detector
qPCR quantitative polymerase chain reaction
SVE soil vapor extraction
TCE trichloroethene
TEX toluene, ethylbenzene, xylene
TOD toluene dioxygenase
VEW vapor extraction well
VOC volatile organic compound
Integral Consulting Inc. vii
2017 Site Remediation ReportFormer Ashland Lease Area May 21,2018
1 INTRODUCTION
This report describes the 2017 operation, sampling, and performance of the remediation systems at the Former Ashland Lease Area (FALA). The site (Figure 1-1) is located along the 2800 block of Central Avenue NE within the east side of the Shoreham Yard facility. This site is being remediated under the Minnesota Pollution Control Agency (MPCA) Voluntary Investigation and Cleanup Program (former Site ID VP5080); however, oversight has been transferred to MPCA's Superfund Program (Site ID SR380).
The remediation of the FALA site involves four systems: soil vapor extraction (SVE); light, nonaqueous-phase liquid (LNAPL) removal; enhanced bioremediation; and groundwater pump and treat. The SVE system operated in the unsaturated zone (0-35 ft below ground surface [bgs]), LNAPL removal occurs both at the water table and beneath a lacustrine clay unit, the bioremediation system operates in the saturated portion of the till zone (36-50 ft bgs), and the outwash pumping system targets groundwater in the upper zone of the glacial outwash (50- 65 ft bgs).
Sections 2 through 5 of this report provide discussions of performance of the individual remediation systems in 2017. Section 6 provides an overall assessment of site activities, and Section 7 provides information on remediation activities for 2018. Appendices A and B contain documents related to the SVE system, and Appendices C through F present time-series plots of individual and summed chlorinated volatile organic compounds1 (cVOCs) and toluene, ethylbenzene, and xylenes (TEX) compounds for the bioremediation and pump and treat systems. Appendix G provides a tabular summary of monitoring data, and Appendix H provides relevant laboratory reports. Appendix I contains the 2017 well rehabilitation work plan.
1 Sum of tetrachloroethene, trichloroethene, cis-l,2-dichloroethene, 1,1-dichloroethene, vinyl chloride, 1,1,1- trichloroethane, 1-1-dichloroethane, and chloroethane.
Integral Consulting Inc. 1-1

2017 Site Remediation ReportFormer Ashland Lease Area May 21,2018
2 SOIL VAPOR EXTRACTION/BIOVENTING
The SVE system is composed of five vapor extraction wells (VEWs) screened in the unsaturated alluvium and nine VEWs screened in the variably saturated till (Figure 2-1). Flows from the individual alluvium and till VEWs are combined in separate alluvium and till manifolds, respectively. The alluvium portion of the system has been shut down since July 2013. A shutdown evaluation consisting of rebound and restart testing of both the till and alluvium SVE systems was performed from December 2016 to January 2017, and the till portion of the system was shut down on December 6, 2017, after it was determined that ongoing flooding of the till VEWs rendered further operation impractical. The report for the shutdown evaluation is provided in Appendix A. Summarized below are system performance data, removal rates, shutdown testing results, and system shutdown. ,
2.1 MONITORING
Quarterly SVE system monitoring during 2017 is summarized below. All field screening and sampling were performed by Groundwater & Environmental Services, Inc. (GES) field personnel, with laboratory analyses performed by Air Toxics LTD, in Folsom, California.
2.1.1 Field Screening
Air flow is monitored at the manifolds and in the individual VEWs. The product of air flow velocity and the cross-sectional area of the conduit are used to estimate flow rates. Air flow results from each VEW and the manifolds during the reporting period are shown in Table 2-1 for till locations and Table 2-2 for alluvium locations. VEW and manifold flow rates in 2017 were similar to rates observed in 20l6.
While the alluvium SVE system was shut off, volatile organic compounds (VOCs) continued to be monitored quarterly using a photoionization detector (PID) meter. Alluvium VOC results from 2011 through 2017 are presented in Figures 2-2a-b (VEWs) and 2-3 (manifold). The VEW and alluvium manifold PID readings show a pattern of seasonal fluctuation, peaking in the warmer months, with overall decreasing VOC concentrations observed between 2011 and 2017.
Vacuum pressures were monitored at four vapor monitoring points located in the alluvium and at seven locations in the till. Vapor point vacuum pressure results are provided in Table 2-3.The results ranged from zero vacuum in 6 of the 11 vapor points to a maximum of 0.64 in. of water. Reduced vacuum is attributed to inundation of the till vapor points by the rising water table.
Integral Consulting Inc. 2-1

2017 Site Remediation ReportFortner Ashland Lease Area May 21,2018
Quarterly water level gauging of the nine till VEWs continued as part of the monitoring program throughout 2017 to determine if the water table is intersecting the screened interval of the till VEWs. Water level elevations for each VEW are reported in Table 2-4. Water was detected in eight of the nine VEWs in 2017. Water heights of 5 ft or greater were recorded in six VEWs, indicating the screened interval may have been submerged. The year 2017 was the first year that water levels in these six VEWs did not fluctuate below the 5-ft screen height. The inundation of the till VEWs by the rising water table makes further operation of the till SVE system impractical.
2.1.2 SVE System Sampling
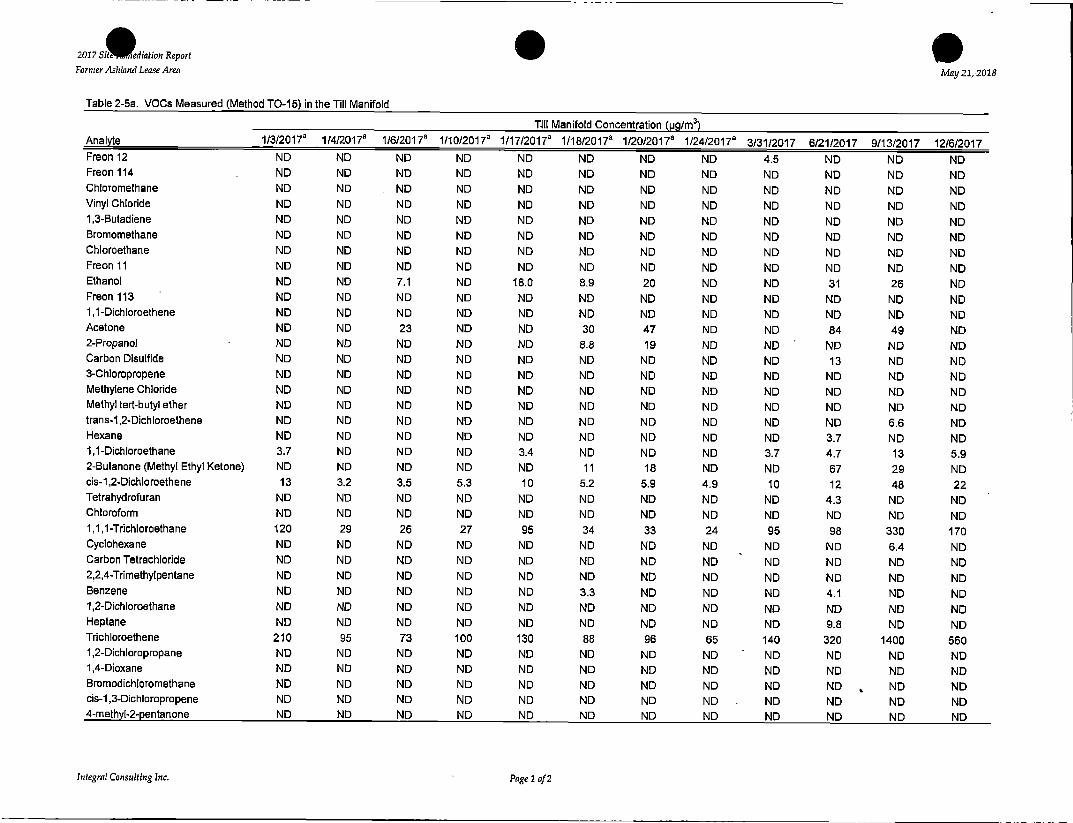
The SVE system influent (till) and effluent (stack emissions) were sampled quarterly on March 27 (stack)/March 31 (till), June 21, September 13, and December 6,2017. Samples were analyzed by ATSM International (ASTM) Method D-1945 and U.S. Environmental Protection Agency (EPA) Method TO-15. Additional TO-15 samples were collected for the till and alluvium manifolds in January as part of the shutdown evaluation. Results from Method TO-15 are presented in Table 2-5a for the till manifold, Table 2-5b for the alluvium manifold, and Table 2-5c for the stack. Results from ASTM Method D-1945 are presented in Tables 2-6a (till manifold) and Table 2-6b (stack). The carbon treatment was removed from the stack in 2013; therefore, these samples represent direct discharges without carbon treatment. VOC emission rates from the stack have remained below MPCA air emission screening levels since the system was disconnected (Figure 2-4). The MPCA Air Emissions Screening Spreadsheet (MPCA 2011) was used to verify that the 2017 SVE emissions were below screening levels (Appendix B).
2.2 OPERATION
A summary of SVE operations for 2017 is presented in Table 2-7. The first section of the table provides general operational information, including runtime, flow rates, and total VOC concentrations measured from each of the manifolds. The alluvium SVE system remained temporarily shut down in 2017; however, the system was turned on for several hours each quarter to obtain field screening data and was turned on for a total of 2 weeks in January for the shutdown evaluation test. The till system was off for a total of 9 days in January for the shutdown evaluation test. The till system was shut down on December 6,2017, due to flooding of the till VEWs as described in Section 2.4 below. No additional downtime was recorded in 2017.
2.3 RECOVERY
SVE performance, including contaminant mass removal rates, incremental mass removed, and cumulative mass removed since system start up, is provided in Table 2-7. Mass removal and stack emission rates were calculated as the product of flow rate and the sum of contaminant
Integral Consulting Inc. 2-2
2017 Site Remediation ReportFormer Ashland Lease Area May 21,2018
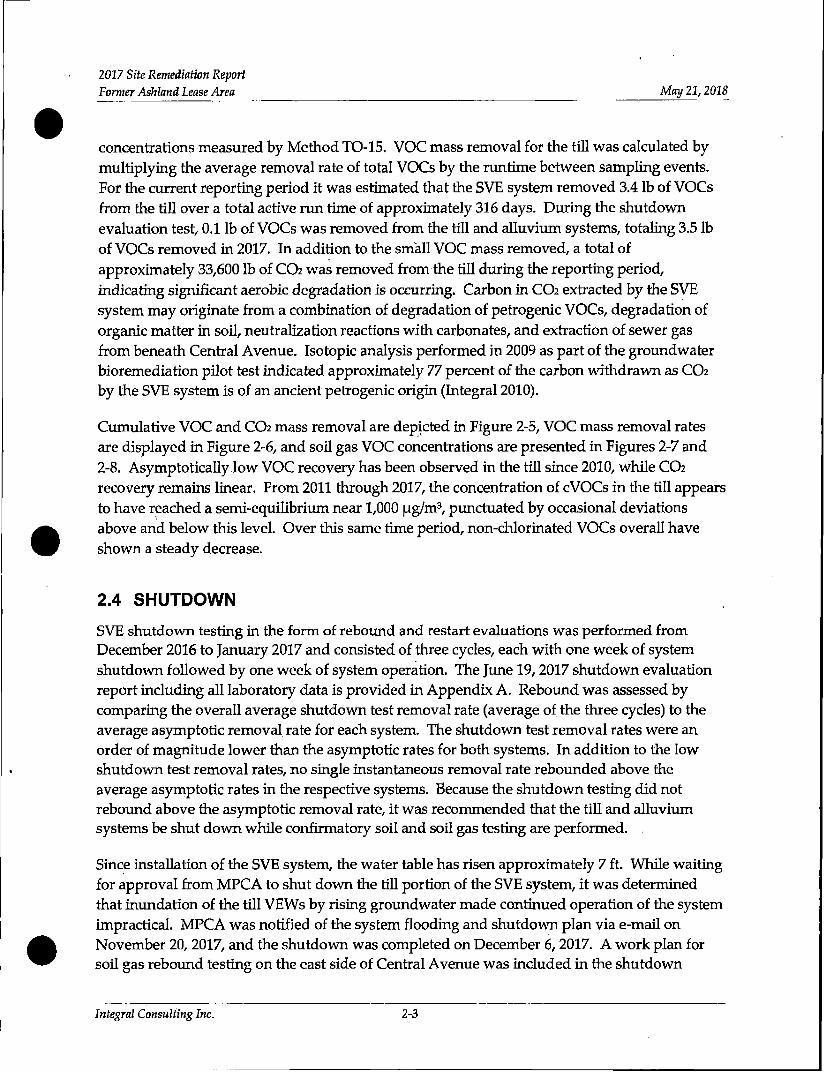
concentrations measured by Method TO-15. VOC mass removal for the till was calculated by multiplying the average removal rate of total VOCs by the runtime between sampling events. For the current reporting period it was estimated that the SVE system removed 3.4 lb of VOCs from the till over a total active run time of approximately 316 days. During the shutdown evaluation test, 0.1 lb of VOCs was removed from the till and alluvium systems, totaling 3.5 lb of VOCs removed in 2017. In addition to the small VOC mass removed, a total of approximately 33,600 lb of CO2 was removed from the till during the reporting period, indicating significant aerobic degradation is occurring. Carbon in CO2 extracted by the SVE system may originate from a combination of degradation of petrogenic VOCs, degradation of organic matter in soil, neutralization reactions with carbonates, and extraction of sewer gas from beneath Central Avenue. Isotopic analysis performed in 2009 as part of the groundwater bioremediation pilot test indicated approximately 77 percent of the carbon withdrawn as CO2
by the SVE system is of an ancient petrogenic origin (Integral 2010).
Cumulative VOC and CO2 mass removal are depicted in Figure 2-5, VOC mass removal rates are displayed in Figure 2-6, and soil gas VOC concentrations are presented in Figures 2-7 and 2-8. Asymptotically low VOC recovery has been observed in the till since 2010, while CO2
recovery remains linear. From 2011 through 2017, the concentration of cVOCs in the till appears to have reached a semi-equilibrium near 1,000 jug/m3, punctuated by occasional deviations above and below this level. Over this same time period, non-chlorinated VOCs overall have shown a steady decrease.
2.4 SHUTDOWNSVE shutdown testing in the form of rebound and restart evaluations was performed from December 2016 to January 2017 and consisted of three cycles, each with one week of system shutdown followed by one week of system operation. The June 19, 2017 shutdown evaluation report including all laboratory data is provided in Appendix A. Rebound was assessed by comparing the overall average shutdown test removal rate (average of the three cycles) to the average asymptotic removal rate for each system. The shutdown test removal rates were an order of magnitude lower than the asymptotic rates for both systems. In addition to the low shutdown test removal rates, no single instantaneous removal rate rebounded above the average asymptotic rates in the respective systems. Because the shutdown testing did not rebound above the asymptotic removal rate, it was recommended that the till and alluvium systems be shut down while confirmatory soil and soil gas testing are performed. .
Since installation of the SVE system, the water table has risen approximately 7 ft. While waiting for approval from MPCA to shut down the till portion of the SVE system, it was determined that inundation of the till VEWs by rising groundwater made continued operation of the system impractical. MPCA was notified of the system flooding and shutdown plan via e-mail on November 20, 2017, and the shutdown was completed on December 6, 2017. A work plan for soil gas rebound testing on the east side of Central Avenue was included in the shutdown
Integral Consulting Inc. 2-3

evaluation report (Appendix A) and commenced in the first quarter of 2018. A separate work plan for confirmation soil sampling was submitted to MPCA on April 23,2018.
2017 Site Remediation ReportFormer Ashland Lease Area May 21,2018
Integral Consulting Inc. 2-4

2017 Site Remediation ReportFormer Ashland Lease Area May 21,2018
3 LNAPL RECOVERY
LNAPL is recovered from FALA pumping wells using an LNAPL break-out tank (in-line oil/water separator) and from monitoring wells by bailing and oil absorbent socks. Passive oil absorbent socks were removed from all wells in the fourth quarter of 2016 to allow for rebound monitoring in the till. Analysis of LNAPL collected from the break-out tank and well MW04- 192-T demonstrates that cVOC concentrations are decreasing over time in the sub-lacustrine LNAPL. Collection of LNAPL via the break-out tank is ongoing to provide protection of the granular activated carbon (GAC) vessels. LNAPL monitoring and break-out tank operation and performance data collected to assess removal rates and provide a basis for system modifications are summarized below.
3.1 MONITORING
Results of LNAPL monitoring and ad hoc sampling during 2017 are provided below. All field screening and sampling were performed by GES field personnel, with laboratory analyses performed by Pace Analytical in Minneapolis, Minnesota.
3.1.1 Field Screening
The presence/absence and thickness of LNAPL were measured in 16 wells during 2017 (Figure 3-1). Three of the LNAPL monitoring wells, MW04-188-T, MW04-190-T, and MW-317, were abandoned in June 2017 and were monitored through May 2017. Twelve wells were monitored quarterly and four wells were monitored monthly (Table 3-1). The monitoring frequency in wells MW07-71-T, MW-318, and MW-402D was approved by MPCA to be reduced from monthly to quarterly in April 2017, however, these wells continued to be monitored monthly through December 2017. As in previous years, MW04-192-T was monitored more frequently as part of the break-out tank operation and maintenance. Additionally, four wells rehabilitated in July 2017, MW07-71-T, MW10-03-T, MW-309, and MW-318, were monitored monthly through the end of the year to evaluate LNAPL rebound post-cleaning. A complete description of the well rehabilitation procedure is provided in Section 4.2. Depth-to-product and depth-to-water measurements were collected by GES using an oil/water interface probe following the procedures outlined in the Shoreham Facility standard operating procedures document (AMEC 2015).
LNAPL occurrences and recovery volumes are summarized in Table 3-1, and monitoring data from individual wells are presented in Table 3-2, excluding MW04-192-T, which is presented in Table 3-3. Maximum product thicknesses observed in each well from 2006 through 2017 are given in Table 3-4. During this reporting period, LNAPL was observed in 3 of the 16 wells monitored: MW04-192-T, MW05-02-T, and MW-318. In addition, during quarterly groundwater level monitoring, AMEC Foster Wheeler (AMEC) encountered LNAPL in wells
Integral Consulting Inc. 3-1

2017 Site Remediation ReportFormer Ashland Lease Area May 21, 2018
MW04-187-T, MW06-257-I, MW10-03-T, and MW-402S (AMEC 2018). A sheen (0.01 ft) was observed by AMEC in wells MW04-187-T, MW06-257-I, and MW-402S, and a measureable amount of LNAPL was found in MW10-03-T (0.63 ft) and MW-318 (0.06 ft).
3.1.2 LNAPL Sampling
LNAPL from wells MW04-192-T and MW05-02-T is collected by the break-out tank installed in 2014, although all of the LNAPL recovered is attributed to well MW04-192-T, where LNAPL has been accumulating since 2008. Following installation of the break-out tank, the pump in MW04- 192-T was raised to just below the LNAPL/groundwater interface to maximize LNAPL recovery under normal pumping conditions. An ad hoc sample of LNAPL from well MW04-192-T was collected in January 2017, and an additional sample from the break-out tank was collected in September 2017. The samples were analyzed for diesel-range organics (DRO) and gasoline- range organics (GRO) by EPA Method 8015C, and VOCs by EPA Method 8260B. The results of these three analyses are provided in Tables 3-5 (DRO and GRO) and 3-6 (VOCs). Each table also includes the historical (2004) analysis of LNAPL from well MW-402D, located beneath the lacustrine clay, similar to MW04-192-T.
The ratio of DRO to GRO and concentrations of VOCs in each of the samples are shown in Figure 3-2 (Plot A). A comparison of the ratio of DRO to GRO between the 2004 LNAPL sample and recent LNAPL samples shows a decrease in GRO relative to DRO. Likewise, within the GRO range, a decrease in cVOCs to TEX compounds is observed between the 2004 and more recent samples as shown in Figure 3-2 (Plot B). These results are consistent with the relative solubility of these compounds and the large mass of dissolved VOCs removed as described below in Section 5.3.
3.2 OPERATION
The break-out tank has been operating continuously since August 2014, allowing for dual-phase extraction of LNAPL and groundwater in MW04-192-T and MW05-02-T. The system operation is evaluated monthly, at a minimum, and includes flow rate adjustment to maintain optimal recovery, monitoring of LNAPL accumulation, and coordination of LNAPL disposal. Pumping downtime throughout the year totaled 21 days and consisted of scheduled GAC replacement, pumping system leak detections, pump maintenance, and sewer cleaning. Discharge for MW04-192-T and MW05-02-T is reported in Section 5.
3.3 RECOVERY
During 2017,19.0 gal of LNAPL was removed from MW04-192-T and an additional 0.1 gal was removed by an oil absorbent sock in MW-318 (Figures 3-3 and 3-4, Table 3-1). The total LNAPL volume recovered decreased by nearly half from the previous year and is the lowest recovery since LNAPL was found in MW04-192-T in 2008 (Figure 3-3). The continued recovery of
Integral Consulting Inc. 3-2

2017 Site Remediation ReportFormer Ashland Lease Area May 21,2018
LNAPL from MW04-192-T is diminishing the recoverable LNAPL trapped beneath the. lacustrine clay unit.
Integral Consulting Inc.

2017 Site Remediation ReportFormer Ashland Lease Area May 212018
4 TILL GROUNDWATER BIOREMEDIATION
This section provides an update of till groundwater bioremediation system activities performed at the FALA in 2017. A comprehensive analysis of Phases I, II, and III is provided in the Phase III Pilot Test Report and Phase IV Design Document (Integral 2010). A description of all Phase IV Full-Scale Operation injections can be found in the FALA 2014 Site Remediation Report (Integral 2015), and a summary table is included in this report (Table 4-1).
4.1 MONITORING
The bioremediation system is composed of 5 injection wells and 15 monitoring wells (Figure 4-1, Table 4-2a). Wells MW04-188-T, MW07-71-T, MW-310, and MW-317 were removed from Table 4-2a because they were abandoned in June 2017. In addition, MW04-187-T was converted to a water level only well. The final analytical sampling event for these wells was October 2016, and water levels were measured through May 2017.
As outlined in Tables 4-2a-b, the monitoring wells were sampled for VOCs, monitored natural attenuation parameters, and bromide, the injection tracer, in May and October 2017. Wells MW07-71-T, MW10-03-T, MW-309, and MW-318 were also sampled for VOCs in the third quarter following well rehabilitation. MPC A approved the removal of bromide from the list of monitored natural attenuation parameters; however, bromide continued to be analyzed semiannually through 2017. Ad hoc sampling of the bioremediation wells for quantitative polymerase chain reaction (qPCR) analysis of microbial populations was not performed in 2017. qPCR sampling performed in 2015 demonstrated the microbial populations were stable one year after discontinuing injections.
4.2 OPERATION
Bioremediation injections were suspended after the ninth round was completed in December 2014. Monitoring during this suspension is intended to determine if acceptable rates of biodégradation are maintained without further addition of lactate or nutrients.
4.3 WELL REHABILITATION
Well rehabilitation was performed on wells MW-309, MW-318, MW07-71-T, and MW10-03-T in July 2017. The purpose of the well rehabilitation was to re-establish connection with the aquifer by removing the residual LNAPL as well as any biofouling or fine particles accumulated in the screen and filter pack. The rehabilitation was performed by GES according to the work plan provided in Appendix I. The four wells chosen for rehabilitation are current or former LNAPL wells. High concentrations of cVOCs and TEX in these wells are thought to be partially a result
Integral Consulting Inc. 4-1

2017 Site Remediation ReportFormer Ashland Lease Area May 21, 2018
of residual LNAPL trapped within the sand pack near the well screen. Concentrations of bromide, the bioremediation injection tracer, also remained elevated in these wells postinjection, potentially indicating poor connectivity with the surrounding aquifer. The well rehabilitation consisted of the following steps: high-pressure jetting and air lifting to remove debris, application of a 5 percent glycolic acid solution to address scaling or iron fouling, application of a 3 percent solution of a proprietary alkaline solution combined with a 3-5 percent solution of chlorine dioxide to address biological fouling, and finally a surfactant flush to remove residual LNAPL. All chemicals used met the American National Standards Institute/National Sanitation Foundation Standard 60-2003e, as required by the Minnesota Department of Health.
Video of the well screens was taken prior to the rehabilitation to identify the degree and type of accumulation in the well screens. The video results did not indicate noticeable scaling or fouling on the interior of the well screens. Falling head slug tests were performed before and after the well rehabilitation to measure the effectiveness of the cleaning procedure. Hydraulic conductivity calculated by the Bouwer and Rice method is presented in Table 4-3. Historical hydraulic conductivity measured in 2004 during the LNAPL pilot test is also given for comparison. Hydraulic conductivity increased post-well rehabilitation in all wells and ranged from 1.21x1 O'5 to 8.60x10 5 cm/s in the three till wells and 1.57x103 cm/s in the St. Peter Sandstone/till well. Hydraulic conductivity improved most significantly in MW-318, which had decreased by approximately 50 percent prior to the well rehabilitation and increased nearly 400 percent after the rehabilitation. Decreases in VOCs were observed in the four rehabilitated wells in the third quarter of 2017, followed by a rebound in the fourth quarter, except in well MW07-71-T.
4.4 RESULTS
Figure 4-2 depicts the three generalized zones (source, intermediate, and peripheral) within the vicinity of the FALA where biodégradation of chlorinated solvents is occurring to varying degrees (Integral 2010). In 2017, complete degradation to ethene continued to be observed in peripheral wells, MW05-21-T, MW07-02-I, and MW-401S (Figure 4-3), with the exception of MW06-258-I. An increase in trichloroethene (TCE) in MW06-258-I since 2014 is associated with all time high water levels, as reported in the 2017 Annual Groundwater Monitoring Report (AMEC 2018). Well MW06-258-I is located adjacent to an auto repair facility, and was non-detect in recent years for TEX compounds typically associated with the FALA.
In the source and intermediate zones, more limited anaerobic dehalogenation is observed, but previous qPCR sampling demonstrates that aerobic cometabolism is also occurring. For example, source zone well MW-309 exhibited sequential anaerobic degradation of ds-1,2- dichloroethene (ds-DCE) to vinyl chloride and ethene, although recently ds-DCE has remained stable as vinyl chloride decreases (Figure 4-4). Downgradient source zone well MW-402S,
Integral Consulting Inc. 4-2

2017 Site Remediation ReportFormer Ashland Lease Area May 21, 2018
historically dominated by cis-DCE, appears to exhibit primarily aerobic cometabolism as the reduction of cis-DCE since 2010 has not been accompanied by a corresponding increase in vinyl chloride (Figure 4-4). A similar trend has also been observed in source zone wells MW04-189-T and MW07-71-T with cis-DCE recently decreasing to low concentrations without observation of increases in vinyl chloride. The toluene dioxygenase (TOD) enzyme produced by aerobic degradation of toluene can directly mineralize cis-DCE without production of further daughter products such as vinyl chloride, and this appears to be occurring in well MW-402S. Substantial degradation has been observed of both the chlorinated ethenes and TEX in the wells in the intermediate zone in the southern portion of the site where TEX concentrations are not inhibiting sequential anaerobic dehalogenation (e.g., MW06-257-I; Figure 4-5). Other wells with LNAPL historically present show the formation of cis-DCE and decreasing concentrations of TCE, but have not yet progressed to vinyl chloride or ethene. In these cases, high TEX concentrations may be inhibiting further anaerobic dehalogenation, such as in wells MW-318 and MW10-03-T, although aerobic cometabolism appears to be reducing both cis-DCE and TEX concentrations in MW10-03-T (Figure 4-6).
Degradation of cVOCs in FALA bioremediation monitoring wells continued in 2017 throughout the source, intermediate, and peripheral zones. In the source zone, former LNAPL well MW- 318 has shown a nearly complete reduction in TCE with a concomitant increase in daughter product cis-DCE; however, aerobic cometabolism of cis-DCE appears to be occurring in downgradient well MW-402S, as well as in the center of the source zone at wells MW04-189-T and MW07-71-T. A combination of reductive dehalogenation and aerobic cometabolism is occurring within the source and intermediate zones, as indicated by concentration trends and qPCR results. Complete sequential anaerobic dehalogenation has occurred in the peripheral zone, with many of the peripheral monitoring wells showing several years or more of sustained low to non-detect cVOC concentrations.
Integral Consulting Inc. 4-3

2017 Site Remediation ReportFormer Ashland Lease Area May 11,2018
5 OUTWASH GROUNDWATER PUMPING SYSTEM
The out wash remediation system uses two pumping wells (MW04-192-T and MW05-02-T) to remove VOCs from the upper outwash and reduce or eliminate offsite migration of VOCs from the FALA. Summarized below are system operational and performance data collected to evaluate system operation parameters, and to assess removal rates and provide a basis for system modifications.
5.1 MONITORING
The monitoring network is composed of 2 pumping wells and 18 monitoring wells (Table 5-1; Figures 5-1 and 5-2). Wells MW00-40-MS, MW04-190-T, MW05-06-I, MW-310, MW-316, MW- 317, and MW-400S were abandoned in June 2017. The final analytical sampling event for these wells was October 2016, while water levels were monitored through May 2017. VOCs in the remaining wells are analyzed on a quarterly basis for the pumping wells and semiannually in the monitoring wells. Groundwater levels are measured quarterly in all wells. cVOC and TEX time-series plots are provided in Appendices C through F, and all analytical and field data are reported in Appendix G.
The GAC system is monitored monthly at the system effluent to the municipal sewer and quarterly at the influent and between the primary and secondary GAC vessels. A summary of the concentrations measured in the GAC treatment system influent, between GAC vessels, and in effluent is presented in Tables 5-2a-c, respectively. All monthly measurements of the GAC effluent were within specification of the Metropolitan Council Environmental Services (MCES) permit throughout the performance period (Industrial Discharge Permit Number 2287). Monitoring results for permit compliance are provided by GES to MCES in quarterly reports. Permit limits include up to 3 mg/L of any one toxic parameter and up to 10 mg/L of total toxic parameters.
5.2 OPERATION
The hydraulic performance of the upper outwash capture zone system in 2017 was evaluated by examining water level contours and by comparing actual pumping rates to the design criteria of 6 to 10 gallons per minute (gpm) total pumping. If LNAPL was present in a well, freshwater equivalent heads were calculated to evaluate the representative hydraulic head. Water level contours based on average water level elevations2 were generated from 18 monitoring wells and 2 pumping wells in the first and second quarters, and 12 monitoring wells and 2 pumping wells
2 Water levels in wells where LNAPL was detected were corrected to their freshwater equivalent assuming anaverage LNAPL density of 0.89 g/cm3.
Integral Consulting Inc. 5-1

2017 Site Remediation ReportFormer Ashland Lease Area May 21, 2018
in the third and fourth quarters.3 The potentiometric surfaces for the first, second, third, and fourth quarters of 2017 are shown in Figures 5-3 through 5-6, respectively.
Extraction rates and volumes withdrawn in 2017 from the pumping wells are provided in Table 5-3. During the period from the first quarter 2017 through the fourth quarter 2017, approximately 3.2 million gallons were extracted. For 2017, the average volume extracted per quarter was approximately 809,000 gal at an average rate during active pumping of 6.2 gpm (Table 5-3). The average rate of groundwater withdrawn during active operation of the outwash pumping wells in 2017 was 5.9 gpm in MW04-192-T and 0.6 gpm in MW05-02-T. A decrease in pumping in MW05-02-T has been observed over the past several years (Figure 5-7), due to ongoing maintenance issues and increased pumping in MW04-192-T for dual-phase extraction. Pumping in MW05-02-T temporarily ceased in February 2017 with approval from MPCA, so that extraction in MW04-192-T could be optimized, while maintaining system capture as designed. Downtime of the pumping system during the performance period (December 6, 2016, to December 7, 2017) totaled 21.4 days and included pump maintenance, GAC replacement, and leak detections.
5.3 RECOVERY
The VOC mass removed by the outwash pumping system is calculated using the water volume and VOC concentrations measured at the influent to the GAC system. Influent VOC concentrations have decreased from 130 mg/L at system start up to averaging less than 10 mg/L in 2017 (Figure 5-7). A running total of mass removal by the pump and treat system (Figure 5-8) was calculated as the sum of VOC concentrations measured using EPA Method 8260 in the influent to the system. As of November 2017, the outwash system has removed 2,938 lb of dissolved contaminants within approximately 35.6 million gallons of groundwater. From October 2016 through November 2017, approximately 274 lb of VOCs was removed at a rate of 0.76 lb/day. In addition, reductions in toluene and TCE concentrations in the pumping wells ranged between 84 and 100 percent in 2017 (Table 5-4), with the exception of two toluene measurements in MW04-192-T. Since the pump in MW04-192-T was raised to intersect the LNAPL/groundwater interface in 2014, increases in VOC concentrations in the groundwater monitoring samples have been observed.
VOC isoconcentration maps were created using data from upper outwash pumping and monitoring wells in and around the FALA. Surrounding hydroprofile data collected during site investigation from beyond the plume limits were also included to provide definition to the outer boundary of the plume. The VOC data set consisting of a sum of TEX and chlorinated ethenes and ethanes was kriged using Surfer™ version 11. A comparison of the VOC isoconcentration maps from pre-pumping conditions (average conditions from May 2006 to May 2007) to data from October 2017 provides evidence that the outwash pumping system is
3 Water levels in the two pumping wells were adjusted based on an assumed 70 percent well efficiency.
Integral Consulting Inc. 5-2

achieving its design objectives of reducing source mass and groundwater concentrations in the core of the plume (Figure 5-9).
2017 Site Remediation ReportFormer Ashland Lease Area May 21,2018
Integral Consulting Inc.

2017 Site Remediation ReportFormer Ashland Lease Area May 21,2018
6 ASSESSMENT OF FALA REMEDIATION ACTIVITIES
The remedial activities at the FALA continue to reduce the overall source mass present in the subsurface. A comparison of mass removal from the three active remedial systems indicates a total of 397 lb of source mass was removed in 2017, with 3.5 lb from the SVE system (0.9 percent), 119 lb from the LNAPL removal (30.0 percent), and 274 lb from the outwash pumping system (69.1 percent). The 2017 removal represents an 18 percent decrease compared to 2016 (483 lb total recovery). Overall, 2017 source mass removals represent approximately 4 percent of the total removal of nearly 11,900 lb since remedial activities began, with 99 percent of the 2017 removal attributable to the outwash pumping and integrated LNAPL removal. The data indicate the systems continue to recover source mass as designed, although many of the active remedial systems are reaching, or have reached, the limits of practical operation. Active bioremediation injections have already ceased. The suspension of bioremediation system injections in 2014 did not appear to adversely affect biodégradation, as evidenced by continued decreasing VOC trends.
Because of the low VOC recovery rates and inundation of the till SVE system by the rising water table, shutdown testing was initiated at the end of 2016 and completed in January 2017.Removal rates observed during the shutdown evaluation did not rebound above the average asymptotic removal rates in both the till and alluvium SVE systems. Integral recommended shutdown of the SVE system to be followed by confirmation testing. While waiting for approval from MPCA to shut down the till portion of the SVE system, it was determined that inundation of the till VEWs by rising groundwater made continued operation of the system impractical. MPCA was notified of the system flooding and shutdown plan via e-mail on November 20, 2017, and the shutdown was completed on December 6, 2017. Soil gas rebound testing on the east side of Central Avenue commenced in the first quarter of 2018 and a work plan for confirmation soil sampling was submitted to MPCA on April 24, 2018.
The outwash pumping system continued to steadily remove VOC mass in 2017. LNAPL recovery has been declining since 2012, and sampling of the LNAPL collected beneath the lacustrine clay indicates a reduction of TEX and cVOC concentrations compared to LNAPL samples collected prior to remediation. The break-out tank will continue to operate in 2018 to collect LNAPL and protect the GAC vessels. Passive oil absorbent socks were removed from all LNAPL wells in the fourth quarter of 2016 to allow for observation of LNAPL rebound in the wells screened near the water table above the lacustrine clay. LNAPL rebound beyond a sheen was observed only in wells MW-318 and MW10-03-T following well rehabilitation activities. Groundwater pumping in the upper outwash will continue in 2018 during confirmation testing of the SVE system and to facilitate LNAPL recovery.
Integral Consulting Inc. 6-1

2017 Site Remediation ReportFormer Ashland Lease Area May 21,2018
7 2018 OPERATIONS
Operations recommendations for 2018 are as follows:
• SVE System: Confirmation soil gas testing at T-VM-4S will be performed quarterly through 2018. A work plan for confirmation soil testing was submitted to MPCA on Month Day, 2018 and the work is planned to be performed in the summer of 2018.
• LNAPL Removal: Passive oil absorbent socks were removed from all wells in the fourth quarter of 2016 to allow for rebound monitoring, which will continue in 2018. Analysis of LNAPL collected by the break-out tank will continue on a semiannual basis to confirm that cVOCs are depleted in the LNAPL trapped beneath the lacustrine clay. Continued operation of the break-out tank will allow for protection of the GAC vessels while dual-phase extraction of LNAPL and groundwater is ongoing in MW04-192-T.
• Bioremediation: Continued monitoring is planned for 2018 following suspension of active injections in December 2014.
• Outwash Pumping: Discontinuation of pumping in MW05-02-T was implemented in February 2017, after receipt of MPCA approval in January 2017, and the pumping rate in MW04-192-T was increased after replacement of the pump in February. Hydraulic capture of the outwash pumping system will be continue to be evaluated by reviewing monthly extraction volumes, quarterly groundwater contour maps, and VOC trends from the site-wide monitoring program.
Integral Consulting Inc. 7-1

2017 Site Remediation ReportFormer Ashland Lease Area May 21,2018
8 REFERENCES
AMEC. 2015. Standard Operating Procedures Document, Canadian Pacific Railway, Shoreham Facility, Minneapolis, MN. AMEC Foster Wheeler Environment & Infrastructure, Inc., Minneapolis, MN. August.
AMEC. 2017. 2016 Annual Groundwater Monitoring Report. East Side Shoreham Facility, MPCA Superfund Program No. SR380 MPCA VIC Site No. 5080, Minneapolis, MN. AMEC Foster Wheeler Environment & Infrastructure, Inc., Minneapolis, MN. April.
AMEC. 2018. 2017 Annual Groundwater Monitoring Report. East Side Shoreham Facility, MPCA Superfund Program No. SR380 MPCA VIC Site No. 5080, Minneapolis, MN. AMEC Foster Wheeler Environment & Infrastructure, Inc., Minneapolis, MN. March.
Golder. 2005. Interim Response Action Plan for the Former Ashland/Rocket Lease Area, East Side Shoreham Facility. Volume 2, Appendix B: LNAPL Pilot Study Report. Golder Associates Inc., Cherry Hill, NJ. March.
Integral. 2010. Former Ashland Lease Area Till Groundwater Bioremediation, Phase III Pilot Test Report and Phase IV Design Document. East Side Shoreham Facility, VIC 5080, Minneapolis, MN. Integral Consulting Inc., Broomfield, CO. May 13.
Integral. 2015. 2014 Site Remediation Report, Former Ashland Lease Area, Soo Line Shoreham Yard (SF), Site ID SR380. Integral Consulting Inc., Louisville, CO. July 30.
Integral. 2016. 2015 Site Remediation Report, Former Ashland Lease Area, Soo Line Shoreham Yard (SF), Site ID SR380. Integral Consulting Inc., Louisville, CO. August 31.
MPCA. 2011. Petroleum Remediation Program. Air Emissions Screening Spreadsheet. Guidance Document 7-09b. Minnesota Pollution Control Agency. Updated April 2011.
MPCA. 2017. Interim ISV short guidance. February 13. Minnesota Pollution Control Agency, Minneapolis, MN.
Integral Consulting Inc. 8-1

F ig u r e s

N \G
IS\P
foje
clsi
C59
4 .A
shl.-
,ndA
vC_
AH
Pfo
dU
clio
n_
MX
Psa
01
2_
Site
_R
ep
orH
Flg
ur.e
_1
,1_
Fo
,me
r_A
shla
nd
_le
aSe
are
a.2
01
3032
1.m
xd
- 3/
21/2
013
3 15
:59
PM
SiteLocation
integral „ F t S 1 PVoBuiiiDjiiH. Map FeaturesI I Former Ashland Lease Area (FALA)
0 500 1,000 n i-----------1I_____ I Shoreham Property
Feet A

Map Features Figure 2-1.V Till, Vapor Monitoring Well □ FALA Boundary Location o f SVE V apor Extraction
W ells and M onito ring Poin ts at the ▼ Alluvium, Vapor Monitoring Weil * Fence F orm er A sh land Lease A rea
0 30 60 N © Till, SVE Well Gate
1----------- ^ 1 A • Alluvium, SVE Well SVE PiPe
VEW05-73
VEW05-75-T-3
I ✓«sNl 'IVEW05-76-T-4 \
VEW05-77-T-5
VEW04-186-A50N
VEW05-78-T-6VEW04-173-T-1
“ T-VM-4S,VT-VM-4
| VEW04-180-A40-E VE W04-179-T -30 N
VEW04J172-A
VEW05-79-T-7%\ ®e\
VEW05-80-T-8
1 SA^Tt.VM-6
m VEW05.-74-A-5w vkB I0 VEW05-81-T-9

VEW04-172-A
VEW04-186-A50N
Note: The alluvium SVE system was shut off on July 16, 2013. Quarterly screening was performed after this date by turning on the system for several hours Period of shut off indicated by hollow points
VEW04-180-A40-E
VEW05-73-A-4
Figure 2-2a.VOCs Measured at Individual Alluvium VEWs

VEW05-74-A-5
integral Note The alluvium SVE system was shut off on July 16, 2013 Quarterly screening was performed after this date by turning on the system for several hours. Period of shut off indicated by hollow points
Figure 2-2b.VOCs Measured at Individual Alluvium VEWs

Alluvium Main Manifold
Note The alluvium SVE system was shut off on July 16, 2013 Quarterly screening was performed after this date by turning on the system for several hours Period of shut off indicated by hollow points
Figure 2-3.VOCs Measured at the Alluvium Manifold

integral\ umolliiif k
Figure 2-4.Emission Rate from SVE Stack

T3O>OEa>a:</>V)n0)_ra3E3o
CM
oo
Note. The alluvium SVE system was shut off on July 16, 2013. Quarterly sampling was not performed after this date
Figure 2-5.Cumulative VOC and C 02 Mass Removal from SVE

lOMllnq IDI
Note The alluvium SVE system was shut off on July 16, 2013 Quarterly sampling was not performed after this date.
Figure 2-6.VOC Mass Removal Rate in SVE

lonyiltiiiq in.
Note: The alluvium SVE system was shut off on July 16. 2013 Quarterly sampling was not performed after this date
Figure 2-7.Total Concentration of VOCs in SVE

Till Manifold
Alluvium Manifold
integral\ «Mil»)Note: The alluvium SVE system was shut off on July 16, 2013. Quarterly sampling was not performed after this date.
Figure 2-8.Concentrations of Chlorinated and Non-chlorinated VOCs in SVE Manifolds

O MW04-187-T
MW04-188-T
MW04J189-T MW04-190-T
MW07-71-T
MW10-03-T
©MVV06
9 LNAPL monitoring wells
□ FALA Boundary
*-----* Fence
Gates
SVE pipes
integral\ c o n s u l t i n g ii
Figure 3-1.Location of LNAPL Monitoring and Recovery Wells around the Former Ashland Lease Area
MW-317
MW05-21-T
MW05-02-T
k MW-402S |t "9 MW-402DI IIJ MW04-191-TWI I 1MW04-192-T

A.100%
90%
80%
50%
40%
30%
20%
10%
0%
Petroleum Hydrocarbons by Method 8015C
MW-402D Break-Out-Tank-DrumAug-2004 Aug-2016
Break-Out-Tank-DrumDec-2016
Location & Date
MW04-192-TJan-2017
■ ■
S '■
aBreak-Out-Tank-Drum
Sep-2017
□DRO OGRO
B. VOCs by Method 8260
CD
O)E
o•4—•
c<uocoOOO>o
MW-402DAug-2004
Break-Out-Tank-DrumAug-2016
Break-Out-Tank-DrumDec-2016
Location & Date
fc— TEX o cVOCs
Break-Out-Tank-DrumSep-2017
Note: Low GRO and VOC concentrations observed in the August 2016 sample may be a result of these fractions partitioning into water present in the break-out drum
Figure 3-2.LNAPL Composition

90
(/>c_o
"ro3■O5oEa>KvEO>
■ Other Wells
■ MW-318
MW07-71 -T
■ MW05-21-T
■ MW04-192-T
■ MW-402D
2005 2006 2007 2008 2009 2010 2011 2012 2013 2014 2015 2016 2017
Year
integral\ ( o m u l u * q u t .
Figure 3-3.Yearly LNAPL Volumes Removed by Well

500
MW-318
■ MW07-71-T
■ MW05-21-T
■ MW04-192-T
■ MW-402D
Jan-05 Jan-06 Jan-07 Jan-08 Jan-09 Jan-10 Jan-11 Jan-12 Jan-13 Jan-14 Jan-15 Jan-16 Jan-17
Figure 3-4.Cumulative LNAPL Volume Removed by Active Methods through 2017

N:\G
IS\P
roie
cts\
C59
4 A
shla
ndA
ve
AI\P
rodu
cllo
n M
XD
s\20
12
Sile
Rep
orflF
iqur
c 4-
1 FA
LA
Site
M
ao
2Q
13
03
06
.mx
i^^
^M
l3
@ 4
01
45
PM
MW-401S
MW07-70-T
% IW07-72-TMW05-21
i H b « T T 73-7 • * / I °a^ M W-309 y f If H MW04-189-TMW04-188-T MW05-02-T
IW07-74-T: m ii i
: MW-402SMW07-7 f-T
A MW07-02-I
It JIW10-02-T
IÜW 10-03-T*MW04-192-T
MW06-257-I
MW06-258-I
Map Features
f t Injection Well
(D Monitoring Well
□ FALA BoundaryFeet
Fence
Gates
SVE pipes
Figure 4-1.Site Map Showing Network of Bioremediation Injection and Monitoring Wells

MW-401S
MW04-193-T
MW04-187-T MW-310
MW07-70-Ta IW07-7t2-T
MW05-21-T©b<$
■RW07-73-T
MW04-188-T
MW04-189-T .
MW04-190-T\ $ IW07-74-T \
MW07-71-T© f c 4y s
MW04-191-TMW07-02-I
MW04-192-T
IMW10-03-T
MW06-257-I IttK oMW04-23-T
MW06-248-I
25I
50 N-J A
Map Features
9 Injection Well
© Monitoring Well
Feet
Figure 4-2. ___, Initial FALA Till
Groand»a.er plume zones □ FALA Boundary Groundwater p|ume ZonesI | Source x * Fence
I | Intermediate Gates
| | Peripheral pipes

Tetrachloroethene ■ ■ Trichloroethene ■ ■ cis-1,2-Dichloroethene w s Viny! chloride Ethene
Note Figure 4-3Non-detect values show at full Concentrations of Chlorinated Ethenes in Peripheral Zonedetection limit as hollow symbols. W eHs MW 05-21-T, MW06-258-I, MW07-02-I, and MW-401S


Tetrachloroethene WÊÊ Trichloroethene cis-1,2-Dichloroethene
■ i Vinyl chloride ^ Ethene
Ethylbenzene Toluene Xylenes, Total
tombf iw
Note:Non-detect values show at full detection limit as hollow symbols
Figure 4-5Concentrations of Chlorinated Ethenes and TEX in Intermediate Zone Well MW 06-257-I


MW05-02-T
MW04-192-T
r i MW06-257-I
MW00-40-MS
MW06-248-I
nMW-400S
MW-401S
M W-3.10
MW04 190-T
MW04 191-T
MW-317
MW00-39-BR MW07-02Ì-I
MW06-258-I
MW05-1
MW-406D
MW-404D©
^MW05-05-BR©
MW05-06-I
^ MW05-06-BR
g f i t e r a l(ODMiliinq int.
60 120 n
_i______ i A
Map Features
9 Extraction Well
© Monitoring Well
Fence
Gates
SVE pipes
] FALA Boundary
Figure 5-1.Site Map Showing Location of Outwash Pumping and Monitoring Wells
Feet

MW-401S
MW-309MW05-02-T
MW04-192-T
t ^MW06-257-l
MW00-40-MS
nMW-400S
MW04
.MW-317
M WOO - 39-BF : r MW07-02?
MW06-258-I
MW05-1
29th Street
MW02-03-BR
MW-406D
MW-404D
.MW05-05-BR
MW05-06-I
1 MW05-06-BR
Map FeaturesI I FALA Boundary
x----- x Fence
Gates
SVE pipes
60l
120
Feet
Wells
O Upgradient
V Plume (Upper Outwash)
▼ Plume (Downgradient Outwash)
V Plume (Till/St. Peter Shallow, On-Site)
□ Peripheral Sentinal (Upper Outwash)
■ Peripheral Sentinal (Intermediate Outwash)
□ Peripheral Deep (On-Site)
■ Peripheral Sentinal (Deep Outwash)
Figure 5-2.Site Map Showing Monitoring Wells Grouped by Plume Location

N \G
IS\P
ro|e
cts\
C59
4 A
shla
ndA
ve
AKP
rodu
ctio
n M
XD
s\20
17
Site
R
epor
flOut
was
h W
ater
Lv
l Q1
20
17.m
ud
2/20
^201
8 1 0
:19
39 A
M
MW-404D824.83
MW05-02-T824.30
MW07-02-I
MW06-258-I824.53
MW05-05-BR824.86
MW06-824.46
MW02-03-I824.72
MW05-15-I824.48
Extraction Well
Monitoring Well
*— x- Fence
Gates
C = l FALA Boundary
1 ft Contour(Contours below 823 ft amsl not shown)
Data collected by AMEC on 3/14/2017 and 3/15/2017MW-406D824.42 MW05-06-I
824.73Pumping well MW04-192-T was on and MW05-02-T was off during measurement
Figure 5-3.Upper Outwash Water Level Contour Plot, 1 st Quarter 2017

N:\G
IS\P
roie
ds\C
594.
.Ash
land
Ave
A
I\Pro
ducl
ion
MX
Ds\
2017
Si
te R
epor
1\O
utw
ash
Wat
er
l_vl
Q2
2017
.mxd
10
725/
2017
10
:38
31
AM

N G
IS,P
roje
cts
C59
4 A
shhn
ilAve
A
KP
rort
uOon
M
XD
s\20
17
Site
R
epor
t O
ulw
asn
Wal
er
Lvl
03
20
17
rrad
2-'2
0/20
'8
102S
1
5A
M
h7$
W-309825.15
8 ^
^824.71
|8a4)W04-192-T508.95
W06-257-I24.92
1W06-248-I 25.04
♦\
\
MW05-15-824.95
♦
+ Extraction Well
-£• Monitoring Well
—* - Fence
Gates
FALA Boundary
1 ft Contour(Contours below 824 ft amsl not shown)
Data collected by AMEC on 8/10/2017 and 8/11/2017
Pumping well MW04-192-T was on and MW05-02-T was off during measurement
0 75 1 I i I I_
150i i l
Feet
/
/ /
/ /
/.#_=
/
(J____I L
) . h _ - -Lr— -
-02-T
MW07-02-I824.91
*
JinMW06-258-I824.95
♦
MW02-03-I824.48
4
MW-406D824.99
♦
MW-404D824.39
♦
h r
MW05-05-BR824.51
4
integral\ (oiHiiliin; int.
Figure 5-5.Upper Outwash Water Level Contour Plot, 3rd Quarter 2017

N QI
S P
;.-,e
cts'
C59
« A
s»la
nd£v
e A
J\P
roA
jCto
n M
XD
r. 3
017
Site
Rer
-rt
Out
wus
h W
Mtr
;_
vl 04
29
17
ntd
2/70
/201
8 10
26
SB
AM
(OiHuliinq ir.(
Figure 5-6.Upper Outwash Water Level Contour Plot, 4th Quarter 2017
MW05-15-I 825.2
♦
Data collected by AMEC on 10/5/2017.
Pumping well MW04-192-T was on and MW05-02-T was off during measurement
Extraction Well
Monitoring Well
Fence
Gates
FALA Boundary
1 ft Contour(Contours below 823 ft amsl not shown)
MW-401S 826.3
MW05-02-T825.1
191-T
192-T
MW07-02-I825.2
*
MW06-258-I825.3
♦
MW-825.'
*

<r>co" r eD)T50)C L
E3Q.0)E_3O>re3CC<
Figure 5-7.Total Concentration o f VOCs and Annual Volume Pumped, Outwash Pump and Treat System

■Oo>oECDa.:V)V)m<u>3J23E3O
</>co"rê"OCDQ.E3û.CD
E_3O>CD>3JS3E3O
in te la i Figure 5-8.Cumulative Mass and Volume Removed, Outwash Pump and Treat System

Baseline (Average May 2006 to May 2007) October 2017
184200
184100
184000
183900
— 183800-CJ)c !E t:Z 183700-I
183600
183500
183400
183300
MW-400S
• MW-404D
« MW-401S
MW-317* + SB03-29
/5W05-02-T
MW07-02-I
M W 0 6 -2 5 7 -I
• MW06-258-1MW05-05-BR
MW00-40-MS
MW06-248-I
MW05-15-I
MW05-15-BR
MW02-03-I«•
MW02-03-BR
• Hydroprofile
• Monitoring well
• Pumping wellMW05-06-IMW05-06-BR
535000 535200 535400
Easting (ft)
535600 535000 535200 535400
Easting (ft)
535600
Note VOC concentrations are a sum of TEX and cVOCs, tetrachloroethene. TCE, c/s-DCE, vinyl chloride, 1.1,1-trichloroethane. 1,1-dichloroethene, 1.1 -dichloroethane, and chloroethane
Figure 5-9.Plume Distribution in Upper Outwash, VOCs

T a b l e s

2027 Site Remediation Report
Former Ashland Lease Area May 21,2018
Table 2-1. Field Screening Results, Till SVE
Locations Date
Vacuum Pressure (in H20 )
Temperature(”F)
Flow
Rate3(SCFM)
PIDReading
(ppm)
CarbonDioxide(ppm)
LEL(%)
Oxygen(%)
3/27/2017 59 79 102 0 4,080 0 20.26/21/2017 60 84 83 0 2.420 0 19.9
i Main Mamto d ____ _ ___9/13/2017 60 88 90 0 6,770 0 19.612/6/2017 34 56 76 0.3 5,480 0 19.73/27/2017 68 78 34 0 2,710 0 20.36/21/2017 70 80 37 0 1.110 0.2 20.5
VEW 04-179-T-30N __ .9/13/2017 68 79 67 0 7,510 0 18.912/6/2017 40 58 51 0.1 5,180 0 19.53/27/2017 66 78 46 0 5,480 0 19.86/21/2017 68 85 35 0 5.730 0 19.4
VEWÜ4-1 73- 1 -1 . . . .9/13/2017 66 81 32 0 8,290 0 19.312/6/2017 37 61 52 0.1 5,670 0 19.83/27/2017 58 70 33 0 240 0 20.96/21/2017 60 77 32 0 200 0.3 20.9
VfcWOiWb- -3 . . . - ___9/13/2017 58 73 19 0 260 0 20.912/6/2017 32 54 26 0.1 490 0 20.53/27/2017 60 67 146 0 330 0 20.96/21/2017 62 76 30 0 290 0.1 20.9
V tW U iw o - -49/13/2017 67 72 40 0 430 0 20.912/6/2017 32 54 38 0.1 410 0 20.53/27/2017 64 72 35 0 180 0 20.96/21/2017 65 77 48 0 130 0.3 20.8
VfcW O b-//- -Ò . . . - ___9/13/2017 63 74 22 0 200 0 20.912/6/2017 36 55 44 0.3 210 0 20.63/27/2017 61 74 190 0 210 0 20.96/21/2017 62 78 31 0 130 0 20.8
V tW U b -/o - -b . . . . . ___9/13/2017 60 78 61 0 180 0 20.912/6/2017 33 56 28 0.1 320 0 20.53/27/2017 74 78 38 0 330 0 20.96/21/2017 74 81 126 0 640 0 20.9
V tW U b -/9 - - /9/13/2017 75 79 28 0 2,390 0 20.912/6/2017 40 59 40 0.3 580 0 20.63/27/2017 66 77 130 0 300 0 20.96/21/2017 68 79 32 0 1.270 0.1 20.9VhWUb-oU- -a9/13/2017 65 78 23 0 210 0 20.912/6/2017 35 56 29 0.3 150 0 20.73/27/2017 64 76 38 0 210 0 20.96/21/2017 63 78 51 0 410 0 20.9V tW U b -o l- -99/13/2017 64 77 28 0 240 0 20.912/6/2017 38 56 61 0.2 70 0 20.7
Notes:LEL = lower explosive limit SCFM = standard cubic feet per minutePID = photoionization detector SVE = soil vapor extractionppm = parts per million VEW = vapor extraction well
a Manifold air flow measurements are believed to be more accurate than the sum of individual VEW flows based on highly variable pitot tube readings and, therefore, are used to calculate all mass removal estimates.
Integral Consulting Inc. Page I o f 1

2017 Site Remediation Report
Former Ashland Lease Area May 21,2018
Table 2-2. Field Screening Results, Alluvium SVE
Vacuum Flow , PID CarbonPressure Temperature Rateb Reading Dioxide LEL Oxygen
Locations Date3 (in H20) (°F) (SCFM) (ppm) (ppm) (%) (%)3/27/2017 14 84 390 0 1,080 0 20.9
Alluvium Main 6/21/2017 13 96 469 ■0 3,600 0 20.2Manifold 9/13/2017 15 94 314 0.2 ,6,530 0 19.7
12/6/2017 17 ■ 64 359 0.3 3,640 0 20.13/27/2017 7 81 44 0 720 0 20.9
VEW04-172-A 6/21/20179/13/2017
78
8987
4342
00.4
5,3604,560
00
20.120.1
12/6/2017 6 61 45 0.3 2,010 0 20.43/27/2017 7 83 80 0 330 0 20.9
VEW04-180-A40-E 6/21/20179/13/2017
76
9592
7775
00
1,4603,080
00
20.920.1
12/6/2017 7 67 78 0.3 1,340 0 20.33/27/2017 7 79 128 0 2,390 0 20.4
VEW04-186-A50N 6/21/20179/13/2017
78
9288
119122
00.7
4.4408.440
00
20.119.5
12/6/2017 8 63 126 0.4 4,840 0 19.93/27/2017 8 83 104 0 5,240 0 19,7
VEW05-73-A-4 6/21/2017 8 94 97 0 13,100 0 18.69/13/2017 8 92 101 0.4 18,000 0 17.812/6/2017 10 68 117 0.4 13,000 0 18.63/27/2017 7 85 76 0 1,340 0 20.9
VEW05-74-A-5 6/21/2017 5 97 72 0 4,640 0.1 20.49/13/2017 7 95 74 0.4 13,000 0 19.012/6/2017 7 71 72 0.3 6,460 0 19.8
Notes:LEL = lower explosive limitPID = photoionization detectorppm = parts per millionSCFM = standard cubic feet per minuteSVE = soil vapor extractionVEW = vapor extraction well
a Indicates quarterly screening performed after the alluvium SVE system was turned off on July 16, 2013. The alluvium SVE system was turned on for several hours prior to screening.
b Manifold air flow measurements are believed to be more accurate than the sum of individual VEW flows based on highly variable pitot tube readings and, therefore, are used to calculate all mass removal estimates.
Integral Consulting Inc. Page 1 of1

2017 Site Remediation Report
Former Ashland lease Area May 21,
Table 2-3. Vacuum Levels Measured in Till and Alluvium SVE Monitoring Points
Till Monitoring PointsVacuum Pressure (in HzO)
Date T-VM-1 T-VM-2 T-VM-3 T-VM-4 T-VM-5 T-VM-6 T-VM-73/27/2017 0.55 0.00 0.50 0.00 0.00 0.00 0.196/21/2017 0.45 0.00 0.64 0.00 0.00 0.00 0.349/13/2017 0.40 0.00 0.43 0.00 0.00 0.00 0.2412/6/2017 0.50 0.00 0.45 0.00 0.00 0.00 0.30
Alluvium Monitoring PointsVacuum Pressure (in H20)
Date3 A-VM-1 A-VM-2 A-VM-3 A-VM-4 A-VM-5
3/27/2017 __b 0.55 0.00 0.55 0.006/21/2017 __b 0.55 0.00 0.34 0.009/13/2017 b 0.38 - 0.48 0.0012/6/2017 __b 0.47 0.00 0.35 0.00
Notes:SVE = soil vapor extraction — = not available
a Indicates quarterly screening performed after the alluvium SVE system was turned off on July 16, 2013. The alluvium SVE system was turned on for several hours prior to screening.
b Location removed.
Integral Consulting Inc. Page l o f i

2017 Site Remediation Report
Former Ashland Lease Area May 21,2018
Table 2-4. Water Levels Measured in Till Vapor Extraction Wells
Depth to Height of GroundwaterGroundwater Water Elevation
Locations Date {ft bgs) (ft) (ft amsl)VEW04-173-T-1 3/31/2017 27.0 0.1 827.4
6/29/2017 25.4 0.9 829.09/13/2017 25.9 0.4 828.512/6/2017 25.8 0.6 828.7
VEW04-179-T-3 ON 3/31/2017 27.3 2.5 827.66/29/2017 26.3 3.4 828.69/13/2017 27.0 2.6 827.812/6/2017 27.1. 2.6 827.7
VEW05-75-T-3 3/31/2017 27.0 7.9 828.86/29/2017 25.3 9.5 830.49/13/2017 26.5 8.4 829.212/6/2017 27.1 8.0 828.6
VEW05-76-T-4 3/31/2017 27.9 5.9 826.46/29/2017 26.7 7.1 827.79/13/2017 27.0 6.7 827.312/6/2017 27.5 6.2 826.9
VEW05-77-T-5 3/31/2017 28.4 6.9 827.26/29/2017 26.2 8.8 829.49/13/2017 27.8 7.3 827.812/6/2017 26.9 8.2 828.6
VEW05-78-T-6 3/31/2017 NA 0.0 NA6/29/2017 ~ — —
9/13/2017 — — —
12/6/2017 — — —
VEW05-79-T-7 3/31/2017 25.8 10.2 828.56/29/2017 23.8 12.0 830.59/13/2017 25.5 10.3 828.812/6/2017 26.2 9.7 828.2
VEW05-80-T-8 3/31/2017 27.3 5.1 828.26/29/2017 25.6 6.7 829.99/13/2017 27.1 5.2 828.412/6/2017 26.8 5.5 828.7
VEW05-81-T-9 3/31/2017 28.5 6.0 827.46/29/2017 25.7 8.7 830.29/13/2017 28.1 6.0 827.8
'12/6/2017 27.4 7.0 828.5
Notes:ft bgs = feet below ground surface ft amsl = feet above mean sea level NA = no water encountered - = not available
Integral Consulting Inc. Page l o f i
2017 Sit^miediation Report Former Ashland Lease Area May 21,2018
Table 2-5a. VOCs Measured (Method TO-15) in the Till Manifold
Till Manifold Concentration (uq/m3)Analyte 1/3/201T 1/4/2017a 1/6/2017a 1/10/2017a 1/17/2017a 1/18/2017a 1/20/2017a 1/24/2017a 3/31/2017 6/21/2017 9/13/2017 12/6/2017Freon 12 ND ND ND ND ND ND ND ND 4.5 ND ND NDFreon 114 ND ND ND ND ND ND ND ND ND ND ND NDChloromethane ND ND ND ND ND ND ND ND ND ND ND NDVinyl Chloride ND ND ND ND ND ND ND ND ND ND ND ND1,3-Butadiene ND ND ND ND ND ND ND ND ND ND ND NDBromomethane ND ND ND ND ND ND ND ND ND ND ND NDChloroethane ND ND ND ND ND ND ND ND ND ND ND NDFreon 11 ND ND ND ND ND ND ND ND ND ND ND NDEthanol ND ND 7.1 ND 18.0 8.9 20 ND ND 31 26 NDFreon 113 ND ND ND ND ND ND ND ND ND ND ND ND1,1-Dichloroethene ND ND ND ND ND ND ND ND ND ND ND NDAcetone ND ND 23 ND ND 30 47 ND ND 84 49 ND2-Propanol ND ND ND ND ND 8.8 19 ND ND ' ND ND NDCarbon Disulfide ND ND ND ND ND ND ND ND ND 13 ND ND3-Chloropropene ND ND ND ND ND ND ND ND ND ND ND NDMethylene Chloride ND ND ND ND ND ND ND ND ND ND ND NDMethyl tert-butyl ether ND ND ND ND ND ND ND ND ND ND ND NDtrans-1,2-Dichloroethene ND ND ND ND ND ND ND ND ND ND 6.6 NDHexane ND ND ND ND ND ND ND ND ND 3.7 ND ND1,1-Dichloroethane 3.7 ND ND ND 3.4 ND ND ND 3.7 4.7 13 5.92-Butanone (Methyl Ethyl Ketone) ND ND ND ND ND 11 18 ND ND 67 29 NDcis-1,2-Dichloroethene 13 3.2 3.5 5.3 10 5.2 5.9 4.9 10 12 48 22Tetrahydrofuran ND ND ND ND ND ND ND ND ND 4.3 ND NDChloroform ND ND ND ND ND ND ND ND ND ND ND ND1,1,1-Trichloroethane 120 29 26 27 95 34 33 24 95 98 330 170Cyclo hexane ND ND ND ND ND ND ND ND ND ND 6.4 NDCarbon Tetrachloride ND ND ND ND ND ND ND ND ND ND ND ND2,2,4-Trimethylpentane ND ND ND ND ND ND ND ND ND ND ND NDBenzene ND ND ND ND ND 3.3 ND ND ND 4.1 ND ND1,2-Dichloroethane ND ND ND ND ND ND ND ND ND ND ND NDHeptane ND ND ND ND ND ND ND ND ND 9.8 ND NDTrichloroethene 210 95 73 100 130 88 96 65 140 320 1400 5601,2-Dichloropropane ND ND ND ND ND ND ND ND ND ND ND ND1,4-Dioxane ND ND ND ND ND ND ND ND ND ND ND NDBromodichloromethane ND ND ND ND ND ND ND ND ND ND ND NDcis-1,3-Dichloropropene ND ND ND ND ND ND ND ND - ND ND ND ND4-methvl-2-pentanone ND ND ND ND ND ND ND ND ND ND ND ND
Integra! Consulting Inc. Page 1 o f 2

2017 Sii^mtediation Report Former Ashland Lease Area May 2 1 ,2018
Table 2-5a. VOCs Measured (Method TO-15) in the Till Manifold
AnalyteTill Manifold Concentration fug/m3)
1/3/201T 1/4/201T 1/6/201T 1/10/2017a 1/17/2017a 1/18/2017a 1/20/2017a 1/24/2017a 3/31/2017 6/21/2017 9/13/2017 12/6/2017Toluene ND ND 4 ND ND 5.9 ND ND ND 160 10 NDtrans-1,3-Dichloropropene ND ND ND ND ND ND ND ND ND ND ND ND1,1,2-Trichloroethane 11 5.4 4.7 8 7.4 7.1 14 8.7 ND ND 20 11Tetrachloroethene 120 50 45 63 78 58 76 55 54 150 680 3702-Hexanone ND ND ND ND ND ND ND ND ND ND ND NDDibromochloromethane ND ND ND ND ND ND ND ND ND ND ND ND1,2-Dibromoethane (EDB) ND ND ND ND ND ND ND ND ND ND ND NDChlorobenzene ND ND ND ND ND ND ND ND ND ND ND NDEthyl Benzene ND ND ND ND ND ND ND ND ND 55 4.6 NDm.p-Xylene ND ND ND ND ND 4.3 4.3 ND ND 150 18 NDo-Xylene ND ND ND ND ND ND ND ND ND 34 9 NDStyrene ND ND ND ND ND ND ND ND ND 3.7 ND NDBromoform ND ND' ND ND ND ND ND ND ND ND ND NDCumene ND ND ND ND ND ND ND ND ND ND ND ND1,1,2,2-Tetrachloroethane ND ND ND ND ND ND ND ND ND ND ND NDPropylbenzene ND ND ND ND ND ND ND ND ND 5.9 ND ND4-Ethyltoluene ND ND ND ND ND ND ND ND ND 28 9.5 ND1,3,5-Trimethylbenzene ND ND ND ND ND ND ND ND ND 9.2 5.8 ND1,2,4-Trimethylbenzene ND ND ND ND ND ND ND ND ND 28 16 ND1,3-Dichlorobenzene ND ND ND ND ND ND ND ND ND ND ND ND1,4-Dtchlorobenzene ND ND ND ND- ND ND ND ND ND ND ND NDalpha-Chlorotoluene ND ND ND ND ND ND ND ND ND ND ND ND1,2-Dichlorobenzene ND ND ND ND ND ND ND ND ND ND ND ND1,2,4-Trichlorobenzene ND ND ND ND ND ND ND ND ND ND ND NDHexachlorobutadiene ND ND ND ND ND ND ND ND ND ND ND ND
Chlorinated Organics 478 183 152 203 324 192 225 158 307 585 2,498 1,139Non-chlorinated Organics 0 0 35 0 18 72 108 0 0 691 183 0Total Organics 478 183 187 203 342 265 333 158 307 1,275 2,681 1,139
Notes:ND = analyte not detected VOC = volatile organic compounda Samples collected for the SVE system shutdown evaluation test.
Integral Consulting Inc. Page 2 o f 2

2017 Sutäemediation ReportFormer Ashland Lease Area May 21, 2018
Table 2-5b. VOCs Measured (Method TO-15) in the Alluvium Manifold
Alluvium Manifold Concentration (Mg/m3)
Analyte 1/3/2017a 1/4/2017a 1/6/2017a 1/10/2017a 1/17/2017a 1/18/2017a 1/20/2017a 1/24/2017aFreon 12 4.3 ND ND 4.6 ND ND ND 5.2Freon 114 ND ND ND ND ND ND ND NDChloromethane ND ND ND ND ND ND ND NDVinyl chloride ND ND ND ND ND ND ND ND1,3-Butadiene ND ND ND ND ND ND ND NDBromomethane ND ND ND ND ND ND ND NDChloroethane ND ND ND ND ND ND ND NDFreon 11 ND ND ND ND ND ND ND NDEthanol ND ND ND ND ND ND 19 NDFreon 113 ND ND ND ND ND ND ND ND1,1-Dichloroethene ND ND ND ND ND ND ND NDAcetone ND ND ND ND ND ND 20 ND2-Propanol ND ND ND 10 ND ND 8.9 NDCarbon disulfide ND ND ND ND ND ND ND ND3-Chloropropene ND ND ND ND ND ND ND NDMethylene chloride ND ND ND ND ND ND ND NDMethyl tert-butyl ether ND ND ND ND ND ND ND NDtrans-1,2-DichIoroethene ND ND ND ND ND ND ND NDHexane ND ND ND ND ND ND ND 3.11,1-DichIoroethane ND ND ND ND ND ND ND ND2-Butanone (Methyl Ethyl Ketone) ND ND 15 ND ND ND 10 NDcis-1,2-Dichloroethene 5.6 ND ND ND ND 5.1 ND 6.1Tetrahydrofuran ND ND ND ND ND ND 2.3 NDChloroform ND ND ND ND ND ND ND ND1,1,1-Trichloroethane 33 ND 7.3 13 15 24 6.6 21Cyciohexane ND ND ND ND ND ND ND NDCarbon tetrachloride ND ND ND ND ND ND ND ND2,2,4-T rimethylpentane ND ND ND ND ND ND ND ND
Integral Consulting Inc. Page 1 of 3

2017 Sî^lemediation ReportFormer Ashland Lease Area May 21, 2018
Table 2-5b. VOCs Measured (Method TO-15) in the Alluvium Manifold
AnalyteAlluvium Manifold Concentration (gg/m3)
1/3/2017a 1/4/2017a 1/6/2017a 1/10/2017a 1/17/2017a 1/18/2017a 1/20/2017a 1/24/2017aBenzene ND ND ND ND ND ND 3.8 ND1,2-DichIoroethane ND ND ND ND ND ND ND NDHeptane ND ND ND ND ND ND . ND NDTrichloroethene 170 34 42 80 70 140 37 1301,2-DichIoropropane ND ND ND ND ND ND ND ND1,4-Dioxane ND ND ND ND ND ND ND NDBromodichloromethane ND ND ND ND ND ND ND NDcis-1,3-Dichloropropene ND ND ND ND ND ND ND ND4-methyl-2-pentanone ND ND ND ND ND ND ND NDToluene ND ND ND ND ND ND ND NDtrans-1,3-Dichloropropene ND ND ND ND ND ND ND ND1,1,2-T richloroethane 7.6 ND ND 5.5 ND 6.7 ND 4.5Tetrachloroethene 88 30 32 46 45 77 26 622-Hexanone ND ND ND ND ND ND ND NDDibromoch loro methane ND ND ND ND ND ND ND ND1,2-Dibromoethane (EDB) ND ND ND ND ND ND ND NDChlorobenzene ND ND ND ND ND ND ND NDEthyl Benzene ND ND ND ND ND ND ND NDm,p-Xylene ND ND ND ND ND ND ND NDo-Xylene ND ND ND ND ND ND ND NDStyrene ND ND ND ND ND ND ND NDBromoform ND ND ND ND ND ND ND NDCumene ND ND ND ND ND ND ND ND1,1,2,2-Tetrachloroethane ND ND ND ND ND ND ND NDPropylbenzene ND ND ND ND ND ND ND ND4-Ethyltoluene ND ND ND ND ND ND ND ND1,3,5-Trimethylbenzene ND ND ND ND ND ND ND ND1,2,4-TrimethyIbenzene ND ND ND ND ND ND ND ND
Integral Consulting Inc. Page 2 of 3

2017 Sf^Remediation ReportFormer Ashland Lease Area May 21,2018
Table 2-5b. VOCs Measured (Method TO-15) in the Alluvium Manifold
AnalyteAlluvium Manifold Concentration (gg/m3)
1/3/2017a 1/4/2017a 1/6/2017a 1/10/2017a 1/17/2017a 1/18/2017a 1/20/2017a 1/24/2017a1,3-Dichlorobenzene ND ND ND ND ND ND ND ND1,4-Dichlorobenzene ND ND ND ND ND ND ND NDalpha-Chlorotoluene ND ND ND ND ND ND ND ND1,2-Dichlorobenzene ND ND ND ND ND ND ND ND1,2,4-T richlorobenzene ND ND ND ND ND ND ND NDHexachlorobutadiene ND ND ND ND ND ND ND ND
Chlorinated Organics 309 64 81 149 130 253 70 229Non-chlorinated Organics 0 0 15 10 0 0 64 3Total Organics 309 64 96 159 130 253 134 232
Notes:ND = analyte not detected VOC = volatile organic compound3 Samples collected for the SVE system shutdown evaluation test.
Integral Consulting Inc. Page 3 of 3

2017 Site Remediation Report
Former Ashland Lease Area May
Table 2-5c. VQCs Measured (Method TO-15) in the Carbon Vessel Exhaust (Stack)
Analyte
Stack Concentration (gg/m3)3/27/2017a 6/21/201T 9/13/201T 12/6/2017a
Freon 12 ND ND ND NDFreon 114 ND ND ND NDCh loro methane ND ND ND NDVinyl chloride ND ND ND ND1,3-Butadiene ND ND ND NDBromomethane ND ND ND NDChloroethane ND ND ND NDFreon 11 ND ND ND NDEthanol ND ND 12 NDFreon 113 ND ND ND ND1,1-DichIoroethene ND' ND ND NDAcetone ND ND 22 ND2-Propanol ND ND ND 9.5Carbon disulfide ND ND ND ND3-Chloropropene ND ND ND NDMethylene chloride ND ND ND NDMethyl tert-butyl ether ND ND ND NDtrans-1,2-Dichloroethene ND ND ND NDHexane ND ND ND ND1,1-Dichloroethane ND ND 4.3 ND2-Butanone (Methyl Ethyl Ketone) ND ND ND NDcis-1,2-Dichloroethene ND ND 9.8 4.7Tetrahydrofuran ND ND ND NDChloroform ND ND ND ND1,1T1 -Trichloroethane 18 30 95 40Cyclohexane ND ND ND NDCarbon tetrachloride ND ND ND ND2,2,4-T rimethylpentane ND ND ND NDBenzene 7.5 8.3 ND ND1,2-DichIoroethane ND ND ND NDHeptane ND ND ND NDTrichloroethene 40 67 260 1101,2-Dichloropropane ND ND ND ND1,4-Dioxane ND ND ND NDBromodichloromethane ND ND ND NDcis-1,3-Dichloropropene ND ND ND ND4-methyl-2-pentanone ND ND ND NDToluene 4.7 69 5.1 8.8trans-1,3-Dichloropropene ND ND ND ND1,1,2-TrichIoroethane ND ND ND NDTetrachloroethene 26 31 110 72
Integral Consulting Inc. Page 1 of 2

2017 Site Remediation Report
Former Ashland Lease Area May 21,
Table 2-5c. VOCs Measured (Method TO-15) in the Carbon Vessel Exhaust (Stack)
Analyte
Stack Concentration (fjg/m3)3/27/2017a 6/21/2017a 9/13/2017a 12/6/2017a
2-Hexanone ND ND ND NDDibromochloromethane ND ND ND ND1,2-Dibromoethane (EDB) ND ND ND NDCh loro benzene ND ND ND NDEthyl Benzene ND 23 ND NDm,p-Xylene ND 65 9.7 NDo-Xylene ND 14 4.6 NDStyrene ND ND ND NDBromoform ND ND ND ND 'Cumene 15 15 ND ND1,1,2,2-Tetrachloroethane ND ND ND NDPropylbenzene ND ND ND ND4-Ethyltoluene ND 13 5.2 ND1,3,5-T rimethylbenzene ND ND ND ND1,2,4-T rimethylbenzene ND 13 8.7 ND1,3-Dichlorobenzene ND ND ND ND1,4-Dichlorobenzene ND ND ND NDalpha-Chlorotoluene ND ND ND ND1,2-Dichlorobenzene ND ND ND ND1,2,4-Trich lorobenzene ND ND ND NDHexachlorobutadiene ND ND ND ND
Chlorinated Organics 84 128 479 227Non-chlorinated Organics 27 220 67 18Total Organics 111 348 546 245
Notes:ND = analyte not detected VOC = volatile organic compound
a Indicates quarterly sampling performed after the carbon filter was disconnected from the soil vapor extraction system on September 10, 2013.
Integral Consulting Inc. Page 2 of 2

Table 2-6a. Gas Composition (ASTM Method D-1945) Results for the Till Manifold
2017 Site Remediation Report
Former Ashland Lease Area
Analyte
Till Manifold Concentration (percent)
3/31/2017 6/21/2017 9/13/2017 12/6/2017
Oxygen 20 19 19 20Nitrogen 80 80 80 79Carbon Monoxide ND ND ND NDMethane 0.0017 0.0004 0.0046 0.0034Carbon Dioxide 0.45 0.68 0.97 0.92Ethane ND ND ND NDEthene ND ND ND NDAcetylene ND ND ND NDPropane ND ND ND NDIsobutane ND ND ND NDButane ND ND ND NDNeopentane ND ND ND NDIsopentane ND ND ND NDPentane ND ND ND NDC6+ ND ND ND NDHydrogen ND ND ND ND
Notes:ND = analyte not detected
May 21,2018
Integral Consulting Inc. Page l o f i

2017 Site Remediation Report
Former Ashland Lease Area
Table 2-6b. Gas Composition (ASTM Method D-1945) Results for the Carbon Vessel Exhaust (Stack)
Analyte
Stack Concentration (percent)3/27/201T 6/21/2017a 9/13/2017a 12/6/2017a
Oxygen 20 20 20 21Nitrogen 80 80 80 79Carbon Monoxide ND ND ND NDMethane 0.0004 0.0002 0.0007 0.0002Carbon Dioxide 0.12 0.11 0.18 0.12Ethane ND ND ND NDEthene ND ND ND NDAcetylene ND ND ND NDPropane ND ND ND NDIsobutane ND ND ND NDButane ND ND ND NDNeopentane ND ND ND NDIsopentane ND ND ND NDPentane ND ND ND NDC6+ ND ND ND NDHydrogen ND ND ND ND
Notes:ND = analyte not detected
a Indicates quarterly sampling performed after the carbon filter was disconnected from the soil vapor extraction system on September 10, 2013.
(
Integral Consulting Inc.
I/Page l o f i

2017 Site Remediation ReportFormer Ashland Lease Area
Table 2-7 SVE System Information and Monitoring ResultsParameter Location 1/3/201T 1/4/2017a 1/6/2017a 1/10/2017a 1/17/2017a 1/18/2017a 1/20/2017a 1/24/2017a 3/27/2017b 6/21/2017b 9/13/2017b 12/6/2017bOperational Information
Run Time (hr) Till Manifold 84,459 84,483 84,531 84,625 84,627 84,650 84,696 84,791 86,375 88,343 90,359 92,375Alluvium Manifold 58,769 58,793 58,841 58,935 58,937 58,960 59,006 59,101 59,107 59,112 59,115 59,120
Flow Rate Till Manifold 75 77 77 78 90 82 82 74 102 " 83 90 76(SCFM) Alluvium Manifold 430 436 436 441 431 453 453 475 390 469 314 359
Stack0 2,571 2,581 2,581 2,591 2,529 2,513 2,513 2,496 2,346 1,019 2,566 2,548Total VOC Till Manifold 478 183 187 203 342 265 333 158 307 1,275 2,681 1,139Concentrations Alluvium Manifold 309 64 96 159 130 253 134 232 _ _ _ _(|jg/rn3) Stack0 - - - - — -- — — 111 348 546 245
Mass RemovalMass Removal Till Manifold 0.0001 0.0001 0.0001 0.0001 0.0001 0.0001 0.0001 0.00004 0.0001 0.0004 0.0009 0.0003Rate (lb/hr) Alluvium Manifold 0.0005 0.0001 0.0002 0.0003 0.0002 0.0004 0.0002 0.0004 — — — —
Total 0.0006 0.0002 0.0002 0.0003 0.0003 0.0005 0.0003 0.0005 0.0001 0.0004 0.0009 0.0003Incremental Till Manifold 0.0003 0.0022 0.0025 0.0053 0.0002 0.0023 0.0042 0.0070 0.2 0.8 1.8 0.7Mass Removal Alluvium Manifold 0.0010 0.0072 0.0063 0.0197 0.0004 0.0075 0.0149 0.0304 — — — __(lb) Total 0.0013 0.0095 0.0088 0.0250 0.0007 0.0098 0.0191 0.0373 0.2 0.8 1.8 0.7Cumulative Mass Till Manifold 4,541 4,541 4,541 4,541 4,541 4,541 4,541 4,541 4,542 4,542 4,544 4,545Removal (lb) Alluvium Manifold 1,460 1,460 1,460 1,460 1,460 1,460 1,460 1,460 1,460 1,460 1,460 1,460
Total 6,001 6,001 6,001 6,001 6,001 6,001 6,002 6,002 6,002 6,003 6,004 6,005
Stack Emissions and Treatment Efficacy
Emission Rate Stack0 — — — — — — — 0.0010 0.0013 0.0053 0.0023Removal Stack0 -- - - - - — - -- - —
Notes:SCFM = standard cubic feet per minute VOC = volatile organic compoundSVE = soil vapor extraction - = not available
a Screening and mass removal during the SVE system shutdown evaluation initiated on December 14, 2016 and concluded on January 24, 2017. Flow rates were not recorded on January 4 and 6, 2017, and are averages of the January 3 and 10, 2017, values. Flow rates were also not recorded on January 18 and 20, 2017, and are averages of the January 17 and 24, 2017, values.
b Indicates quarterly screening performed after the alluvium SVE system was turned off on July 16, 2013. The alluvium SVE system was turned on for several hours prior to screening. Quarterly sampling was not performed after the alluvium SVE system was shut off.c Indicates quarterly sampling performed after the carbon filter was disconnected from the SVE system on September 10, 2013.
Integral Consulting Inc. Page l o f i

2017 Su^Kemediation ReportFormer Ashland Lease Area May 21,2018
Table 3-1. Summary of LNAPL Monitoring and Recovery
Volume Total VolumeTop of Bottom of Product Removed in Removed SinceScreen Screen Monitoring Detected 2017 Start Up
Well ID Litholoav (ft bqs) fft basì Freauencv in 2017 Product Recovery Method (gal) (gal) ___MW04-187-T Till ' 30.0 45.0 Quarterly Yesb Absorbent Socks 0.7M W04-188-Ta Till 25.0 45.0 Quarterly NoMW04-189-T Till 31.0 46.0 Quarterly NoMW04-190-T3 Sub-lacustrine 52.0 62.0 Quarterly NoMW04-191-T Sub-lacustrine 53.0 63.0 Quarterly NoM W04-192-T Sub-lacustrine 49.0 64.0 Monthly Yes Low Flow Pumping, Break Out Tank 19.0 382.3MW05-02-T Sub-lacustrine 51.4 66.4 Quarterly Yes Break Out TankMW05-21-T Till 28.0 38.0 Quarterly No Absorbent Socks, Bailing 2.6MW06-257-I Sub-lacustrine 53.5 63.5 Quarterly Yesb Absorbent Socks 0.2MW07-71-T Till 38.0 48.0 Quarterly0 No Absorbent Socks, Bailing 7.6MW10-03-T Till 35.0 45.0 Quarterly Yesb Absorbent Socks, Bailing 0.1MW-3173 Till 45.0 55.0 Quarterly NoMW-318 Till 40.0 50.0 Quarterly0 Yes Absorbent Socks, Bailing 0.1 7.0MW-319 Till 36.5 46.5 Quarterly NoMW-402D Sub-lacustrine 51.0 61.0 Quarterly0 No Absorbent Socks, Bailing 45.1MW-402S Till 37.0 47.0 Quarterly Yesb
TOTAL 19.1 445.6
Notes:ft bgs = feet below ground surface LNAPL = light, nonaqueous-phase liquid aWeII abandoned in June 2017.b Product was not detected by GES, but was detected by AMEC in 2017.c Wells continued to be monitored monthly through 2017, although the frequency was approved by MPCA to be changed to quarterly.
Integral Consulting Inc. Page l o f i

2017 S/rewHRûiftoB Report Former Ashland Lease Area
Table 3-2. Product Thickness Data for 15 Monitoring Wells
MW-3173I MW-319 MW-402Sb MW04-187-TbDepth to Depth to Product Depth to Depth to Product Depth to Depth to Product Depth to Depth to ProductProduct Water Thickness Product Water Thickness Product Water Thickness Product Water Thickness
Date (ft) (ft) . .(ft) (ft) (ft) (ft) (ft) (ft) (ft) (ft) (ft) (ft)3/20/2017 NA 29.49 0 NA 30.57 0 NA 31.11 0 NA 31.52 06/29/2017 - ~ - NA 29.95 0 NA 30.24 0 NA 30.96 09/12/2017 - - - NA 30.53 0 NA 30.53 0 NA 30.51 012/7/2017 - - - NA 29.99 0 NA 30,86 0 NA 31.06 0
MW04-188-Ta MW04-189-T MW04-190-T3 MW04-191-TDepth to Depth to Product Depth to Depth to Product Depth to Depth to Product Depth to Depth to ProductProduct Water Thickness Product Water Thickness Product Water Thickness Product Water Thickness
Date (ft) (ft) (ft) (ft) (ft) (ft) (ft) (ft) (ft) (ft) (ft) (ft)3/20/2017 NA 29.58 0 NA 34.10 0 NA 34.51 0 NA 33.62 06/29/2017 -- ~ - NA 30.59 0 — — NA 32.51 09/12/2017 - - - - — — — — — NA 33.45 012/7/2017 ™ - - NA 31.3 0 — — ~ NA 33.17 0
MW05-02-T MW05-21-T MW06-257-lbDepth to Depth to Product Depth to Depth to Product Depth to Depth to ProductProduct Water Thickness Product Water Thickness Product Water Thickness
Date (ft) (ft) (ft) (ft) (ft) (ft) .(ft) . (ft) (ft)3/20/2017 25.55 25.97 0,42 NA 29.64 0 NA 34.05 06/29/2017 29.22 29.27 0.05 NA 26.55 0 NA 33.70 09/12/2017 29.40 29.46 0.06 NA 26.64 0 NA 33.86 012/7/2017 29.30 29.34 0.04 NA 26.98 0 NA 33.89 0
MW-318 MW-402D MW07-71-T MW10-O3-TbDepth to Depth to Product Depth to Depth to Product Depth to Depth to Product Depth to Depth to ProductProduct Water Thickness Product Water Thickness Product Water Thickness Product Water Thickness
Date (ft) (ft) (ft) (ft) (ft) (ft) (ft) (ft) (ft) (ft) (ft) (ft)1/26/2017 NA 30.93 0 NA 32.30 0 NA 32.39 02/14/2017 NA 30.70 0 NA 32.00 0 NA 32.20 0 _ _ __
3/20/2017 NA 30.95 0 NA 32.70 0 NA 32.30 0 NA 31.71 04/3/2017 NA 31.01 0 NA 31.50 0 NA 32.31 0 _ „ —
5/4/2017 31.00 31.10 0.10 NA 32.70 0 NA 32.75 06/29/2017 30.41 30.46 0.05 NA 31.75 0 NA 31.53 0 NA 30.79 07/26/2017 30.65 30.75 0.10 NA 32.53 0 NA 32.95 0 NA 30.05 08/16/2017 30.50 30.51 0.01 - — — NA 32.09 0 NA 31.35 08/31/2017 30.55 30.66 0.11 NA 32.54 0 NA 32.24 0 _ __ __
9/5/2017 30.37 30.46 0.09 - - — NA 31.99 0 NA 31.26 09/12/2017 30.26 30.40 0.14 NA 32.51 0 NA 31.93 0 NA 31.15 010/4/2017 30.44 30.51 0.07 NA 32.33 0 NA 32.25 0 NA 31.50 011/1/2017 30.00 30.10 0.10 NA 31.76 0 NA 31.74 0 NA 30.93 012/7/2017 30.56 30.61 0.05 NA 32.28 0 NA 32.24 0 NA 31.59 0
Notes:Depth measurements are feet below top of casing.- = not availableNA = no product encountereda Well abandoned in June 2017.b Product was not detected by GES, but was detected by AMEC in 2017.
Integral Consulting Inc. Page l o f i

2017 Site Remediation Report
Former Ashland Lease Area May 21, 2018
Table 3-3. Product Thickness and Volume Removed from MW04-192-T
DateDTP(ft)
DTW(ft)
ProductThickness
(ft)
VolumeRemoved(gallons)
Cumulative Volume Removed
(gallons)3
1/6/2017 NM NM NM 4.25 367.59
1/26/2017 33.30 34.12 0.82 0.28 367.87
2/14/2017 33.20 33.20 0.00 0.57 368.44
3/20/2017 50.95 57.10 6.15 NM 368.44
4/3/2017 33.35 35.10 1.75 0.00 368.44
4/25/2017 NM NM NM 0.00 368.44
4/27/2017 NM NM NM 0.13 368.57
5/4/2017 51.65 57.00 5.35 0.48 369.05
5/25/2017 NM NM NM 1.34 370.40
6/6/2017 51.05 56.37 5.32 0.78 371.18
6/12/2017 NM NM NM 0.39 371.57
6/26/2017 NM NM NM 0.91 372.49
7/6/2017 NM NM NM 0.65 373.14
7/26/2017 50.07 51.11 1.04 1.31 374.45
8/16/2017 31.37 31.37 0.00 1.37 375.82
8/31/2017 54.74 56.96 2.22 NM 375.82
9/5/2017 55.20 56.91 1.71 NM 375.82
9/12/2017 55.90 57.04 1.14 NM 375.82
9/13/2017 NM NM NM 1.83 377.65
9/18/2017 NM NM NM 0.33 377.97
10/4/2017 55.74 56.99 1.25 1.05 379.02
10/19/2017 NM NM NM 0.98 380.00
11/1/2017 53.91 56.49 2.58 0.85 380.8511/6/2017 NM NM NM 0.33 381.18
12/7/2017 49.65 56.84 7.19 1.13 382.31
Notes:DTP = depth to product DTW = depth to water NM = not measured
a Recovery began in February 2008.
Integral Consulting Inc. Page 1 of 1

2017 Sïttiemediation ReportFormer Ashland Lease Area May 21, 2018
Table 3-4. Summary of LNAPL Monitoring 2006 through 2017
Maximum Product Thickness Reported (ft), by YearWell ID 2006 2007 2008 2009 2010 2011 2012 2013 2014 2015 2016 2017
MW04-187-T 0.15 0.06 0.01 0.01 0.01 0 0 0 0 0 0 0.01MW04-188-T 0 0 0 0 0 0 0 0 0 0 0 0MW04-189-T 0 ‘ 0 ' 0 0 0 0 0 0 0 0 0 0MW04-190-T 0 0 0 0.01 0 0 0 0 0 0 0 0MW04-191-T 0 0 0 0.01 0 0 0 0 0 0 0 0MW04-192-T 0 0 7.95 6.43 12.80 5.23 16.10 16.40 17.90 5.80 9.35 7.19MW05-02-T 0 0 0.17 0 0 0.10 1.04 0.40 0.13 0.15 0.15 0.42MW05-21-T 0.05 1.23 0.04 1.17 0.48 0.48 0 0 0 0 ■ 0 0MW06-257-I n/a 0,46 0.08 0.07 0.01 0 0 0.03 0 0 0 0.01MW07-71-T n/a n/a 0 4.04 0.43 1.41 0.44 0.39 0.08 0 0 0MW10-03-T n/a n/a n/a n/a 0 0.38 0.50 0.22 0.10 0.02 0 0.63MW-317 0 0 0 0.01 0 0 0 0 0 0 0 0MW-318 0.13 0.01 0.07 0.24 0.03 0.41 1.20 1.11 0.61 0.70 0 0.14MW-319 0 0 0 0 0 0 0 0 0.04 0.27 0.01 0MW-402D3 NET NET NET 12.96 2 2.42 1.32 0 0 0 0 0MW-402S 0 0 0 0 0 0 0 0 0 0 0 0.01RW07-73-Tb n/a 0.05 0.05 0.02 0 n/a n/a n/a n/a n/a n/a n/a
Notes:
LNAPL = light, nonaqueous-phase liquid
n/a = no data available
Maximum thickness measured by Ashland or Canadian Pacific consultants. aThe NET system was decommissioned in April 2008 due to low product amounts.
b RW07-73-T was converted to an injection well in 2010; no further access is available for LNAPL monitoring.
Integral Consulting Inc. Page l o f i

A2017 SNJKhnediation ReportFormer Ashland Lease Area May 21,2018
Table 3-5. LNAPL Hydrocarbon ConcentrationsMW-402D MW04-192-T BREAK-OUT-TANK-DRUM
Date 8/18/2004 1/26/2017 » 9/13/2017Laboratory TRIMATRIX PACE PACE
Method 8015B 8015C 8015CSample Type N C'-U”) N ("-M") N ("-D") N FD N FD
Analyte Concentrations (mg/kg)DRO 460,000 J 470,000 J 550,000 J 561,000 654,000 770,000 756,000GRO 740,000 J 630,000 J 620,000 J 233,000 149,000 J 62,400 63,300
Notes:DRO = diesel-range organics FD = field duplicate sample GRO = gasoline-range organics LNAPL = light, nonaqueous-phase liquid N = normal investigative sampleN ("-U") = normal investigative sample collected from the upper portion of LNAPL column N ("-M") = normal investigative sample collected from the middle portion of LNAPL column N ("-D") = normal investigative sample collected from the lower portion of LNAPL column PACEW = Pace Analytical Services, Inc., Minneapolis, MN
J = The associated numerical value is an estimated quantity.
Integral Consulting Inc. Page l o f i

2017 S^femediation ReportFormer Ashland Lease Area May 21, 2018
Table 3-6. LNAPL VOC Concentrations
Date Laboratory
Method Sample Type N ("-U")
MW-402D8/18/2004
TRIMATRIX8260B
N ("-M") N ("-D")
MW04-192-T 1/26/2017
PACE 8260B
N FD
BREAK-OUT-TANK-DRUM 9/13/2017
PACE 8260B
N FDAnalyte Concentrations (mg/kg)
1,1,1,2-T etrachloroethane 100 U 100 U 100 U 20 U 24 U 7 (7J 7 UJ1,1,1-Trichloroethane 3,200 J 3,100 J 2,600 J 211 215 6 UJ 6 UJ1,1,2,2-Tetrachloroethane 100 U 100 U 100 U 20 U 24 U 11 (7J 11 UJ1,1,2-Trichloroethane 67 J 77 J 67 J 20 U 24 L7 7 UJ 7 UJ1,1,2-T richlorotrifluoroethane — — — 78 U 97 (7 13 U 13 U1,1-Dichloroethane 500 J 470 J 420 J 20 U 33 7 U 6 U1,1-Dichloroethene 51 J 43 J 34 J 20 U 24 U 11 U 11 U1,1-Dichloropropene - - — 20 U 24 U 7 UJ 7 UJ1,2,3-T richlorobenzene — - — 20 U 24 U 6 U 6 U1,2,3-Trlchloropropane 100 u 100 u 100 u 78 U 97 U 20 UJ 20 UJ1,2,4-T richlorobenzene — — — 20 U 24 U 7 UJ 7 UJ1,2,4-T rimethylbenzene - — — 5,910 6,670 3,550 3,9701,2-Dibromo-3-chloropropane 100 u 100 u 100 u 195 U 243 U 44 UJ 43 UJ1,2-Dichlorobenzene — — — 20 U 24 U 5 UJ 5 UJ1,2-Dichloroethane 100 u 100 u 100 u 20 U 24 U 9 UJ 9 UJ1,2-Dichloropropane 100 u 100 u 10 0 u 20 U 24 U 9 UJ 9 UJ1,3,5-T rimethylbenzene - - - 1,980 2,090 1,280 1,4501,3-Dichlorobenzene — — — 20 U 24 U 9 UJ 8 UJ1,3-Dichloropropane - — — 20 ¿7 24 U 9 UJ 9 UJ1,4-Dichlorobenzene — — — 20 U 24 U 9 U 9 ¿72,2-Dichloropropane “ — “ 78 U 97 U 25 UJ 25 UJ2-Butanone (MEK) 500 U 500 U 500 U 98 U 121 U 45 U 44 U2-Chlorotoluene — — — 20 U 24 U 8 U 8 U4-Chlorotoluene — — — 20 (7 24 U 6 UJ 6 UJ4-Methyl-2-pentanone (MIBK) 820 J 630 J 600 J 98 U 121 U 33 UJ 33 UJAcetone 1,500 U 1,500 U 1,500 U 391 U 485 U 242 U 240 UAllyl chloride 500 U 500 U 500 1/ 78 U 97 U 23 UJ 23 UJBenzene 160 J 150 J 130 J 20 20 4 UJ 4 UJ
Integral Consulting Inc. Page 1 of 3

2017 ^ÊKemediation ReportFormer Ashland Lease Area May 21, 2018
Table 3-6. LNAPL VOC Concentrations
Date Laboratory
Method Sample Type
AnalyteN C'-U")
MW-402D 8/18/2004
TRIMATRIX 8260B
N ("-M") N ("-D")
MW04-192-T 1/26/2017
PACE 8260B
N FD
BREAK-OUT-TANK-DRUM 9/13/2017
PACE 8260B
N FDConcentrations (mg/kg)
Bromobenzene — — — 20 U 24 U 7 U 7 UBromochloromethane — — — 20 U 24 U 12 UJ 12 UJBromodichloromethane 100 u 100 u 100 u 20 U 24 U 9 UJ 9 UJBromoform 100 u 100 u 100 u 78 U 97 U 18 UJ 18 UJBromomethane 100 u 100 u 100 u 195 U 243 U 27 U 26 UCarbon tetrachloride 100 u 100 u 100 u 20 U 24 U 10 UJ 10 UJChlorobenzene 100 u 100 u 100 u 20 U 24 U 7 UJ 1 UJChloroethane 100 u 100 u 100 u 195 UJ 243 UJ 38 UJ 38 UJChloroform 100 u 100 u 100 u 20 U 24 U 10 UJ 10 UJChloromethane 100 u 100 u 100 u 78 U 97 U 16 UJ 16 UJcis-1,2-Dichloroethene 1,900 J 1,900 J 1,800 J 480 493 8 J 10 Jcis-1,3-Dichloropropene 100 u 100 u 100 u 20 U 24 U 8 UJ 8 UJDibromochloromethane 100 u 100 u 100 u 78 U 97 U 25 UJ 25 UJDibromomethane 100 u 100 u 100 u 20 U 24 U 8 UJ 8 UJDichlorodifluoromethane — — — 78 U 97 U 39 UJ 39 UJDichlorofluoromethane 100 u 100 u 100 u 195 U 243 U 23 U 23 UDiethyl ether (Ethyl ether) — — — 78 U 97 U 21 UJ 21 UJEthylbenzene 29,000 J 44,000 J 40,000 J 11,800 12,900 2,970 3,200Hexachloro-1,3-butadiene — — — 98 U 121 U 26 UJ 26 UJIsopropylbenzene (Cumene) — - — 543 564 310 J 339 JMethylene Chloride 360 'J 340 J 330 J 78 U 97 U 13 J 16 JMethyl-tert-butyl ether - — — 20 U 24 U 8 UJ 8 UJNaphthalene - - — 1,850 1,830 1,310 1,500n-Butylbenzene - - - 362 447 309 J 332 Jn-Propylbenzene — — — 1,210 1,290 712 J 804 Jp-lsopropyltoluene - - — 306 370 208 J 227 Jsec-Butylbenzene — - — 324 369 265 293Styrene 1,400 J 1,200 J 1,200 J 1,430 1,470 415 464
Integral Consulting Inc. Page 2 of 3

2017 mediation ReportFormer Ashland Lease Area May 21, 2018
Table 3-6. LNAPL VOC ConcentrationsMW-402D MW04-192-T BREAK-OUT-TANK-DRUM
Date 8/18/2004 1/26/2017 9/13/2017Laboratory TRIMATRIX PACE PACE
Method 8260B 8260B 8260BSample Type N C-U") N ("-M") N ("-D") N FD N FD
Analyte Concentrations (mg/kg)
tert-Butyl benzene - - — — 20 U 24 U 21 J 23 JTetrachloroethene 6,700 J 6,700 J 5,500 J 189 194 26 J 26 JTetrahydrofuranToluene 140,000 J 190,000 J 170,000 J
781 U 971 U 33,200 36,400
260 U 257 U 1,560 J 1,710 J
trans-1,2-Dichloroethene 100 U 100 U 100 U 20 U 24 U 10 UJ 10 UJtrans-1,3-Dichloropropene 100 U 100 U 100 U 78 U 97 U 18 UJ 18 UJTrichloroethene 15,000 J 21,000 J 18,000 J 20 U 24 U 4 U 4 UT rich I orofluoro methane 100 U 100 U 100 U 78 UJ 97 UJ 37 U 37 UVinyl chloride 100 U 100 U 100 U 8 U 10 U 4 UJ 4 UJXylenes, Total 120,000 J 170,000 J 160,000 J 36,400 39,900 11,200 12,100
Notes:FD = field duplicate sampleLNAPL = light, nonaqueous-phase liquidN = normal investigative sampleN ("-U") = normal investigative sample collected from the upper portion of LNAPL column N ("-M") = normal investigative sample collected from the middle portion of LNAPL column N ("-D") = normal investigative sample collected from the lower portion of LNAPL column PACEW = Pace Analytical Services, Inc., Minneapolis, MN VOC = volatile organic compound
J = The associated numerical value is an estimated quantity.U = The material was analyzed for, but was not detected. The associated numerical value is the sample quantitation limit.
Integral Consulting Inc. Page 3 of 3
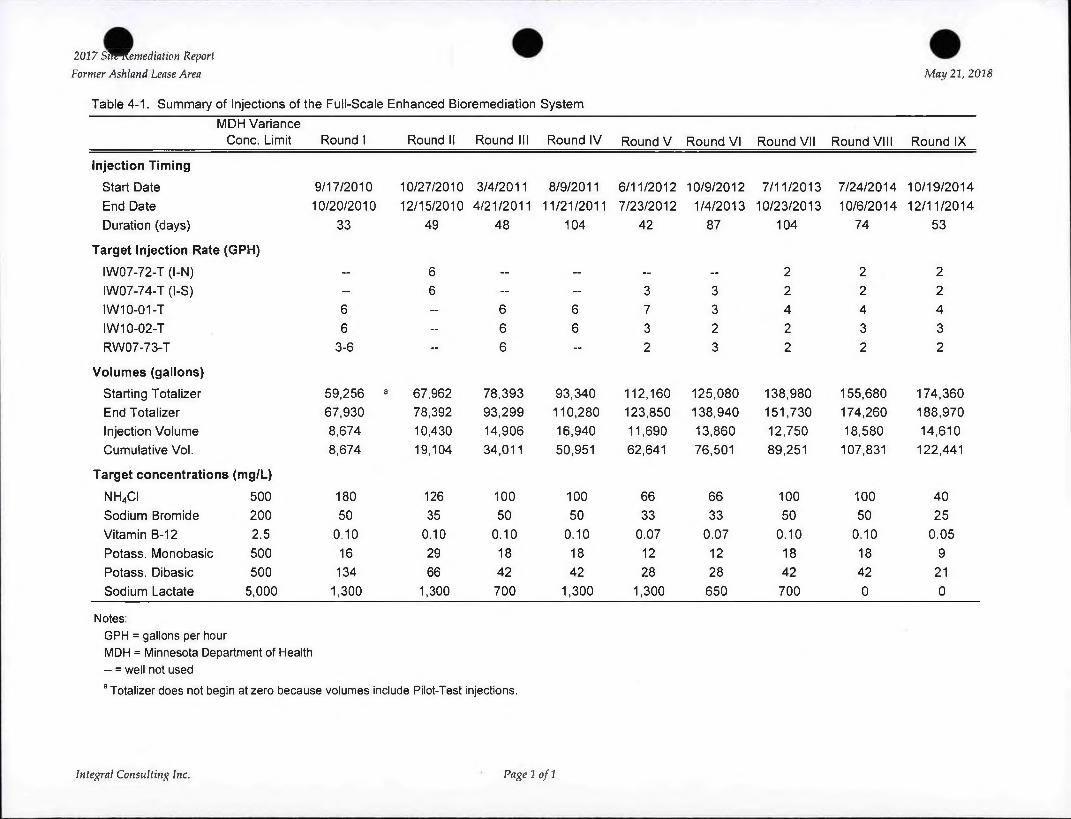
2017 Sîi^Wemediation ReportFormer Ashland Lease Area Map 21, 2018
Table 4-1. Summary of Injections of the Full-Scale Enhanced Bioremediation SystemMDH Variance
Cone. Limit Round I Round II Round III Round IV Round V Round VI Round VII Round VIII Round IX
Injection Timing
Start Date 9/17/2010 10/27/2010 3/4/2011 8/9/2011 6/11/2012 10/9/2012 7/11/2013 7/24/2014 10/19/2014End Date 10/20/2010 12/15/2010 4/21/2011 11/21/2011 7/23/2012 1/4/2013 10/23/2013 10/6/2014 12/11/2014Duration (days) 33 49 48 104 42 87 104 74 53
Target Injection Rate (GPH)IW07-72-T (l-N) - 6 - - ~ - 2 2 2IW07-74-T (l-S) -- 6 - - 3 3 2 2 2IW10-01-T 6 - 6 6 7 3 4 4 4IW10-02-T 6 - 6 6 3 2 2 3 3RW07-73-T 3-6 -- 6 - 2 3 2 2 2
Volumes (gallons)Starting Totalizer 59,256 a 67,962 78,393 93,340 112,160 125,080 138,980 155,680 174,360End Totalizer 67,930 78,392 93,299 110,280 123,850 138,940 151,730 174,260 188,970Injection Volume 8,674 10,430 14,906 16,940 11,690 13,860 12,750 18,580 14,610Cumulative Vol. 8,674 19,104 34,011 50,951 62,641 76,501 89,251 107,831 122,441
Target concentrations (mg/L)
NH4CI 500 180 126 100 100 66 66 100 100 40Sodium Bromide 200 50 35 50 50 33 33 50 50 25Vitamin B-12 2.5 0.10 0.10 0.10 0.10 0.07 0.07 0.10 0.10 0.05Potass. Monobasic 500 16 29 18 18 12 12 18 18 9Potass. Dibasic 500 134 66 42 42 28 28 42 42 21Sodium Lactate 5,000 1,300 1,300 700 1,300 1,300 650 700 0 0
Notes:GPH = gallons per hourMDH = Minnesota Department of Health- = well not used
a Totalizer does not begin at zero because volumes include Pilot-Test injections.
Integral Consulting Inc. Page 1 o f 1

2017 Site Remediation ReportFormer Ashland Lease Area May 21,
Table 4-2a, Summary of 2017 Monitoring of the Enhanced Bioremediation System
Well VOCs MNA Bromide qPCR Testing
Injection Wells (5)IW07-72-T NS NS NS NSIW07-74-T NS NS NS NSIW10-01-T NS NS NS NSIW10-02-T NS NS NS NSRW07-73-T NS NS NS NS
Monitoring Wells (15)MW04-189-T Qtrs 2 & 4 Qtrs 2 & 4 Qtrs 2 & 4 NS
MW04-192-T3 Qtrs 1,2,3 & 4 Qtrs 2 & 4 Qtrs 2 & 4 NS
MW05-02-T3 Qtrs 1,2,3 & 4 Qtrs 2 & 4 Qtrs 2 & 4 NSMW05-21-T Qtrs 2 & 4 Qtrs 2 & 4 Qtrs 2 & 4 NS
MW06-257-lb Qtrs 2 & 4 NS NS NSMW06-258-I Qtrs 2 & 4 Qtrs 2 & 4 Qtrs 2 & 4 NSMW07-02-I Qtrs 2 & 4 Qtrs 2 & 4 Qtrs 2 & 4 NSMW07-70-T Qtrs 2 & 4 Qtrs 2 & 4 Qtrs 2 & 4 NSMW07-71-T Qtrs 2,3 & 4 Qtrs 2 & 4 Qtrs 2 & 4 NSMW10-03-T Qtrs 2,3 & 4 Qtrs 2 & 4 Qtrs 2 & 4 NSMW-309 Qtrs 2,3 & 4 Qtrs 2 & 4 Qtrs 2 & 4 NSMW-318 Qtrs 2,3 & 4 Qtrs 2 & 4 Qtrs 2 & 4 NSMW-319 Qtrs 2 & 4 Qtrs 2 & 4 Qtrs 2 & 4 NSMW-401S Qtrs 2 & 4 Qtrs 2 & 4 Qtrs 2 & 4 NSMW-402S Qtrs 2 & 4 Qtrs 2 & 4 Qtrs 2 & 4 NS
Notes:MNA = monitored natural attenuation NS = well not sampledqPCR = quantitative polymerase chain reactionVFA = volatile fatty acidVOC = volatile organic compounda Wells MW04-192-T and MW05-02-T are sampled as part of the pump and treat system but have been included in the bioremedation analysis.b MW06-257-I is not typically considered part of the bioremediation monitoring network.
Integral Consulting Inc. Page l o f i

2017 Site Remediation ReportFormer Ashland Lease Area
Table 4-2b. Summary of 2017 Monitored Natural Attenuation Parameters
Parameter Lab Method
FieldConductivity - MeterDissolved Oxygen - MeterOxidation Reduction Potential — MeterIron (II) — HACHIron, Total — HACHManganese (11) - HACHpH - MeterTemperature — Meter
LaboratoryAlkalinity PACE SM 2320BAmmonia PACE EPA 350.1Bromide PACE EPA 300.0Carbon Dioxide Vaportech A2.01Chloride PACE EPA 300.0Ethane PACE EPA 8015BEthene PACE EPA 8015BMethane PACE EPA 8015BNitrate PACE EPA 300.0Nitrite PACE EPA 300.0Phosphorus PACE EPA 365.4Sodium PACE EPA 6010Sulfate PACE EPA 300.0Sulfide PACE SM 4500-STotal Organic Carbon PACE SM 5310C
Notes:- = not applicable
Integral Consulting Inc. Page 1 of 1

2017 Site Remediation ReportFormer Ashland Lease Area May 21, 2018
Table 4-3. Summary of Well Rehabilitation Slug Testing
Hydraulic Conductivity (cm/s)Screen Pre-Well Post-WellInterval Historical Rehabilitation Rehabilitation
Well Lithology Sep-2004 Jul-2017 Aug-2017MW07-71-T Till NA 3.00E-06 1.21E-05MW10-03-T Till NA 3.49E-05 3.60E-05MW-309 St. Peter Sandstone/Till 5.92E-04 8.07E-04 1.57E-03MW-318 Till 3.30E-05 1.78E-05 8.60E-05
Notes:Histocial and 2017 hydraulic conductivities calculated using the Bouwer and Rice method. Historical values are rising head tests from the LNAPL pilot test (Golder 2005).2017 well rehabilitation values are falling head tests.NA = not available
Integral Consulting Inc. Page l o f i

2017 St^\emediation ReportFortner Ashland Lease Area May 21, 2018
Table 5-1. Outwash Monitoring and Pumping Well Network
Well Name Easting Northing
Top of Casing (ft amsl)
Ground Elevation (ft amsl)
Screen Elevation (ft amsl)
Stratiqraphic Unit Screened
Monitoring Frequency
Top Bottom Chemistry Head
Plume (Upper Outwash)MW04-190-T 535097.1 183829.1 858.0 855.4 803.4 793.4 Outwash SAa QaMW04-191-T 535107.4 183802.5 857.7 855.1 802.1 792.1 Outwash SA QMW04-192-T 535106.8 183784.1 858.2 855.2 806.2 791.2 Till, Outwash Qb MMW05-02-T 535160.5 183838.5 854.2 854.7 803.3 788.3 Till, Outwash Qb QMW06-257-I 535100.0 183737.3 858.8 856.1 802.6 792.6 Outwash SA QMW06-258-I 535214.5 183691.3 855.5 852.9 787.9 777.9 Outwash SA QMW07-02-I 535214.2 183798.5 854.8 853.2 797.2 787.2 Till, Outwash SA QMW-317 535225.7 183907.5 854.0 854.0 809.0 799.0 Till-silt SAa Qa
Plume (Downgradient Outwash)MW02-03-BR 535377.5 183574.1 854.7 855.2 690.2 670.2 Outwash, St. Peter MS SA QMW02-03-I 535370.4 183574.0 854.7 855.2 756.2 746.2 Outwash SA QMW05-15-I 535225.1 183547.3 856.4 854.4 779.4 769.4 Outwash SA Q
Plume (Till/St. Peter Shallow, Onsite)MW-309 535056.5 183853.2 856.6 853.9 808.9 798.9 Till-sand, St. Peter SS SA QMW-310 535061.9 183943.6 856.5 854.2 809.2 799.2 Till-sand, St. Peter SS SAa QaMW-318 535086.7 183886.4 856.1 854.4 814.4 804.4 Till-clay SA QMW-319 535101.4 183973.3 855.8 854.1 817.6 807.6 Till-clay, Till-sand SA QMW-401S 535114.0 184011.8 855.9 854.1 811.1 801.1 Till-sand, Outwash SA Q
UpgradientMW-400S 535117.1 184224.0 856.2 854.2 811.2 801.2 Till-silt, Outwash SAa Qa
Peripheral Deep (Onsite)MW00-39-BR 535105.7 183806.2 857.1 854.8 770.8 765.8 Outwash, St. Peter SS c QcMW-316 535079.8 183850.6 856.6 854.1 779.1 774.1 St. Peter SS SAa Qa
Integral Consulting Inc. Page 1 o f 2

2017 sJ&Kemediation ReportFormer Ashland Lease Area May 21, 2018
Table 5-1. Outwash Monitoring and Pumping Weil NetworkScreen Elevation (ft amsl) Monitoring Frequency
Well Name Easting Northing
Top of Casing (ft amsl)
Ground Elevation (ft amsl) Top Bottom Stratigraphie Unit Screened Chemistry Head
Peripheral Sentinel (Upper Outwash)MW06-248-I 535084.4 183606.0 856.2 853.9 803.9 793.9 Outwash SA QMW-406D 535365.0 183281.7 855.9 855.5 802.5 792.5 Outwash - Q
Peripheral Sentinel (intermediate Outwash)MW05-06-I 535646.1 183269.9 858.5 857.3 787.3 777.3 Outwash SAa QaMW-404D 535521.7 184117.1 854.3 854.4 764.4 754.4 Outwash - Q
Peripheral Sentinel (Deep Outwash)MW00-40-MS 535092.3 183608.8 855.9 853.5 728.5 718.5 Outwash, St. Peter MS SAa QaMW05-05-BR 535581.9 183651.6 855.6 855.8 703.8 693.8 Outwash SA QMW05-06-BR 535648.2 183259.6 859.4 857.3 752.3 742.3 Outwash, St. Peter MS SA QMW05-15-BR 535228.3 183547.3 856.3 854.3 690.3 680.3 Outwash SA Q
Notes:amsl = above mean sea level GAC = granular activated carbon Q = quarterly SA = semiannually - = not applicable
Shading identifies outwash pumping wellsa Well abandoned in June 2017. Final chemistry sample collected in October 2016 and head monitored through May 2017.
bThe GAC system is monitored monthly at the system effluent to the municipal sewer, and quarterly at the influent and between the primary and secondary GAC vessels. Pumping wells MW04-192-T and MW05-02-T are monitored for chemistry quarterly.c Well abandoned in June 2017. Final chemistry sample collected in May 2017 and head monitored through May 2017.
Integral Consulting Inc. Page 2 o f 2

2 017 SÌ^Kemediation ReportFormer Ashland Lease Area May 21, 2018
Table 5-2a. Pump and Treat System Influent Concentrations
Analyte
Concentrations (gg/L)
1/17/2017 4/10/2017 7/10/2017 11/1/20171,1,1,2-Tetrachloroethane ND ND ND ND1,1,1-Trichloroethane 35.1 80.6 60.7 25.81,1,2,2-Tetrachloroethane ND ND ND ND1,1,2-Trichloroethane ND ND ND ND1,1,2-Trichlorotrifluoroethane ND ND ND ND1,1-Dichloroethane 43.3 61.9 56.1 32.91,1-Dichloroethene ND ND ND ND1,1-Dichloropropene ND ND ND ND1,2,3-T richlorobenzene ND ND ND ND1,2,3-T richloropropane ND ND ND ND1,2,4-Trichlorobenzene ND ND ND ND1,2,4-Trimethylbenzene 134 480 283 82.61,2-Dibromo-3-chloropropane ND ND ND ND1,2-Dichlorobenzene ND ND ND ND1,2-Dichloroethane ND ND ND ND1,2-Dichloropropane ND ND ND ND1,3,5-Tri methyl benzene 40.6 146 91.6 25.81,3-Dichlorobenzene ND ND ND ND1,3-Dichloropropane ND ND ND ND1,4-Dichlorobenzene ND ND ND ND2,2-Dichloropropane ND ND ND ND2-Butanone (MEK) ND ND ND ND2-Chlorotoluene ND ND ND ND4-Chlorotoluene ND ND ND ND4-Methyl-2-pentanone (MIBK) ND ND ND 51.9Acetone ND ND ND NDAllyl chloride ND ND ND NDBenzene ND ND ND NDBromobenzene ND ND ND NDBromochloromethane ND ND ND NDBromodichloromethane ND ND ND • NDBromoform ND ND ND NDBromomethane ND ND ND NDCarbon tetrachloride ND ND ND NDChlorobenzene ND ND ND NDChloroethane ND ND ND NDChloroform ND ND ND ND
Integral Consulting Inc. Page 1 o f 2

2017 Sü^Kemediation ReportFormer Ashland Lease Area May 21,2018
Table 5-2a. Pump and Treat System Influent Concentrations
Analyte
Concentrations (pg/L)
1/17/2017 4/10/2017 7/10/2017 11/1/2017Chloromethane ND ND ND NDcis-1,2-Dichloroethene 679 854 742 425cis-1,3-Dichloropropene ND ND ND NDDibromochloromethane ND ND ND NDDibromomethane ND ND ND NDD ich lo rod ifluorom ethane ND ND ND NDDichlorofiuoromethane ND ND ND NDDiethyl ether (Ethyl ether) ND ND ND NDEthylbenzene 554 1,680 1170 252Hexachloro-1,3-butadiene ND ND ND NDIsopropylbenzene (Cumene) ND 46 ND NDm&p-Xylene 1,250 4,030 2,940 856Methylene Chloride ND ND ND NDMethyl-tert-butyl ether ND ND ND NDNaphthalene ND 162 ND NDn-Butylbenzene ND ND ND NDn-Propylbenzene ND 80.5 ND NDo-Xylene 398 1360 969 276p-lsopropyltoluene ND ND ND NDsec-Butylbenzene ND ND ND NDStyrene 26.8 184 111.0 NDtert-Butylbenzene ND ND ND NDTetrachloroethene ND ND ND NDTetrahydrofuran ND ND ND NDToluene 2,980 7,740 5,940 1,800trans-1,2-Dichloroethene ND ND ND NDtrans-1,3-Dichloropropene ND ND ND NDTrichloroethene ND 14.1 ND NDT richlorofluoromethane ND ND ND NDVinyl chloride 35.2 38.9 36.2 28.6
Total Organics (pg/L) 6,176 16,958 12,400 3,857
Notes:ND = analyte not detected
Integral Consulting Inc. Page 2 of 2

2017 Siï^œmediation ReportFormer Ashland Lease Area May 21, 2018
Table 5-2b. Pump and Treat System Intermediate Concentrations
AnalyteConcentrations (pg/L)
1/17/2017 4/10/2017 7/10/2017 11/1/20171,1,1,2-Tetrachloroethane ND ND ND ND1,1,1 -T richloroethane ND ND ND 2.51,1,2,2-Tetrachloroethane ND ND ND ND1,1,2-Trichloroethane ND ND ND ND1,1,2-TrichlorotrifIuoroethane ND ND ND ND1,1-Dichloroethane ND ND ND 7.61,1-Dichloroethene ND ND ND ND1,1 -Dichloropropene ND ND ND ND1,2,3-T richlorobenzene ND ND ND ND1,2,3-Trichloropropane ND ND ND ND1,2,4-T richlorobenzene ND ND ND ND1,2,4-T rimethylbenzene ND ND ND ND1,2-Dibromo-3-ch[oropropane ND ND ND ND1,2-Dichlorobenzene ND ND ND ND1,2-Dichloroethane ND ND ND ND1,2-Dichloropropane ND ND ND ND1,3,5-Trimethylbenzene ND ND ND ND1,3-Dichlorobenzene ND ND ND ND1,3-Dichloropropane ND ND ND ND1,4-Dichlorobenzene ND ND ND ND2,2-DichIoropropane ND ND ND ND2-Butanone (MEK) ND ND ND ND2-Chlorotoluene ND ND ND ND4-Chlorotoluene ND ND ND ND4-Methyl-2-pentanone (MIBK) ND ND ND NDAcetone ND ND ND NDAlly! chloride ND ND ND NDBenzene ND ND ND NDBromobenzene ND ND ND NDBromochloromethane ND ND ND NDBromodichloromethane ND ND ND NDBromoform ND ND ND NDBromomethane ND ND ND NDCarbon tetrachloride ND ND ND NDChlorobenzene ND ND ND NDChloroethane 6.2 ND 1.1 2.5Chloroform ND ND ND ND
Integral Consulting Inc. Page 1 of 2

2017 Sn^ëmeâiation ReportFormer Ashland Lease Area May 21, 2018
Table 5-2b. Pump and Treat System Intermediate Concentrations
Concentrations (pg/L)Analyte 1/17/2017 4/10/2017 7/10/2017 11/1/2017Chloromethane ND ND ND NDcis-1,2-Dichloroethene ND ND ND 47.5cis-1,3-Dichloropropene ND ND ND NDDibromochloromethane ND ND ND NDDibromomethane ND ND ND NDDichlorodifluoromethane ND ND ND NDDich lorofiuoro methane ND ND ND NDDiethyl ether (Ethyl ether) ND ND ND NDEthylbenzene ND ND ND NDHexachloro-1,3-butadiene ND ND ND NDIsopropylbenzene (Cumene) ND ND ND NDm&p-Xylene ND ND ND 9Methylene Chloride ND ND ND NDMethyl-tert-butyl ether ND ND ND NDNaphthalene ND ND ND NDn-Butylbenzene ND ND ND NDn-Propylbenzene ND ND ND NDo-Xylene ND ND ND 7.2p-1 sopropy [toluene ND ND ND NDsec-Butylbenzene ND ND ND NDStyrene ND ND ND NDtert-Butyl benzene ND ND ND NDTetrachloroethene ND ND ND NDTetrahydrofuran ND ND ND NDToluene ND ND ND 29.8trans-1,2-Dichloroethene ND ND ND NDtrans-1,3-Dichloropropene ND ND ND NDTrichloroethene ND ND ND NDTrichlorofluoromethane ND ND ND NDVinyl chloride 21.7 ND 0.77 26.8
Total Organics 28.0 0 2 133
Notes:ND = analyte not detected
Integral Consulting Inc, Page 2 o f 2

2017 Sit^smediatíon ReportFormer Ashland Lease Area May 21,2018
Table 5-2c. Pump and Treat System Effluent Concentrations
Concentrations (pg/L)Analyte 1/17/2017 2/14/2017 3/14/2017 4/10/2017 5/4/2017 6/6/2017 7/10/2017 8/16/2017 9/12/2017 10/4/2017 11/1/2017 12/7/20171,1,1,2-Tetrachloroethane ND ND ND ND ND ND ND ND ND ND ND ND1,1,1-Trichloroethane ND ND ND ND ND ND ND ND ND ND ND ND1,1,2,2-Tetrachloroethane ND ND ND ND ND ND ND ND ND ND ND ND1,1,2-Trichloroethane ND ND ND ND ND ND ND ND ND ND ND ND1,1,2-TrichlorotrifIuoroethane ND ND ND ND ND ND ND ND ND ND ND ND1,1-Dichloroethane ND ND ND ND ND ND ND ND ND ND ND ND1,1-Dichloroethene ND ND ND ND ND ND ND ND ND ND ND ND1,1-Dichloropropene ND ND ND ND ND ND ND ND ND ND ND ND1,2,3-Trichlorobenzene ND ND ND ND ND ND ND ND ND ND ND ND1,2,3-T richloropropane ND ND ND ND ND ND ND ND ND ND ND ND1,2,4-Trichlorobenzene ND ND ND ND ND ND ND ND ND ND ND ND1,2,4-Trimethylbenzene ND ND ND ND ND ND ND ND ND ND ND ND1,2-Dibromo-3-chIoropropane ND ND ND ND ND ND ND ND ND ND ND ' ND1,2-Dichlorobenzene ND ND ND ND ND ND ND ND ND ND ND ND1,2-Dichloroethane ND ND ND ND ND ND ND ND ND ND ND ND1,2-Dichloropropane ND ND ND ND ND ND ND ND ND ND ND ND1,3,5-Trimethylbenzene ND ND ND ND ND ND ND ND ND ND ND ND1,3-Dichlorobenzene ND ND ND ND ND ND ND ND ND ND ND ND1,3-Dichloropropane ND ND ND ND ND ND ND ND ND ND ND ND1,4-DichIorobenzene ND ND ND ND ND ND ND ND ND ND ND ND2,2-Dichloropropane ND ND ND ND ND ND ND ND ND ND ND ND2-Butanone (MEK) ND ND ND ND ND ND ND ND ND ND ND ND2-Chlorotoluene ND ND ND ND ND ND ND ND ND ND ND ND4-Chlorotoluene ND ND ND ND ND ND ND ND ND ND ND ND4-Methyl-2-pentanone (MIBK) ND ND ND ND ND ND ND ND ND ND ND NDAcetone ND ND ND ND ND ND ND ND ND ND ND NDAllyl chloride ND ND ND ND ND ND ND ND ND ND ND NDBenzene ND ND ND ND ND ND ND ND ND ND ND NDBromobenzene ND ND ND ND ND ND ND ND ND ND ND NDBromochlorom ethane ND ND ND ND ND ND ND ND ND ND ND NDBromodichloromethane ND ND ND ND ND ND ND ND ND ND ND NDBromoform ND ND ND ND ND ND ND ND ND ND ND NDBromomethane ND ND ND ND ND ND ND ND ND ND ND NDCarbon tetrachloride ND ND ND ND ND ND ND ND ND ND ND NDChlorobenzene ND ND ND ND ND ND ND ND ND ND ND NDChloroethane ND ND ND ND ND ND ND ND ND ND ND NDChloroform ND ND ND ND ND ND ND ND ND ND ND ND
Integral Consulting Inc. Page 1 of 2

2017 St^Wmediation ReportFormer Ashland Lease Area May 21, 2018
Table 5-2c. Pump and Treat System Effluent Concentrations
AnalyteConcentrations (pg/L)
1/17/2017 2/14/2017 3/14/2017 4/10/2017 5/4/2017 6/6/2017 7/10/2017 8/16/2017 9/12/2017 10/4/2017 11/1/2017 12/7/2017Chloromethane ND ND ND ND ND ND ND ND ND ND ND NDcis-1,2-Dichloroethene ND ND ND ND ND ND ND ND ND ND ND NDcis-1,3-Dichloropropene ND ND ND ND ND ND ND ND ND ND ND NDDibromochloromethane ND ND ND ND ND ND ND ND ND ND ND NDDibromomethane ND ND ND ND ND ND ND ND ND ND ND NDDichlorodifluoromethane ND ND ND ND ND ND ND ND ND ND ND NDDichlorofluoromethane ND ND ND ND ND ND ND ND ND ND ND NDDiethyl ether (Ethyl ether) ND ND ND ND ND ND ND ND ND ND ND NDEthylbenzene ND ND ND ND ND ND ND ND ND ND ND NDHexachloro-1,3-butadiene ND ND ND ND ND ND ND ND ND ND ND NDIsopropylbenzene (Cumene) ND ND ND ND ND ND ND ND ND ND ND NDm&p-Xylene ND ND ND ND ND ND ND ND ND ND ND NDMethylene Chloride ND ND ND ND ND ND ND ND ND ND ND NDMethyl-tert-butyl ether ND ND ND ND ND ND ND ND ND ND ND NDNaphthalene ND ND ND ND ND ND ND ND ND ND ND NDn-Butyibenzene ND ND ND ND ND ND ND ND ND ND ND NDn-P ropy Ibenzene ND ND ND ND ND ND ND ND ND ND ND NDo-Xylene ND ND ND ND ND ND ND ND ND ND ND NDp-lsopropyltoluene ND ND ND ND ND ND ND ND ND ND ND NDsec-Butyl benzene ND ND ND ND ND ND ND ND ND ND ND NDStyrene ND ND ND ND ND ND ND ND ND ND ND NDtert-Buty I benzene ND ND ND ND ND ND ND ND ND ND ND NDTetrachloroethene ND ND ND ND ND ND ND ND ND ND ND NDTetrahydrofuran ND ND ND ND ND ND ND ND ND ND ND NDToluene ND ND ND ND ND ND ND ND ND ND ND NDtrans-1,2-Dichloroethene ND ND ND ND ND ND ND ND ND ND ND NDtrans-1,3-Dichloropropene ND ND ND ND ND ND ND ND ND ND ND NDTrichloroethene ND ND ND ND ND ND ND ND ND ND ND NDT richlorofluorom ethane ND ND ND ND ND ND ND ND ND ND ND NDVinyl chloride ND ND ND ND ND ND ND ND ND ND ND ND
Total Organics 0 0 0 0 0 0 0 0 0 0 0 0Notes:
ND = analyte not detected
Integral Consulting Inc. Page 2 of 2

2 017 Sì^Kmediation ReportFormer Ashland Lease Area May 21, 2018
Table 5-3. Extraction Rates and Volumes Withdrawn from Outwash Wells
YearReportingQuarterb
Total Gallons Removed
Total Discharge (qpm)
Discharge During Active Pumping Periods3
MW04-192-T MW05-02-T Combined Discharge (gpm) (gpm) (gpm)
2017 Q1 874,048 7.1 4.7 2.5 7.22017 Q2 847,432 6.1 6.1 0.0 6.12017 Q3 709,148 5.4 6.9 0.0 6.92017 Q4 806,470 6.0 6.0 0.0 6.0
Total 3,237,098Average 809,275 6.2 5.9 0.6 6.6
Notes:gpm = gallons per minute
a Pumping rates are calculated based on totalizer readings from MW04-192-T and a measured flow rate of 1 gpm from MW05- 02-T. The MW05-02-T totalizer was not functioning in 2016 and the effluent totalizer appeared to be malfunctioning as totalizer readings were often lower than the pumping wells.b From December 2, 2015, through December 6, 2016.
Integral Consulting Inc. Page l o f i

2017 Sitttêmediation ReportFormer Ashland Lease Area May 21, 2018
Table 5-4. Concentration Trends in Extraction Wells for Toluene and Trichloroethene
SampleDate
TimePeriod
SampleType
Toluene Trichloroethene
Concentration(mq/l)
Detect(Y/N)
ConcentrationDecrease
(%)Concentration
(pg/L)Detect(Y/N)
ConcentrationDecrease
(%)WIW04-192-T
10/27/05 Baseline Normal 68,000 Y — 6,000 Y —
05/04/06 Baseline Normal 30,000 Y _ _ 120 Y —
10/11/06 Baseline Normal 140,000 Y — 17,000 Y —
Average 79,333 Y — 7,707 Y —
09/04/07 Operation Normal 12,600 Y 84 592 Y 9202/26/08 Operation Normal 8,720 Y 89 153 Y 9805/20/08 Operation Normal 4,770 Y 94 118 Y - 9810/13/08 Operation Normal 4,850 Y 94 69 Y 9902/11/09 Operation Normal 6,380 Y 92 172 Y 9802/24/09 Operation Normal 5,560 Y 93 120 Y 9804/29/09 Operation Normal 5,200 Y 93 87 Y 9905/06/09 Operation Normal 3,300 Y 96 51 Y 9906/15/09 Operation Normal 7,500 Y 91 130 Y 9808/24/09 Operation Normal 5,520 Y 93 89 Y 9910/26/09 Operation Normal 5,840 Y 93 89 Y 99
- 03/10/10 Operation Normal 3,600 Y 95 59 Y 9905/24/10 Operation Normal 4,090 Y 95 47 Y 9910/21/10 Operation Normal 3,670 Y 95 20 Y 10003/16/11 Operation Normal 3,320 Y 96 50 N 9905/18/11 Operation Normal 3,530 Y 96 40 N 9908/02/11 Operation Normal 4,080 Y 95 25 N 10008/02/11 Operation Field Dup 3,780 Y 95 10 ■ Y 10010/12/11 Operation Normal 4,660 Y 94 40 N 9903/06/12 Operation Normal 3,320 Y 96 40 N 9905/07/12 Operation Normal 2,900 Y 96 40 N 9905/07/12 Operation Field Dup 3,110 Y 96 40 N 9908/22/12 Operation Normal 4,570 Y 94 13 Y 100
Integral Consulting Inc. Page 1 of 4

2017 Sïïttem ediation ReportFormer Ashland Lease Area May 21, 2018
Table 5-4. Concentration Trends in Extraction Wells for Toluene and Trichloroethene
SampleDate
TimePeriod
SampleTvpe
Toluene Trichloroethene
Concentration(M9/L)
Detect(Y/N)
ConcentrationDecrease
(%)Concentration
(pg/L)Detect(Y/N)
ConcentrationDecrease
(%)08/22/12 Operation Field Dup 3,430 Y 96 40 N 9910/03/12 Operation Normal 4,060 Y 95 40 N 9910/03/12 Operation Field Dup 1,990 Y 97 40 N 9903/19/13 Operation Normal 2,950 Y 96 50 N 9903/19/13 Operation Field Dup 2,810 Y 96 50 N 9905/22/13 Operation Normal 2,330 Y 97 40 N 9905/22/13 Operation Field Dup 3,020 Y 96 25 N 10010/09/13 Operation Normal 3,780 Y 95 40 N 9905/22/14 Operation Normal 2,540 Y 97 25 N 10005/22/14 Operation Field Dup 2,720 Y 97 25 N 10010/14/14 Operation Normal 6,220 Y 92 25 N 10005/18/15 Operation Normal 4,210 Y 95 50 N 9905/18/15 Operation Field Dup 4,920 Y 94 50 N 9909/23/15 Operation Normal 2,870 Y 96 3 Y 10010/05/15 Operation Normal 6,290 Y 92 25 N 10010/05/15 Operation Field Dup 6,070 Y 92 100 N 9903/22/16 Operation Normal 31,000 Y 61 67 Y 9905/16/16 Operation Normal 2,470 Y 97 10 N 10005/16/16 Operation Field Dup 2,410 Y 97 10 N 10009/27/16 Operation Normal 1,900 Y 98 8 N 10010/11/16 Operation Normal 1,960 Y 98 20 N 10010/11/16 Operation Field Dup 2,120 Y 97 20 N 10003/20/17 Operation Normal 35,300 Y 56 100 N 9905/02/17 Operation Normal 2,340 Y 97 50 N 9905/02/17 Operation Field Dup 2,010 Y 97 40 N 9909/12/17 Operation Normal 2,310 Y 97 8 N 10010/09/17 Operation Normal 11,300 Y 86 40 N 9910/09/17 Operation Field Dup 21,400 Y 73 250 N 97
Integral Consulting Inc. Page 2 o f 4

2017 Sit^emediation ReportFormer Ashland Lease Area May 21, 2018
Table 5-4. Concentration Trends in Extraction Wells for Toluene and Trichloroethene
SampleDate
TimePeriod
Sample Type _
Toluene Trichloroethene
Concentration(pg'L)
Detect(Y/N)
ConcentrationDecrease
(%)Concentration
(pg/L)Detect(Y/N)
ConcentrationDecrease
(%)M W 05-02-T
10/27/05 Baseline Normal 48,000 Y — 470 Y —
05/11/06 Baseline Normal 91,000 Y — 620 N —
10/13/06 Baseline Normal 110,000 Y — 380 Y —
Average 83,000 Y — 490 Y09/04/07 Operation Normal 8,790 Y 89 417 Y 1502/26/08 Operation Normal 8,710 Y 90 264 Y 4605/21/08 Operation Normal 5,710 Y 93 175 Y 6410/14/08 Operation Normal 5,200 Y 94 193 Y 6102/11/09 Operation Normal 4,550 Y 95 171 Y 6502/24/09 Operation Normal 3,940 Y 95 160 Y 6704/29/09 Operation Normal 3,700 Y 96 147 Y 7005/06/09 Operation Normal 3,320 Y 96 116 Y 7606/18/09 Operation Normal 5,200 Y 94 170 Y 6508/24/09 Operation Normal 5,180 Y 94 211 Y 5710/27/09 Operation Normal 2,780 Y 97 119 Y 7603/10/10 Operation Normal 3,700 Y 96 180 Y 6305/18/10 Operation Normal 3,160 Y 96 124 Y 7510/21/10 Operation Normal 3,360 Y 96 129 Y 7403/16/11 Operation Normal 2,270 Y 97 94 Y 8105/18/11 Operation Normal 2,950 Y 96 125 Y 7408/02/11 Operation Normal 5,670 Y 93 199 Y 5911/02/11 Operation Normal 4,860 Y 94 91 Y 8203/07/12 Operation Normal 2,640 Y 97 58 Y 8805/09/12 Operation Normal 2,730 Y 97 77 Y 8408/23/12 Operation Normal 2,260 Y 97 23 Y 9508/23/12 Operation Field Dup 2,340 Y 97 23 Y 9510/03/12 Operation Normal 3,530 Y 96 73 Y 85
Integral Consulting Inc. Page 3 of 4

2017 Sit^Kemediation ReportFormer Ashland Lease Area May 21, 2018
Table 5-4. Concentration Trends in Extraction Wells for Toluene and Trichloroethene
SampleDate
TimePeriod
SampleType
Toluene Trichloroethene
Concentration(Mg/L)
Detect(Y/N)
ConcentrationDecrease
(%)Concentration
(Mg/L)Detect(Y/N)
ConcentrationDecrease
(%)03/20/13 Operation Normal 2,040 Y 98 47 Y 9003/20/13 Operation Field Dup 2,300 Y 97 56 Y 8905/22/13 Operation Normal 2,110 Y 97 35 Y 9310/09/13 Operation Normal 2,800 Y 97 40 Y 9210/09/13 Operation Field Dup 2,920 Y 96 49 Y 9005/22/14 Operation Normal 1,870 Y 98 33 Y 9310/14/14 Operation Normal 3,940 Y 95 50 Y 9005/18/15 Operation Normal 1,700 Y 98 18 Y 9609/29/15 Operation Normal 3,070 Y 96 20 N 9610/08/15 Operation Normal 5,630 Y 93 115 Y 7703/22/16 Operation Normal 3,780 Y 95 24 Y 9505/16/16 Operation Normal 3,290 Y 96 42 Y 9209/27/16 Operation Normal 3,060 Y 96 35 Y 9310/11/16 Operation Normal 2,530 Y 97 26 Y 9503/20/17 Operation Normal 1,950 Y 98 15 Y 9705/02/17 Operation Normal 2,820 Y 97 27 Y 9409/12/17 Operation Normal 12,900 Y 84 8 N 9810/10/17 Operation Normal 585 Y 99 10 N 98
Notes:-- = not applicable
Integral Consulting Inc. Page 4 o f 4

A ppen d ix A
SVE S h u t d o w n E v a l u a t io n R e p o r t
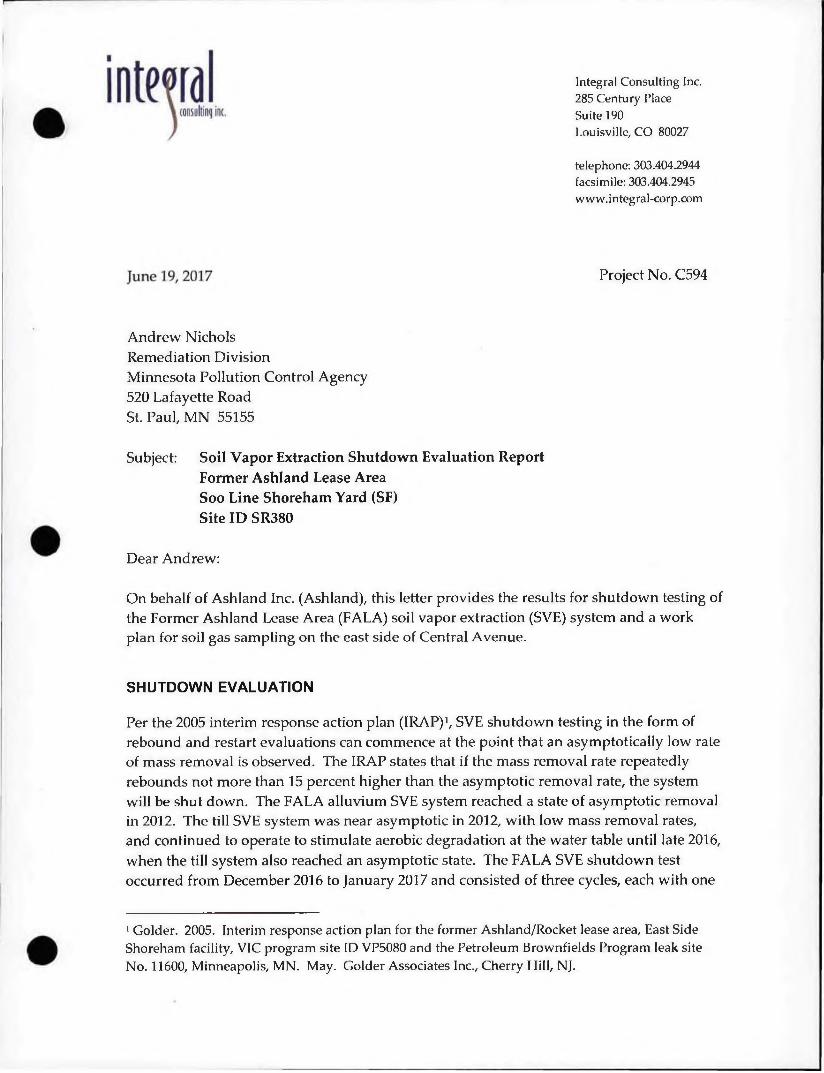
Integral Consulting Inc. 285 Century Place Suite 190Louisville, CO 80027
telephone: 303.404.2944 facsimile: 303.404.2945 www.integral-corp.com
Project No. C594
Andrew NicholsRemediation DivisionMinnesota Pollution Control Agency520 Lafayette RoadSt. Paul, MN 55155
Subject: Soil Vapor Extraction Shutdown Evaluation ReportFormer Ashland Lease Area Soo Line Shoreham Yard (SF)Site ID SR380
Dear Andrew:
On behalf of Ashland Inc. (Ashland), this letter provides the results for shutdown testing of the Former Ashland Lease Area (FALA) soil vapor extraction (SVE) system and a work plan for soil gas sampling on the east side of Central Avenue.
SHUTDOWN EVALUATION
Per the 2005 interim response action plan (IRAP)1, SVE shutdown testing in the form of rebound and restart evaluations can commence at the point that an asymptotically low rate of mass removal is observed. The IRAP states that if the mass removal rate repeatedly rebounds not more than 15 percent higher than the asymptotic removal rate, the system will be shut down. The FALA alluvium SVE system reached a state of asymptotic removal in 2012. The till SVE system was near asymptotic in 2012, with low mass removal rates, and continued to operate to stimulate aerobic degradation at the water table until late 2016, when the till system also reached an asymptotic state. The FALA SVE shutdown test occurred from December 2016 to January 2017 and consisted of three cycles, each with one
1 Golder. 2005. Interim response action plan for the former Ashland/Rocket lease area, East Side Shoreham facility, VIC program site ID VP5080 and the Petroleum Brownfields Program leak site No. 11600, Minneapolis, MN. May. Golder Associates Inc., Cherry Hill, NJ.

week of system shutdown followed by one week of system operation. The test was performed in accordance with the October 3, 20162 work plan, approved by the Minnesota Pollution Control Agency (MPCA) on November 2, 2016.
Prior to the start of the test, an ad hoc soil gas sample was collected for volatile organic compound (VOC) analysis by U.S. Environmental Protection Agency Method TO-15 from the shallow vapor monitoring point T-VM-4S. T-VM-4S serves as a receptor-depth (4 feet below ground surface) location on the east side of Central Avenue (Figure 1). Sampling of T-VM-4S began in 2013, upon temporary shutdown of the alluvium SVE system, and sampling was suspended in 2014, after trichloroethene (TCE) concentrations in two successive warm weather samples were below the MPCA intrusion screening value (ISV) for commercial/industrial sub-slab air. T-VM-4S was not scheduled to be monitored again until after final rebound testing; however, it was decided sampling before rebound testing (till system in operation) would be beneficial to evaluate conditions after the 2-year alluvium system shutdown period. Additional ad hoc VOC samples from T-VM-4S were planned during the rebound test while both SVE systems were off. However, no further samples could be collected as the shallow vapor monitoring point was blocked by ice near the ground surface for the duration of the test.
Following collection of the soil gas sample on December 6, 2016, the alluvium system was restarted. Initial samples for VOC analysis were collected from the till and alluvium manifolds on December 13 and 14, 2016, respectively, after the alluvium system had been on for 1 week. The sample canister for the initial alluvium manifold sample was received without vacuum, delaying the sample collection and start of the test by 1 day until a replacement canister was obtained. No further sample collection issues were encountered during the test.
The first shutdown test cycle began on December 14, 2016, with the shutdown of both the till and alluvium systems. On December 20, 2016, after the 1-week rebound period, both systems were turned on and VOC samples were collected from the till and alluvium manifolds at 2 hours, 24 hours, 72 hours, and 1 week after system restart. The manifolds were also monitored by photoionization detector (PID) at the same time intervals after system restart. System operational data were collected during each site visit. The second and third shutdown test cycles proceeded in the same manner, and the test was concluded on January 24, 2017. The alluvium system was shut off at the conclusion of the test and the till system remained on.
Andrew NicholsJune 19, 2017Page 2
2 Integral. 2016. Soil vapor extraction system operations, Form er Ashland Lease Area Soo Line Shoreham Yard (SF), Site ID SR380. October 3. Integral Consulting Inc., Louisville, CO.

Andrew NicholsJune 19, 2017Page 3
SHUTDOWN EVALUATION RESULTS
VOC results for the till and alluvium manifolds are presented in Tables 1 and 2, respectively. The sum of chlorinated, non-chlorinated, and all VOCs is presented at the bottom of each table. VOCs detected in both systems consisted mainly of chlorinated VOCs and ranged from 158 to 1,252 pg/m3 total VOCs in the till and 64 to 1,285 pg/m3 total VOCs in the alluvium. PID readings were low throughout the test, ranging from 0 to 0.2 ppm, and therefore were not used in the rebound evaluation. All VOC laboratory reports are attached in Appendix A.
Table 3 contains a summary of VOC concentrations, flow rates, mass removed, and mass removal rates for each system. First, instantaneous removal rates were calculated at each sample time by multiplying the concentration by the flow rate. Then, the mass removed for each time interval was calculated using the instantaneous removal rates (e.g., the 2-hour sample was used to calculate the mass removed from 0 to 2 hours after system restart, the average of the 2-hour and 24-hour samples was used to calculate the mass removed from 2 to 24 hours). An average cycle recovery rate was calculated by dividing the total mass removed by the total elapsed time, including the shutdown period (i.e., the entire 2-week cycle). The rates for the three cycles were then averaged to determine the overall shutdown test removal rates.
At the bottom of Table 3, the overall average shutdown test removal rate (average of the three cycles) is compared to the average asymptotic removal rate for each system. The shutdown test rates were an order of magnitude lower than the asymptotic rates for both systems, 0.00004 lb/hr versus 0.00094 lb/hr in the till system and 0.00036 lb/hr versus 0.00420 lb/hr in the alluvium system. The asymptotic removal rates are defined as the average rate for the period used in the Mann-Kendall trend analysis (presented in August 14, 20123 and October 3, 20164 letters to MPCA). The average rates as well as the instantaneous rates are displayed in Figure 2. In addition to the low shutdown test removal rates, no single instantaneous removal rate rebounded above the average asymptotic rates in the respective systems.
Table 4 presents TCE results from shallow vapor monitoring point, T-VM-4S, on the east side of Central Avenue. The December 6, 2016, sample, collected prior to the test, contained 96 pg/m3 TCE. Although this concentration is increased compared to the samples collected in 2013 and 2014, it is below the MPCA commercial/industrial sub-slab
3 Integral. 2012. Vapor investigation and soil vapor extraction system operations, Form er Ashland Lease Area Soo Line Shoreham Yard (SF), Site ID SR380. August 14. Integral Consulting Inc., Louisville, CO.4 See footnote 2.

air ISV of 230 pg/m3 (i.e., 33 times the commercial/industrial indoor air ISV).5 All other detected compounds were also below their respective commercial/industrial sub-slab air
Andrew NicholsJune 19, 2017Page 4
SYSTEM SHUTDOWN AND SOIL GAS REBOUND TESTING
Because recent shutdown testing performed at the FALA did not rebound above the asymptotic removal rate, it is recommended that the FALA till and alluvium systems be shut down while confirmatory soil and soil gas testing are performed. The IRAP states soil gas testing shall be performed in the median of Central Avenue and at the eastern side of Central Avenue. Because of access issues on the median of Central Avenue and the low recovery rates observed during rebound testing, Ashland proposes to monitor only the T-VM-4S point on the east side of Central Avenue, commencing in the third quarter of 2017. Soil gas rebound testing would proceed in the same manner as outlined in the August 14, 2012, letter when the alluvium system was first shut down. Samples will be collected quarterly for one year and analyzed for VOCs by Method TO-15. If two successive warm weather samples (when concentrations peak) are less than the commercial/industrial subslab air ISVs, soil gas monitoring will be concluded. However, if T-VM-4S VOC concentrations are above the commercial/industrial sub-slab air ISVs, then a plan for delineation of the extent of soil gas above ISVs will be submitted to MPCA. A separate work plan will be submitted for confirmatory soil testing.
We would appreciate a response to this letter by June 30, 2017, so that we may initiate soil gas testing for the remaining warm weather season in 2017. If you have any questions, please call me at (720) 465-3319.
ISVs.
Sincerely,
Steven O. Helgen Principal Geochemist
Enclosures
5 MPCA. 2017. Interim ISV short guidance. February 13. Minnesota Pollution Control Agency, Minneapolis, MN.

Andrew NicholsJune 19, 2017Page 5
cc: Tom Frame, City of MinneapolisJames Vondracek, Ashland LeeAnn Thomas, CP Aimee Zack, CP Steve Finn, Golder Claire Mackler, GolderCouncilman Kevin Reich, Minneapolis City Council—First Ward Michelle Brodin, Stinson Leonard Street
inte

F ig u r e s

VEW05
VEW05-75-T-3
VEW05-76-T-4VEW05-77-T-5
VEW04-186-A50N'
VEW05-78-T-6VEW05-173-T-1
-̂ T-VM̂ S"VT-VM-4
' VEW04-180-A40-E VEW04-179-T-30NW'W
-VM-5
VEW04]
A-vM-4VEW05-79-T-7%\ I ®o\
VEW05-80-T-8
A VEW05.-74-A-5
O VEW05-81-T-9
30
Feet
60
Map Features
V Till, Vapor Monitoring Well I I FALA Boundary
▼ Alluvium, Vapor Monitoring Well * Fence
O Till, SVE Well -------- Gate
• Alluvium, SVE Well SVE Pipe
Figure 1.Location of SVE Vapor Extraction Wells and Monitoring Points at the Former Ashland Lease Area


T a b l e s
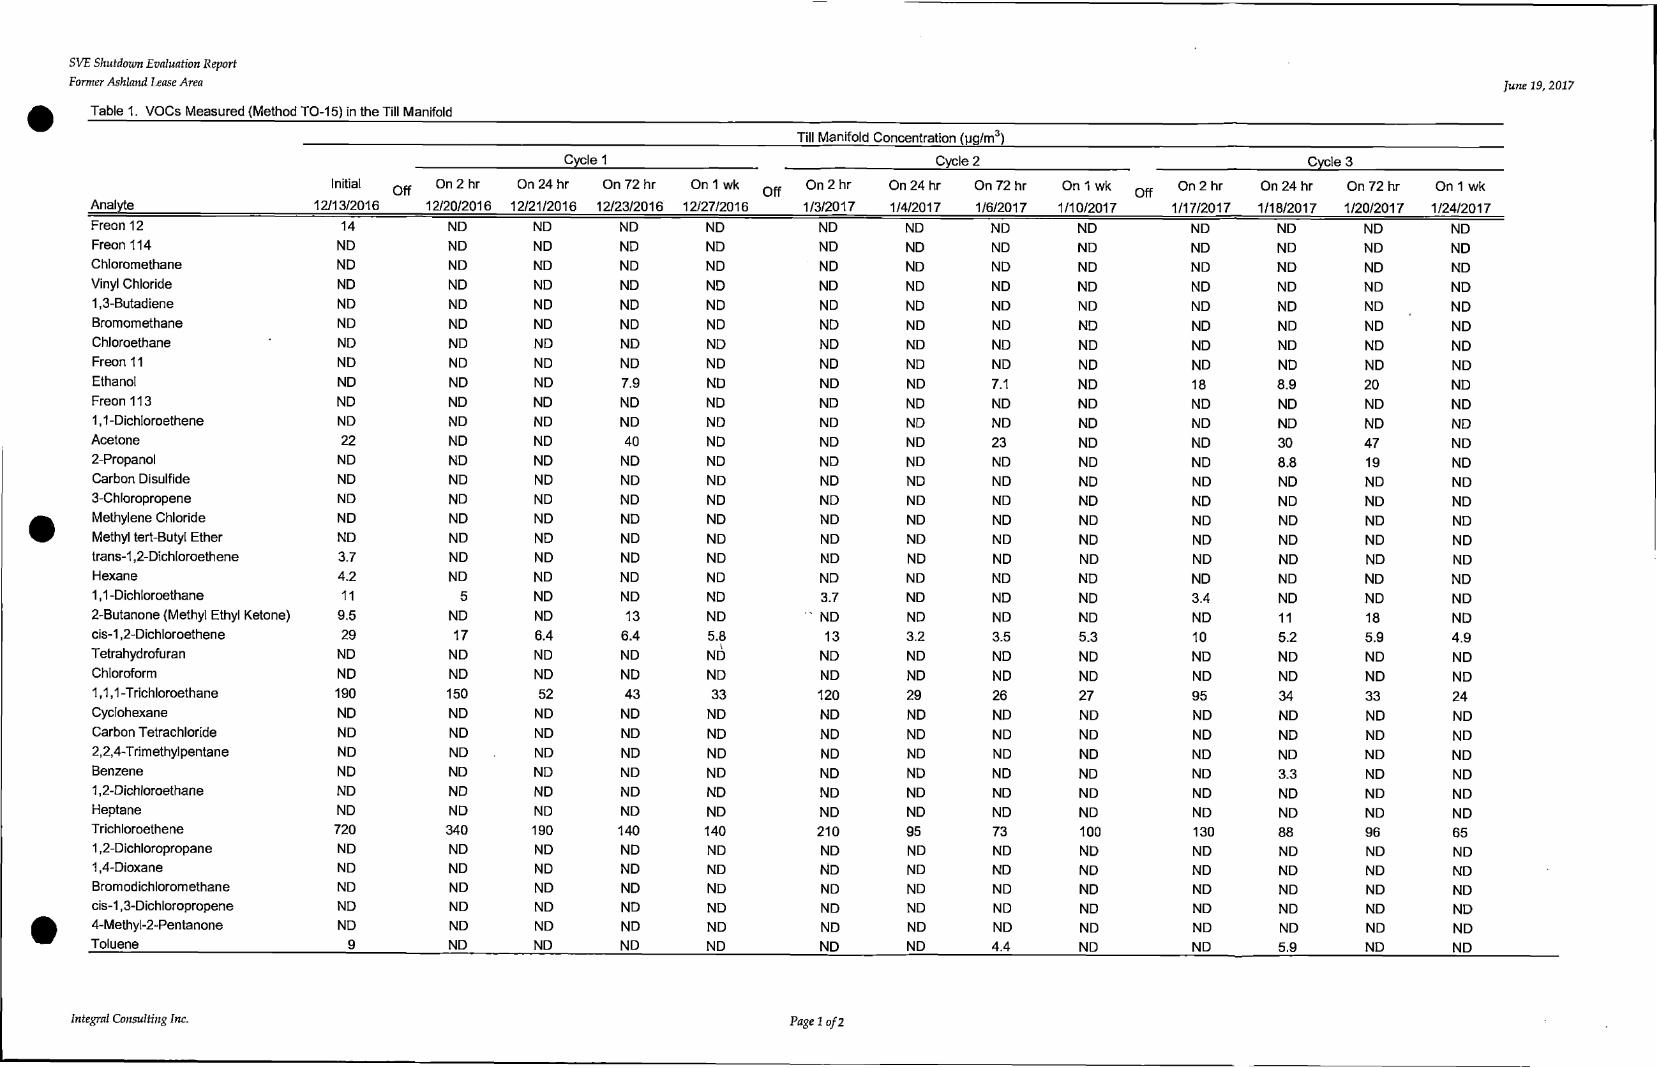
SVE Shutdown Evaluation ReportFormer Ashland Lease Area June 19, 2017
Table 1. VQCs Measured (Method TO-15) in the Till Manifold_______________________________________________________________________________
______________________________________________________________________ Till Manifold Concentration (pg/m3)
Cycle 1_________________________ Cycle 2_____________________ Cycle 3
AnalyteInitial
12/13/2016On 2 hr
12/20/2016On 24 hr
12/21/2016
On 72 hr
12/23/2016°n 1 wk 0ff
12/27/2016
On 2 hr 1/3/2017
On 24 hr 1/4/2017
On 72 hr
1/6/2017
On 1 wk
1/10/2017Off ° n 2 hr
1/17/2017On 24 hr
1/18/2017On 72 hr
1/20/2017On 1 w
1/24/20Freon 12 14 ND ND ND ND ND ND ND ND ND ND ND NDFreon 114 ND ND ND ND ND ND ND ND ND ND ND ND NDChloromethane ND ND ND ND ND ND ND ND ND ND ND ND NDVinyl Chloride ND ND ND ND ND ND ND ND ND ND ND ND ND1,3-Butadiene ND ND ND ND ND ND ND ND ND ND ND ND NDBromomethane ND ND ND ND ND ND ND ND ND ND ND ND NDChloroethane ND ND ND ND ND ND ND ND ND ND ND ND NDFreon 11 ND ND ND ND ND ND ND ND ND ND ND ND NDEthanol ND ND ND 7.9 ND ND ND 7.1 ND 18 8.9 20 NDFreon 113 ND ND ND ND ND ND ND ND ND ND ND ND ND1,1-DichIoroethene ND ND ND ND ND ND ND ND ND ND ND ND NDAcetone 22 ND ND 40 ND ND ND 23 ND ND 30 47 ND2-Propanol ND ND ND ND ND ND ND ND ND ND 8.8 19 NDCarbon Disulfide ND ND ND ND ND ND ND ND ND ND ND ND ND3-Chloropropene ND ND ND ND ND ND ND ND ND ND ND ND NDMethylene Chloride ND ND ND ND ND ND ND ND ND ND ND ND NDMethyl tert-Butyl Ether ND ND ND ND ND ND ND ND ND ND ND ND NDtrans-1,2-Dichloroethene 3.7 ND ND ND ND ND ND ND ND ND ND ND NDHexane 4.2 ND ND ND ND ND ND ND ND ND ND ND ND1,1-Dichloroethane 11 5 ND ND ND 3.7 ND ND ND 3.4 ND ND ND2-Butanone {Methyl Ethyl Ketone) 9.5 ND ND 13 ND " ND ND ND ND ND 11 18 NDcis-1,2-Dichloroethene 29 17 6.4 6.4 5.8 13 3.2 3.5 5.3 10 5.2 5.9 4.9Tetrahydrofuran ND ND ND ND ND ND ND ND ND ND ND ND NDChloroform ND ND ND ND ND ND ND ND ND ND ND ND ND1,1,1 -Trichloroethane 190 150 52 43 33 120 29 26 27 95 34 33 24Cydohexane ND ND ND ND ND ND ND ND ND ND ND ND NDCarbon Tetrachloride ND ND ND ND ND ND ND ND ND ND ND ND ND2,2,4-Trim ethyl penta n e ND ND ND ND ND ND ND ND ND ND ND ND NDBenzene ND ND ND ND ND ND ND ND ND ND 3.3 ND ND1,2-Dichloroethane ND ND ND ND ND ND ND ND ND ND ND ND NDHeptane ND ND ND ND ND ND ND ND ND ND ND ND NDTrichloroethene 720 340 190 140 140 210 95 73 100 130 88 96 651,2-Dichloropropane ND ND ND ND ND ND ND ND ND ND ND ND ND1,4-Dioxane ND ND ND ND ND ND ND ND ND ND ND ND NDBromodichlorom ethane ND ND ND ND ND ND ND ND ND ND ND ND NDcis-1,3-Dichloropropene ND ND ND ND ND ND ND ND ND ND ND ND ND4-Methyl-2-Pentanone ND ND ND ND ND ND ND ND ND ND ND ND NDToluene 9 ND ND ND ND ND ND 4.4 ND ND 5.9 ND ND
Integral Consulting Inc. Page 1 of 2

SVE Shutdown Evaluation ReportFormer Ashland Lease Area June 19,2017
Table 1. VOCs Measured (Method TO-15) in the Till Manifold
Till Manifold Concentration (pg/m3)
Analyte
Cycle 1 Cycle 2 Cycle 3
Initial q :̂ 12/13/2016
On 2 hr
12/20/2016On 24 hr On 72 hr
12/21/2016 12/23/2016
On 1 wk qjj
12/27/2016
On 2 hr 1/3/2017
On 24 hr 1/4/2017
On 72 hr 1/6/2017
On 1 wk Qß; 1/10/2017
On 2 hr 1/17/2017
On 24 hr
1/18/2017
On 72 hr
1/20/2017
On 1 wk
1/24/2017
trans-1,3-Dichloropropene ND ND ND ND ND ND ND ND ND ND ND ND ND1,1,2-Trichloroethane 20 20 12 12 14 11 5.4 4.7 8 7.4 7.1 14 8.7Tetrachloroethene 220 240 140 96 92 120 50 45 63 78 58 76 552-Hexanone ND ND ND ND ND ND ND ND ND ND ND ND NDDibromochloromethane ND ND ND ND ND ND ND ND ND ND ND ND ND1,2-Dibromoethane (EDB) ND ND ND ND ND ND ND ND ND ND ND ND NDChlorobenzene ND ND ND ND ND ND ND ND ND ND ND ND NDEthyl Benzene ND ND ND ND ND ND ND ND ND ND ND ND NDm,p-Xylene ND ND ND ND ND ND ND ND ND ND 4.3 4.3 NDo-Xylene ND ND ND ND ND ND ND ND ND ND ND ND NDStyrene ND ND ND ND ND ND ND ND ND ND ND ND NDBromoform ND ND ND ND ND ND ND ND ND ND ND ND NDCumene ND ND ND ND ND ND ND ND ND ND ND ND ND1,1,2,2-Tetrachloroethane ND ND ND ND ND ND ND ND ND ND ND ND NDPropyl benzene ND ND ND ND ND ND ND ND ND ND ND ND ND4-Ethyltoluene ND ND ND ND ND ND ND ND ND ND ND ND ND1,3,5-T rimethylbenzene ND ND ND ND ND ND ND ND ND ND ND ND ND1,2,4-T rimethylbenzene ND ND ND ND ND ND ND ND ND ND ND ND ND1,3-Dichlorobenzene ND ND ND ND ND ND ND ND ND ND ND ND ND1,4-Dichlorobenzene ND ND ND ND ND ND ND ND ND ND ND ND NDalpha-Chlorotoluene ND ND ND ND ND ND ND ND ND ND ND ND ND1,2-Dichlorobenzene ND ND ND ND ND ND ND ND ND ND ND ND ND1,2,4-T richlorobenzene ND ND ND ND ND ND ND ND ND ND ND ND NDHexachlorobutadiene ND ND ND ND ND ND ND ND ND ND ND ND ND
Chlorinated Organics (pg/m3) 1,208 772 400 297 285 478 183 152 203 324 192 225 158Non-chlorinated Organics (pg/m3) 44 0 0 61 0 0 0 35 0 18 72 108 0Total Organics (pg/m3) 1,252 772 400 358 285 478 183 187 203 342 265 333 158
Notes:ND = analyte not detected VOC = volatile organic compound
Integral Consulting Inc. Page 2 o f 2

SVE Shutdown Evaluation ReportFormer Ashland Lease Area June 19,
Table 2. VOCs Measured (Method TQ-15) in the Alluvium Manifold
Alluvium Manifold Concentration (uq/m3)
Analyte
Cycle 1 Cycle 2 Cycle 3Initial Qff
12/14/2016On 2 hr
12/20/2016On 24 hr
12/21/2016 'On 72 hr
12/23/2016On 1 wk
12/27/2016O ff On 2 hr
1/3/2017On 24 hr 1/4/2017
On 72 hr
1/6/2017On 1 wk On 2 hrOff
1/10/2017 1/17/2017On 24 hr 1/18/2017
On 72 hr 1/20/2017
On 1 wk
1/24/2017Freon 12 3.6 10 9.7 9 9.2 4.3 ND ND 4.6 ND ND ND 5.2Freon 114 ND ND ND ND ND ND ND ND ND ND ND ND NDChloromethane ND ND ND ND ND ND ND ND ND ND ND ND NDVinyl Chloride ND ND ND ND ND ND ND ND ND ND ND ND ND1,3-Butadiene ND ND ND ND ND ND ND ND ND ND ND ND NDBromomethane ND ND ND ND ND ND ND ND ND ND ND ND NDChloroethane ND ND ND ND ND ND ND ND ND ND ND ND NDFreon 11 ND ND ND ND ND ND ND ND ND ND ND ND NDEthanol J ND ND 6.1 ND ND ND ND ND ND ND ND 19 NDFreon 113 ND ND ND ND ND ND ND ND ND ND ND ND ND1,1-Dichloroethene ND ND ND ND ND ND ND ND ND ND ND ND NDAcetone ND ND ND ND ND ND ND ND ND ND ND 20 ND2-Propanol ND ND 8.7 ND ND ND ND ND 10 ND ND 8.9 NDCarbon Disulfide ND ND ND ND ND ND ND ND ND ND ND ND ND3-Chloropropene ND ND ND ND ND ND ND ND ND ND ND ND NDMethylene Chloride ND ND ND ND ND ND ND ND ND ND ND ND NDMethyl tert-Butyl Ether ND ND ND ND ND ND ND ND ND ND _ ND ND NDtrans-1,2-DichIoroethene ND ND ND ND ND ND ND ND ND ND ND ND NDHexane ND ND ND ND ND ND ND ND ND ND ND ND 3.11,1-Dichloroethane ND 8.5 7.1 5.4 4.4 ND ND ND ND ND ND ND ND2-Butanone (Methyl Ethyi Ketone) ND ND ND ND ND ND ND 15 ND ND ND 10 NDcis-1,2-Dichloroethene 6.7 23 19 16 13 5.6 ND ND ND ND 5.1 ND 6.1Tetrahydrofuran ND ND ND ND ND ND ND ND ND ND ND 2.3 NDChloroform ND ND ND ND ND ND ND ND ND ND ND ND ND1,1,1-Trichloroethane 33 180 150 100 66 33 ND 7.3 13 15 24 6.6 21Cyclohexane ND ND 6.6 ND ND ND ND ND ND ND ND ND NDCarbon Tetrachloride ND ND ND ND ND ND ND ND ND ND ND ND ND2,2,4-T rimethylpentane ND ND ND ND ND ND ND ND ND ND ND ND NDBenzene ND ND ND ND ND ND ND ND ND ND ND 3.8 ND1,2-Dichloroethane ND ND ND ND ND ND ND ND ND ND ND ND NDHeptane ND ND ND ND ND ND ND ND ND ND ND ND NDT richloroethene 170 730 620 460 400 170 34 42 80 70 140 37 1301,2-Dichloropropane ND ND ND ND ND ND ND ND ND ND ND ND ND1,4-Dioxane ND ND ND ND ND ND ND ND ND ND ND ND NDBromodichloromethane ND ND ND ND ND ND ND ND ND ND ND ND NDcis-1,3-Dichloropropene ND ND ND ND ND ND ND ND ND ND ND ND ND4-Methyl-2-Pentanone ND ND ND ND ND ND ND ND ND ND ND ND NDToluene ND ND ND ND ND ND ND ND ND ND ND ND ND
Integral Consulting Inc. Page 1 of 2

SVE Shutdown Evaluation ReportFormer Ashland Lease Area June 19, 2017
Table 2. VOCs Measured (Method TO-15) in the Alluvium Manifold
Alluvium Manifold Concentration (pg/m3)
Analyte
Cycle 1 Cycle 2 Cycle 3
Initial Utt12/14/2016
On 2 hr
12/20/2016
On 24 hr On 72 hr
12/21/2016 12/23/2016
On 1 wk 12/27/2016
off 0 n 2 h r1/3/2017
On 24 hr 1/4/2017
On 72 hr 1/6/2017
On 1 wk o ff
1/10/2017
On 2 hr 1/17/2017
On 24 hr
1/18/2017
On 72 hr 1/20/2017
On 1 wk 1/24/2017
trans-1,3-Dichloropropene ND ND ND ND ND ND ND ND ND ND ND ND ND1,1,2-Trichloroethane 6.7 23 18 15 13 7.6 ND ND 5.5 ND 6.7 ND 4.5T etrachloroethene 70 310 240 190 160 88 30 32 46 45 77 26 622-Hexanone ND ND ND ND ND ND ND ND ND ND ND ND NDDibromochloromethane ND ND ND ND ND ND ND ND ND ND ND ND ND1,2-Dibromoethane (EDB) ND ND ND ND ND ND ND ND ND ND ND ND NDChlorobenzene ND ND ND ND ND ND ND ND ND ND ND ND NDEthyl Benzene ND ND ND ND ND ND ND ND ND ND ND ND NDm.p-Xylene ND ND ND ND ND ND ND ND ND ND ND ND NDo-Xylene ND ND ND ND ND ND ND ND ND ND ND ND NDStyrene ND ND ND ND ND ND ND ND ND ND ND ND NDBromoform ND ND ND ND ND ND ND ND ND ND ND ND NDCumene ND ND ND ND ND ND ND ND ND ND ND ND ND1,1,2,2-Tetrachloroethane ND ND ND ND ND ND ND ND ND ND ND ND NDPropylbenzene ND ND ND ND ND ND ND ND ND ND ND ND ND4-Ethyltoluene ND ND ND ND ND ND ND ND ND ND ND ND ND1,3,5-Trimethylbenzene ND ND ND ND ND ND ND ND ND ND ND ND ND1,2,4-Trimethylbenzene ND ND ND ND ND ND ND ND ND ND ND ND ND1,3-Dichlorobenzene ND ND ND ND ND ND ND ND ND ND ND ND ND1,4-Dichlorobenzene ND ND ND ND ND ND ND ND ND ND ND ND NDalpha-Chlorotoluene ND ND ND ND ND ND ND ND ND ND ND ND ND1,2-Dichlorobenzene ND ND ND ND ND ND ND ND ND ND ND ND ND1,2,4-T richlorobenzene ND ND ND ND ND ND ND ND ND ND ND ND NDHexachlorobutadiene ND ND ND ND ND ND ND ND ND ND ND ND ND
Chlorinated Organics (pg/m3) 290 1,285 1,064 795 666 309 64 81 149 130 253 70 229Non-chlorinated Organics (pg/m3) 0 0 21 0 0 0 0 15 10 0 0 64 3Total Organics (|jg/m3) 290 1,285 1,085 795 666 309 64 96 159 130 253 134 232
Notes:ND = analyte not detected VOC = volatile organic compound
Integral Consulting Inc. Page 2 o f 2

SVE Shutaown Evaluation ReportFormer Ashland Lease Area June 19, 2017
Table 3. Summary of SVE Shutdown Evaluation Results
Cycle andTotal VOCs
(pg/m3)Flow Rate (SCFM)
Instantaneous Removal Rate
(lb/hr)Mass Removed
(lb)
TimeInterval
(hr)
Average Cycle Removal Rate
(lb/hr)Sample Date Sample Time Till Alluvium Till Alluvium Till Alluvium Till Alluvium Till Alluvium12/13/2016, 12/14/2016a
Initial 1,252 290 120 467 0.00056 0.00051 - - - -
Cycle 1 - Off 1 wk - - - - 0 0 0 0 142.812/20/2016 Cycle 1 - On 2 hr 772 1,285 59 480 0.00017 0.00231 0.0004 0.0050 2.212/21/2016 cycle 1 - Un 24 hr 4UU 1,U8b U.UUU1U U.00191 0.0029 0.0463 21.912/23/2016 Cycle 1 - On 72 hr 358 795 b b 0.00009 0.00140 0.0044 0.0790 47.612/27/2016 Cycle 1 - On 1 wk 285 666 70 461 0.00007 0.00115 0.0079 0.1247 97.6
Cycle 1 - Sum 0.0155 0.2549 312.1 0.00005 0.00082Cycle 2 - Off 1 wk - - - - 0 0 0 0 165.0
1/3/2017 Cycle 2 -On 2 hr 478 309 75 430 0.00013 0.00050 0.0003 0.0010 2.01/4/2017 Cycle 2 - On 24 hr 183 64 b b 0.00005 0.00010 0.0022 0.0072 24.01/6/2017 Cycle 2 - On 72 hr 187 96 b b 0.00005 0.00016 0.0025 0.0063 48.01/10/2017 Cycle 2 - On 1 wk 203 159 78 441 0.00006 0.00026 0.0053 0.0197 93.8
Cycle 2 - Sum 0.0104 0.0342 332.8 0.00003 0.00010Cycle 3 - Off 1 wk - - - - 0 0 0 0 168.4
1/17/2017 Cycle 3 - On 2 hr 342 130 90 431 0.00012 0.00021 0.0002 0.0004 2.01/18/2017 Cycle 3 - On 24 hr 265 253 b b 0.00008 0.00043 0.0023 0.0075 23.31/20/2017 Cycle 3 - On 72 hr 333 134 b b 0.00010 0.00023 0.0042 0.0149 45.51/24/2017 Cycle 3 - On 1 wk 158 232 74 475 0.00004 0.00041 0.0070 0.0304 95.0
Cycle 3 - Sum 0.0137 0.0532 334.2 0.00004 0.00016Shutdown Test Average Removal Rate
Asymptotic Average Removal Rate0.00004 0.00036 0.00094 0.00420
Notes:SCFM = standard cubic feet per minute SVE = soil vapor extraction VOC = volatile organic compound -- = not availableNondetected values were not included in the total VOCs sum.
a Due to receipt of a sample canister without vacuum, the till sample was collected on 12/13/2016 and the alluvium sample was collected on 12/14/2016. The first rebound cyclewas begun on 12/14/2016 and is therefore 6 days in length.
b Flow rates were not recorded for 24-hr and 72-hr samples. An average of the 2-hr and 1-wk cycle samples was used to calculate mass removal rates.
Integral Consulting Inc. Page l o f i

SVE Shutdozvn Evaluation Report
Former Ashland Lease Area June 19, 2017
Table 4. Concentrations of Trichloroethene (TCE) in Shallow Monitoring Point T-VM-4S
System Operating StatusSamplingLocation Sampling Date
TCE Concentration (M/m3) Alluvium SVE Till SVE
7/16/2013 ND On On
9/24/2013 5.3 Off On
12/18/2013 ND Off OnT-VM-4S 3/31/2014 ND Off On
6/23/2014 ND Off On
9/9/2014 5.2 Off On
12/6/2016 96 Off On
Notes:ND = non-detectSVE = soil vapor extraction
Integral Consulting Inc. Page 1 o f I

A ppen d ix A
A n a l y t ic a l D a t a R e p o r t s
( F o u n d o n A c c o m p a n y i n g D i s c )

Project No.: C594-0200
May 21, 2018
prepared for Ashland Inc.
2017 S it e R e m e d ia t io n R e p o r t Former Ashland Lease Area
Soo Line Shoreham YardAppendix A: SVE Shutdown Evaluation Report
Appendix H: Analytical Data Reports

A p p e n d ix B
A ir E m is s io n s S c r e e n in g

Æ & Minnesota Pollution Petroleum Remediation Program Air Emissions Screening SpreadsheetControl Agency So¡l vapor Extraction (SVE) and/or Air Stripper (AS) Data Input Worksheet
Doe Typ»: Corrective Action Design
MPCA Leak ID Enter SVE Standard Parameters Enter AS Standard Parameters
Sample Date 3/27/2017 Distance to Nearest Receptor (feet) 0 Distance to Nearest Receptor (feet)
Person Completing Worksheet M Marietta, Inteqral Consulting SVE Stack Height (foot) 12.0 Air Stripper Stack Height (feet)
Notes For non-detocts. used N D 0 SVE Slack Flow Rato (SCFM1): 2346 Air Stopper Influent Flow Rate (L/s):
Enter SVE Modeling Parameters (if a aplicable) Entor AS Modeling Parameters (If applicable)SVE Stack Diameter (inches) AS Stack Diameter (inches)
SVE Stack Exit Velocity' (feet per second) AS Stack Exjt V e lo c * / (feet per second)SVE Stack Exit Temperature (*F): AS Stack Exit Temporature (*F)
SVE Annual Dispersion Factor ((pg/m3)/g/s) C ontad MPC A AS Annual Dispersion Factor ((pfl/rrv')/g/s) Contact MPCA
SVE 1-hr Dispersion Factor ((pg/m3Vg/s) Contact MPC.A AS 1-hr Dispersion Factor ((pg/mJy 3/S) Contee. MPCA
Chemical Name C AS#SVE Emission Concentration
(ug/m5)
SVE Emission Rate (pg/sec)
AS Influent Groundwater
Concentration(pg/L)
AS Effluent Groundwater Concentration
(pg/L)
RemovalFactor
(dmiension-less)
AS Em&sron Rate (pg/sec)
Acetone 67-64-1Benzene 71-43-2 8 8
Benzyl chlonde 100-44-7Bromodichloromethane 75-27-4Bromoform 75-25-2Bromomethano (Methyl bromide) 74-83-91,3-Butadiene 106-99-02-Butanone (Methyl othyt kotono, MEK) 78-93-3Carbon disulfide 75-15-0Carbon tetrachloride 56-23-5Chlorobenzene 108-90-7Chloroethane (Ethyl chloride) 75-00-3Chloroform 67-66-3Chloromethano (Methyl chloride) 74-87-3Cyclohexane 110-82-7Dibromochloromothane 124-48-11 2-Dibromoothano (Ethylenedibromxte. EDB) 106-93-41,2-Dichlorobenzene 95-50-11,3-Dichlorobenzene 541-73-11,4-Dichlorobonzene 106-46-7t,1-Dichloroethano 75-34-31,2-Dichloroethano (DCA) 107-06-21,1-Dichloroothone (DCE) 75-35-4cis-1 2-Dichloroetheno 156-59-2trans-1,2-Dichloroothene 156-60-5Drchlorodifluoromethane (Freon 12) 75-71-81,2-Dichloropropane 78-87-5cis-1,3-Dichloropropene 10061-01-5trans-1,3-Dichloropropene 10061-02-6Dlchlorotetralluoroethane (Freon 114) 78-14-2Ethanol 64-17-5Ethyl acetate 141-78-6Ethyl benzene 100-41-44-Ethyttoluene 622-988n-Heptane 142-82-5Hexachloro-1,3-butadlene 87-683n-Hexane 11854-32-Hexanone (Methyl butvi ketone) 501-7864-Methyt-2-pentanono (Methyl isobutyl ketone. MIBK) 108181Methylene chlonde (Dichloromethane) 7509-2Methyl-tert-butyl other (MTBE) 1834-04-4Naphthalene 01-2832-Propanol (Isopropyl alcohol) 67-650Propylene (mothylothytene or propono) 115-07-1Styrene 10842-51.1,2.2-T etrachloroethane 7834-5Tetrachloroethylono (PCE) 127-184 28 29Tetrahydrofuran 1 0 8 9 8 9Toluene (Methytbenzene) 10 8 8 8 3 5 51.2.4-T rlchlorobonzene 120-82-11.1.1 -Trichloroothane ( Methyl chloroform ) 71-556 18 201.1,2-T richloroethano 7 8 0 8 5Trichloroethyteno (TCE) 7801-8 40 44Tnchlorofluoromethane (Freon 11) 7569-4Tnchlorotrifluoroethane (Freon 113) 7 8 1 5 11,2.4-Trimethylbonzone 95-6561,3,5-T nmelhylbenzone 10867-8Vinyl acetato 108-05-4Vinyl chloride 75-01-4mSp-Xytene 1 0 8 3 8 3o-Xytene 9 5 4 7 6
'SCFM = standard cubic feet per minute based on a standard temperature of 77* F (25 ' C, 298.15 K) and a standard pressure of 1 atmosphere (14 7 pounds per square inch. 29.92 inches o f mercury, 760 millimeters of mercury).
'Provide stack exit velocity for actual exit conditions (I.e.. at the actual temperature and pressure o f the air being discharged)
C-prp7-09bMinnesota Pollution Control Agency • 520 Lafayette Rd. N., St. Paul. MN 55155-4194 • www.pca.slate.mn.us
651-296-6300 • 800-657-3864 • TTY 651-282-5332 or 800-657-3864 • Available in alternative formatsPage 3 of 5
6/14/11

Soil V apo r E x tra c tio n an d/o r A ir S tr ip p e r R isk E v a lu a tio n W o rk s h e e tDoc Type Corrective Action Design
MPCA Leak ID Sample Date 3/27/2017Person Completing Worksheet M. Manetta. Integral Consulting
Petroleum Remediation Program Air Emissions Screening Spreadsheet© Minnesota Pollution Control Agency
Chemical Name
Acute Mixtures Evaluation
CAS# AcuteHazard
QuotientCNS IRRIT REPRO
Acetone 67-64-1Benzene 71-43-2 0 0 0.0Benzyl chlonde 100-44-7Bromodichloro methane 75-27-4Bromoform 75-25-2Bromomethane (Methyl bromide) 74-83-91.3-Butadiene 106-99-02-8utanone (Methyl ethyl ketone. MEK) 78-93-3Carbon disulfide 75-15-0Carbon tetrachlonde 56-23-5Chlorobenzene 108-90-7Chloroethane (Ethyl chloride) 75-00-3Chloroform 67-66-3Chloromethane (Methyl chloride) 74-87-3Cyclohexane 110-82-7Dibromochloromethane '24-46-'1.2-Oibromoethane (Ethylene dibromide. EDB) 106-93-41 2-Dichlorobenzene 95-50-11 3-Dichlorobenzene 541-73-11,4-Dichlorobenzene 106-46-71,1-Dichloroethane 75-34-31.2-Dichloroethane (DCA) 107-06-21,1-Dichloroethene (DCE) 75-35-4cis-1,2-Dichloroethene 156-59-2trans-1,2-Oichloroethene 156-60-5Dichlorodifluoromethane (Freon 12) 75-71-81.2-Dichloropropane 78-87-5cis-1.3-Dtchloropropene' 10061-01-5trans-1,3-Dichloropropene* 10061-02-6Dichlorotetralluoroethane (Freon 114) 76-14-2Ethanol 64-17-5Ethyl acetate 141-78-6Ethylbenzene 100-41-44-£thyltoluene 622-96-8n-Heptane 142-82-5Hexachloro-1.3-butadiene 87-68-3n-Hexane 110-54-32-Hexanone (Methyl butyl ketone) 591-78-64-Methyl-2-pentanone (Methyl isobutyl ketone. MIBK) 108-10-1Methylene chloride (Dichloromethane) 75-09-2Methyl-tert-butyl ether (MT8E) 1634-04-4Naphthalene 91-20-32-Propanol (Isopropyl alcohol) 67-63-0Propylene (methylethylene or propene) 115-07-1Styrene 100-42-5
Chronic Noncancer Mixtures EvaluationChronic
N o n c a n c e r
HazardQuotient
CNS CV/BLD IMMUN KIDN LIVER/GI REPRO RESPWHOLE
BODY
0.0 0.0 0.0
_
Excess Lifetime
Cancer Risk (guideline
value = 1E-5)
4E-08
c-prp7-09bMinnesota Pollution Control Agency • 520 Lafayette Rd. N., St. Paul. MN 55155-4194 • www.pca.state.mn.us
651-296-6300 • 800-657-3864 • TTY 651-282-5332 or 800-657-3864 • Available in alternative formatsPage 4 of 5
6/14/11

© Minnesota Pollution Control Agency
MPCA Leak ID:Sample Date: 3/27/2017Person Completing Worksheet M. Marietta. Integral Consulting
Soil V apo r E x tra c tio n an d/o r A ir S tr ip p er R isk E va lu a tio n W o rk s h e e tDoc Type Corrective Action Design
Petroleum Remediation Program Air Emissions Screening Spreadsheet
Chemical Name CAS#
Acute Mixtures Evaluation
AcuteHazard
QuotientCNS IRRIT REPRO
1,1,2,2-Tetrachloroethane 79-34-5Tetrachloroethylene (PCE) 127-18-4 0.0 0.0 0.0Tetrahydrofuran 109-99-9Toluene (Methytbenzene) 108-88-3 0 0 0.0 0.01,2.4-T nchlorobenzene 120-82-11.1,1-Trichloroethane (Methyl Chloroform) 71-55-6 0.0 0.01.1,2-Trichloroethane 79-00-5Trichloroethylene (TCE) 79-01-6 0.0 0.0Tnchlorofluoromethane |Freon 11) 75-69-4Tnchlorotrifluoroethane (Freon 113) 76-13-11,2.4-T nmethylbenzene 95-63-61,3,5-Tnmethylbenzene 108-67-8Vinyt acetate 108-05-4Vinyt chlonde 75-014m&p-Xylene" 108-38-3o-Xylene" 9547-6
H a z a rd In d e x : 0 .0 0.0 0 .0
NOTES
* based on 1,3-Dichloropropene (CAS # 542-75-6) " based on total Xylenes (CAS # 1330-20-7)
Chronic Noncancer Mixtures EvaluationChronic
t Joncancer Hazard
Quotient
CNS CV/BLD IMMUN KIDN LIVER/GI REPRO RESPWHOLEBODY
0.0 0.0
0.0 0.0
0.0 0.0
0.0 0.0
0.0 0.0 0.0 0.0 0.0 0.0 0.0 0.0
Excess Lifetime
Cancer Risk (guideline
value = 1E-5)
3E-08
4.3E-07
In general, total excess lifetime cancer risk is not to exceed 1E-5 and a hazard index (or chemical-specific hazard quotient) is not to exceed 1. The additive results are shown with one decimal point, which is intended to show transparency with the addition of risk but not to imply a level of precision greater than one significant figure. Risk managers may want to round to one significant figure when comparing to a cancer nsk of 1 E-5 or a hazard index of 1. Exceedance of these levels, which are bolded in text when met or exceeded, may require air emission controls.
CNS = Central Nervous SystemCV/BLD = Cardiovascular or Blood SystemIMMUN = Immune SystemIRRIT = Irritant (nasal, eye. throat imtation)KIDN = KidneyLIVER/GI = Liver/GastrointestinalREPRO = Reproductive System, including developmental effects RESP = Respiratory System
c-prp7-09bMinnesota Pollution Control Agency • 520 Lafayette Rd. N.. St. Paul. MN 55155-4194 • www.pca.state.mn.us
651-296-6300 • 800-657-3864 • TTY 651-282-5332 or 800-657-3864 • Available in alternative formatsPage 5 of 5
6/14/11

Minnesota PollutionControl Agency
Petroleum Remediation Program Air Emissions Screening SpreadsheetSoil Vapor Extraction (SVE) and/or Air Stripper (AS) Data Input Worksheet
________________________________________________________ Doc Typo: Correctivo Action Design
MPCA Leak ID Enter SVE Standard Parameters Enter AS Standard Parameters
Sample Date 6721/2017 Distance to Nearest Receptor (feet) 0 Dstanco to Nearest Receptor (feet)
Person Completing Worksheet M Marietta. Integral Consulting SVE Stack Hexjht (feet) 120 Air Shipper Stack Height (feet):
Notes: For non-detects, used ND=0 SVE Stack Flow Rate (SCFM ) 1019 Air Stripper Influent Flow Rate (L/s):
Enter SVE Modeling Parameters ( if applicable) Enter AS Modeling Parameters (it applicable)
SVE Stack Diameter (inches) AS Stack Diameter (inches):
SVE Stack Exit Velocity' (feet per second) AS Stack Ex* Velocity' (feet per second)SVE Stack Exit Temperature (*F): AS Stack Exit Temperature ( ”F)
SVE Annual Dispersion Factor ((pg/m ’ )/g/s) Contact MPCA AS Annual Dispersion Factor ((pg/m3)/g/s) Contact MPCA
SVE 1-hr Dispersion Factor ((pg/m3)/g/s) Centnct MPCA AS t-hr Disporskm Factor ((pg/m3)/ * > Contact: MPCA
Chemical Name CAS#SVE Emission Concentration
(pg/m3)SVE Emission Rate
(pg/sec)
AS Influent Groundwater Concentration
(Mt»7L)
AS Effluent Groundwater Concentration
(PflfL)
RemovalFactor
(dimension-less)
AS Emission Rate (pg/sec)
Acetone 67-64-1
Benzene 71-43-2 8 4
Benzyl chloride 100-44-7Bromodichloromethane 75-27-4Bromoform 75-25-2Bromomethane (Methyl bromide) 74-83-91,3-Butadiene 106-9902-Butanone (Methyl olhyt kotono, MEK) 78-93-3Carbon disulfide 75-15-0Carbon tetrachlonde 56-23-5Chlorobenzene 108-90-7Chloroethane (Ethyl chloride) 75-00-3Chloroform 67-60-3Chloromethane (Methyl chlonde) 74-87-3Cyctohexane 110-82-7Dibromochloromethane 124-48-11,2-Dibromoethane (Ethylene dibromide. EDB) 106-93-41,2-Dichlo no benzene 95-50-11,3-Dichlorobenzeno 541-73-11,4-Dichloro benzene 106-46-71,1-Dichloroethane 75-34-31,2-Dichloroethano (DCA) 107-06-21,1-Dlchloroethene (DCE) 75-35 4cis-1,2-Dichloroethene 156-59-2trans-1,2-Dichloroethene 156-60-5Dichlorodifluoromethane (Freon 12) 75-71-81,2-Dichloro pro pane 78-87-5cis-1,3-Dichloropropeno 10061-01-5bans-1,3-Dichloropropone 10061-02-6Dichtorotebaftuoroethane (Freon 114) 76-14-2Ethanol 64-17-5Ethyl acetate 141-78-8Ethyl benzene 100-41-4 23 114-Ethyttoluene 622-00-8 13 6
n-Heptane 142-82-5Hexachloro-1,3-butadione 87-08-3n-Hexane 110-54-32-Hexanone (Methyl butyl kolone) 501-78-84-Methvl-2-pentanone(Methvl isobutyl ketone. MIBK) 108-10-1Methylene chloride (Dichloromethano) 75-09-2Methyl-terl-butyl ether (MTBE) 1634-04-4Naphthalene 91-20-32-Propanol (Isoptopyl alcohol) 67-63-0Propylene (methylolhylono or propene) 115-07-1Styrene 100-42-51.1,2.2-T etrachloroethano 79-34-5Totrachloroethyleno (PCE) 127-18-4Tetrahydrofuran 109-99-0 31 15Toluene (Methylbenzene) 108-883 80 331,2.4-T nchlorobenzono 120-82-11.1,1-Trichloroethane (Methyl chloroform) 71-55-6 30 141.1.2-Trichloroethane 79-00-5Tnchloroethylene (TCE) 79-01-6 67 32Trichlorofluoromethano (Froon 11) 7569-4Tnchlorotriftuoroethane (Freon 113) 7813-11,2.4-T rimethytbenzene 9 5 6 3 6 13 61,3.5-T nmethylbenzone 10867-8Vinyl acetate 10805-4Vinyl chloride 7501-4m&p-Xyiene 1 0 8 3 8 3 65 31o-Xvlene 95-47-6 14 7
'SCFM = standard cubic leot por minute based on a standard temperature of 7 7 ' F (25‘ C, 298.15 K) and a standard pressure o f 1 atmosphere ( 14.7 pounds per square inch. 29 92 inches of mercury, 760 millimeters of mercury)
'Provide stack exit velocity for actual exit conditions (i.e.. at the actual temperature and pressure of the air being discharged)
c-prp7-09bMinnesota Pollution Control Agency • 520 Lafayette Rd N,, St. Paul. MN 55155-4194 • www pca.state.mn.us
651-296-6300 • 800-657-3864 • TTY 651-282-5332 or 800-657-3864 • Available in alternative formatsPage 3 of 5
6/14/11

i Minnesota PollutionControl Agency
MPCA Leak ID Sample Date: 6/21/2017Person Completing Worksheet M. Marietta, Integral Consulting
Soil V ap o r E x tra c tio n an d /o r A ir S tr ip p e r R isk E v a lu a tio n W o rk s h e e tDoc Type. Corrective Action Design
Petroleum Remediation Program Air Emissions Screening Spreadsheet
Chemical Name CAS#
Acute Mixtures Evaluation
AcuteHazard
QuotientCNS IRRIT REPRO
Acetone 67-64-1Benzene 71-43-2 0.0 0.0Benzyl chloride 100-44-7Bromodichloromethane 75-27-4Bromoform 75-25-2Bromomethane (Methyl bromide) 74-83-91,3-Butadiene 106-99-02-Butanone (Methyl ethyl ketone, MEK) 78-93-3Carbon disulfide 75-15-0Carbon tetrachloride 56-23-5Chlorobenzene 108-90-7Chloroethane (Ethyl chloride) 75-00-3Chloroform 67-66-3Chloromethane (Methyl chloride) 74-87-3Cyclohexane 110-82-7Dibromochloromethane 124-48-11,2-Dibromoethane (Ethylene dibromide, EDB) 106-93-41,2-Dichlorobenzene 95-50-11,3-Dichlorobenzene 541-73-11,4-Dichlorobenzene 106-46-71,1-Dichloroethane 75-34-31,2-Dichloroelhane (DCA) 107-06-21,1-Dichloroethene (DCE) 75-35-4cis-1,2-Dichloroethene 156-59-2trans-1,2-Dichloroethene 156-60-5Dichlorodifluoromethane (Freon 12) 75-71-81,2-Dichloropropane 78-87-5cis-1,3-Dichloropropene‘ 10061-01-5trans-1,3-Dichloropropene* 10061-02-6Dichlorotetrafluoroethane (Freon 114) 76-14-2Ethanol 64-17-5Ethyl acetate 141-78-6Ethylbenzene 100-41-4 0.0 0.04-Ethyltoluene 622-96-8n-Heptane 142-82-5Hexachloro-1,3-butadiene 87-68-3n-Hexane 110-54-32-Hexanone (Methyl butyl ketone) 591-78-64-MethyF2-pentanone (Methyl isobutyl ketone. MIBK) 108-10-1Methylene chloride (Dichloromethane) 75-09-2Methyl-tert-butyl ether (MTBE) 1634-04-4Naphthalene 91-20-32-Propanol (Isopropyl alcohol) 67-63-0Propylene (methylethylene or propene) 115-07-1Styrene 100-42-5
Chronic Noncancer Mixtures EvaluationChronic
NoncancerHazardQuotient
CNS CV/BLD IMMUN KIDN LIVER/GI REPRO RESP WHOLEBODY
0.0 0.0 0.0
0.0 0.0
Excess Lifetime
Cancer Risk (guideline
value = 1E-5)
2E-08
7E-08
c-prp7-09bMinnesota Pollution Control Agency • 520 Lafayette Rd. N.. St. Paul, MN 55155-4194 • www.pca.state.mn.us
651-296-6300 ■ 800-657-3864 • TTY 651-282-5332 or 800-657-3864 • Available in alternative formatsPage 4 of 5
6/14/11

i Minnesota PollutionControl Agency
Soil V ap o r E x tra c tio n an d /o r A ir S tr ip p e r R isk E va lu a tio n W o rk s h e e tDoc Type Corrective Action Design
Petroleum Remediation Program Air Emissions Screening Spreadsheet
MPCA Leak ID:Sample Date: 6/21/2017Person Completing Worksheet M. Marietta. Integral Consulting
Chemical Name CAS#
Acute Mixtures Evaluation
AcuteHazard
QuotientCNS IRRIT REPRO
1,1,2,2-T etrachloroe thane 79-34-5Tetrachloroethylene (PCE) 127-18-4Tetrahydrofuran 109-99-9Toluene (Methylbenzene) 108-88-3 0.0 0.0 0.01,2.4-T nchlorobenzene 120-82-11,1,1-Trichloroethane (Methyl chloroform) 71-55-6 0.0 0.01,1,2-T richloroethane 79-00-5Trichloroethylene (TCE) 79-01-6 0.0 0.0Trichlorofluoromethane (Freon 11) 75-69-4Tnchlorotnfluoroethane (Freon 113) 76-13-11,2.4-T rimethylbenzene 95-63-61,3.5-Trimethylbenzene 108-67-8Vinyl acetate 108-05-4Vinyl chloride 75-01-4m&p-Xylene** 108-38-3 0.0 0.0 0.0o-Xylene'* 95-47-6 0.0 0.0 0.0
H azard In d e x : 0.0 0.0 0.0
Chronic Noncancer Mixtures EvaluationChronic
N o n c a n c e r
HazardQuotient
CNS CV/BLD IMMUN KIDN LIVER/GI REPRO RESP WHOLEBODY
0.0 0.0
0.0 0.0
0.0 0.0
0.0 0.0
0.0 0.00.0 0.0
0 .0 0 .0 0 .0 0 .0 0 .0 0 .0 0 .0 0 .0
Excess Lifetime
Cancer Risk (guideline
value = 1E-5)
NOTES:
* based on 1,3-Dichloropropene (CAS # 542-75-6) ** based on total Xylenes (CAS # 1330-20-7)
In general, total excess lifetime cancer nsk is not to exceed 1E-5 and a hazard index (or chemical-specific hazard quotient) is not to exceed 1. The additive results are shown with one decimal point, which is intended to show transparency with the addition of risk but not to imply a level of precision greater than one significant figure. Risk managers may want to round to one significant figure when comparing to a cancer risk of 1 E-5 or a hazard index of 1. Exceedance of these levels, which are bolded in text when met or exceeded, may require air emission controls.
CNS = Central Nervous SystemCV/BLD = Cardiovascular or Blood SystemIMMUN = Immune SystemIRRIT = Irritant (nasal, eye. throat irritation)KIDN = KidneyUVER/GI = Liver/GastrointestinalREPRO = Reproductive System, including developmental effects RESP = Respiratory System
c-prp7-09bMinnesota Pollution Control Agency • 520 Lafayette Rd, N., St. Paul, MN 55155-4194 • www.pca.state.mn.us
651-296-6300 • 800-657-3864 • TTY 651-282-5332 or 800-657-3864 • Available in alternative formatsPage 5 of 5
6/14/11

± Minnesota PollutionControl Agency
Petroleum Remediation Program Air Emissions Screening SpreadsheetSoil Vapor Extraction (SVE) and/or Air Stripper (AS) Data Input Worksheet
______________________ Doc Typo: Correctivo Action Design
MPCA Leak ID Enter SVE Standard Parameters Enter AS Standard Parameters
Sample Date 9/13/2017 Distance to Nearest Receptor (fe d ) 0 Distance to Nearest Receptor (feet)
Person Completing Workshoet M Marietta Integral Consulting SVE Stack Hexjht (fed ) 12.0 Air Stripper Stack Height (feet):
Notes For non-detects, used N D "0 SVE Stack Flow Rate (SCFM’ I 2566 Air Stripper Influent Flow Rate (L/s):
Enter SVE Modeling Parameters (if applicable) Enter AS Modeling Parameters (If applicable)SVE Stack Diameter (mchos) AS Stack Diameter (inches):
SVE Stack Exit V e lo c« / (foot pet second) AS Stack Exit Velocity' (feet per second)SVE Stack Exit Temperature ( ’ F), AS Stack Exit Temperature ( ’ F)
SVE Annual Dispersion Factor ((pg/m ’)/g/s) Confect MPCA AS Annual Dispersion Factor ((pg/m ’ Vg/s) Contact MPCA
SVE 1-hr Dispersion Factor ((pg/m ')/g/s) Contact MPCA AS 1-hr Dispersion Factor ((pg/m3)/8/s) Contact MPC. A
Chemical Name CAS«SVE Emission Concentration
(Pfl/m3)
SVE Emission Rate (pg/sec)
AS Influent Groundwater Concentration
(Mfl/L)
AS Effluent Groundwater Concentration
(pg/L)
RemovalFactor
(dimenson-less)
AS Emission Rate (pg/sec)
Acetone 67-04-1 22 27
Benzene 71-43-2Benzyl chloride 100-44-7Bromodichloromethane 75-27-4Bromoform 75-25-2Bromomethane (Methyl bromide) 74-B3-Q1,3-Butadiene 106-99-02-Butanone (Methyl olhyl ketone, MEK) 78-93-3Carbon disulfide 75-15-0Carbon tetrachloride 56-23-5Chlorobenzene 108-90-7Chloroethane (Ethyl chlonde) 75-00-3Chloroform 67-66-3Chloromethane (Methyl chloride) 74-87-3Cydohexane 110-82-7Dibromochloromethane 124-46-11,2-Dibromcoihano (Ethyleno dlbromide. EDB) 106-93-41,2-Dlchlorobenzene 95-50-11,3-Dichtorobenzone 541-73-11,4-Dichlorobenzene 106-46-71.1-Dlchloroethane 75-34-3 4 5
1,2-Dichloroethane (DCA) 107-06-2
Ò 8 m 75-35-4cis-1,2-Dichloroethene 156-59-2 10 12trans-1,2-Dichloroetheno 156-60-5Dchlorodifluoromethane (Froon 12) 75-71-81,2-Dichloropropane 78-87-5cis-1,3-Dichloropropene 10061-01-5bans-1,3-Dichloropropene 10061-02-6Dichlorotetrafluoroethane (Froon 114) 76-14-2Ethanol 64-17-5 12 15
Ethyl acetate 141-78-6Ethyl benzene 100-41-44-Ethyttoluene 622-96-8 5 6
n-Heptane 142-82-5Hexachloro-1.3-butadiene 87-68-3n-Hexane 110-54-32-Hexanone (Methyl butyl kotone) 591-7664-Methy!-2-pentar>one (Meltiyl eobutyl kotone. MIBK) 106161Methylene chloride (Dichloromethane) 75-09-2Methyl-tert-butyl ether (MTBE) 1634-04-4Naphthalene 01 -2632-Propanol (Isopropyl alcohol) 67-63-0Propylene (methytethylone or propene) 11607-1Styrene 10642-51.1,2,2-Tetrachloroothano 7634-5Tetrachloroethylene (PCE) 127-164 110 133Tetrahydrofuran 109-99-9Toluene (Methylbenzeno) 1 0 6 8 6 3 5 61,2,4-T richlorobenzene 12682-11,1,1 -Trichloioethane (Methyl chloroform) 71-55-8 95 1151,1,2-T richloroethane 79-065Trichloroethylene (TCE) 7601-8 260 315Thchloroffuoromethane (Froon 11) 75-664Trichlorotrifluoroethane (Freon 113) 7 6 1 6 11,2.4-T nmethylbenzene 95-668 9 111,3,5-T nmethylbenzene 10667-8Vinyl acetate 1 0 6 0 6 4Vmyl chloride 7601-4m&p-Xylene 1 0 6 3 6 3 10 12o-Xvlene 195-4 7-6 5 6
'SCFM = standard cubic feet per minute based on a standard temperature of 77 ' F (25* C, 298 15 K) and a standard pressure o f 1 atmosphere (14 7 pounds per square inch. 29.92 inches of mercury, 700 millimeters of mercury).
'Provide stack exit velocity for actual exit conditions (i.e.. at the actual temperature and pressure of the air being discharged)
C-prp7-09bMinnesota Pollution Control Agency • 520 Lafayette Rd. N , St. Paul. MN 55155-4194 • www.pca.state.mn.us
651-296-6300 • 800-657-3864 • TTY 651-282-5332 Of 800-657-3864 • Available in alternative formatsPage 3 of 5
6/14/11

® Minnesota Pollution Control Agency
MPCA Leak ID:Sample Date: 9/13/2017Person Completing Worksheet M Marietta, Integral Consulting
Soil V ap o r E x tra c tio n and/or A ir S tr ip p e r R isk E v a lu a tio n W o rk s h e e tDoc Type; Corrective Action Design
Petroleum Remediation Program Air Emissions Screening Spreadsheet
Chemical Name CAS#
Acute Mixtures Evaluation
AcuteHazard
QuotientCNS IRRIT REPRO
Acetone 67-64-1 0.0 0.0Benzene 71-43-2Benzyl chloride 100-44-7Bromodichloromethane 75-27-4Bromoform 75-25-2Bromomethane (Methyl bromide) 74-83-91,3-Butadiene 106-99-02-Butanone (Methyl ethyl ketone. MEK) 78-93-3Carbon disulfide 75-15-0Carbon tetrachlonde 56-23-5Chlorobenzene 108-90-7Chloroethane (Ethyl chloride) 75-00-3Chloroform 67-66-3Chloromethane (Methyl chloride) 74-87-3Cyclohexane 110-82-7Dibromochloromethane 124-48-11,2-Dibromoethane (Ethylene dibromide, EDB) 106-93-41,2-Dichlorobenzene 95-50-11,3-Dichlorobenzene 541-73-11,4-Dichlorobenzene 106-46-71,1-Dichloroethane 75-34-31,2-Dichloroethane (DCA) 107-06-21.1-Dichloroethene (DCE) 75-35-4cis-1,2-Dichloroethene 156-59-2trans-1,2-Dichloroethene 156-60-5Dichlorodifluoromethane (Freon 12) 75-71-81,2-Dichloropropane 78-87-5cis-1,3-Dichloropropene' 10061-01-5trans-1,3-Dichloropropene* 10061-02-6Dichlorotetrafluoroethane (Freon 114) 76-14-2Ethanol 64-17-5 0.0 0.0Ethyl acetate 141-78-6Ethylbenzene 100-41-44-Ethyltoluene 622-96-8n-Heptane 142-82-5Hexachloro-1,3-butadiene 87-68-3n-Hexane 110-54-32-Hexanone (Methyl butyl ketone) 591-78-64-Methyl-2-pentanone (Methyl isobutyl ketone. MIBK) 108-10-1Methylene chloride (Dichloromethane) 75-09-2Methyl-tert-butyl ether (MTBE) 1634-04-4Naphthalene 91-20-32-Propanol (Isopropyl alcohol) 67-63-0Propylene (methylethylene or propene) 115-07-1Styrene 100-42-5
Chronic Noncancer Mixtures EvaluationChronic
NoncancerHazard
Quotient
CNS CV/BLD IMMUN KIDN LIVER/GI REPRO RESP WHOLEBODY
0.0 0.0
0.0 0.0
0.0 0.0
Excess Lifetime
Cancer Risk (guideline
value = 1E-5)
-prp7-09bMinnesota Pollution Control Agency • 520 Lafayette Rd. N., St. Paul. MN 55155-4194 • www.pca.state.mn.us
651-296-6300 • 800-657-3864 • TTY 651-282-5332 or 800-657-3864 • Available in alternative formatsPage 4 of 5
6/14/11

© Minnesota Pollution Control Agency
MPCA Leak ID Sample Date. 9/13/2017Person Completing Worksheet: M. Marietta. Integral Consulting
Soil V a p o r E x tra c tio n and/or A ir S tr ip p e r R isk E v a lu a tio n W o rk s h e e tDoc Type: Corrective Action Design
Petroleum Remediation Program Air Emissions Screening Spreadsheet
Chemical Name CAS#
Acute Mixtures Evaluation
AcuteHazard
QuotientCNS IRRIT REPRO
1,1,2,2-T etrachloroethane 79-34-5Tetrachloroethylene (PCE) 127-18-4 0.0 0.0 0.0Tetrahydrofuran 109-99-9Toluene (Methylbenzene) 108-88-3 0.0 0.0 0.01 2,4-Trichlorobenzene 120-82-11.1,1-Tnchloroethane (Methyl Chloroform) 71-55-6 0.0 0.01,1,2-T richloroethane 79-00-5Trichloroethylene (TCE) 79-01-6 0.0 0.0Trichlorofiuoromethane (Freon 11) 75-69-4Trichlorotrifiuoroethane (Freon 113) 76-13-11,2,4-Trimethylbenzene 95-63-61,3,5-Trimethylbenzene 108-67-8Vinyl acetate 108-05-4Vinyl Chloride 75-01-4m&p-Xylene" 108-38-3 0.0 0.0 0.0o-Xylene" 95-47-6 0.0 0.0 0.0
H a z a rd In d e x : 0.0 0.0 0 .0
NOTES:
* based on 1,3-Dichloropropene (CAS # 542-75-6) * ' based on total Xylenes (CAS # 1330-20-7)
Chronic Noncancer Mixtures EvaluationChronic
NoncancerHazardQuotient
CNS CV/BLD IMMUN KIDN LIVER/GI REPRO RESPWHOLEBODY
0.0 0.0
0.0 0.0
0.0 0.0
0.0 0.0
0.0 0.0
0.0 0.00.0 0.0
0.0 0.0 0.0 0.0 0.0 0.0 0.0 0.0
Excess Lifetime
Cancer Risk (guideline
value = 1E-5)
2E-07
2E-06
In general, total excess lifetime cancer nsk is not to exceed 1E-5 and a hazard index (or chemical-specific hazard quotient) is not to exceed 1. The additive results are shown with one decimal point, which is intended to show transparency with the addition of risk but not to imply a level of precision greater than one significant figure. Risk managers may want to round to one significant figure when comparing to a cancer nsk of 1E-5 or a hazard index of 1. Exceedance of these levels, which are bolded in text when met or exceeded, may require air emission controls.
CNS = Central Nervous SystemCV/BLD = Cardiovascular or Blood SystemIMMUN = Immune SystemIRRIT = Irritant (nasal, eye, throat irritation)KIDN = KidneyLIVER/GI = Liver/GastrointestinalREPRO = Reproductive System, including developmental effects RESP = Respiratory System
c-prp7-09bMinnesota Pollution Control Agency • 520 Lafayette Rd. N.. St. Paul. MN 55155-4194 • www.pca.state.mn.us
651-296-6300 • 800-657-3864 • TTY 651-282-5332 or 800-657-3864 • Available in alternative formatsPage 5 of 5
6/14/11

r g Minnesota Pollution Petroleum Remediation Program Air Emissions Screening SpreadsheetControl Agency Soil Vapor Extraction (SVE) and/or Air Stripper (AS) Data Input Worksheet
Doc Type Correctivo Action Design
MPCALeak ID: Enter SVE Standard Parameters Enter AS Standard Parameters
Sample Date: 12/6/2017 Distance to Nearest Receptor (feet) 0 Distance to Nearest Receptor (feet)
Person Completing Worksheet M Marietta, Integral Consulting SVE Stack Height (feet) 12.0 Air Stripper Stack Height (feet):
Notes: For non-detects, used ND=0 SVE Stack Flow Rate (SCFM') 2548 Air Stripper Influent Flow Rale (L/s):
Enter SVE Modeling Parameters (if a aplicable) Enter AS Modeling Parameters (if applicable)SVE Stack Diameter (Inches) AS Stack Diameter (inches):
SVE Slack Exit Velocity2 (feel per second) AS Stack Exit Velocity2 (feel per second):SVE Stack Exit Temperature (°F) AS Stack Exit Temperature ("F)
SVE Annual Dispersion Factor ((pg/m3)/g/s) Confaci MPCA AS Annual Dispersion Factor ((pg/m',)/g/s) Confaci MPCA
SVE 1-hr Dispersion Factor ((pg/mJ)/g/s) Contact MPCA AS 1-hr Dispersion Factor ((pg/m3y a/s) Contact MPCA
Chemical Name CAS#SVE Emission Concentration
(pg/m3)SVE Emission Rate
(pg/sec)
AS Influent Groundwater Concentration
(mq/l )
AS Effluent Groundwater Concentration
(mq/l )
RemovalFactor
(dimension-less)
AS Emission Rale (pg/sec)
Acetone 67-64-1
Benzene 71-43-2Benzyl chloride 100-44-7Bromodichloromethane 75-27-4Bromoform 75-25-2Bromomethane (Methyl bromide) 74-83-91,3-Butadiene 106-99-02-Butanone (Methyl ethyl ketone. MEK) 78-93-3Carbon disulfide 75-15-0Carbon tetrachloride 56-23-5Chlorobenzene 108-90-7Chloroethane (Ethyl chloride) 75-00-3Chloroform 67-66-3Chloromethane (Methyl chloride) 74-87-3Cyclohexane 110-82-7Dibromochloromethane 124-48-11,2-Dibromoothane (Ethylene dibromido, EDB) 106-93-41,2-Dicblorobenzene 95-50-11,3-Dichlorobenzene 541-73-11,4-Dichlorobenzene 106-46-71,1-Dichloroethane 75-34-31,2-Dichloroelhane (DCA) 107-06-21,1-Dichloroelhene (DCE) 75-35-4cis-1,2-Dichloroethene 156-59-2 5 6
Irans-1,2-Dichloroethene 156-60-5Dichlorodifluoromethane (Freon 12) 75-71-81.2-Dichloropropane 78-87-5cis-1,3-Dichloropropene 10061-01-5trans-1,3-Dichloropropene 10061-02-6Dichloroletrafluoroethane (Freon 114) 76-14-2Ethanol 64-17-5Ethyl acetate 141-78-6Ethyl benzene 100-41-44-Ethyltoluene 622-96-8n-Heptane 142-82-5Hexachloro-1,3-butadiene 87-68-3n-Hexane 110-54-32-Hexanone (Methyl butyl ketone) 591-78-64-Methyl-2-pentanone (Melhyl isobutyl ketone, MIBK) 108-10-1Methylene chloride (Dichloromethane) 75-09-2Methyl-tert-butyl ether (MTBE) 1634-04-4Naphthalene 91-20-32-Propanol (Isopropyl alcohol) 67-63-0 10 11Propylene (methylethyteno or propene) 115-07-1Styrene 100-42-51,1,2,2-T etrachloroethane 79-34-5Tetrachloroethylene (PCE) 127-18-4 72 87Tetrahydrofuran 109-99-9 IToluene (Methylbenzene) 108-88-3 9 111,2,4-T richlorobenzene 120-82-11,1,1 -Trichloroethane (Methyl chloroform) 71-55-6 40 481.1,2-Trichloroethane 79-00-5Trichloioethyfene (TCE) 79-01-6 110 132Trichlorofluoromethane (Freon 11) 75-69-4Trichlorotrifluoroethane (Freon 113) 76-13-11,2,4-T rimethylbenzene 95-63-61,3,5-T rimethylbenzene 108-67-8Vinyl acetate 10B-05-4Vinyl chloride 75-01-4m&p-Xytene 108-38-3o-Xyfene 95-47-6
’SCFM = standard cubic foet per minute based on a standard temperature ot 77“ F (25” C. 298,15 K) and a standard pressure o f 1 atmosphere (14 7 pounds per square inch, 29.92 inches o f mercury, 760 millimeters of mercury).
2Provkfe stack exit velocity for actual exit conditions (i.e., at the actual temperature and pressure of the air being discharged).
c-prp7-09bMinnesota Pollution Control Agency ■ 520 Lafayette Rd. N . St. Paul, MN 55155-4194 • www.pca.state.mn.us
651-296-6300 • 800-657-3864 • TTY 651-282-5332 or 800-657-3864 • Available In alternative formatsPage 3 of 5
6/14/11

Soil V a p o r E x tra c tio n and/or A ir S tr ip p e r R isk E v a lu a tio n W o rk s h e e tDoc Type Corrective Action Design
MPCA Leak ID Sample Date 12/6/2017Person Completing Worksheet: M. Marietta. Integral Consulting
Petroleum Remediation Program Air Emissions Screening SpreadsheetMinnesota PollutionControl Agency
Chemical Name
Acute Mixtures Evaluation
CAS # AcuteHazardQuotient
CNS IRRIT REPRO
Acetone 67-64-1Benzene 71-43-2Benzyl chlonde 100-44-7Bromodichloromethane 75-27-4Bromoform 75-25-2Bromomethane (Methyl bromide) 74-83-91,3-Buladiene 106-99-02-Butanone (Methyl ethyl ketone. MEK) 78-93-3Carbon disulfide 75-15-0Carbon tetrachlonde 56-23-5Chlorobenzene 108-90-7Chloroethane (Ethyl chloride) 75-00-3Chloroform 67-66-3Chloromethane (Methyl chlonde) 74-87-3Cyclohexane 110-82-7Dibromochloro methane 124-48-11,2-Dibromoethane (Ethylene dibromide. EDB) 106-93-41,2-Dichlorobenzene 95-50-11,3-Dichlorobenzene 541-73-11,4-Dichlorobenzene 106-46-71,1-Dichloroethane 75-34-31.2-Dichloroethane (DCA) 107-06-21,1-Dichloroethene (DCE) 75-35-4cis-1,2-Dichloroethene 156-59-2trans-1,2-Dichloroethene 156-60-5Dichlorodifluoromethane (Freon 12) 75-71-81,2-Dichloropropane 78-87-5cis-1 3-Dichloropropene* 10061-01-5trans-1,3-Dichloropropene* 10061-02-6Dichlorotetrafluoroethane (Freon 114) 76-14-2Ethanol 64-17-5Ethyl acetate 141-78-6Ethylbenzene 100-41-44-Ethyltoluene 622-96-8n-Heptane 142-82-5Hexachloro-1,3-butadiene 87-68-3n-Hexane 110-54-32-Hexanone (Methyl butyl ketone) 591-78-64-Methyt-2-pentanone (Methyl isobutyl ketone, MI8K) 108-10-1Methylene chlonde (Dichloromethane) 75-09-2MethyHert-butyl ether (MTBE) 1634-04-4Naphthalene 91-20-32-Propanol (Isopropyl alcohol) 67-63-0 0.0 0.0Propylene (methylethylene or propene) 115-07-1Styrene 100-42-5
Chronic Noncancer Mixtures EvaluationChronic
NoncancerHazardQuotient
CNS CV/BLD IMMUN KIDN LIVER/GI REPRO RESPWHOLEBODY
0.0 0.0 0.0
Excess Lifetime
Cancer Risk (guideline
value = 1E-5)
c-prp7-09bMinnesota Pollution Control Agency • 520 Lafayette Rd. N.. St. Paul, MN 55155-4194 • www.pca.state.mn.us
651-296-6300 • 800-657-3864 • TTY 651-282-5332 or 800-657-3864 • Available in alternative formatsPage 4 of 5
6/14/11

© Minnesota Pollution Control Agency
MPCA Leak ID Sample Date: 12/6/2017Person Completing Worksheet: M. Marietta. Integral Consulting
S oil V a p o r E x tra c tio n and/or A ir S tr ip p e r R isk E v a lu a tio n W o rk s h e e tDoc Type Corrective Action Design
Petroleum Remediation Program Air Emissions Screening Spreadsheet
Chemical Name CAS#
Acute Mixtures Evaluation
AcuteHazard
QuotientCNS IRRIT REPRO
1,1,2,2-T etrachloroethane 79-34-5Tetrachloroethylene (PCE) 127-18-4 0.0 0.0 0.0Tetrahydrofuran 109-99-9Toluene (Methytbenzene) 108-88-3 0.0 0.0 0.01,2.4-T richlorobenzene 120-82-11,1,1-Trichloroethane (Methyl Chloroform) 71-55-6 0.0 0.01,1,2-Tnchloroethane 79-00-5Trichloroethylene (TCE) 79-01-6 0.0 0.0Trichlorofluoromethane (Freon 11) 75-69-4Trichlorotrifluoroethane (Freon 113) 76-13-11,2,4-T rimethylbenzene 95-63-61,3.5-T rimethylbenzene 108-67-8Vinyl acetate 108-05-4Vinyl Chloride 75-01-4m&p-Xylene” 108-38-3o-Xylene” 95-47-6
Hazard Index: 0.0 0.0 0.0
Chronic Noncancer Mixtures EvaluationChronic
NoncancerHazardQuotient
CNS CV/BLD IMMUN KIDN LIVER/GI REPRO RESPWHOLEBODY
0.0 0.0
0.0 0.0
0.0 0.0
0.0 0.0
0.0 I 0.0 0.0 0.0 0.0 0.0 0.0 0.0
Excess Lifetime
Cancer Risk (guideline
value = 1E-5)
1E-07
1E-06
• based on 1,3-Dichloropropene (CAS # 542-75-6)** based on total Xylenes (CAS # 1330-20-7)
In general, total excess lifetime cancer risk is not to exceed 1E-5 and a hazard index (or chemical-specific hazard quotient) is not to exceed 1. The additive results are shown with one decimal point which is intended to show transparency with the addition of risk but not to imply a level of precision greater than one significant figure. Risk managers may want to round to one significant figure when companng to a cancer nsk of 1E-5 or a hazard index of 1. Exceedance of these levels, which are bolded in text when met or exceeded, may require air emission controls.
CNS = Central Nervous SystemCV/BLD = Cardiovascular or Blood SystemIMMUN = Immune SystemIRRIT = Irritant (nasal, eye, throat irritation)KIDN = KidneyLIVER/GI = Liver/GastrointestinalREPRO = Reproductive System, including developmental effects RESP = Respiratory System
c-prp7-09bMinnesota Pollution Control Agency • 520 Lafayette Rd. N.. St. Paul, MN 55155-4194 • www.pca.state.mn.us
651-296-6300 • 800-657-3864 • TTY 651-282-5332 or 800-657-3864 • Available in alternative formatsPage 5 of 5
6/14/11
A ppen d ix e
T o t a l cVOCs a n d T o t a l TEX in FALA M o n it o r in g W e l l s

Total cVOCs Total TEX
integral\ (0BlÉilH| il
Note:Non-detect values shown at fulldetection limit as hollow symbols.
Figure C-1aTotal cVOCs and Total TEX in FALA Monitoring Wells

1 ,0 0 0 ,0 0 0 -
10 ,0 0 0 -
100-
CJ)3.
-— - —1 - i— e—e~
c 1,000,000- o oO)o
10,000
100-
1 -
MW00-39-BR
MW00-40-T
1 ,000 ,000
10,000
100
1 - ©—©---- -•
?----©—©--- ©—©---©—e----©—e--- ©—©----©—©----©—©---e—©----©—© ©—< )
1,000 ,0 0 0 -
10 ,0 0 0 -
100-
MW00-40-MS
o o o----- ©—o o o o—e-
MW02-03-BR
2008 2010 2012 2014 2016 2008 2010 2012 2014 2016
Total cVOCs ; Total TEX
inte- t MISÉIS imNote:Non-detect values shown at fulldetection limit as hollow symbols.
Figure C-1bTotal cVOCs and Total TEX in FALA Monitoring Wells

1,000,000
10 ,0 0 0 -
100-
O)3 .
co>c 1,000,000oOU)o
MW02-03-I
10,000
100-
1 -
MW04-188-T
1 ,000 ,0 0 0 -
10,000
100
1,000,000
10,000-
100
MW04-187-T
MW04-189-T
2008 2010 2012 2014 2016 2008 2010 2012 2014 2016
Total cVOCs Im Total TEX
integral Note:Non-detect values shown at fulldetection limit as hollow symbols.
Figure C-1cTotal cVOCs and Total TEX in FALA Monitoring Wells

1 ,000 ,000
10,000
100 -
Cbn
c<1)ocooCbo
MW04-190-T
*9—© e—oe—e e—©
1 ,0 0 0 ,0 0 0 -
10,000-
100-
MW04-191-T
1,000 ,0 0 0 -
10,000
100-
1 -
MW04-192-T
1 ,000 ,0 0 0 -
10,00 0 -
100
MW05-02-T
2008 2010 2012 2014 2016 2008 2010 2012 2014 2016
Total cVOCs ■ ■ Total TEX
intwal Note:Non-detect values shown at fulldetection limit as hollow symbols.
Figure C-1dTotal cVOCs and Total TEX in FALA Monitoring Wells

MW05-05-BR
1,000 ,000 -
10 ,0 0 0 -
100
eno .
i ) o o— o o o—e— e—1 - 3— e—e— o o ■ o—e— e—e-
o o o— e—<>o o-----e—o o o-----©—o o— o
MW05-06-I
c 1,000,000- o OO)o
10,000-
100-
1 O--- e—O O—O O—O O O O Q Q
2008 2010 2012 2014
o o—o
2016
1 ,000 ,00 0 -
10,000-
100-
MW05-06-BR
O Q 0 0--- 0—0- o o o o o1 < »------ 0 — 0 -------©-----0 -------0 — 0 -------0 — 0 --------©— 0 ------- 0 — O O O 0 -
1,000,000-
10,000
100-
MW05-15-BR
< ) o—o o o-1 < ) O O Q ©----0—-m.— o O1
2008 2010 2012 2014 2016
Total cVOCs 999 Total TEX
integral\ (onvialtiMi la<
Note:Non-detect values shown at fulldetection limit as hollow symbols.
Figure C-1eTotal cVOCs and Total TEX in FALA Monitoring Wells

Total cVOCs MÊ Total TEX
inte Note:Non-detect values shown at fulldetection limit as hollow symbols.
Figure C-1fTotal cVOCs and Total TEX in FALA Monitoring Wells

1,000 ,000
10,000-
100 -
cCDocoOo>o
MW06-258-I
1 ,0 0 0 ,0 0 0 -
10 ,0 0 0 -
100
1 ■
MW07-02-I
1,000,000
10,000
100-
1 -
MW07-70-T
1,000,000 -
10 ,0 0 0 -
100-
MW07-71-T
2008 2010 2012 2014 2016 2008 2010 2012 2014 2016
Total cVOCs Total TEX
Mhity nu
Note:Non-detect values shown at full detection limit as hollow symbols.
Figure C-1gTotal cVOCs and Total TEX in FALA Monitoring Wells


1 ,0 0 0 ,0 0 0 -
10,000
100-
1 -CbIL
c<DC 1,000,000ooCbo
MW-317 MW-318
1,000,000-
10,000-
*
100-
- 1.
10,000-
100
MW-319
1,000,000
10,0 0 0 -
100-
MW-400S
( >-----e—©---- o €> ■ o—e-----e—©--- o o e-1 o— e—e— 0- -O—-<D—0
2008 2010 2012 2014 2016 2008 2010 2012 2014 2016
Total cVOCs mm Total TEX
in tw d l\ rafMhnn w
Note:Non-detect values shown at fulldetection limit as hollow symbols.
Figure C-1iTotal cVOCs and Total TEX in FALA Monitoring Wells

Total cVOCs ■ ■ Total TEX
(onsÉutf meNote:Non-detect values shown at full detection limit as hollow symbols
Figure C-1jTotal cVOCs and Total TEX in FALA Monitoring Wells

Total cVOCs Total TEX
integral\ (owlliin ill
Note:Non-detect values shown at fulldetection limit as hollow symbols
Figure C-1kTotal cVOCs and Total TEX in FALA Monitoring Wells
A p p e n d ix D
C h l o r in a t e d Et h e n e s in FALA M o n it o r in g W e l l s
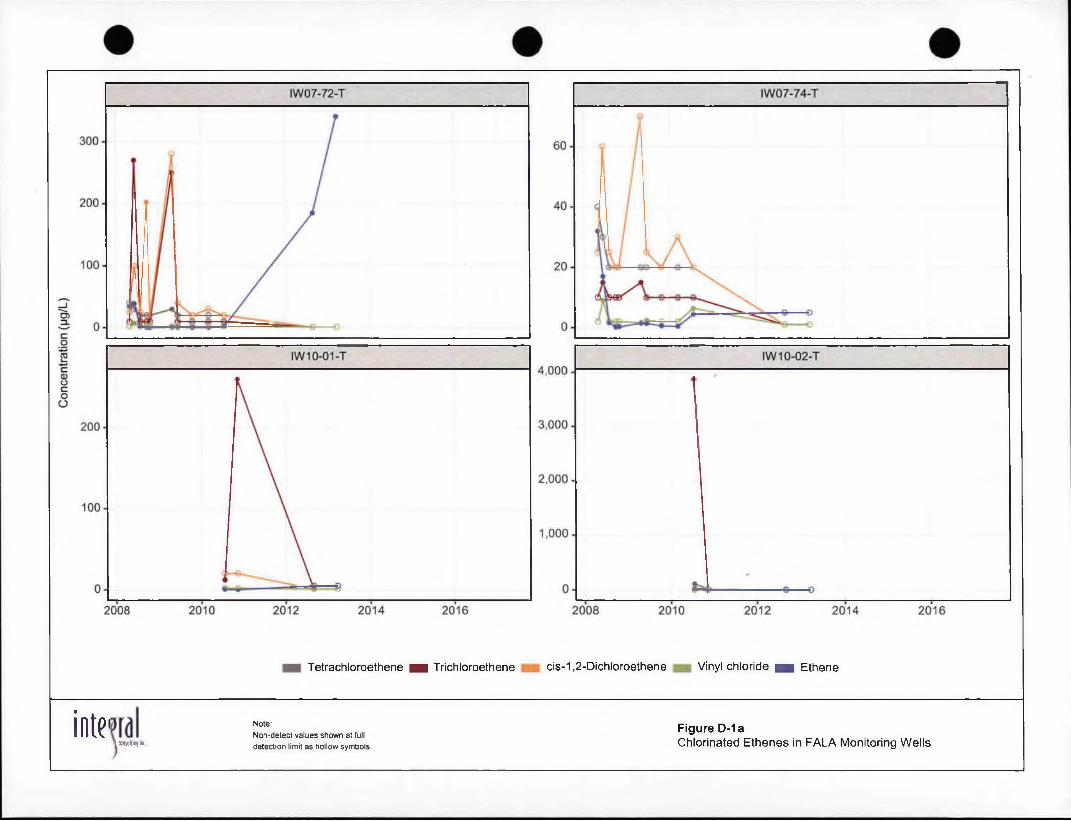
Tetrachloroethene § ■ Trichloroethene cis-1,2-Dichloroethene Vinyl chloride m Ethene
inte'L (omulUD̂ uh
Note:Non-detect values shown at fulldetection limit as hollow symbols.
Figure D-1aChlorinated Ethenes in FALA Monitoring Wells

Tetrachloroethene H i Trichloroethene cis-1,2-Dichloroethene H i Viny' chloride H I Ethene
Figure D-1bChlorinated Ethenes in FALA Monitoring Wells
Note:Non-detect values shown at full detection limit as hollow symbols.

Tetrachloroethene H I Trichloroethene cis-1,2-Dichloroethene Vinyl chloride H i Ethene
(Mulini MKNote:Non-detect values shown at full detection limit as hollow symbols.
Figure D-1cChlorinated Ethenes in FALA Monitoring Wells

èMW04-191-TMW04-190-T
MW04-192-T
ut
Note:Non-detect values shown at fulldetection limit as hollow symbols.
Figure D-1dChlorinated Ethenes in FALA Monitoring Wells
10,000
5,000
6,000
4,000
2,000
1,000
02008 2010 2012 2014 2016
Tetrachloroethene H I Trichloroethene cis-1,2-Dichloroethene Vinyl chloride h i Ethene
£ca>oc
O 4,000
3,000
1,000
2,000500


Tetrachloroethene ■ ■ Trichloroethene cis-1,2-Dichloroethene Vinyl chloride Ethene
integral Note:Non-detect values shown at fulldetection limit as hollow symbols.
Figure D-1gChlorinated Ethenes in FALA Monitoring Wells

15,000
O)
c<x>ocoO
10 ,0 0 0 -
5,000 -
0-
MW10-03-T
750
500-
250
MW-310 MW-316
25-
20-
1 V
/ 1 / \
15- / \
/ \10-
/ \I If \
5-/ I
/ \ / \/ I
0-
2008 2010 2012 2014 2016 2008 2010 2012 2014 2016
Tetrachloroethene MM Trichloroethene cis-1,2-Dichloroethene h Vinyl chloride Ethene
Note:Non-detect values shown at full detection limit as hollow symbols.
Figure D-1hChlorinated Ethenes in FALA Monitoring Wells


c<DOcoO
2008 2010 2012 2014 2016
Tetrachloroethene H i Trichloroethene cis-1,2-Dichloroethene Vinyl chloride
r w ito i m.
Note:Non-detect values shown at full detection limit as hollow symbols.
Figure D-1kChlorinated Ethenes in FALA Monitoring Wells
A p p e n d ix E
C h l o r in a t e d E t h a n e s in F A L A
M o n it o r in g W e l l s

enD .
ceuocoo
1,1,1-Trichloroethane wm 1,1-Dichloroethane 1,1-Dichloroethene Chloroethane wm Ethane
integral\ (omllurç iih
Note:Non-detect values shown at fulldetection limit as hollow symbols.
Figure E-1aChlorinated Ethanes in FALA Monitoring Wells

ca>ocoo
MW00-39-BR
1.00
0.75-
0.50-
0.25
0.00-
MW00-40-MS
MW00-40-T MW02-03-BR
2008 2010 2012 2014 2016
1,1,1-Trichloroethane h i 1,1-Dichloroethane 1,1-Dichloroethene m Chloroethane ■ ■ Ethane
Note:Non-detect values shown at fulldetection limit as hollow symbols.
Figure E-1bChlorinated Ethanes in FALA Monitoring Wells

1,1,1-Trichloroethane 1,1-Dichloroethane 1,1-Dichloroethene Chloroethane ■ ■ Ethane
inte1 Note:Non-detect values shown at fulldetection limit as hollow symbols.
Figure E-1cChlorinated Ethanes in FALA Monitoring Wells

1,1,1-Trichloroethane m 1,1-Dichloroethane s a 1,1-Dichloroethene Chloroethane M Ethane
integral Note:Non-detect values shown at fulldetection limit as hollow symbols.
Figure E-1dChlorinated Ethanes in FALA Monitoring Wells


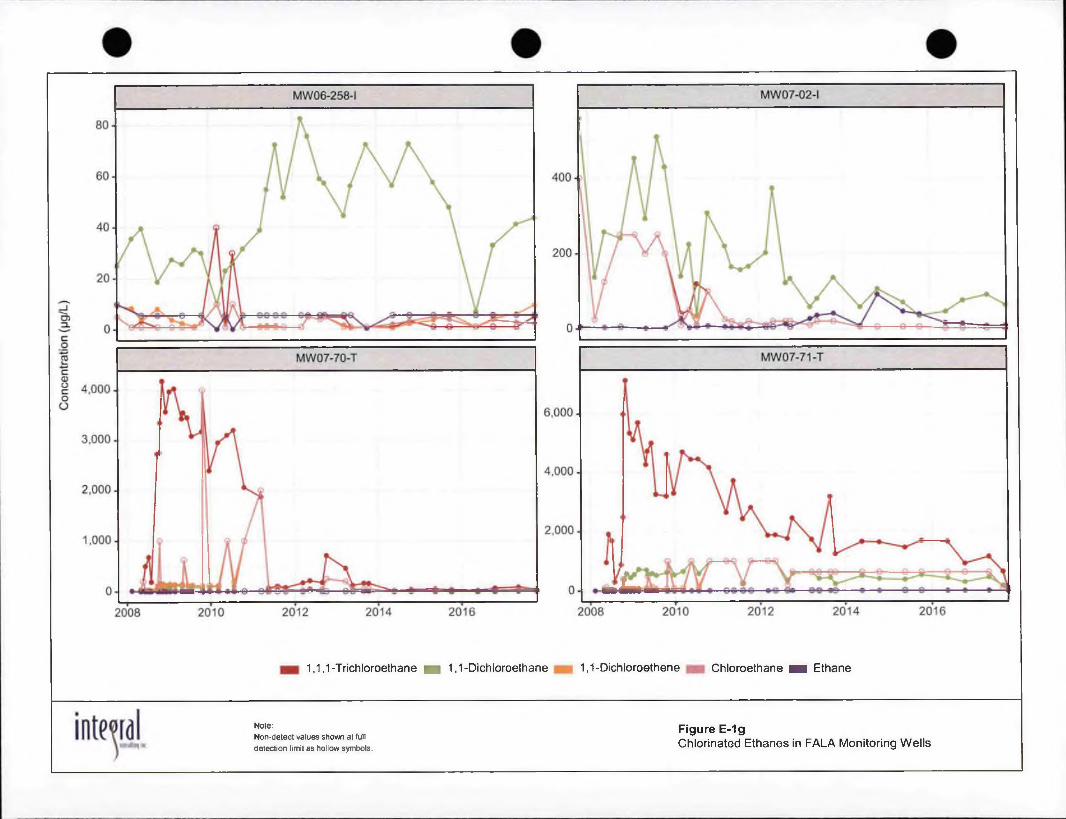
1,1,1-Trichloroethane h 1,1-Dichloroethane 1,1-Dichloroethene Chloroethane ■ ■ Ethane
Note:Non-detect values shown at full detection limit as hollow symbols.
Figure E-1gChlorinated Ethanes in FALA Monitoring Wells


0 5ZL
C0ocoO
1 ,0 0 0 -
750
500-
250
MW-317
400
200
MW-319
♦ ■
25.000
20.000 -
15.000-
10.000-
5,000-
0«>
MW-318
20-
15
10 -
MW-400S
2008 2010 2012 2014 2016 2008 2010 2012 2014 2016
1,1,1-Trichloroethane h 1,1-Dichloroethane 1,1-Dichloroethene H i Chloroethane H i Ethane
integral Note:Non-detect values shown at fulldetection limit as hollow symbols.
Figure E-1iChlorinated Ethanes in FALA Monitoring Wells

1,1,1-Trichloroethane h 1,1-Dichloroethane 1,1-Dichloroethene H i Chloroethane m Ethane
IWISÉlH HK
Note:Non-detect values shown at full detection limit as hollow symbols.
Figure E-1jChlorinated Ethanes in FALA Monitoring Wells

2008 2010 2012 2014 2016
1,1,1-Trichloroethane M i 1,1-Dichloroethane 1,1-Dichloroethene m Chloroethane
in tern iirotiviItnrçiM
Note:Non-detect values shown at fulldetection limit as hollow symbols.
Figure E-1kChlorinated Ethanes in FALA Monitoring Wells

A p p e n d ix F
T o l u e n e , Et h y l b e n z e n e , a n d
X y l e n e s in F A L A M o n it o r in g
W e l l s

Ethylbenzene ■ ■ Toluene Xylenes, Total
integral\ CCJRÉI»! U(.
Note:Non-detect values shown at fulldetection limit as hollow symbols.
Figure F-1aToluene, Ethylbenzene, and Xylenes in FALA MonitoringWells

• • •


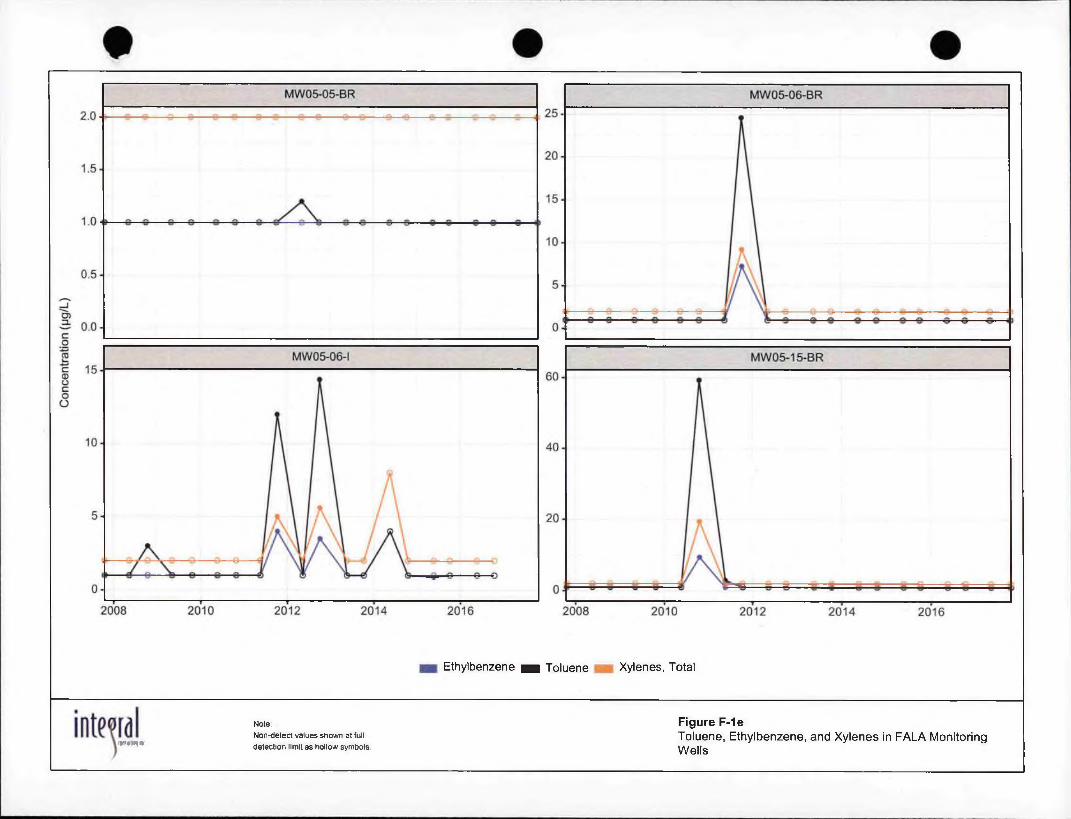
Ethylbenzene m Toluene Xylenes, Total
ro m o ll ii ty i « .
Note:Non-detect values shown at full detection limit as hollow symbols.
Figure F-1eToluene, Ethylbenzene, and Xylenes in FALA MonitoringWells
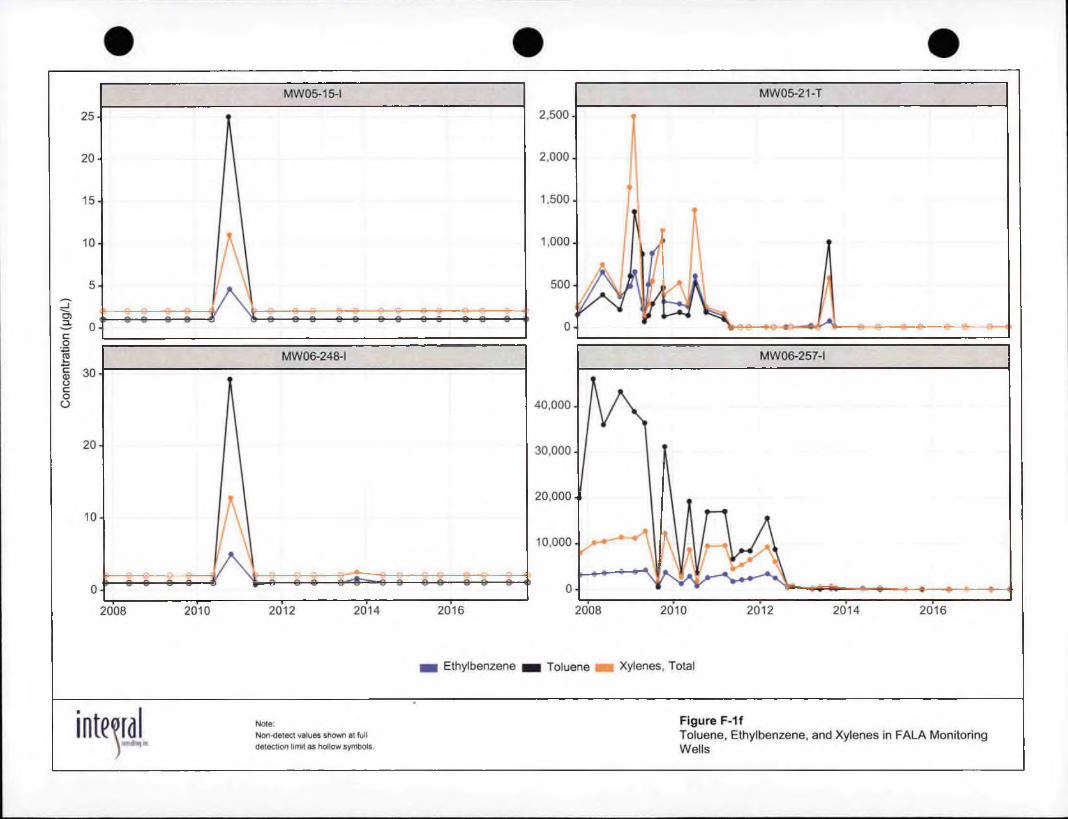


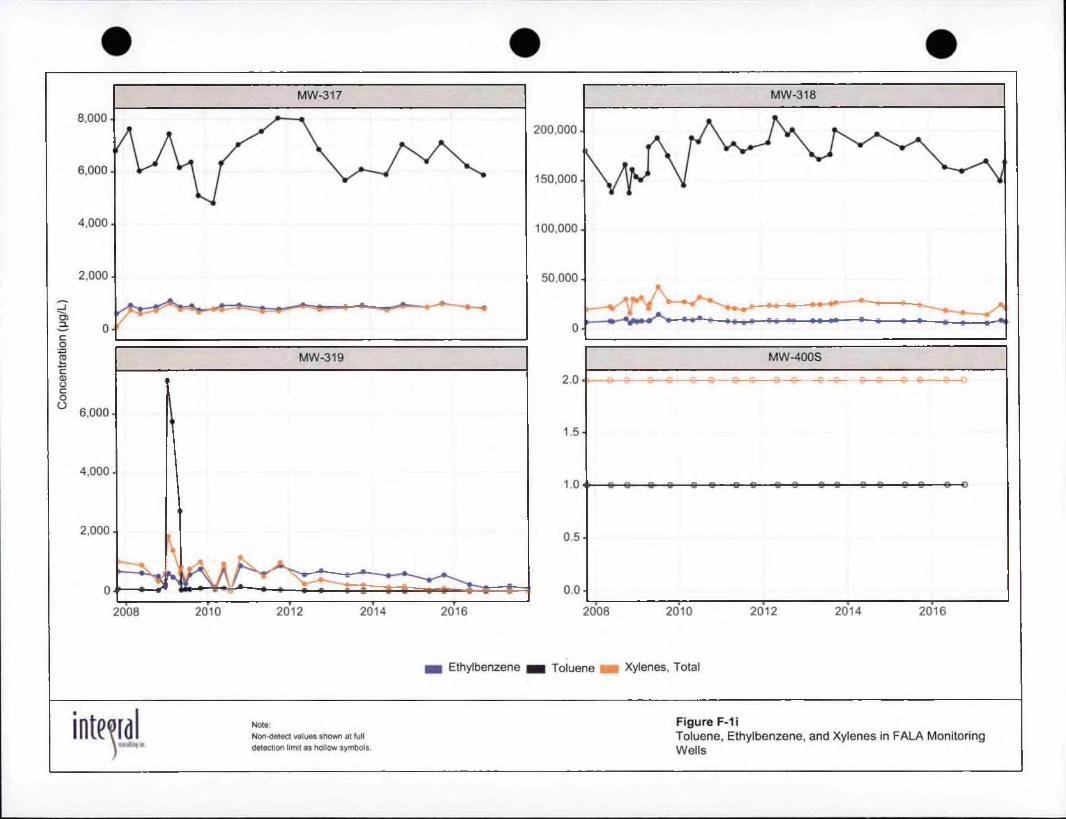


2008 2010 2012 2014 2016
Ethylbenzene H I Toluene Xylenes, Total
integral\ Mubin'iiNote:Non-detect values shown at fulldetection limit as hollow symbols.
Figure F-1kToluene, Ethylbenzene, and Xylenes in FALA MonitoringWells

A p p e n d ix G
D a t a T a b l e s

Appendix G
2017 Site Remediation Report
Former Ashland Lease Area
May 21, 2018
Table 1. Chlorinated Ethenes
DateSample
Type Lab Method
Tetrachloroethene(Mg/L)
T richloroethene cis-1,2-Dichloroethene
(Mfl/L) ÎM9/L)
Vinyl chloride (pg/L)
Ethylene(tjg/L)
MW0Q-39-BR5/2/2017 N PACEW 8260 1 u 1 U 1 U 1 U --
MW00-40-T5/8/2017 N PACEW 8260 1 u 9.0 0.87 J 0.24 J --5/8/2017 FD PACEW 8260 1 u 9.0 0.79 J 1 u --10/12/2017 N PACEW 8260 1 u 9.5 0.73 J 0.18 J --
MW00-41-T5/3/2017 N PACEW 8260 1 u 1 U 1 U 1 u . --10/11/2017
MW00-42-MSN PACEW 8260 1 u 1 U 1 U 1 u
5/3/2017 N PACEW 8260 14.1 12.2 3.1 1 u -10/9/2017 N PACEW 8260 12.8 6.1 2.2 1 u -
MW00-42-T5/5/2017 N PACEW 8260 4.5 2.2 0.42 J 1 u -10/9/2017 N PACEW 8260 15.6 1.2 0.46 J 1 u -
MW00-43-BR5/3/2017 N PACEW 8260 5.6 1 U 1 U 1 u --10/12/2017 N PACEW 8260 4.8 1 U 1 u 1 u --
MW00-43-T5/3/2017 N PACEW 8260 20.1 1 U 1 u 1 u -10/12/2017 N PACEW 8260 18.7 1 U 1 u 1 u --
MW02-01-OPD5/3/2017 N PACEW 8015B - - ~ - 5 U5/3/2017 N PACEW 8260 5.8 3.9 0.65 J 1 u -5/3/2017 FD PACEW 8015B - - - - 5 U5/3/2017 FD PACEW 8260 5.3 3.9 0.66 J 1 u -10/12/2017 N PACEW 8260 3.2 7.5 2.1 1 u -10/12/2017 FD PACEW 8260 3.0 7.5 1.9 1 u --
MW02-03-BR5/5/201710/12/2017
NN
PACEWPACEW
82608260
3.422.1
103304
6.521.4
2.66.2
—
MW02-03-I5/5/2017 N PACEW 8260 1 U 2.3 1 U 1 u -10/12/2017 N PACEW 8260 1 U 1.5 1 U 1 u --
MW03-52-OPD5/3/2017 N PACEW 8015B - -- - - 5 u5/3/2017 N PACEW 8260 1 U 1 U 1 u 1 u -
MW03-53-OPD5/3/2017 N PACEW 8015B - - - -- 5 u5/3/2017 N PACEW 8260 4.0 2.6 2.5 1 u -
MW03-56-BR5/2/2017 N PACEW 8260 1 U 1 U 1 U 1 u -10/11/2017 N PACEW 8260 1 u 1 U 1 U 1 u -
MW03-61-OPD5/1/2017 N PACEW 8260 2.3 3.0 0.49 J 1 u -10/11/2017 N PACEW 8260 5.3 2.8 3.5 1 u -
MW03-88-OPD5/4/2017 N PACEW 8015B - -- - -- 5 u5/4/2017 N PACEW 8260 2.2 11.1 3.3 0.31 J -
MW04-155-T5/5/2017 N PACEW 8260 10.0 1.4 1 U 1 u --10/12/2017 N PACEW 8260 11.7 1.8 1 U 1 u --
Integral Consulting Inc. Page lo f5

Appendix G
2017 Site Remediation Report
Former Ashland Lease Area
May 21, 2018
Table 1. Chlorinated Ethenes
DateSampleType Lab Method
Tetrachloroethene
(M9/L)
Trichloroethene cis-1,2-Dichloroethene (kig/L) (jjg/L)
Vinyl chloride(Mg/L)
Ethylene(ug/L)
MW04-189-T5/2/2017 N PACEW 8015B 18.05/2/2017 N PACEW 8260 10 U 10 u 77.6 43.3 -10/9/2017 N PACEW 8015B - - - 8.710/9/2017 N PACEW 8260 10 u 10 u 83.2 29.1 -
MW04-191-T5/2/2017 N PACEW 8260 40 U 40 U 156 181 --10/9/2017 N PACEW 8260 40 U 40 U 153 228 --
MW04-192-T3/20/2017 N PACE 826OB 250 U 100 U 3,030 50 U -5/2/2017 N PACEW 8015B - - -- - 20.85/2/2017 N PACEW 8260 50 U 50 U 488 40.1 J -5/2/2017 FD PACEW 8015B - - -- - 18.05/2/2017 FD PACEW 8260 40 U 40 U 440 33.1 J --9/12/2017 N PACE 8260B 20 U 8 U 480 38.6 -10/9/2017 N PACEW 8015B - - - - 10.310/9/2017 N PACEW 8260 24.4 J 40 U 711 47.2 --10/9/2017 FD PACEW 8015B -- ~ - - 23.810/9/2017 FD PACEW 8260 250 U 250 U 1,110 250. U --
MW04-24-T5/4/2017 N PACEW 8260 44.8 0.74 J 0.65 J 1 U -5/4/2017 FD PACEW 8260 38.5 0.61 J 0.59 J 1 U -10/10/2017 N PACEW 8260 48.5 0.85 J 0.93 J 1 U -10/10/2017 FD PACEW 8260 48.5 1.0 0.88 J 1 U -
MW04-25-T5/2/2017 N PACEW 8260 1.1 1 u 1 U 1 U --10/10/2017 N PACEW 8260 0.75 J 1 u 1 U 1 U -
MW04-26-BR5/4/2017 N PACEW 8260 22.5 11.6 72.5 3.5 -10/10/2017 N PACEW 8260 52.8 26.7 231 0.99 J -
MW04-27-T5/5/2017 N PACEW 8260 54.4 13.6 4.8 1 U -10/13/2017 N PACEW 8260 53.4 14.3 4.4 1 U -
MW04-28-15/3/2017 N PACEW 8260 9.8 3.1 1.9 1 U5/3/2017 FD PACEW 8260 9.9 3.1 2.1 1 U -
( 10/10/2017 N PACEW 8260 32.3 11.0 7.5 1 U -10/10/2017 FD PACEW 8260 30.5 10.7 8.5 1 U -
MW04-28-OPD5/4/2017 N PACEW 8015B - — - - 5 U5/4/2017 N PACEW 8260 16.7 4.3 1.4 1.6 —10/10/2017 N PACEW 8260 2.0 4.4 4.9 3.3 —
MW04-28-T5/4/2017 N PACEW 8260 8.1 1 U 1 U 1 U —10/10/2017 N PACEW 8260 7.0
1 U . 1 U 1 UMW04-29-BR
5/4/2017 N PACEW 8260 4 U 3.9 J 3.5 J 4 U10/10/2017 . N PACEW 8260 1 U 8.4 3.9 1 U —
MW04-30-BR5/5/2017 N PACEW 8260 8.5 3.7 1.2 1 U -
10/13/2017 N PACEW 8260 105 20.8 20.2 1 U -
MW04-31-SP5/2/2017 N PACEW 8260 10.9 1 U 1 U 1 U -10/11/2017 N PACEW 8260 15.0 0.38 J 1 U 1 U -
Integral Consulting Inc. Page 2 of 5

Appendix G
2017 Site Remediation Report
Former Ashland Lease Area
May 21, 2018
Table 1. Chlorinated Ethenes
DateSample
Type Lab Method
Tetrachloroethene(M9/L)
Trichloroethene cis-1,2-Dichloroethene (pg/L) (|Jg/L)
Vinyl chloride
(Mfl/L)
Ethylene
(pg/L)
MW04-31-T5/2/2017 N PACEW 8260 4.9 1 u 1 U 1 U --10/11/2017 N PACEW 8260 6.3 1 u 1 U 1 U -
MW04-33-SP5/3/2017 N PACEW 8260 22.7 2.1 0.37 J 1 u --10/12/2017 N PACEW 8260 20.0 1.9 0.32 J 1 u -
MW04-33-T5/3/2017 N PACEW 8260 10.9 0.99 J 1 U 1 u -10/12/2017 N PACEW 8260 12.2 1.2 0.30 J 1 u -
MW04-35-OPD5/4/2017 N PACEW 8015B - -- - - 5 U5/4/2017 N PACEW 8260 8.3 1.1 1.6 1 1/ -
MW04-43-OPD5/4/2017 N PACEW 8015B - - - " 5 U5/4/2017 N PACEW 8260 1 U 2.2 22.8 2.5 -
MW04-95-T5/1/2017 N PACEW 8260 46.2 3.5 0.55 J 1 U -10/12/2017 N PACEW 8260 41.0 3.2 0.57 J 1 U --
MW05-01-OPSH5/3/2017 N PACEW 8015B - -- _ ~ 5 u5/3/2017 N PACEW 8260 32.6 2.7 4.9 0.40 J --5/3/2017 FD PACEW 8015B - - - - 5 u5/3/2017 FD PACEW 8260 33.5 2.5 5.3 1 L/ -10/13/2017 N PACEW 8260 31.2 2.9 5.3 0.37 J -10/13/2017 FD PACEW 8260 32.6 2.9 6.1 0.43 J -
MW05-02-T3/20/2017 N PACE 8260B 20 U 14.6 711 83.1 -5/2/2017 N PACEW 801 SB - - - - 31.75/2/2017 N PACEW 8260 20 U 27.2 542 21.9 -9/12/2017 N PACE 8260B 20 UJ 8 UJ 1,180 J 661 J -10/10/2017 N PACEW 8015B - - - - 15.910/10/2017
MW05-05-BRN PACEW 8260 10 u 10 U 39.1 5.0 J “
5/4/2017 N PACEW 8260 1 u 1 u 1 U 1 U -10/13/2017 N PACEW 8260 1 u 1 u 1 U 1 U -
MW05-06-BR5/3/2017 N PACEW 8260 1 u 1 u 1 U 1 i / -10/13/2017 N PACEW 8260 1 u 1 u 1 U 1 U --
MW05-08-OPSH5/4/2017 N PACEW 8015B - - - - 5 u5/4/2017 N PACEW 8260 19.5 10.2 9.5 0.92 J -
MW05-09-OPSH5/3/2017 N PACEW 8015B - - -- - 5 u5/3/2017 N PACEW 8260 1 u 4.2 2.4 0.38 J
MW05-15-BR5/5/2 017 N PACEW 8260 1 u 1 U 1 U 1 1/ -10/12/2017 N PACEW 8260 1 u 1 U 1 U 1 U -
MW05-15-I5/5/2017 N PACEW 8260 1 u 14.3 1.3 1.5 -10/12/2017 N PACEW 8260 1 u 14.8 1.0 0.92 J -
MW05-15-T5/5/2017 N PACEW 8260 0.96 J 1 U 1 U 1 U -10/12/2017 N PACEW 8260 1.2 1 U 1 u 1 U -
Integral Consulting Inc. Page 3 of 5

Appendix G May 21,2018
2017 Site Remediation Report
Former Ashland Lease Area
Table 1. Chlorinated Ethenes
DateSample
Type Lab Method
Tetrachloroethene
(ug/L)
Trichloroethene cis-1,2-Dichloroethene (pg/L) Ojg/L)
Vinyl chloride(ijg/L)
Ethylene(ug/L)
MW05-21-T5/4/2017 N PACEW 8015B - - - -- 5 U5/4/2017 N PACEW 8260 0.52 J 4.8 1.5 . 1 u -10/9/2017 N PACEW 8015B - - - - 5 U10/9/2017 N PACEW 8260 1 U 7.1 1.9 0.48 J -
MW05-68-OPSH5/3/2017 N PACEW 8015B - - -- - 5 u5/3/2017 N PACEW 8260 1.4 6.5 3.4 1 U -
MW06-01-BR5/5/2017 N PACEW 8260 45.1 6.5 17.7 1 u -10/10/2017
MW06-01-IN PACEW 8260 4.9 1 U 1 U 1 u —
5/5/2017 N PACEW 8260 38.6 12.0 9.3 1 u -10/10/2017 N PACEW 8260 21.0 11.3 6.2 1 u -
MW06-01-T5/5/2017 N PACEW 8260 1 U 1 U 1 U 1 u -10/10/2017 N PACEW 8260 1 u 1 U 1 U 1 u
MW06-23-OPSH5/3/2017 N PACEW 8015B - - . - - 5 u5/3/2017 N PACEW 8260 1 u 3.8 13.1 1.0 --
MW06-248-I5/8/2017 N PACEW 8260 1 u 18.6 1.3 0.90 J -10/12/2017 N PACEW 8260 1 u 17.4 0.73 J 0.77 J -
MW06-257-I5/2/2017 N PACEW 8260 3.0 1 U 0.67 J 3.7 -10/9/2017 N PACEW 8260 1.3 1 U 0.53 J 2.8 --
MW06-258-I5/3/2017 N PACEW 8015B - - - -- 3.3 J5/3/2017 N PACEW 8260 4.5 173 43.6 25.1 -10/9/2017 N PACEW 8015B - - - - 7.610/9/2017 N PACEW 8260 30.0 617 68.7 23.5 -
MW06-29-15/8/2017 N PACEW 8260 33.5 35.4 14.8 1 U -10/11/2017 N PACEW 8260 1.1 13.0 8.4 1 U -
MW07-01-OPSH5/3/2017 N PACEW 8015B - - - - 5 u5/3/2017 N PACEW 8260 2.3 19.7 14.1 1.5 -
MW07-02-I5/3/2017 N PACEW 8015B - - ■■ \ - 16.25/3/2017 N PACEW 8260 1 U 1 U 1 U 1 U -5/3/2017 FD PACEW 8015B - — - - 20.95/3/2017 FD PACEW 8260, 1 u 1 u 1 u 1 u -10/9/2017 N PACEW 8015B - - - - 19.910/9/2017 N PACEW 8260 1 u 1 u 1 u 1 u -10/9/2017 FD PACEW 8015B ~ - - - 8.210/9/2017 FD PACEW 8260 1 u 1 u 1 u 1 u -
MW07-41-I5/8/2017 N PACEW 8260 61.3 8.6 3.0 1 u -10/11/2017
MW07-42-IN PACEW 8260 39.8 6.5 6.2 1 u —
5/4/2017 N PACEW 8260 40.2 2.5 0.74 J 1 u -10/11/2017 N PACEW 8260 29.7 1.8 0.39 J 1 u -
Integral Consulting Inc. Page 4 of 5

Appendix G
2017 Site Remediation Report
Former Ashland Lease Area
May 21, 2018
Table 1. Chlorinated Ethenes
DateSample
Type Lab Method
Tetrachloroethene
(pg/L)
Trichloroethene cis-1,2-Dichloroethene
(M9/L) (ug/L)
Vinyl chloride
(mq/L)
Ethylene
(mq/l )
MW07-70-T5/2/2017 N PACEW 8015B - - - - 1275/2/2017 N PACEW 8260 7.3 J 4.0 J 340 30.2 -10/9/2017 N PACEW 8015B - - -- -- 13210/9/2017
MW07-71-TN PACEW 8260 10 U 6.9 J 120 17.1
5/2/2017 N PACEW 8015B - - - -- 1.2 J5/2/2017 N PACEW 8260 625 U 625 U 6,700 625 U --8/30/2017 N PACE 8260B 100 U 40 U 3,370 20 U --10/9/2017 N PACEW 8015B - - - - 0.91 J10/9/2017 N PACEW 8260 50 U 50 U 518 50 U -
MW10-03-T5/2/2017 N PACEW 8015B - - - - 2.4 J5/2/2017 N PACEW 8260 2,000 U 2,570 5,210 2,000 U -8/30/2017 N PACE 8260B 691 2,150 3,150 100 U --10/9/2017 N PACEW 8015B - - - - 2.2 J10/9/2017 N PACEW 8260 1,250 U 2,720 3,290 1,250 U -
MW-3095/2/2017 N PACEW 8015B - - - -- 3475/2/2017 N PACEW 8260 500 U 500 U 7,670 404 J --8/30/2017 N PACE 8260B 200 U 80 U 4,240 367 -10/9/2017 N PACEW 8015B - - - - 22710/9/2017 N PACEW 8260 400 U 400 U 5,520 446 --
MW-3185/2/2017 N PACEW 8015B - - - - 32.45/2/2017 N PACEW 8260 2,000 U 2,000 U 41,100 2,000 U -8/30/2017 N PACE 8260B 468 J 5,210 J 22,000 J 50 UJ -8/30/2017 FD PACE 8260B 618 4,810 20,500 100 U -10/9/2017 N PACEW 8015B - - - - 33.810/9/2017 N PACEW 8260 2,000 U 5,520 34,300 2,000 U -
MW-3195/2/2017 N PACEW 8015B - - - - 9.4
5/2/2017 N PACEW 8260 4.1 55.3 15.1 48.1 -10/9/2017 N PACEW 8015B - - - - 13.710/9/2017 N PACEW 8260 4.5 137 19.9 47.7 -
MW-401S5/3/2017 N PACEW 8015B - - - - 5 U5/3/2017 N PACEW 8260 5 U 2.0 J 8.6 1.6 J -
10/9/2017 N PACEW 8015B - - - - 1.8 J10/9/2017 N PACEW 8260 5 U 1.8 J 6.2 1.9 J -
MW-402S5/2/2017 N PACEW 8015B ~ - - - 2655/2/2017 N PACEW 8260 50 U 50 U 25.9 J 197 -
10/9/2017 N PACEW 8015B - ~ - - 16810/9/2017 N PACEW 8260 40 U 40 U 29.7 J 204 -
MW-403D5/2/2017 N PACEW 8260 10.5 0.75 J 1.3 1 U -
10/13/2017 N PACEW 8260 28.5 2.0 3.5 1 U -
Notes:FD = field duplicate sample J = The associated numerical value is an estimated quantity.N = normal investigative sample U = The material was analyzed for, but was not detected.PACEW = Pace Analytical Services, Inc., Minneapolis, MN The associated numerical value is the sample quantitation limit.-- = not available
Integral Consulting Inc. Page 5 o f 5

Appendix G
2017 Site Remediation Report
Former Ashland Lease Area
May 21,2018
Table 2. Chlorinated Ethanes_ . 1,1,1-Trichloroethane 1,1-Dichloroethene 1,1-Dichloroethane Chloroethane EthaneSample
Date_________Type Lab Method________ (MQ/L)_____________(pg/L)___________ (MQ/L)_________ (pg/L) (pg/L)
MW00-39-BR5/2/2017 N PACEW 8260 1 U 1 U 0.27 J 1 U -
MW00-40-T5/8/2017 N PACEW 8260 4.9 4.7 7.2 1 U -5/8/2017 FD PACEW 8260 5.1 4.5 7.0 1 u -10/12/2017 N PACEW 8260 4.6 4.3 5.7 1 u -
M W00-41-T5/3/2017 N PACEW 8260 1 U 1 U 1 U 1 u -10/11/2017 N PACEW 8260 1 U 1 U 1 U 1 u -
MW00-42-MS5/3/2017 N PACEW 8260 1.6 1.2 3.2 1 u -10/9/2017 N PACEW 8260 1.4 1.3 3.0 1 u -
MW00-42-T5/5/2017 N PACEW 8260 0.83 J 1 U 0.68 J 1 u -10/9/2017 N PACEW 8260 1.9 1 U 0.38 J 1 u -
MW00-43-BR5/3/2017 N PACEW 8260 0.54 J 1.2 0.60 J 1 u -10/12/2017 N PACEW 8260 1 U 1.1 0.38 J 1 u -
MW00-43-T5/3/2017 N PACEW 8260 5.4 1 U 1 1/ 1 u -10/12/2017 N PACEW 8260 2.0 1 U 1 U 1 u --
MW02-01-OPD5/3/2017 N PACEW 8015B - - - - 5.6 U5/3/2017 N PACEW 8260 2.4 2.3 1.6 1 u --5/3/2017 FD PACEW 8015B - - - - 5.6 U5/3/2017 FD PACEW 8260 2.3 2.2 1.6 1 u -10/12/2017 N PACEW 8260 2.5 2.8 2.3 1 u -10/12/2017 FD PACEW 8260 2.3 2.7 2.1 1 u --
MW02-03-BR5/5/2017 N PACEW 8260 1 U 1.0 11.0 1 u -10/12/2017 N PACEW 8260 2.5 U 2.9 21.6 2.5 u -
MW02-03-I5/5/2017 N PACEW 8260 1 U 1 U 0.27 J 1 u --10/12/2017 N PACEW 8260 1 U 1 U 1 U 1 u ~
MW03-52-OPD5/3/2017 N PACEW 8015B - - - - 5.6 u5/3/2017 N PACEW 8260 1 U 1 U 1 U 1 u -
MW03-53-OPD5/3/2017 N PACEW 8015B — - - - 5.6 u5/3/2017 N PACEW 8260 1.5 1.6 4.2 1 u -
MW03-56-BR5/2/2017 N PACEW 8260 1 U 1 U 0.93 J 1 u -10/11/2017 N PACEW 8260 1 U 1 U 0.60 J 1 u -
MW03-61-OPD5/1/2017 N PACEW 8260 0.66 J 0.71 J 0.60 J 1 u -
10/11/2017 N PACEW 8260 2.0 1.8 2.5 1 u -MW03-88-OPD
5/4/2017 N PACEW 8015B - - - - 5.6 u5/4/2017 N PACEW 8260 1 U 4.1 4.3 1 u -
MW04-155-T5/5/2017 N PACEW 8260 3.9 1 U 0.29 J 1 u -10/12/2017 N PACEW 8260 4.6 1 U 0.30 J 1 u -
Integral Consulting Inc. Page 1 o f 6

Appendix G2017 Site Remediation Report
Former Ashland Lease Area
May 21,2018
Table 2. Chlorinated Ethanes
DateSampleType Lab Method
1,1,1-Trichloroethane 1,1-Dichloroethene 1,1-Dichloroethane Chloroethane ftjg/L) (|jg/L) (pg/L) (pg/L)
Ethane(ug/L)
MW04-189-T5/2/2017 N PACEW 8015B - - - - 5.6 ty5/2/2017 N PACEW 8260 14.0 10 U 11.9 10 u --10/9/2017 N PACEW 8015B - - -- -- 5.6 u10/9/2017 N PACEW 8260 8.2 J 10 u 8.7 J 10 u --
MW04-191-T5/2/2017 N PACEW 8260 66.3 40 U 59.4 40 U -10/9/2017 N PACEW 8260 55.5 40 U 90.9 40 U -
MW04-192-T3/20/2017 N PACE 8260B 428 250 U 250 U 250 U -
5/2/2017 N PACEW 8015B - - - - 5.6 u5/2/2017 N PACEW 8260 26.8 J 50 U 36.5 J 50 U -5/2/2017 FD PACEW 8015B » - - - 5.6 u5/2/2017 FD PACEW 8260 23.8 J 40 U 31.6 J 40 U -9/12/2017 N PACE 8260B 26.0 20 U 32.2 20 U -10/9/2017 N PACEW 8015B - - - - 5.6 u10/9/2017 N PACEW 8260 53.8 40 U 54.5 40 U -10/9/2017 FD PACEW è015B - - - - 1.7 j10/9/2017 FD PACEW 8260 250 U 250 U 71.6 J 250 U -
MW04-24-T5/4/2017 N PACEW 8260 12.4 0.46 J 0.33 J 1 U -5/4/2017 FD PACEW 8260 11.4 1 U 0.26 J 1 U -10/10/2017 N PACEW 8260 13.1 0.64 J 0.42 J 1 U --10/10/2017 FD PACEW 8260 13.6 0.65 J 0.42 J 1 U ..
MW04-25-T5/2/2017 N PACEW 8260 2.9 1 U 1 U 1 U -10/10/2017 N PACEW 8260 3.0 1 U 1 U 1 U --
MW04-26-BR5/4/2017 N PACEW 8260 11.4 8.8 56.3 1 U -10/10/2017 N PACEW 8260 30.4 19.7 145 1 U -
MW04-27-T5/5/2017 N PACEW 8260 10.9 1 U 2.2 1 U ~10/13/2017 N PACEW 8260 10.5 1 U 1.9 1 U ~
MW04-28-I5/3/2017 N PACEW 8260 7.4 1.5 5.5 1 U -5/3/2017 FD PACEW 8260 7.7 1.5 6.0 1 U -10/10/2017 N PACEW 8260 3.5 1.5 3.5 1 ty -10/10/2017 FD PACEW 8260 2.8 0.94 J 3.7 1 a
MW04-28-OPD5/4/2017 N PACEW 8015B - - — - 5.6 u5/4/2017 N PACEW 8260 8.5 4.9 2.4 1 u -10/10/2017
MW04-28-TN PACEW 8260 3.9 2.7 7.2 1 u —
5/4/2017 N PACEW 8260 0.84 J 1 U 1 U 1 u -10/10/2017
MW04-29-BRN PACEW 8260 1 U 1 U 1 U 1 u --
5/4/2017 N PACEW 8260 4 U 4 U 4.7 4 U ~10/10/2017 N PACEW 8260 1 U 1.6 6.0 1 ty -
MW04-30-BR5/5/2017 N PACEW 8260 2.7 2.3 1.6 1 ty -10/13/2017 N PACEW 8260 13.7 8.3 11.0 1 ty -
Integral Consulting Inc. Page 2 of 6

Appendix G
2017 Site Remediation Report
Former Ashland Lease Area
May 21,2018
Table 2. Chlorinated Ethanes
DateSample
Type Lab Method
1,1,1-Trichloroethane 1,1-Dichloroethene 1,1-Dichloroethane 1
(Mg/L) (pg/L) (pg/L)
Chloroethane
(pg/L)
Ethane
(pg/L)
MW04-31-SP5/2/2017 N PACEW 8260 1.9 1 U 1 U 1 u -10/11/2017 N PACEW 8260 1.6 1 U 1 U 1 u -
MW04-31-T5/2/2017 N PACEW 8260 0.75 J 1 U 1 U 1 u -10/11/2017 N PACEW 8260 1.2 1 U 1 U 1 u -
MW04-33-SP5/3/2017 N PACEW 8260 1.7 1 U 0.65 J 1 u -10/12/2017 N PACEW 8260 2.2 1 U 0.75 J 1 u --
MW04-33-T5/3/2017 N PACEW 8260 3.1 1 U 0.26 J 1 u -10/12/2017 N PACEW 8260 3.1 1 U 0.36 J 1 u -
MW04-35-OPD5/4/2017 N PACEW 8015B - -- - -- 5.6 1/5/4/2017 N PACEW 8260 2.8 2.6 1.4 1 u -
MW04-43-OPD5/4/2017 N PACEW 8015B - - - - 5.6 U5/4/2017 N PACEW 8260 1 U 0.76 J 15.4 1 u -
MW04-95-T5/1/2017 N PACEW 8260 6.6 0.48 J 0.42 J 1 u -10/12/2017 N PACEW 8260 6.5 0.66 J 0.51 J 1 u --
MW05-01-OPSH5/3/2017 N PACEW 8015B - - - - 5.6 U5/3/2017 N PACEW 8260 11.8 9.7 6.0 1 u -5/3/2017 FD PACEW 8015B - - - - 5.6 U5/3/2017 FD PACEW 8260 12.4 10.3 5.8 1 u -10/13/2017 N PACEW 8260 11.3 11.1 5.8 1 u -10/13/2017 FD PACEW 8260 11.5 10.9 5.8 1 u -
MW05-02-T3/20/2017 N PACE 8260B 20 U 20 U 45.9 32.1 -5/2/2017 N PACEW 8015B - - - - 8.05/2/2017 N PACEW 8260 20 U 20 U 49.7 20 U -9/12/2017 N PACE 8260B 20 UJ 20 UJ 287 J 20 UJ -10/10/2017 N PACEW 8015B - - - - 5.6 U10/10/2017 N PACEW 8260 10 u 10 u 15.1 10 u -
MW05-05-BR5/4/2017 N PACEW 8260 1 u 1 u 1 U 1 u -10/13/2017 N PACEW 8260 1 u 1 u 1 U 1 u -
MW05-06-BR5/3/2017 N PACEW 8260 1 u 1 u 1 U 1 u ~10/13/2017 N PACEW 8260 1 u 1 u 1 U 1 u -
MW05-08-OPSH5/4/2017 N PACEW 8015B - - - - 5.6 U5/4/2017 N PACEW 8260 0.59 J 8.8 7.9 1 u -
MW05-09-OPSH5/3/2017 N PACEW 8015B - - - - 5.6 U5/3/2017 N PACEW 8260 1 u 1.2 1.6 1 t; -
MW05-15-BR5/5/2017 N PACEW 8260 1 u 1 U 0.69 J 1 u -10/12/2017 N PACEW 8260 1 u 1 U 0.62 J 1 u -
MW05-15-I5/5/2017 N PACEW 8260 0.99 J 11.9 6.6 1 u -10/12/2017 N PACEW 8260 1.1 15.0 4.7 1 u -
Integral Consulting Inc. Page 3 o f 6

Appendix G
2017 Site Remediation Report
Former Ashland Lease Area
May 21, 2018
Table 2. Chlorinated Ethanes
DateSample
Type Lab Method
1,1,1-Trichloroethane 1,1-Dichloroethene 1,1-Dichloroethane Chloroethane
(pg/L) (pg/L) (pg/L) (pg/L)
Ethane
(pg/L)
MW05-15-T5/5/2017 N PACEW 8260 1 u 1 U 1 L/ 1 U -10/12/2017 N PACEW 8260 1 u 1 U 1 U 1 U -
MW05-21-T5/4/2017 N PACEW 8015B - - - -- 0.92 J5/4/2017 N PACEW 8260 0.68 J 1 U 2.4 1 U -10/9/2017 N PACEW 8015B - - -- -- 3.3 J10/9/2017 N PACEW 8260 0.70 J 1 u 4.5 1 U -
MW05-68-OPSH5/3/2017 N PACEW 8015B - ~ - - 5.6 U5/3/2017 N PACEW 8260 1 u 2.9 4.8 1 U -
MW06-01-BR5/5/2017 N PACEW 8260 16.2 9.7 10.9 1 u -10/10/2017 N PACEW 8260 2.9 3.9 1.7 1 u -
MW06-01-I5/5/2017 N PACEW 8260 2.6 7.3 11.8 1 u -10/10/2017 N PACEW 8260 2.4 3.0 4.0 1 u -
MW06-01-T5/5/2017 N PACEW 8260 1 U 1 U 1 U 1 u -10/10/2017 N PACEW 8260 1 U 1 U 1 U 1 u -
MW06-23-OPSH5/3/2017 N PACEW 8015B - - - -- 5.6 U5/3/2017 N PACEW 8260 1 U 4.5 6.8 1 u -
MW06-248-I5/8/2017 N PACEW 8260 1 U 18.8 6.7 1 u --10/12/2017 N PACEW 8260 1.3 13.3 3.7 1 u -
MW06-257-I5/2/2017 N PACEW 8260 1 U 1 U 3.7 1 u -10/9/2017 N PACEW 8260 1 U 1 U 2.5 1 u --
MW06-258-I5/3/2017 N PACEW 8015B — - - - 5.6 U5/3/2017 N PACEW 8260 1 u 6.0 41.3 2.8 -10/9/2017 N PACEW 8015B - - -- - 5.6 U10/9/2017 N PACEW 8260 5 U 9.5 43.7 2.3 J -
MW06-29-I5/8/2017 N PACEW 8260 139 21.2 138 1 u -10/11/2017 N PACEW 8260 32.6 7.2 43.2 1 u -
MW07-01-OPSH5/3/2017 N PACEW 8015B - - - -- 5.6 U5/3/2017 N PACEW 8260 1 U 8.5 10.6 1 u -
MW07-02-I5/3/2017 N PACEW 8015B — - - - 6.65/3/2017 N PACEW 8260 1 u 1 U 95.4 1 u -5/3/2017 FD PACEW 8015B - - - - 7.95/3/2017 FD PACEW 8260 1 u 1 u 84.0 1 u -10/9/2017 N PACEW 8015B - - -- - 11.810/9/2017 N PACEW 8260 1 u 1 u 62.0 1.6 -10/9/2017 FD PACEW 8015B - - - - 4.8 J10/9/2017 FD PACEW 8260 1 u 1 u 63.6 1.7 -
MW07-41-I5/8/2017 N PACEW 8260 4.1 1 u 1.4 1 u -10/11/2017 N PACEW 8260 3.5 1 u 1.6 1 u -
Integral Consulting Inc. Page 4 o f 6

Appendix G
2017 Site Remediation ReportFormer Ashland Lease Area
May 21,2018
Table 2. Chlorinated Ethanes
DateSampleType Lab Method
1,1,1-Trichloroethane 1,1-Dichloroethene 1,1-Dichloroethane Chloroethane ,
(M9/L) (M9/L) (M9/ l )
Ethane
(Mg/L)
MW07-42-I5/4/2017 N PACEW 8260 3.5 1 U 0.64 J 1 U --10/11/2017 N PACEW 8260 2.5 1 U 0.38 J 1 U -
MW07-70-T5/2/2017 N PACEW 8015B -- -- -- - 1.1 J
5/2/2017 N PACEW 8260 83.3 10 u 36.6 10 u --10/9/2017 N PACEW 8015B .. - -- - 0.73 J10/9/2017
MW07-71-TN PACEW 8260 40.0i 10 u 31.5 10 u
5/2/2017 N PACEW 8015B - T - - 1.5 J5/2/2017 N PACEW 8260 1,150 625 U 459 J 625 U --8/30/2017 N PACE 8260B 647 100 u 177 100 u -10/9/2017 N PACEW 8015B - - -- - 1.1 J10/9/2017 N PACEW 8260 79.7 50 U 32.6 J 50 U -
MW10-03-T5/2/2017 N PACEW 8015B -- - - - 1.8 J5/2/2017 N PACEW 8260 2,320 2,000 U 2,000 U 2,000 U --8/30/2017 N PACE 8260B 1,450 500 U 500 U 500 U -10/9/2017 N PACEW 8015B - - - - 2.1 J10/9/2017 N PACEW 8260 1,780 1,250 U 1,250 U 1,250 U -
MW-3095/2/2017 N PACEW 8015B -- - - - 5.6 U5/2/2017 N PACEW 8260 399 J 500 U 678 500 U --8/30/2017 N PACE 8260B 200 U 200 U 401 200 U -10/9/2017 - N PACEW 8015B . . - ' - 6.510/9/2017 N PACEW 8260 400 U 400 U 510 400 U -
MW-3185/2/2017 N PACEW 8015B - - -- - 13.35/2/2017 N PACEW 8260 1,320 J 2,000 U 1,690 J 2,000 U -8/30/2017 N PACE 8260B 1,700 J 250 UJ 865 J 250 UJ -8/30/2017 FD PACE 8260B 1,680 500 U 895 500 U -10/9/2017 N PACEW 8015B - - -- - 11.610/9/2017 N PACEW 8260 1,800 J 2,000 U 1,390 J 2,000 U -
MW-3195/2/2017 N PACEW 8015B ~ - - - 5.6 U5/2/2017 N PACEW 8260 11.6 3.3 30.1 0.74 J --10/9/2017 N PACEW 8015B ~ - - - 5.6 u10/9/2017 N PACEW 8260 19.3 7.2 . 22.8 1.1 J -
MW-401S5/3/2017 N . PACEW 8015B - - -- - 5.6 u5/3/2017 N PACEW 8260 4.5 J 5 U 119 10.3 -10/9/2017 N PACEW 8015B - - - -- 5.6 u10/9/2017 N PACEW 8260 5 U 5 U 44.7 5.2 -
MW-402S5/2/2017 N PACEW 8015B - - - -- 2.1 J5/2/2017 N PACEW 8260 50 U 50 U 113 50 U -10/9/2017 N PACEW 8015B - - - - 1.5 J10/9/2017 N PACEW 8260 40 U 40 U 110 40 U -
MW-403D5/2/2017 N PACEW 8260 19.2 3.0 5.2 1 U -10/13/2017 N PACEW 8260 28.2 3.9 6.4 1 U -
Integral Consulting Inc. Page 5 of 6

Appendix G2017 Site Remediation Report
Former Ashland Lease Area
May 21, 2018
Table 2. Chlorinated Ethanes
DateSample
Type Lab Method
1,1,1-Trichloroethane 1,1 -Dichloroethene 1,1-Dichloroethane Chloroethane Ethane (pg/L) (pg/L) (pg/L) (pg/L) (pg/L)
Notes:FD = field duplicate sample N = normal investigative samplePACEW = Pace Analytical Services, Inc., Minneapolis, MN - = not available
J = The associated numerical value is an estimated quantity.U = The material was analyzed for, but was not detected. The associated numerical value is the sample quantitation limit.
Integral Consulting Inc. Page 6 of 6

Appendix G
2017 Site Remediation Report
Former Ashland Lease Area
May 21,2018
Table 3. Aromatic Hydrocarbons
DateSample
Type Lab Method
Toluene
(Mg/L)Ethylbenzene
(M9/L)m,p-Xylenes
(M9/L)o-Xylene
(Mg/i-)MW00-39-BR
5/2/2017 N PACEW 8260 1 u 1 G 2 Li 1 t/MW00-40-T
5/8/2017 N PACEW 8260 1 u 1 U 2 Li 1 Li5/8/2017 FD PACEW 8260 1 u 1 U 2 Li 1 Li10/12/2017 N PACEW 8260 1 u 1 U 2 Li 1 Li
M W00-41-T5/3/2017 N PACEW 8260 1 u 1 t/ 2 Li 1 Li10/11/2017 N PACEW 8260 1 u 1 t/ 2 Li 1 Li
MW00-42-MS5/3/2017 N PACEW 8260 1.1 1 D 1.3 J 1 U10/9/2017 N PACEW 8260 1 u 1 U 2 Li 1 Li
MW00-42-T5/5/2017 N PACEW 8260 1 u 1 Li 2 Li 1 Li10/9/2017 N PACEW 8260 . 1 u 1 U 2 U 1 Li
MW00-43-BR5/3/2017 N PACEW 8260 1 u 1 2 Li 1 U10/12/2017 N PACEW 8260 1 u 1 U 2 U 1 Li
MW00-43-T5/3/2017 N PACEW 8260 1 u 1 L/ 2 U 1 Li10/12/2017 N PACEW 8260 1 u 1 Li 2 U 1 U
MW02-01 -OPD5/3/2017 N PACEW 8260 1 u 1 Li 2 U 1 Li5/3/2017 FD PACEW 8260 1 u 1 t/ 2 Li 1 U10/12/2017 N PACEW 8260 1 u 1 Li 2 t/ 1 L/10/12/2017 FD PACEW 8260 1 u 1 Li 2 Li 1 Li
MW02-03-BR5/5/2017 N PACEW 8260 1 u 1 Li 2 Li 1 Li10/12/2017 N PACEW 8260 2.5 U 3.4 5 Li 2.5 L/
MW02-03-I5/5/2017 N PACEW 8260 1 u 1 a 2 Li 1 U10/12/2017 N PACEW 8260 1 u 1 Li 2 Li 1 Li
MW03-52-OPD5/3/2017 N PACEW 8260 1 u 1 ü 2 Li 1 U
MW03-53-OPD5/3/2017 N PACEW 8260 1 u 1 Li 2 Li 1 Li
MW03-56-BR5/2/2017 N PACEW 8260 1 u 1 Li 2 Li 1 Li10/11/2017 N PACEW 8260 1 1/ 1 Li 2 t/ 1 U
MW03-61-OPD5/1/2017 N PACEW 8260 1 u 1 ■ Li 2 L/ 1 L/10/11/2017 N PACEW 8260 1 u 1 U 2 Li 1 Li
MW03-88-OPD5/4/2017 N PACEW 8260 1 LÎ 1 Li 2 Li 1 t/
MW04-155-T5/5/2017 N PACEW 8260 1 u 1 L/ 2 Li 1 Li10/12/2017 N PACEW 8260 1 L/ 1 Li 2 Li 1 Li
MW04-189-T5/2/2017 N PACEW 8260 18.7 870 370 5.6 J10/9/2017 N PACEW 8260 23.0 513 228 10 Li
MW04-191-T5/2/2017 N PACEW 8260 6,290 2,870 2,940 960^10/9/2017 N PACEW 8260 6,810 2,210 2,740 978 '
Integral Consulting Inc. Page 1 of 5

Appendix G
2017 Site Remediation Report
Former Ashland Lease Area
May 21,2018
Table 3. Aromatic Hydrocarbons
DateSample
Type, Lab Method
Toluene
(mq/l)
Ethylbenzene
(pg/L)
m,p-Xylenes
(pg/L)
o-Xylene
(pg/L)
MW04-192-T3/20/2017 N PACE 8260B 35,300 5,890 - -5/2/2017 N PACEW 8260 2,340 407 729 2265/2/2017 FD PACEW 8260 2,010 369 565 1809/12/2017 N PACE 8260B 2,310 552 -- -10/9/2017 N PACEW 8260 11,300 3,120 6,850 2,89010/9/2017 FD PACEW 8260 21,400 3,470 7,670 2,970
MW04-24-T5/4/2017 N PACEW 8260 1 U 1 U 2 U 1 U5/4/2017 FD PACEW 8260 1 U 1 U 2 U 1 U10/10/2017 N PACEW 8260 1 U 1 (7 2 U 1 U10/10/2017 FD PACEW 8260 1 U 1 U 2 U 1 U
MW04-25-T5/2/2017 N PACEW 8260 1 U 1 U 2 U 1 U10/10/2017 N PACEW 8260 1 (7 1 U 2 U 1 U
MW04-26-BR5/4/2017 N PACEW 8260 1 (7 1 U 2 U 1 U10/10/2017 N PACEW 8260 1 U 1 U 2 U 1 U
MW04-27-T5/5/2017 N PACEW 8260 1 U 1 U 2 U 1 U10/13/2017 N PACEW 8260 1 U 1 U 2 U 1 U
MW04-28-I5/3/2017 N PACEW 8260 1 U 1 U 2 U 1 1/5/3/2017 FD PACEW 8260 1 U 1 U 2 U 1 U10/10/2017 N PACEW 8260 1 U 1 U 2 U 1 U10/10/2017 FD PACEW 8260 1 U 1 U 2 U 1 U
MW04-28-OPD5/4/2017 N PACEW 8260 1 U 1 U 2 U 1 U10/10/2017 N PACEW 8260 1 U 1 U 2 U 1 U
MW04-28-T5/4/2017 N PACEW 8260 1 U 1 U 2 U 1 1/10/10/2017 N PACEW 8260 1 U 1 U 2 U 1 (7
MW04-29-BR5/4/2017 N PACEW 8260 4 U 4 (7 8 U 4 U10/10/2017 N PACEW 8260 1 U 1 (7 2 U 1 U
MW04-30-BR5/5/2017 N PACEW 8260 1 U 1 U 2 U 1 (710/13/2017 N PACEW 8260 1 U 1 U 2 U 1 U
MW04-31-SP5/2/2017 N PACEW 8260 1 U 1 U 2 U 1 U10/11/2017 N PACEW 8260 1 U 1 U 2 U 1 U
MW04-31-T5/2/2017 N PACEW 8260 1 U 1 U 2 U 1 U10/11/2017 N PACEW 8260 1 U 1 U 2 U 1 U
MW04-33-SP5/3/2017 N PACEW 8260 1 L/ 1 U 2 U 1 U10/12/2017 N PACEW 8260 1 L/ 1 (7 2 U 1 U
MW04-33-T5/3/2017 N PACEW 8260 1 U 1 (7 2 U 1 U10/12/2017 N PACEW 8260 1 U 1 U 2 U 1 U
MW04-35-OPD5/4/2017 N PACEW 8260 1 U 1 u 2 U 1 U
MW04-43-OPD5/4/2017 N PACEW 8260 1 U 1 u 2 U 1 (7
Integral Consulting Inc. Page 2 o f 5

Appendix G
2017 Site Remediation Report
Former Ashland Lease Area
May 21, 2018
Table 3. Aromatic Hydrocarbons
DateSample
Type Lab Method
Toluene
(pg/L)
Ethylbenzene
(pg/L)
m,p-Xylenes
(pg/L)
o-Xylene(pg/L)
MW04-95-T5/1/2017 N PACEW 8260 1 U 1 U 2 U 1 U10/12/2017 N PACEW 8260 1 u 1 U 2 U 1 U
MW05-01-OPSH5/3/2017 N PACEW 8260 1 u 1 u 2 U 1 U5/3/2017 FD PACEW 8260 1 u 1 u 2 U 1 U10/13/2017 N PACEW 8260 1 u 1 u 2 U 1 U10/13/2017 FD PACEW 8260 1 u 1 u 2 U 1 U
MW05-02-T3/20/2017 N PACE 8260B 1,950 420 - -5/2/2017 N PACEW 8260 2,820 391 640 1909/12/2017 N PACE 8260B 12,900 J 1,630 J - -
10/10/2017 N PACEW 8260 585 235 274 174MW05-05-BR
5/4/2017 N PACEW 8260 1 U 1 U 2 U 1 U10/13/2017 N PACEW 8260 1 U 1 U 2 U 1 U
MW05-06-BR5/3/2017 N PACEW 8260 1 U 1 U 2 U 1 U10/13/2017 N PACEW 8260 1 U 1 U 2 U 1 U
MW05-08-OPSH5/4/2017 N PACEW 8260 1 U 1 U 2 U 1 U
MW05-09-OPSH5/3/2017 N PACEW 8260 1 U 1 D 2 U 1 U
MW05-15-BR5/5/2017 N PACEW 8260 1 U 1 U 2 U 1 U10/12/2017 N PACEW 8260 1 U 1 U 2 U 1 U
MW05-15-I5/5/2017 N PACEW 8260 1 U 1 U 2 U 1 U10/12/2017 N PACEW 8260 1 U 1 U 2 U 1 U
MW05-15-T5/5/2017 N PACEW 8260 1 U 1 U 2 U 1 U10/12/2017 N PACEW 8260 1 U 1 U 2 U 1 L/
MW05-21-T5/4/2017 N PACEW 8260 1 U 1 U 2 U 1 U10/9/2017 N PACEW 8260 1 U 1 U 2 U 1 U
MW05-68-OPSH5/3/2017 N PACEW 8260 1 U 1 U 2 U 1 U
MW06-01-BR5/5/2017 N PACEW 8260 1 U 1 U 2 U 1 U10/10/2017 N PACEW 8260 1 U 1 U 2 U 1 U
MW06-01-I5/5/2017 N PACEW 8260 1 U 1 u 2 U 1 U10/10/2017 N PACEW 8260 1 U 1 1/ 2 U 1 U
MW06-01-T5/5/2017 N PACEW 8260 1 U 1 u 2 U 1 1/10/10/2017 N PACEW 8260 1 U 1 u 2 U 1 U
MW06-23-OPSH5/3/2017 N PACEW 8260 1 u 1 D 2 U 1 U
MW06-248-I5/8/2017 N PACEW 8260 1 u 1 U 2 U 1 D10/12/2017 N PACEW 8260 1 u 1 U 2 U 1 U
MW06-257-I5/2/2017 N PACEW 8260 1 u 25.4 2 U 1 U10/9/2017 N PACEW 8260 1 u 7.0 2 U 1 U
Integral Consulting Inc. Page 3 o f 5

Appendix G
2017 Site Remediation Report
Former Ashland Lease Area
Map 21, 2018
Table 3. Aromatic Hydrocarbons
DateSample
Type Lab Method
Toluene
(pg/L)Ethylbenzene
(pg/L)m,p-Xylenes
(pg/L)o-Xylene
(pg/L)
MW06-258-I5/3/2017 N PACEW 8260 1 U 1 u 2 U 1 U10/9/2017 N PACEW 8260 5 U 5 U 10 U 5 U
MW06-29-I5/8/2017 N PACEW 8260 1 U 1 U 2 U 0.66 J10/11/2017 N PACEW 8260 1 U 1 U 2 U 1 U
MW07-01-OPSH5/3/2017 N PACEW 8260 1 U 1 U 2 U 1 U
MW07-02-I5/3/2017 N PACEW 8260 1.0 185 49.2 2.65/3/2017 FD PACEW 8260 1.0 184 49.3 2.810/9/2017 N PACEW 8260 1 u 14.0 4.0 1.210/9/2017 FD PACEW 8260 1 u 14.1 4.0 1.2
MW07-41-I5/8/2017 N PACEW 8260 1 u 1 U 2 U 1 U10/11/2017 N PACEW 8260 1 u 1 U 2 U 1 U
MW07-42-I5/4/2017 N PACEW 8260 1 u 1 U 2 U 1 U10/11/2017 N PACEW 8260 1 u 1 U 2 U 1 U
MW07-70-T5/2/2017 N PACEW 8260 1,720 444 68.3 44.110/9/2017 N PACEW 8260 1,170 374 46.8 36.1
MW07-71-T5/2/2017 N PACEW 8260 44,100 6,840 23,000 9,3908/30/2017 N PACE 8260B 25,400 J 6,220 - -10/9/2017 N PACEW 8260 3,620 726 2,020 876
MW10-03-T5/2/2017 N PACEW 8260 125,000 2,660 16,100 7,5308/30/2017 N PACE 8260B 93,500 4,060 -- -
10/9/2017 N PACEW 8260 102,000 4,300 23,400 10,100MW-309
5/2/2017 N PACEW 8260 55,900 6,070 11,200 3,5508/30/2017 N PACE 8260B 43,700 6,150 - -10/9/2017 N PACEW 8260 52,700 6,480 9,850 3.870
MW-3185/2/2017 N PACEW 8260 169,000 5,230 10,200 3,5808/30/2017 N PACE 8260B 150,000 J 8,110 J - --8/30/2017 FD PACE 8260B 148,000 J 7,970 - -
10/9/2017 N PACEW 8260 168,000 6,610 15,200 5,500MW-319
5/2/2017 N PACEW 8260 1 U 160 2 U 1.210/9/2017 N PACEW 8260 2 U 82.1 4 U 2 U
MW-401S5/3/2017 N PACEW 8260 5 U 454 182 9.210/9/2017 N PACEW 8260 5 U 446 195 9.7
MW-402S5/2/2017 N PACEW 8260 4,110 2,070 4,280 1,16010/9/2017 N PACEW 8260 3,110 1,950 3,610 1,100
MW-403D5/2/2017 N PACEW 8260 1 U 1 U 2 U 1 U10/13/2017 N PACEW 8260 1 U 1 U 2 U 1 U
Integral Consulting Inc. Page 4 o f 5

Appendix G
2017 Site Remediation Report
Former Ashland Lease Area
May 21, 2018
Table 3. Aromatic Hydrocarbons
Date_________ Type_____ Lab_____ MethodSample
Toluene
(pg/L)Ethylbenzene
(pg/L)m,p-Xylenes
(pg/L)o-Xylene
(pg/L)
Notes:FD = field duplicate sample N = normal investigative samplePACEW = Pace Analytical Services, Inc., Minneapolis, MN
J = The associated numerical value is an estimated quantity.U = The material was analyzed for, but was not detected. The associated numerical value is the sample quantitation limit.
Integral Consulting Inc. Page 5 of 5

Appendix G
2017 Site Remediation Report
Former Ashland Lease Area
May 21, 2018
Table 4. Anions
DateSample
Type Lab Method
Bromide
(mg/L)
Chloride
(mg/L)
Nitrate
(mg/L)
Sulfate
(mg/L)
MW02-01-OPD5/3/2017 N PACEW 300 - 49.5 1.1 U 77.25/3/2017 FD PACEW 300 -- 48.2 1.1 U 75.2
MW03-52-OPD5/3/2017 N PACEW 300 - 91.3 0.22 U 155
MW03-53-OPD5/3/2017 N PACEW 300 - 81.4 0.22 U 129
MW03-88-OPD5/4/2017 N PACEW 300 - 63.1 0.22 U 160
MW04-189-T5/2/2017 N PACEW 300 1.5 U 29.5 1.1 U 51.810/9/2017 N PACEW 300 0.45 20.7 0.22 U 38.6
MW04-192-T5/2/2017 N PACEW 300 1.5 U 230 1.1 U 1065/2/2017 FD PACEW 300 1.5 U 262 1.1 U 11810/9/2017 N PACEW 300 1.5 U 242 1.1 U 104
10/9/2017 FD PACEW 300 1.5 U 242 1.1 U 104MW04-28-OPD
5/4/2017 N PACEW 300 - 51.8 0.22 U 76.8MW04-35-OPD
5/4/2017 N PACEW 300 - 55.9 0.22 U 92.1MW04-43-OPD
5/4/2017 N PACEW 300 ~ 112 1.1 U 103MW05-01-OPSH
5/3/2017 N PACEW 300 - 79.1 0.22 U 1095/3/2017 FD PACEW 300 - 75.3 0.22 U 103
MW05-02-T5/2/2017 N PACEW 300 1.5 U 212 1.1 U 12110/10/2017 N PACEW 300 1.5 U 268 1.1 U 40.1
MW05-08-OPSH5/4/2017 N PACEW 300 - 72.2 0.22 U 114
MW05-09-OPSH5/3/2017 N PACEW 300 - 51.7 1.1 U 93.6
MW05-21-T5/4/2017 N PACEW 300 1.5 U 252 1.1 U 8.0 J10/9/2017
MW05-68-OPSHN PACEW 300 3 U 461 2.2 U 30 U
5/3/2017 N PACEW 300 - 65.5 0.22 U 195MW06-23-OPSH
5/3/2017 N PACEW 300 - 62.5 0.22 U 158MW06-258-I
5/3/2017 N PACEW 300 0.3 U 523 0.22 U 32.410/9/2017 N PACEW 300 3 U 379 2.2 U 56.2
MW07-01-OPSH5/3/2017 N PACEW 300 - 59.9 0.22 U 105
MW07-02-I5/3/2017 N PACEW 300 0.3 U 131 0.22 U 19.95/3/2017 FD PACEW 300 0.3 U 129 0.22 U 18.510/9/2017 N PACEW 300 0.3 U 167 0.22 U 20.110/9/2017 FD PACEW 300 0.13 J 171 0.22 U 22.6
Integral Consulting Inc. Page 1 of 2

Appendix G2017 Site Remediation Report
Former Ashland Lease Area
May 21,2018
Table 4. Anions
DateSample
Type Lab Method
Bromide(mg/L)
Chloride(mg/L)
Nitrate(mg/L)
Sulfate(mg/L)
MW07-70-T5/2/2017 N PACEW 300 0.61 J 23.4 1.1 U 66.610/9/2017 N PACEW 300 0.54 35.9 0.22 U 51.1
MW07-71-T5/2/2017 N PACEW 300 1.2 J 40.5 1.1 U 15 U10/9/2017 N PACEW 300 1.6 66.3 1.1 U 6.0 J
MW10-03-T5/2/2017 N PACEW 300 8.0 196 1.1 U 16010/9/2017 N PACEW 300 3.6 153 1.1 U 259
MW-3095/2/2017 N PACEW 300 2.3 70.0 1.1 U 92.710/9/2017 N PACEW 300 2.2 67.0 1.1 U 87.3
MW-3185/2/2017 N PACEW 300 10.9 195 1.1 U 18210/9/2017 N PACEW 300 11.3 172 1.1 U 231 *
MW-3195/2/2017 N PACEW 300 1.5 U 52.6 1.1 u 18.910/9/2017 N PACEW 300 3.7 56.8 1.1 u 29.3
MW-401S5/3/2017 N PACEW 300 1.5 U 17.0 1.1 u 15 U10/9/2017 N PACEW 300 1.5 U 72.4 1.1 u 15 U
MW-402S5/2/2017 N PACEW 300 1.5 J 83.7 1.1 u 15 U10/9/2017 N PACEW 300 1.5 71.2 1.1 u 15 U
Notes:FD = field duplicate sample N = normal investigative samplePACEW = Pace Analytical Services, Inc., Minneapolis, MN ~ = not available
J = The associated numerical value is an estimated quantity.U = The material was analyzed for, but was not detected. The associated numerical value is the sample quantitation limit.
Integral Consulting Inc. Page 2 of 2

Appendix G
2017 Site Remediation Report
Former Ashland Lease Area
Table 5. Methane and Carbon Dioxide
DateSample
Type , Lab Method
Methane
(pg/L)
Carbon Dioxide
(mg/L)
MW02-01-OPD5/3/2017 N PACEW 8015B 11.3 --5/3/2017 N VAPOR A2.01 - 20.55/3/2017 FD PACEW 8015B 16.6 -5/3/2017 FD VAPOR A2.01 -- 19.3
MW03-52-OPD5/3/2017 N PACEW 8015B 41.8 --5/3/2017 N VAPOR A2.01 -- 29.8
MW03-53-OPD5/3/2017 N PACEW 8015B 2.3 J -
5/3/2017 N VAPOR A2.01 - 32.7MW03-88-OPD
5/4/2017 N PACEW 8015B 16.8 -5/4/2017 N VAPOR A2.01 - 22.3
MW04-189-T5/2/2017 N PACEW 8015B 66.1 -
5/2/2017 N VAPOR A2.01 - 16910/9/2017 N PACEW 8015B 66.6 -
10/9/2017 N VAPOR A2.01 - 108MW04-192-T
5/2/2017 N PACEW 8015B 1,180 -5/2/2017 N VAPOR A2.01 - 66.75/2/2017 FD PACEW 8015B 761 ~5/2/2017 FD VAPOR A2.01 - 61.310/9/2017 N PACEW 8015B 1,170 -10/9/2017 N VAPOR A2.01 - 59.710/9/2017 FD PACEW 8015B 2,060 -10/9/2017 FD VAPOR A2.01 - 63.3
MW04-28-OPD5/4/2017 N PACEW 8015B 7.1 U -
5/4/2017 N VAPOR A2.01 - 19.2MW04-35-OPD
5/4/2017 N PACEW 8015B 7.2 --5/4/2017 N VAPOR A2.01 -- 26.3
MW04-43-OPD5/4/2017 N PACEW 8015B 142 -5/4/2017 N VAPOR A2.01 - 39.3
MW05-01-OPSH5/3/2017 N PACEW 8015B 6.7 J -5/3/2017 N VAPOR A2.01 - 22.25/3/2017 FD PACEW 8015B 9.8 -5/3/2017 FD VAPOR A2.01 - 23.7
MW05-02-T5/2/2017 N PACEW 8015B 3,300 --5/2/2017 N VAPOR A2.01 - 10510/10/2017 N PACEW 8015B 198 -
10/10/2017 N VAPOR A2.01 - 18.9MW05-08-OPSH
5/4/2017 N PACEW 8015B 37.5 -5/4/2017 N VAPOR A2.01 - 31.4
MW05-09-OPSH5/3/2017 N PACEW 8015B 40.5 -5/3/2017 N VAPOR A2.01 -- 26.4
Ititegral Consulting Inc. Page 1 o f 3

Appendix G
2017 Site Remediation ReportFormer Ashland Lease Area
May 21, 2018
Table 5. Methane and Carbon Dioxide
DateSample
Type Lab Method
Methane
(pg/L)Carbon Dioxide
(mg/L)
MW05-21-T5/4/2017 N PACEW 8015B 745 -5/4/2017 N VAPOR A2.01 - 52.010/9/2017 N PACEW 8015B 219 -10/9/2017 N VAPOR A2.01 -- 63.7
MW05-68-OPSH5/3/2017 N PACEW 8015B 50.5 -5/3/2017 N VAPOR A2.01 - 19.2
MW06-23-OPSH5/3/2017 N PACEW 8015B 20.0 -5/3/2017 N VAPOR A2.01 - 29.2
MW06-258-I5/3/2017 N PACEW 8015B 79.8 -5/3/2017 N VAPOR A2.01 - 1.310/9/2017 N PACEW 8015B 114 -10/9/2017 N VAPOR A2.01 -- 1.6
MW07-01-OPSH5/3/2017 N PACEW 8015B 245 -5/3/2017 N VAPOR A2.01 - 27.5
MW07-02-I5/3/2017 N PACEW 8015B 994 -5/3/2017 N VAPOR A2.01 - 15.15/3/2017 FD PACEW 8015B 1,210 -5/3/2017 FD VAPOR A2.01 - 14.510/9/2017 N PACEW 8015B 523 --10/9/2017 N VAPOR A2.01 - 7.810/9/2017 FD PACEW 8015B 670 -10/9/2017 FD VAPOR A2.01 - 6.1
MW07-70-T5/2/2017 N PACEW 8015B 1,820 --5/2/2017 N VAPOR A2.01 - 47.810/9/2017 N PACEW 8015B 666 -10/9/2017 N VAPOR A2.01 - 30.8
MW07-71-T5/2/2017 N PACEW 8015B 1,310 -5/2/2017 N VAPOR A2.01 - 90.210/9/2017 N PACEW 8015B 352 -
10/9/2017 N VAPOR A2.01 - 88.1MW10-03-T
5/2/2017 N PACEW 8015B 462 -
5/2/2017 N VAPOR A2.01 - 18810/9/2017 N PACEW 8015B 402 -10/9/2017 N VAPOR A2.01 - 202
MW-3095/2/2017 N PACEW 8015B 6,340 -5/2/2017 N VAPOR A2.01 - 13110/9/2017 N PACEW 8015B 8,160 ~10/9/2017 N VAPOR A2.01 - 119
MW-3185/2/2017 N PACEW 8015B 3,360 -5/2/2017 N VAPOR A2.01 - 10910/9/2017 N PACEW 8015B 5,160 -10/9/2017 N VAPOR A2.01 - 104
Integral Consulting Inc. Page 2 of 3

Appendix G
2017 Site Remediation ReportFormer Ashland Lease Area
Table 5. Methane and Carbon Dioxide
DateSample
Type . Lab Method
Methane
(M9/L)
Carbon Dioxide
(mg/L)
MW-3195/2/2017 N PACEW 8015B 7,700 -5/2/2017 N VAPOR A2.01 - 81.010/9/2017 N PACEW 8015B 5,960 -10/9/2017 N VAPOR A2.01 - - 72.2
MW-401S5/3/2017 N PACEW 8015B 11,400 -5/3/2017 N VAPOR A2.01 - 27310/9/2017 N PACEW 8015B 13,400 --10/9/2017 N VAPOR A2.01 -- 192
MW-402S5/2/2017 N PACEW 8015B 2,990 -5/2/2017 N VAPOR A2.01 - 60.610/9/2017 N PACEW 8015B 2,300 -10/9/2017 N VAPOR A2.01 -- 53.1
Notes:FD = field duplicate sample N = normal investigative samplePACEW = Pace Analytical Services, Inc., Minneapolis, MN VAPOR = Vaportech Services, Inc., Green Bay, Wl - = not available
May 21, 2018
Integral Consulting Inc. Page 3 of 3

Appenm Kb2017 Site Remediation ReportFormer Ashland Lease Area
2018
Table 6. Other Monitored Natural Attenuation ParametersAlkalinity,
bicarbonateAlkalinity,carbonate
Alkalinity,total
Alkalinity, total as CaC03 Nitrite Ammonia Phosphorus Sodium Sulfide
Total Organic Carbon
PACEW PACEW PACEW PACEW PACEW PACEW PACEW PACEW PACEW PACEW
Sample Date Type
SM 2320B SM 2320B EPA 310.2 SM 2320B EPA 300.0 EPA 350.1 EPA 365.4 EPA 6010 SM 4500-S2 F SM 5310C(mg/L) (mg/L) (mg/L) (mg/L) (mg/L) (mg/L) (mg/L) (mg/L) (mg/L) (mg/L)
MW02-01-OPD5/3/2017 N - - 327 - - — - - — 0.42 J5/3/2017 FD - - 326 - - — - - — 0.38 J
MW03-52-OPD5/3/2017 N — - 333 - — — — — — 0.43 J
MW03-53-OPD5/3/2017 N - - . 347 - — — — — - 0.57 J
MW03-88-OPD5/4/2017 N - - 297 - - - — - - 0.45 J
MW04-189-T5/2/2017 N 788 10 U - 788 0.75 U 0.24 0.16 J 65.4 2.0 J 28.410/9/2017 N 667 10 u - 667 0.15 U 1.3 0.14 J 62.1 4 U 17.0
IWW04-192-T5/2/2017 N 460 10 u - 460 0.75 U 0.37 0.17 J 90.4 4 U 1.75/2/2017 FD 451 10 u - 451 0.75 U 0.45 0.13 J 97.0 4 U 5.910/9/2017 N 457 10 u - 457 0.75 U 3.5 0.16 J ■ 96.2 4 U 5.810/9/2017 FD 463 10 u - 463 0.75 U 0.58 0.18 J 100 4 U 5.9
NIW04-28-OPD5/4/2017
MW04-35-OPDN — — 325 — — — — — — 0.39 J
5/4/2017 N - — 343 - — — — — — 0.35 JMW04-43-OPD
5/4/2017 N - - 424 — - — — — — 0.35 JMW05-01-OPSH
5/3/2017 N _ . - 358 - — — — — — 0.49 J5/3/2017 FD - — 359 - - — — — — 0.50 J
MW05-02-T5/2/2017 N 565 10 u - 565 0.75 U 0.61 0.22 J 88.0 4 U 8.410/10/2017 N 458 10 u - 458 0.75 U 8.2 0.87 102 4 U 11.4
MW05-08-OPSH5/4/2017
MW05-09-0PSHN . — — 340 — — “ -- — — 0.39 J
5/3/2017 N - — 328 - — — — — 0.34 J
Integral Consulting Inc. Page 1 of 3

Appenc2017 Site Remediation ReportFormer Ashland Lease Area
Table 6. Other Monitored Natural Attenuation Parameters
2018
DateSample
Type
Alkalinity,bicarbonate
PACEW
SM 2320B(mg/L)
Alkalinity,carbonate
PACEW
SM 2320B(mg/L)
MW05-21-T5/4/2017 N 848 7.6 J10/9/2017 N 772 10 U
MW05-68-OPSH5/3/2017 N - —
MW06-23-OPSH5/3/2017 N - —
MW06-258-15/3/2017 N 318 32.710/9/2017 N 350 29.9
MW07-01-OPSH5/3/2017 N - —
MW07-02-I5/3/2017 N 458 33.15/3/2017 FD 446 32.710/9/2017 N 475 10 U10/9/2017 FD 470 10 U
MW07-70-T5/2/2017 N 528 10 U10/9/2017 N 480 7.8 J
MW07-71-T5/2/2017 N 640 10 U10/9/2017 N 614 10 U
MW10-03-T5/2/2017 N 776 10 U10/9/2017 N 764 10 U
MW-3095/2/2017 N 744 10 U10/9/2017 N 688 10 U
MW-3185/2/2017 N 616 10 U10/9/2017 N 646 10 u
Alkalinity,total
PACEW
EPA 310.2(mg/L)
Alkalinity, total as CaC03
PACEW
SM 2320B(mg/L)
Total OrganicNitrite Ammonia Phosphorus Sodium Sulfide Carbon
PACEW PACEW PACEW PACEW PACEW PACEW
EPA 300.0 EPA 350.1 EPA 365.4 EPA6010 SM 4500-S2 F SM 5310C(mg/L) (mg/L) (mg/L) (mg/L) (mg/L) (mg/L)
327
317
326
856 0.75 U 0.53 0.16 J 410 4 U 5.7772 1.5 U 0.33 0.4 U 481 4 U 0.93
-- - -- - -- - 0.65 J
-- - -- - - - 0.67 J
350 0.15 U 0.41 0.19 J 404 1.2 J 0.26 J380 1.5 U 1.4 0.10 J 361 3.4 J 0.72 J
-- - -- - -- - 0.51 J
491 0.15 U 0.62 0.89 195 4 U 5.5478 0.15 U 0.41 0.83 197 4 U 5.5475 0.15 U 3.4 1.0 215 4 U 5.3470 0.15 U 1.2 1.1 210 4 U 3.9
528 0.75 U 1.3 0.067 J 25.5 4 U 8.5488 0.15 U 1.8 0.058 J 23.9 4 U 6.6
640 . 0.75 U 1.2 0.43 77.9 4 U 50.3614 0.75 U 2.1 0.30 J 99.2 2.6 J 64.5
776 0.75 U 0.28 0.4 U 191 4 U 69.8764 0.75 U 1.7 0.4 U 195 1.2 J 87.6
744 0.75 U 0.39 0.085 J 54.1 1.8 J 51.1688 0.75 U 1.3 0.11 J 62.6 4 U 46.8
616 0.75 U 0.42 0.4 U 96.3 4 U 60.6646 0.75 U 1.3 0.4 U 88.5 4 U 69.2
Integral Consulting Inc. Page 2 of 3

Appem \ 20182017 Site Remediation ReportFormer Ashland Lease Area
Table 6. Other Monitored Natural Attenuation Parameters
DateSampleType
Alkalinity,bicarbonate
PACEW
SM 2320B(mg/L)
Alkalinity,carbonate
PACEW
SM 2320B (mg/L)
Alkalinity,total
PACEW
EPA 310.2 (mg/L)
Alkalinity, total as CaC03
PACEW
SM 2320B(mg/L)
Nitrite
PACEW
EPA 300.0 (mg/L)
Ammonia
PACEW
EPA 350.1 (mg/L)
Phosphorus
PACEW
EPA 365.4 (mg/L)
Sodium
PACEW
EPA 6010 (mg/L)
Sulfide
PACEW
SM 4500-S2 F (mg/L)
Total Organic Carbon
PACEW
SM 5310C(mg/L)
MW-3195/2/2017 N 536 10 U - 536 0.75 U 0.48 0.4 U 33.7 4 U 6.910/9/2017 N 486 7.5 J - 493 0.75 U 2.3 0.4 U 39.1 4 U 5.6
MW-401S5/3/2017 N 632 10 U - 632 0.75 U 0.69 0.19 J 18.9 1.6 J 14.010/9/2017 N 462 10 U « 462 0.75 U 1.2 0.19 J 39.6 4 U 6.3
MW-402S5/2/2017 N 610 10 U - 610 0.75 U 1.3 0.23 J 74.2 4 U 13.910/9/2017 N 608 10 U -- 608 0.75 U 2.1 0.16 J 72.3 4 U 12.0
Notes:FD = field duplicate sample N = normal investigative samplePACEW = Pace Analytical Services, Inc., Minneapolis, MN -- = not availableJ = The associated numerical value is an estimated quantity.U = The material was analyzed for, but was not detected. The associated numerical value is the sample quantitation limit.
Integral Consulting Inc. Page 3 of 3

A p p en a ^ J2017 Site Remediation ReportFormer Ashland Lease Area
[, 2 018
Table 7. Field Parameter Measurements
Date
Temperaturet°C)
pH(SU)
DissolvedOxygen(mg/L)
OxidationReductionPotential
(mV)Conductivity
(pS/cm)Turbidity
(NTU)Iron (II) (ng/L)
iron (III) (M9/L)
Manganese (II) (Mg/L)
MWQ0-39-BR5/2/2017 12.43 6.91 0.41 -64.9 2,371 29.2 —
MW00-40-T5/8/2017 11.44 J 7.63 J 3.28 J -18.6 J 747 J 72.4 J — — —
10/12/2017 11.98 J 7.31 J 2.51 J 23.9 J 522 J 56.7 J — — __
MW00-41 -T5/3/2017 13.69 J 7.55 J 3.15 J -25.3 J 752 J 17.6 J — — _
10/11/2017MW00-42-MS
11.92 J 7.41 J 2.75 J -35.8 J 575 J 26.9 J - -
5/3/2017 12.62 7.96 0.94 -140.5 1,420 12.8 — — —
10/9/2017 12.87 7.76 0.47 -109.5 1,007 28.8 — __
MW00-42-T5/5/2017 12.50 J 7.56 J 3.64 J -24.4 J 950 J 14.5 J ~ - , __
10/9/2017 11.95 J 7.32 J 3.45 J -11.7 J 843 J 19.2 J — - , „
MW00-43-BR5/3/2017 11.94 7.43 1.00 -59.2 1,329 21.5 — — —
10/12/2017 12.28 7.23 0.46 8.9 675 9.09 — « __
MW00-43-T5/3/2017 11.52 J 8.31 J 4.91 J 6.0 J 499 J 20.0 J — — —
10/12/2017 12.57 J 8.24 J 4.84 J 9.8 J 426 J 30.2 J — « _ _
MW02-01-OPD5/3/2017 11.55 7.49 1.35 -77.7 854 14.9 800 200 010/12/2017 12.75 7.79 0.62 -143.4 661 10.9 — —
MW02-03-BR5/5/2017 11.51 7.77 0.92 -233.3 2,415 5.51 — —
10/12/2017 12.68 7.20 0.94 -135.4 2,126 3.16 — „ „
MW02-03-I5/5/2017 12.17 8.59 0.91 -259.2 1,160 1.78 — _ * *
10/12/2017MW03-52-OPD
12.79 8.50 0.56 -270.5 989 4.18 - - -
5/3/2017 11.23 7.36 0.99 -56.8 1,084 2.68 200 200 300MW03-53-OPD
5/3/2017 10.77 7.50 1.04 -114.2 1,063 2.05 200 400 300MW03-56-BR
5/2/2017 11.85 8.33 0.68 -256.9 719 3.65 — __10/11/2017 11.66 7.89 0.38 -172.9 704 4.19 _ —
MW03-61-OPD5/1/2017 8.70 7.44 4.56 -25.6 542 3.75 — __ __10/11/2017 11.85 7.34 0.68 -14.7 640 10.9 - -- --
Integral Consulting Inc. Page 1 o f 5

A ppencn^ J2017 Site Remediation ReportFormer Ashland Lease Area
2018
Table 7. Field Parameter Measurements
Date
Temperature(°C)
pH(SU)
DissolvedOxygen(mg/L)
OxidationReductionPotential
(mV)Conductivity
(pS/cm)Turbidity
(NTU)Iron (II)
(pg/L)
Iron (ill) (pg/L)
Manganese (II) (Mg/L)
MW03-88-OPD5/4/2017 12.58 7.37 0.88 -91.8 760 0.82 1,400 200 0
MW04-155-T5/5/2017 11.47 J 7.74 J 5.12 J -11.4 J 636 J 69.2 J — —10/12/2017
MW04-189-T11.56 J 7.50 J 5.35 J 55.7 J 493 J 22.0 J - - --
5/2/2017 12.96 7.00 0.78 -136.9 1,188 0.40 500 500 90010/9/2017
MW04-191-T13.00 6.95 0.51 -106.1 1,311 3.14 700 300 400
5/2/2017 12.42 6.76 0.62 -96.2 2,210 0.80 —10/9/2017
MW04-192-T14.00 6.77 3.28 -54.5 1,726 10.8 - " -
5/2/2017 .. - - - - — 1,600 5,400 10010/9/2017 - - - - - - 900 4,300 200
MW04-24-T5/4/2017 11.54 J 7.48 J 3.79 J -2.0 J 1,098 J 29.9 J — __10/10/2017
MW04-25-T11.51 J 7.35 J 2.56 J 9.5 J 763 J 35.9 J - - -
5/2/2017 11.68 J 7.81 J 6.09 J 52.2 J 710 J 64.3 J __10/10/2017 11.36 J 7.49 J 4.60 J 7.6 J 518 J 16.6 J __
MW04-26-BR5/4/2017 12.19 7.11 1.13 -73.2 1,333 6.90 —10/10/2017 12.72 6.99 0.56 2.2 1,208 8.11 _
MW04-27-T5/5/2017 11.59 J 7.61 J 7.01 J 0.1 J 858 J 12.6 J —10/13/2017 10.62 J 7.69 J 5.99 J 23.5 J 845 J 12.0 J __ _
MW04-28-I'5/3/2017 11.96 7.31 1.09 -87.1 714 3.4110/10/2017
MW04-28-OPD12.73 7.93 0.48 -50.9 335 4.28 - - -
5/4/2017 11.38 7.53 1.81 -97.5 858 6.19 200 400 30010/10/2017
MW04-28-T12.25 7.84 0.96 -91.5 666 9.99 - - -
5/4/2017 11.83 J 7.84 J 6.96 J -35.9 J 514 J 40.6 J _ __10/10/2017 12.17 J 7.50 J 6.37 J -16.9 J 371 J 19.7 J __ _ _
MW04-29-BR5/4/2017 12.65 9.84 0.87 -144.5 595 3.44 _ _10/10/2017 13.03 8.99 0.58 -40.0 425 3.08 - - -
Integral Consulting Inc. Page 2 of 5

A p p en a ^ J2017 Site Remediation ReportFormer Ashland Lease Area
2018
Table 7. Field Parameter Measurements
Date
TemperatureCO
pH(SU)
DissolvedOxygen(mg/L)
OxidationReductionPotential
(mV)Conductivity
(pS/cm)Turbidity
(NTU)Iron (II) (pg/L)
iron (III) (pg/L)
Manganese (II)
(pg^L)MW04-30-BR
5/5/2017 12.38 7.18 0.19 -45.3 853 6.17 ~ — —
10/13/2017 12.22 7.37 0.85 44.1 766 2.25 — _ _MW04-31-SP
5/2/2017 12.89 8.29 1.70 -5.4 424 5.12 — — —
10/11/2017 12.92 8.20 1.79 -56.9 306 11.32 — _ __
MW04-31-T5/2/2017 13.31 J 7.77 J 7.50 J -25.9 J 600 J 7.86 J _ —
10/11/2017 12.27 J 7.45 J 6.83 J -9.2 J 481 J 11.7 J — _ __
MW04-33-SP5/3/2017 13.15 7.88 0.74 -18.5 727 3.03 — __
10/12/2017 14.01 8.01 0.70 25.1 830 5.53 — __ _MW04-33-T
5/3/2017 12.94 J 7.98 J 5.93 J 6.8 J 393 J 138 J — __
10/12/2017 12.49 J 7.89 J 5.33 J 60.6 J 458 J 34.8 J — _
MW04-35-OPD5/4/2017 13.85 7.42 0.82 -44.9 737 1.32 200 400 500
MW04-43-OPD5/4/2017 13.10 7.24 1.06 -83.0 1,228 11.1 600 1,400 600
MW04-95-T5/1/2017 11.62 J 7.37 J 7.46 J -67.7 J 295 J 19.8 J — — _
10/12/2017 11.75 J 7.48 J 7.90 J -21.2 J 444 J 6.40 J — _ __
MW05-01-OPSH5/3/2017 12.23 7.48 1.38 -79.4 814 6.64 600 0 40010/13/2017
MW05-02-T12.68 7.48 0.89 -22.7 1,024 4.03 - “ -
5/2/2017 - - - - - - 1,800 6,700 1,40010/10/2017 - - - - - — 300 3,500 100
MW05-Q5-BR5/4/2017 13.61 8.03 0.91 -161.0 1,519 8.75 — . .
10/13/2017MW05-06-BR
13.21 7.70 0.56 -202.6 1,663 3.75 - - -
5/3/2017 12.49 7.50 0.77 -139.1 737 1.17 _ _ __
10/13/2017 12.25 7.25 0.89 -67.3 969 1.71 _ _MW05-08-OPSH
5/4/2017 11.56 7.34 1.22 -86.8 768 0.55 1,400 200 0MW05-09-OPSH
5/3/2017 11.16 7.35 0.23 -45.7 907 15.7 300 800 100
Integral Consulting Inc. Page 3 of 5

2017 Site Remediation ReportFormer Ashland Lease Area
2018
Table 7. Field Parameter Measurements
DateTemperature
COPH
(SU)
DissolvedOxygen(mg/L)
OxidationReductionPotential
(mV)Conductivity
(pS/cm)Turbidity
(NTU)Iron (II)
(pg/L)Iron (III) (pg/L)
Manganese (II) (pg/L)
MW05-15-BR5/5/2017 11.57 7.53 1.69 -112.7 1,403 8.55 —10/12/2017 13.04 7.50 1.33 -72.4 1,055 10.94 _
MW05-15-I5/5/2017 11.72 7.23 1.25 -103.5 2,193 12.5510/12/2017 12.94 7.49 0.81 -106.2 1,830 8.22 —
MW05-15-T5/5/2017 12.25 J 7.78 J 5.91 J 17.0 J 2,007 J 85.0 J __10/12/2017 12.63 J 7.55 J 4.93 J 8.5 J 1,219 J 41.4 J — __
MW05-21-T5/4/2017 13.85 7.52 0.85 -149.5 2,383 4.19 2,000 400 60010/9/2017 13.79 7.23 2.22 -127.1 2,665 0.86 1,500 300 300
MW05-68-OPSH5/3/2017 13.44 7.57 0.15 -113.3 1,202 1.55 900 600 200
MW06-01-BR5/5/2017 12.22 7.30 1.07 -44.0 1,712 24.4 _ __10/10/2017 12.64 7.20 2.75 -29.4 1,767 7.90 __ __ _
MW06-01-15/5/2017 12.23 7.76 0.90 -191.5 1,681 0.0 «10/10/2017 12.93 7.69 2.26 -140.8 638 9.06 — _ _
MW06-01-T5/5/2017 12.56 J 7.86 J 3.81 J -26.7 J 1,262 J 49.6 J —10/10/2017 12.32 J 7.63 J 4.47 J 28.7 J 1,426 J 22.1 J __
MW06-23-OPSH5/3/2017
MW06-248-112.55 7.25 0.40 -67.2 1,050 0.48 1,100 700 200
5/8/2017 11.54 7.71 1.57 -99.1 592 3.20 — _10/12/2017 12.41 7.47 0.52 -50.0 463 1.51 __ _
MW06-257-]5/2/2017 11.57 7.57 1.34 -115.9 1,009 2.20 — _10/9/2017 12.12 7.39 2.72 -113.9 928 2.02 _
MW06-258-I5/3/2017 12.60 8.88 0.76 -202.2 1,759 5.05 0 600 010/9/2017 13.11 8.70 0.35 -226.1 2,073 3.38 0 400 0
MW06-29-I5/8/2017 12.58 7.52 0.85 -172.3 1,383 6.82 __ __ _10/11/2017 13.08 7.65 0.63 -133.6 958 4.82 __ __ _
W1W07-01-OPSH5/3/2017 11.31 7.30 0.16 -80.5 930 0.88 600 900 100
Integral Cons idling Inc. Page 4 of 5

A ppentn^F2017 Site Remediation ReportFormer Ashland Lease Area
A 2 0 1 S
Table 7. Field Parameter Measurements
Date
Temperature
(*C)
pH(SU)
DissolvedOxygen(mg/L)
OxidationReductionPotential
(mV)
Conductivity(pS/cm)
Turbidity(NTU)
Iron (II)
(MQ/L)
Iron (III)
(pg/L)
Manganese (II)
(MO/L)
MW07-02-I5/3/2017 12.42 7.99 0.59 -197.3 986 3.31 2,200 400 50010/9/2017 12.72 8.18 1.56 -158.5 1.290 9.72 800 300 100
MW07-41-I5/8/2017 12.54 8.14 2.78 -57.3 380 4.99 — — —
10/11/2017 12.94 7.70 3.27 -56.4 272 10.73 — _
MW07-42-I5/4/2017 13.15 7.89 4.83 19.0 528 3.63 _ — —
10/11/2017 12.76 7.73 6.43 77.3 368 19.3 — _ _
MW07-70-T5/2/2017 12.48 7.36 1.82 -133.3 852 6.20 3,000 1,000 1,30010/9/2017 13.02 7.44 0.45 -134.6 1,080 3.10 600 200 600
MW07-71-T5/2/2017 11.42 7.17 1.16 -112.5 1,334 12.2 2,400 3,600 40010/9/2017 13.10 6.99 0.67 -96.6 1,088 19.9 2,200 3,400 400
MW10-03-T5/2/2017 11.78 6.71 0.21 -38.8 2,385 3.49 1,700 5,800 90010/9/2017 12.42 6.80 4.06 -80.6 2.267 5.62 1,100 3,500 300
MW-3095/2/2017 13.33 7.09 087 -190.7 1,384 3.76 2,600 3,000 010/9/2017 13.14 6.90 0.49 -76.7 1,199 3.57 3,800 2,800 300
MW-3185/2/2017 13.19 7.01 1.23 -110.8 1,587 10.1 3,000 4,000 30010/9/2017 13.29 7.03 082 -120.1 2,124 2.34 1,800 5,000 600
MW-3195/2/2017 11.37 7.20 1.49 -115.4 855 0.69 2,500 4,500 30010/9/2017 12.02 7.14 0.58 -84.2 1,135 1.68 2,600 4,800 300
MW-401S5/3/2017 12.42 6.63 2.64 -87.3 969 2.16 2,200 3,400 010/9/2017 12.24 6.59 0.46 -70.9 1,183 2.16 2,200 4,800 1,000
MW-402S5/2/2017 12.60 7.29 0.71 -127.2 1,379 3.68 3,600 5,400 20010/9/2017 13.52 7.10 0.49 -96.1 1,008 1.10 3,400 600 600
MW-403D5/2/2017 11.58 7.92 1.18 -1.3 1,047 8.71 — — _
10/13/2017 12.15 8.03 0.41 19.6 802 11.14 - - -
Notes:-- = not availableJ = The associated numerical value is an estimated quantity.
Integral Consulting Inc. Page 5 o f 5

Appendix G
2017 Site Remediation Report
Former Ashland Lease Area
Table 8. Water Level Measurements, Groundwater Monitoring Wells
Date
Depth to Groundwater
(ft bTOC)
Depth to Groundwater
(ft bgs)
Groundwater Elevation (ft amsl)
MW04-187-T
3/20/2017 31.52 29.09 825.21
6/29/2017 30.96 28.53 825.779/12/2017 30.51 28.08 826.2212/7/2017 31.06 28.63 825.67
MW04-188-T3/20/2017 29.58 26.90 827.20
MW04-189-T3/20/2017 34.10 31.27 823.136/29/2017 30.59 27.76 826.6412/7/2017 31.30 28.47 825.93
MW04-190-T3/20/2017 34.51 31.88 823.52
MW04-191-T3/20/2017 33.62 31.04 824.066/29/2017 32.51 29.93 825.179/12/2017 33.45 30.87 824.2312/7/2017 33.17 30.59 824.51
MW04-192-T1/26/2017 34.12 31.13 824.072/14/2017 33.20 30.21 824.993/20/2017 57.10 54.11 801.094/3/2017 35.10 32.11 823.095/4/2017 57.00 54.01 801.196/29/2017 53.31 50.32 804!887/26/2017 51.11 48.12 807.088/31/2017 56.96 53.97 801.239/12/2017 57.04 54.05 801.1510/4/2017 56.99 54.00 801.2011/1/2017 56.49 53.50 801.7012/7/2017 56.84 53.85 801.35
MW05-02-T3/20/2017 25.97 26.45 828.246/29/2017 29.27 29.75 824.949/12/2017 29.46 29.94 824.7512/7/2017 29.34 29.82 824.87
MW05-21-T3/20/2017 29.64 30.62 823.656/29/2017 26.55 27.53 826.749/12/2017 26.64 27.62 826.6512/7/2017 26.98 27.96 826.31
MW06-257-I3/20/2017 34.05 34.05 824.756/29/2017 33.70 33.70 825.109/12/2017 33.86 33.86 824.9412/7/2017 33.89 33.89 824.91
Integral Consulting Inc. Page 1 of 3
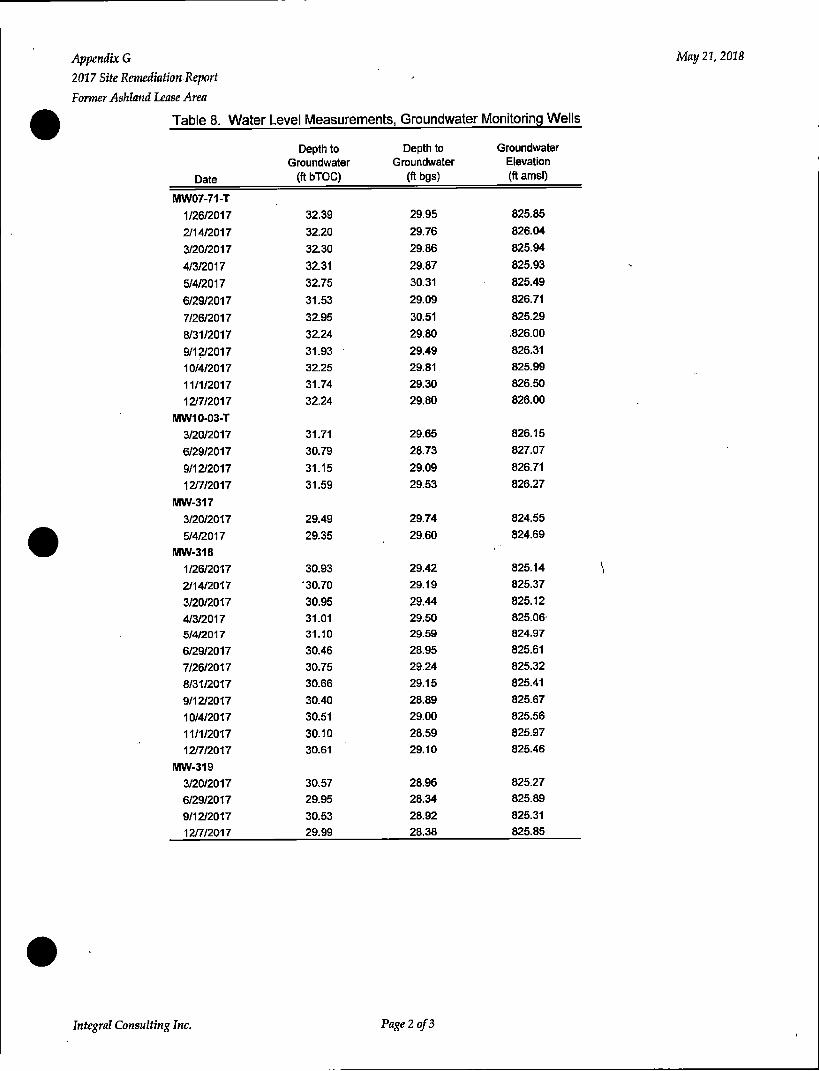
Appendix G
2017 Site Remediation Report
Former Ashland Lease Area
Table 8. Water Level Measurements, Groundwater Monitoring Wells
Date
Depth to Groundwater
(ft bTOC)
,w l -
Depth to Groundwater
(ft bgs)
Groundwater Elevation (ft amsl)
MW07-71-T1/26/2017 32.39 29.95 825.85
2/14/2017 32.20 29.76 826.04
3/20/2017 32.30 29.86 825.94
4/3/2017 32.31 29.87 825.93
5/4/2017 32.75 30.31 825.49
6/29/2017 31.53 29.09 826.71
7/26/2017 32.95 30.51 825.29
8/31/2017 32.24 29.80 ,826.00
9/12/2017 31.93 ■ 29.49 826.3110/4/2017 32.25 29.81 825.99
11/1/2017 31.74 29.30 826.50
12/7/2017 32.24 29.80 826.00
MW10-03-T3/20/2017 31.71 29.65 826.15
6/29/2017 30.79 28.73 827.07
9/12/2017 31.15 29.09 826.71
12/7/2017 31.59 29.53 826.27
MW-3173/20/2017 29.49 29.74 824.55
5/4/2017 29.35 29.60 824.69
MW-3181/26/2017 30.93 29.42 825.14
2/14/2017 '30.70 29.19 825.37
3/20/2017 30.95 29.44 825.12
4/3/2017 31.01 29.50 825.06-5/4/2017 31.10 29.59 824.97
6/29/2017 30.46 28.95 825.617/26/2017 30.75 29.24 825.32
8/31/2017 30.66 29.15 825.41
9/12/2017 30.40 28.89 825.67
10/4/2017 30.51 29.00 825.56
11/1/2017 30.10 28.59 825.9712/7/2017 30.61 29.10 825.46
MW-3193/20/2017 30.57 28.96 825.27
6/29/2017 29.95 28.34 825.899/12/2017 30.53 28.92 825.3112/7/2017 29.99 28.38 825.85
Integral Consulting Inc. Page 2 of 3

Appendix G
2017 Site Remediation Report
Former Ashland Lease Area
Table 8. Water Level Measurements, Groundwater Monitoring Wells
Date
Depth to Groundwater
(ft bTOC)
' J ---------------------
Depth to Groundwater
(ft bgs)
Groundwater Elevation (ft amsl)
MW-402D1/26/2017 32.30 30.38 824.61
2/14/2017 32.00 30.08 824.91
3/20/2017 32.70 30.78 824.21
4/3/2017 31.50 29.58 825.41
5/4/2017 32.70 30.78 824.21
6/29/2017 31.75 29.83 825.16
7/26/2017 32.53 30.61 824.38
8/31/2017 32.54 30.62 824.37
9/12/2017 32.51 30.59 824.40
10/4/2017 32.33 30.41 824.58
11/1/2017 31.76 29.84 825.15
12/7/2017 32.28 30.36 824.63
MW-402S3/20/2017 31.11 29.43 825.56
6/29/2017 30.24 28.56 826.43
9/12/2017 30.53 28.85 826.14
12/7/2017 30.86 29.18 825.81
Notes:ft amsl = feet above mean sea level ft bgs = feet below ground surface ft bTOC = feet below top of casing
Integral Consulting Inc. Page 3 of 3

A p p e n d ix H
A n a l y t ic a l D a t a R e p o r t s
(F o u n d o n A c c o m p a n y in g D isc )

2017 S ite R e m e d ia tio n R e p o r t F o r m e r A s h l a n d L e a s e A r e a
Soo L in e S h o r e h a m Y a r d
Appendix A: SVE Shutdown Evaluation Report Appendix H: Analytical Data Reports
prepared for A shland Inc.
Project No.:
21, 2018

A p p e n d ix I
W el l R e h a b il it a t io n W o r k
P l a n

m n m
G ro u n d w a te r & En viro n m en tal Services, Inc. ------------------------------------
E A S T E R N P E N N S Y L V A N I A O F F I C E
Memorandum
To: Aimee Zack and LeeAnn Thomas, Canadian Pacific; Steve Finn, Allen Kane, and
Claire Mackler, Golder
CC: James Vondracek, Ashland; Steve Helgen, Mike Martin, and Melissa Marietta,
Integral
From: Brian Deering and Kevin Lienau
Date: July 5, 2017
Re: Proposed Well Rehabilitation Activities at Former Ashland Lease Area,Shoreham Yards, Minneapolis, MN.
The purpose o f this memorandum is to outline the recommendations fo r the rehabilitation of Former Ashland Lease Area monitoring wells MW-309, MW-318, MW07-71-T, and MW10-03-T that are currently part o f the well network being used to m onitor the progress o f enhanced biodégradation fo llow ing the im plementation o f the on-site bioremediation system remedy intended to address chlorinated solvent contamination. All o f the aforementioned wells previously contained nonaqueous-phase liquid (NAPL). M onitoring data in these wells show persistent high concentrations that are believed to be a result o f residual NAPL trapped w ith in or near the well screen by biofouling and/or fine particles accumulating in the well screen and filte r pack. The purpose o f rehabilitating these wells is to re-establish the connection w ith the aquifer, assess the hydraulic conductivity before and after rehabilitation, and enhance the potential removal o f trapped NAPL in the well sand pack/form ation. The follow ing sections outline the data to be collected, materials to be utilized, methodologies, and procedures associated w ith the proposed activities.
In general, the fo llow ing steps will be completed at each well as part o f the rehabilitation o f MW- 309, MW-318, MW07-71-T, and MW10-03-T.
1. Video record well to document current conditions (already completed).2. Perform slug testing at well to document current hydraulic conductivity between the well
and the aquifer.3. Perform well rehabilitation.4. Perform surfactant flushing.5. Perform slug testing at well to document hydraulic conductivity between the well and the
aquifer fo llow ing the completion o f well rehabilitation.6. Video record well to confirm effectiveness o f well rehabilitation (if necessary).

r z n n mL r i - r i M
Video Recording
Prior to developing the four (4) monitoring wells, video m onitoring o f the well in tegrity was performed on each well. Video results did not indicate noticeable scaling or fouling on the interior o f the well screens. Therefore, GES concluded that connectivity issues these wells may be experiencing as they relate to the aquifer might be w ith in each well's filte r pack or surrounding native soils. For this reason, the approach outlined in this memorandum fo r well rehabilitation has been developed.
Slug Testing
A slug test is an in-situ estimation o f hydraulic conductivity (K) and can provide quantitative assessments o f groundwater flow and transmissivity by measuring the recovery o f head in a well after a near-instantaneous change in head at that well. A slug-in test involves the addition o f a "slug", or a known volume o f water to the well, which is prim arily used to measure the transmissivity and flow o f groundwater through the aquifer. Conversely, a slug-out test involves the removal o f a "slug", or a known volume o f water, from the well and is used to measure the flow o f groundwater into the well and subsequent rate o f recharge as the well returns to static conditions. Conductivity values derived from slug testing are usually w ith in an order o f magnitude o f the real conductivity, and therefore are only approximations.
To assess the effectiveness o f well rehabilitation activities, GES proposes to complete slug-out tests at each well before and after the rehabilitation process to determ ine the changes in hydraulic conductivity and flow o f groundwater from the aquifer to the well. Additional slug tests may be performed at GES' discretion between the follow ing procedures.
Well Rehabilitation
In our evaluation o f the site data and field observations, GES believes that the well screens and filte r packs o f the fou r (4) monitoring wells (MW-309, MW-318, MW07-71-T, and MW10-03-T) may be clogged, lim iting the connectivity o f each m onitoring well and the aquifer. Well rehabilitation w ill allow fo r an accurate assessment o f current groundwater conditions and will aid in identifying the need fo r and potential effectiveness o f additional remedial measures in these recalcitrant wells. As required by the Minnesota Department o f Health (MDH), the chemicals proposed fo r the well rehabilitation meet the requirements o f American National Standards Institute (ANSI)/National Sanitation Foundation (NSF) Standard 60-2003e.
Based on GES' experience in such matters, and consultation w ith our water biology/chemistry expert (WRT Services, Inc.), GES has developed a procedure that includes:
1. High-pressure je tting and air lifting to remove debris;2. Application o f a 5% glycolic acid solution (Redux 520) to address any scaling or iron
fouling; and3. Application o f a 3% solution o f a proprietary product (Redux 610), an alkaline solution,
along w ith a 3-5% solution o f chlorine dioxide to address the biological fouling.

r j j z r j m
Further details related to this procedure are presented below.
Prior to completing any rehabilitation activities, a slug-out test w ill be completed at each o f the four (4) affected m onitoring wells (MW-309, MW-318, MW07-71-T, and MW10-03-T) as described above. Once the slug testing has been completed, GES proposes to redevelop the wells utilizing a high-pressure je tting tool operated by a subcontracted drilling company along w ith standard air lifting techniques to remove any debris from the well.
Once the post-well je tting activities are completed, a 5% solution o f Redux 520 (glycolic acid) will be prepared based on the static volume o f water in each well and w ill soak overnight. The follow ing day each well w ill be surge blocked in tw o-foo t intervals while any debris is removed utilizing air lifting followed by the extraction o f three well volumes o f water. This step is intended to remove any scaling or iron fouling on the well screen or w ith in the filte r pack.
Following the acid cleaning, a 5% solution of Redux 610, an alkaline product consisting o f sodium hypochlorite (bleach), sodium silicate, and a dispersant, along w ith a 3-5% solution o f chlorine dioxide w ill be injected under pressure. This step is necessary to remove biological material from the well screen and filte r pack. The follow ing day each well w ill be surge blocked in tw o-foot intervals while any debris is removed utilizing air lifting followed by the extraction o f three well volumes of water. It should be noted that although acid is often used to address certain types of scaling such as iron fouling, acid as a stand-alone approach is not an effective solution to address the biological waste from the dehalococcoides bacteria as it is known to be acid-resistant. Therefore, this alkaline solution along w ith the chlorine dioxide has been proposed.
Redux 520 and the components that comprise Redux 610 are approved by the NSF fo r subsurface injection; however, Redux 610 itself is not an NSF-approved chemical. It should also be noted that GES has evaluated the potentia l fo r the solutions from spreading through the aquifer adversely affecting the ongoing bioremediation through the use o f high pressure jetting. Based on the proposed concentrations o f each solution to be delivered, along w ith the lim itation on how far the solutions w ill push out into the form ation, long-term adverse effects on site remediation are anticipated to be lim ited.
Surfactant Flushing
Following the m onitoring well rehabilitation activities described above, GES proposes to complete a surfactant flush at each o f the four (4) monitoring wells to assist w ith the mobilization and eventual removal o f NAPL trapped in the pore space o f the filte r pack or native soils immediately surrounding each monitoring well. The surfactant flush is proposed to be performed follow ing all cleaning activities to maximize the ability fo r the surfactant to penetrate the form ation surrounding each well. The proposed non-ionic surfactant is Nu-Well 400, an NSF-approved material tha t can be e ither gravity-applied or injected under pressure at each monitoring well. GES anticipates that fo llow ing the well rehabilitation, an understanding o f each m onitoring well's connectivity to the aquifer will be developed such that a determ ination can be made on the best methodology fo r deployment (i.e., gravity-applied vs. injection). Once the surfactant delivery is

r = m ml - i t i M
complete, a surge block will be employed to surge the solution into the form ation. Following an approximately 24 hour (overnight) contact period, a portable extraction pump w ill be used to remove the residual surfactant, groundwater, and any NAPL that mobilizes into a given monitoring well. Following the surfactant flush, a final slug test w ill be performed to assess the overall effectiveness o f the procedure.
Final Disposition of Liquids
The liquids and solids air lifted from each o f the monitoring wells w ill be directed to temporary storage vessels and ultim ately liquids derived from the development activity w ill be processed through the on-site treatm ent system fo r eventual sanitary sewer disposal, hazardous solid (sludge) disposal, and/or NAPL disposal.
Depending on the pH o f the recovered liquids follow ing all phases o f the test, pH adjustment may be necessary, but can be completed w ith the remaining glycolic acid, or Redux 610, as appropriate to achieve the desired pH.
Post-Well Rehabilitation Video Recording
Based upon site observations during the rehabilitation and surfactant introduction activities, video inspection o f the wells may be desirable. If video monitoring is deemed beneficial, the same procedure as the initial video will be followed. Results o f the tw o events would be compared side by side and evaluated fo r effectiveness.


