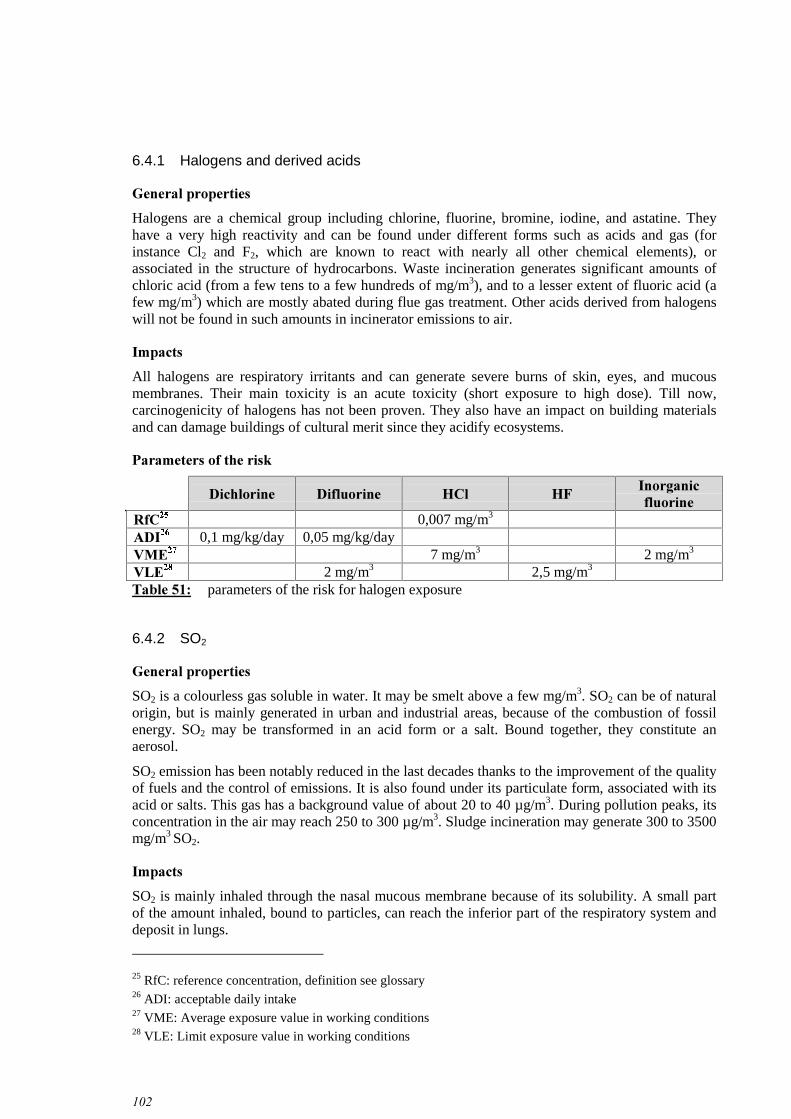
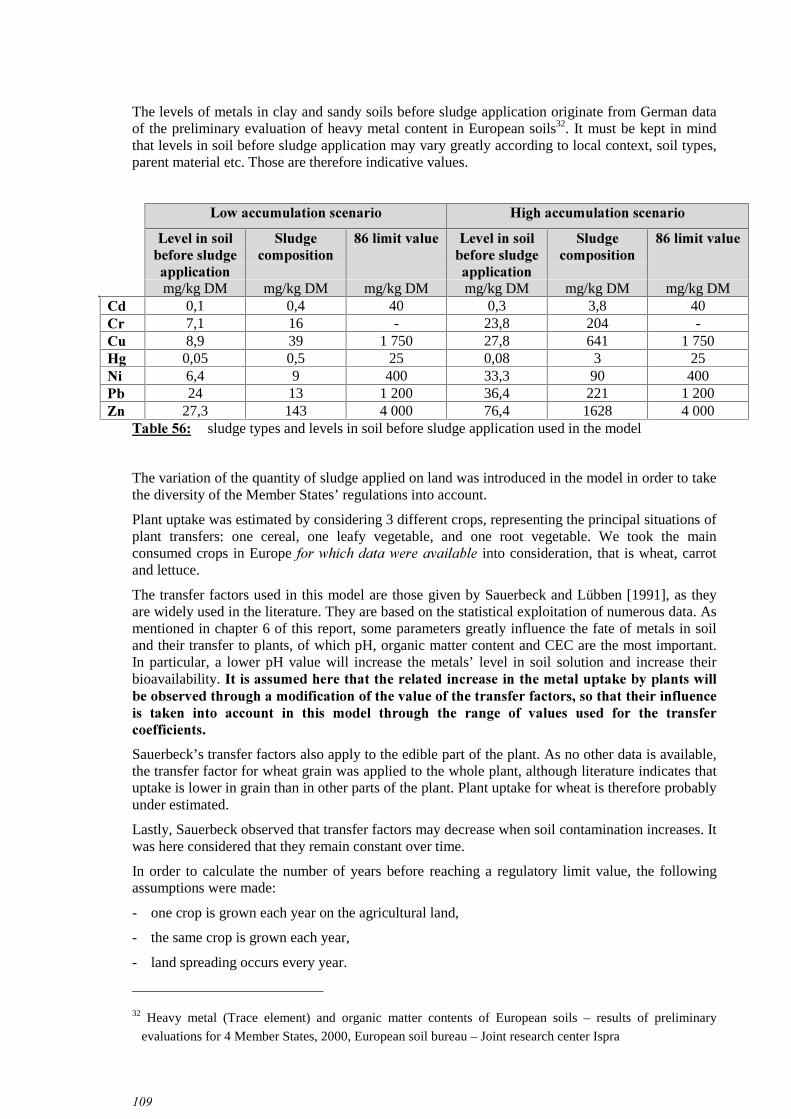
7UDQVIHUSURFHVVHV Wastewater collection Water treatment Sludge treatment Sludge recycling and disposal Impacts This part aim to present the transfer mechanisms of the pollutants contained in sludge in the different environment media and the food chain, in order to assess their possible impacts on the environment and human health. A general description of the phenomena is given below, and a specific description is provided for each compound in appendix. +HDY\PHWDOV 6.1.1 Behaviour in soil 2EVHUYHGOHYHOVDQGRULJLQVLQVRLO Soils naturally contain heavy metals, originating from parent rock. Baize [2001] stressed the importance of knowing the background levels of metals in soil. Those may be very high and must not be related without due cause to any identified pollution on or near the site. Heavy metals observed levels in soil in some EU countries are presented in the table below. Those values are median values. As the soil and parent rock types are numerous, a great variety of levels are observed within the different countries. A variety in results may also be due to the diversity of the extracting methods used rather than differences in the field. In order to ensure the quality of the comparisons, a harmonisation of the sampling and measurements methods would therefore be needed. PJNJ’0 &G &X &U +J 1L 3E =Q 6DQG\VRLO ’HQPDUN 0,1 5,6 6,4 0,03 2,9 10,5 18,4 )UDQFH 0,2 9,1 N/A 0,04 10,5 18,2 35 0,2 9 N/A 0,04 12,3 25,1 43 *HUPDQ\ 0,1 7,1 8,9 0,05 6,4 24 27,3 8. <0,2 7,4 13,2 N/A 7,5 22 35 &OD\VRLO ’HQPDUN 0,2 9 17,1 0,05 9,6 12,1 43,3 )UDQFH 0,3 15,8 N/A 0,04 24,7 26 65 0,3 15 N/A 0,05 29,5 29,9 73 *HUPDQ\ 0,3 23,8 27,8 0,08 33,3 36,4 76,4 8. 1 23 59 N/A 38,2 35 106 *: France: results of two different extraction methods 7DEOHheavy metals level in European soils, median values [European Commission, Joint Research Centre 1999] Other sources are atmospheric deposition, or anthropogenic sources such as atmospheric deposition near industrial areas, use of fertilisers, animal manure and sludge spreading. Nicholson HWDO. [1999] assessed the relative importance of the different sources of heavy metals to agricultural soils in England and Wales. For Zn, Cu and Ni, 25-39% of total annual inputs to agricultural land were
Transcript
��
��� 7UDQVIHU�SURFHVVHV
Wastewater collection
Water treatment
Sludge treatment
Sludge recycling
and disposalImpacts
This part aim to present the transfer mechanisms of the pollutants contained in sludge in thedifferent environment media and the food chain, in order to assess their possible impacts on theenvironment and human health. A general description of the phenomena is given below, and aspecific description is provided for each compound in appendix.
���� +HDY\�PHWDOV
6.1.1 Behaviour in soil
2EVHUYHG�OHYHOV�DQG�RULJLQV�LQ�VRLO
Soils naturally contain heavy metals, originating from parent rock. Baize [2001] stressed theimportance of knowing the background levels of metals in soil. Those may be very high and mustnot be related without due cause to any identified pollution on or near the site.
Heavy metals observed levels in soil in some EU countries are presented in the table below. Thosevalues are median values. As the soil and parent rock types are numerous, a great variety of levelsare observed within the different countries. A variety in results may also be due to the diversity ofthe extracting methods used rather than differences in the field. In order to ensure the quality of thecomparisons, a harmonisation of the sampling and measurements methods would therefore beneeded.
*: France: results of two different extraction methods
7DEOH����� heavy metals level in European soils, median values [European Commission, JointResearch Centre 1999]
Other sources are atmospheric deposition, or anthropogenic sources such as atmospheric depositionnear industrial areas, use of fertilisers, animal manure and sludge spreading. Nicholson HW�DO. [1999]assessed the relative importance of the different sources of heavy metals to agricultural soils inEngland and Wales. For Zn, Cu and Ni, 25-39% of total annual inputs to agricultural land were
��
from animal manure, 32 – 45 % from atmospheric deposition and 7 – 15 % from sewage sludge. Bycontrast, 72 % of Pb was from atmospheric deposition and only 8 % from animal manure. For Cd,51 % of inputs were from atmospheric deposition and 34 % from fertilisers (mainly phosphates)and lime, with 1% from animal manure. The major sources of Cr to agricultural land wereindustrial “wastes” (38 %), with sewage sludge, fertilisers and lime, and atmospheric deposition allof similar importance (c. 20%).
'LVWULEXWLRQ��WUDQVIHU�DQG�WUDQVIRUPDWLRQ�LQ�VRLO
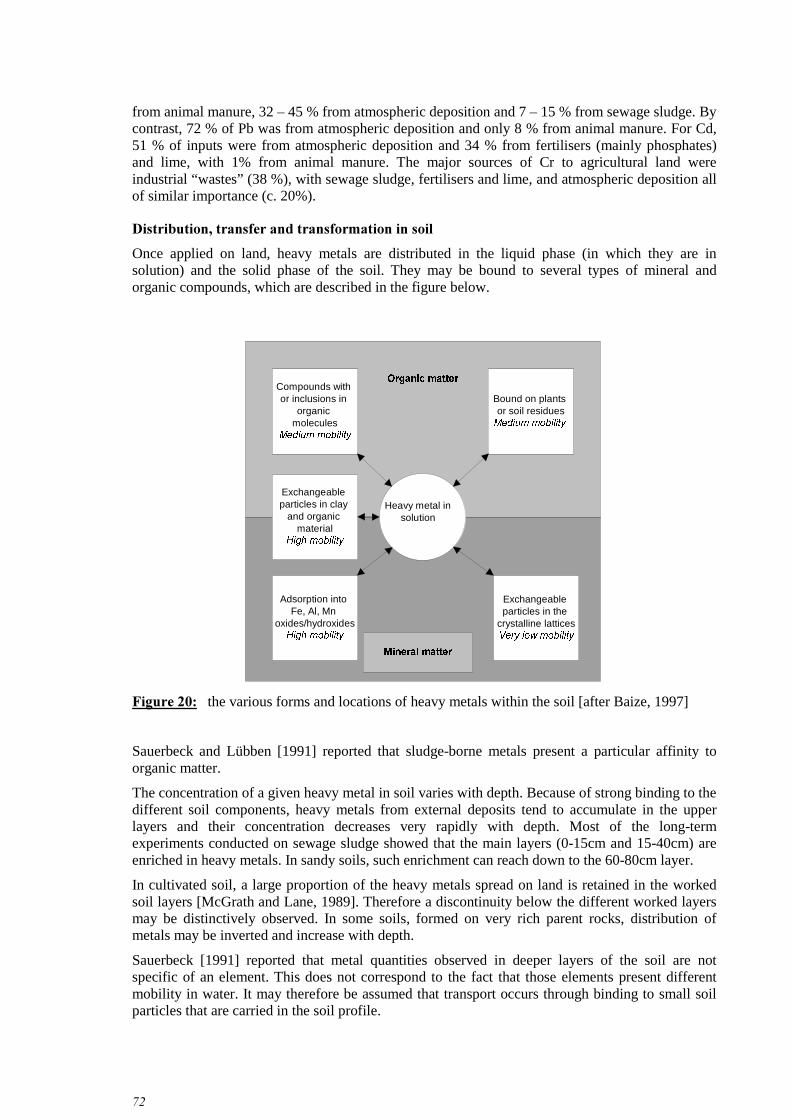
Once applied on land, heavy metals are distributed in the liquid phase (in which they are insolution) and the solid phase of the soil. They may be bound to several types of mineral andorganic compounds, which are described in the figure below.
Exchangeable particles in clay
and organic material
+LJK�PRELOLW\
Compounds with or inclusions in
organic molecules
0HGLXP�PRELOLW\
Bound on plants or soil residues0HGLXP�PRELOLW\�
Exchangeable particles in the
crystalline lattices9HU\�ORZ�PRELOLW\
Adsorption into Fe, Al, Mn
oxides/hydroxides+LJK�PRELOLW\
Heavy metal in solution
2UJDQLF�PDWWHU
0LQHUDO�PDWWHU
)LJXUH����� the various forms and locations of heavy metals within the soil [after Baize, 1997]
Sauerbeck and Lübben [1991] reported that sludge-borne metals present a particular affinity toorganic matter.
The concentration of a given heavy metal in soil varies with depth. Because of strong binding to thedifferent soil components, heavy metals from external deposits tend to accumulate in the upperlayers and their concentration decreases very rapidly with depth. Most of the long-termexperiments conducted on sewage sludge showed that the main layers (0-15cm and 15-40cm) areenriched in heavy metals. In sandy soils, such enrichment can reach down to the 60-80cm layer.
In cultivated soil, a large proportion of the heavy metals spread on land is retained in the workedsoil layers [McGrath and Lane, 1989]. Therefore a discontinuity below the different worked layersmay be distinctively observed. In some soils, formed on very rich parent rocks, distribution ofmetals may be inverted and increase with depth.
Sauerbeck [1991] reported that metal quantities observed in deeper layers of the soil are notspecific of an element. This does not correspond to the fact that those elements present differentmobility in water. It may therefore be assumed that transport occurs through binding to small soilparticles that are carried in the soil profile.
��
Each equilibrium described in figure 21 is governed by equilibrium constants. Metal exportationmay happen through plant uptake, leaching, or runoff. Therefore distribution in soil is not static,and evolves along time; they may pass in the water or solid phase, according to their mobility.
Volatilisation is also a transfer process, which mainly involves arsenic, selenium and mercury.Those compounds can be reduced in soil into highly volatile forms, either through micro-organismsintervention or by extra-cellular enzymes. Existing surveys show that a large proportion of themercury found in the above ground parts of alfalfa grown on mercury-bearing soil comes fromvapour emitted by the soil and not from transfer through the roots.
However, volatilisation of heavy metals from sludge treated soil probably has little impact on airquality compared with background levels present in the aerial environment [Smith, 1996].
Metals may undergo different biologically enhanced or abiotic reactions in the soil. Those reactionsare either chemical reactions such as ionisation, oxidation/reduction or hydrolysis in the soilsolution, or physical-chemical reactions, such as complexing or precipitation/dissolution.
3RWHQWLDO�LPSDFWV�RI�D�PHWDO�WR�OLYLQJ�RUJDQLVPV�ZLOO�GHSHQG�RQ�WKHLU�ELRDYDLODELOLW\��L�H���WKHLUSRVVLELOLW\� RI� WKHLU� EHLQJ� SUHVHQW� LQ� WKH� VRLO� VROXWLRQ� Different parameters influence thedistribution of the compounds in soil.
S+ is considered as the most important parameter controlling the availability of metals in soils. pHvalue modification will enhance the precipitation or dissolution of insoluble hydroxides, and theformation of mineral or organic complexes in soils, as described in the figure below:
2+
� 2+ � 2+
� 2+ �
0 �� 0�2+� � 0�2+� � 0�2+�� � 0�2+� �
��
Adsorption onto clay minerals and organic matter is also raised by increasing soil pH value.
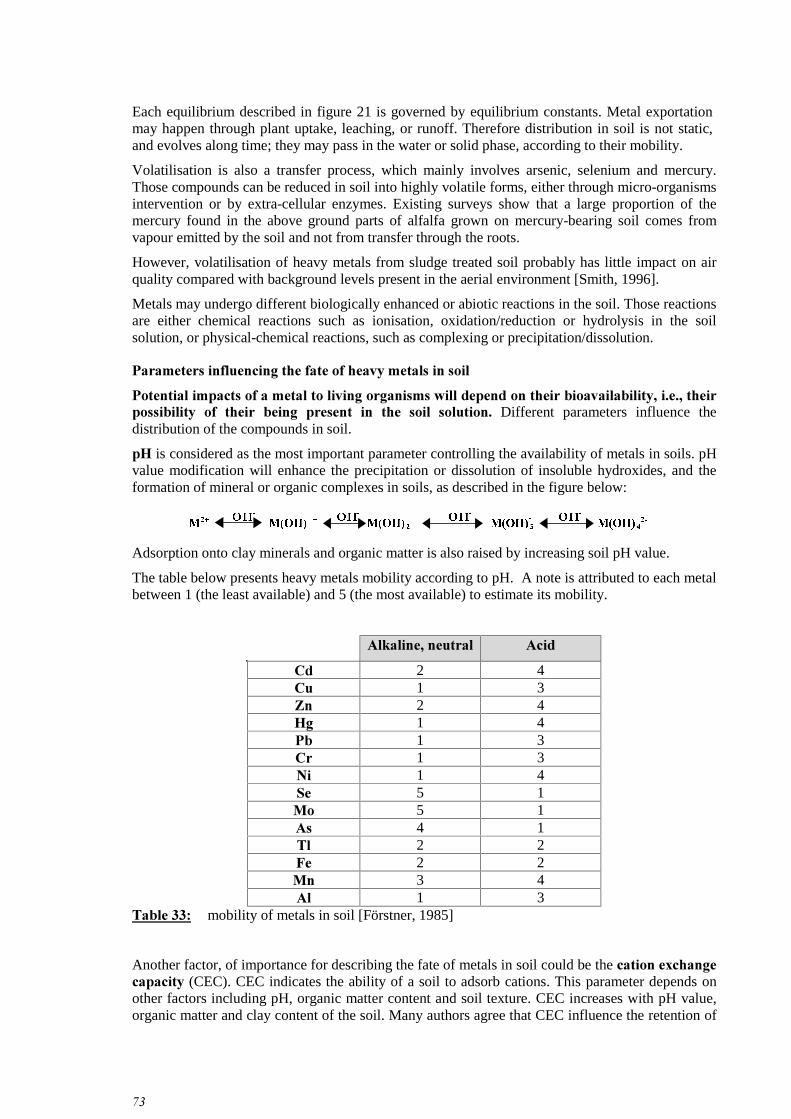
The table below presents heavy metals mobility according to pH. �A note is attributed to each metalbetween 1 (the least available) and 5 (the most available) to estimate its mobility.
7DEOH����� mobility of metals in soil [Förstner, 1985]
Another factor, of importance for describing the fate of metals in soil could be the FDWLRQ�H[FKDQJHFDSDFLW\ (CEC). CEC indicates the ability of a soil to adsorb cations. This parameter depends onother factors including pH, organic matter content and soil texture. CEC increases with pH value,organic matter and clay content of the soil. Many authors agree that CEC influence the retention of
��
metals in soil, although some publications did not show any clear relation between CEC andbioavailability.
The RUJDQLF�PDWWHU content will also influence the availability of metals in soils. Its increase willindeed enable the binding of the metals to increase. Therefore, application of compost containingstable organic matter originating from the co-product tends to decrease the mobility of heavymetals in the soil [ADEME 2001].
Lastly, WHPSHUDWXUH and VRLO� KXPLGLW\ may affect the heavy metals mobility, as well as theVWUXFWXUH and the W\SH of the soil.
,PSDFWV�RI�KHDY\�PHWDOV�RQ�VRLO�PLFUR�RUJDQLVPV
Micro-organisms are responsible for the degradation of organic matter, making nutrients availablefor plants. Therefore mineralisation processes play an important role in VRLO� IHUWLOLW\. As metalaccumulation in soil following sludge spreading is irreversible, research has been carried out inorder to assess the impact of these pollutants on soil micro-organisms and their functions.
Data concerning the impacts of heavy metal on soil micro-organisms is contradictory. A review oflaboratory and field studies performed by Bååth [1989 in Giller HW�DO� 1998] summarised the highestmetal concentration in soil at which no effect was found (HNOEC) and the lowest metalconcentration where an effect was found (LOEC). Both HNOEC and LOEC values varied betweenstudies by 100 to 1000-fold for individual metals and overlapped to a great extent.
Bååth [1989] also documented the ability of microorganisms in soil to DGDSW to changingconditions in soil. Results are also contradictory, as some authors observed adaptations of micro-organisms, especially in laboratory conditions, whereas others did not find evidence of adaptation,or they concluded that adaptation does not occur frequently in the field. It was also sometimesassumed that tolerant species in polluted areas were species already present in soils beforepollution, but in low proportion. Witter HW�DO. [2000] made the assumption that adaptation was aresult of a selective pressure following an increase in the concentration of heavy metal, showing anegative impact on soil microbial population.
7KH� JUHDW� YDULHW\� RI� PLFUR�RUJDQLVPV� VSHFLHV� DV� ZHOO� DV� WKH� YDULHW\� RI� WKH� H[SHULPHQWFRQGLWLRQV (temperature, humidity etc.) could partly explain differences in the results. The impactof metals on soil micro-organisms also depends on the ELR�DYDLODELOLW\ of the pollutant. Soiltexture and pH were also found to influence the concentrations at which toxicity occurred in bothorganisms and plants. Higher S+ and increased content of FOD\ and RUJDQLF�FDUERQ reduced metaltoxicity considerably [Witter HW�DO� 1998].
Other explanations of explaining those differences may be found when considering the practicalconditions of the experiment. According to Giller HW� DO� [1998], confusion may derive from thecomparison of VKRUW�WHUP laboratory studies describing responses to immediate and acute toxicitywith monitoring experiments in field measuring responses to ORQJ�WHUP chronic toxicity thataccumulates gradually. Bååth [1989] also observes that in field studies, toxicity is sometimes due toseveral metals, making it difficult to draw conclusions regarding relative toxicity between metals.
It should also to be observed that several methods are used in the literature for assessing the impactof metals on soil micro-organisms, focusing either on loss of microbial functions or on the diversityof species in soil. Giller HW�DO� [1998] observed that most studies of heavy metals’ toxicity to soilmicro-organisms have concentrated on effects where a loss of microbial function has beenobserved. 6XFK� VWXGLHV� PD\� PDVN� XQGHUO\LQJ� HIIHFWV� RQ� ELRGLYHUVLW\� ZLWKLQ� WKH� PLFURELDOSRSXODWLRQ�� ,W� PXVW� DOVR� EH� VWUHVVHG� WKDW� FKDQJHV� LQ� PLFURELDO� FRPPXQLW\� VWUXFWXUH� DQGGLYHUVLW\�RIWHQ�RFFXU�EHIRUH�IXQFWLRQV�DUH�DIIHFWHG�
Research works specifically addressed the long-term impact of metals on soil micro-organisms.McGrath, Chaudri and Giller [1995] performed a literature study in the long-term�LPSDFW of metalson micro-organisms population and observed that microbial activity and populations ofcyanobacteria, 5KL]RELXP�OHJXPLQRVDUXP bv. 7ULIROLL, mycorrhizae and the total microbial biomass
��
have been adversely affected by metal concentrations which, in some cases, were below theEuropean Community’s maximum allowable concentration limits for metals in sludge-treated soils.
7DEOH����� minimum concentrations in soil at which negative impacts on soil micro-organismsoccur, from McGrath HW�DO. [1995] referring to several experiments
In the same way, Witter HW�DO. [2000] studied the structure and metal tolerance of a soil microbialcommunity six years after cessation of sewage sludge application. The work was based on theassumption that long-term metal contamination of soils is thought to result in changes in thestructure of soil microbial communities and populations as a consequence of the selective pressureexerted by elevated metal concentrations. Such changes would be expected to be associated withincreased metal tolerance and may also result in loss of microbial functions if those microbialpopulations possessing a given function are entirely lost from the soil. Results of the experimentdid show changes in the soil microbial community structure and a development of metal tolerance,FRQILUPLQJ� D� ORQJ�WHUP� QHJDWLYH� LPSDFW� RI�PHWDO� DFFXPXODWLRQ� LQ� VRLO� RQ�PLFUR�RUJDQLVPVDQG� VRLO� IHUWLOLW\. Moreover, the experiment was made at the Braunschweig experimental field(Germany), where sludge had been applied between 1980 and 1989. Across the treatment, therewas a gradient of increasing soil metal concentration, with the highest concentrations being close tothe limits of the 86 Directive on the use of sludge in agriculture. 7KHUHIRUH��WKH�QHJDWLYH�LPSDFWVUHSRUWHG� LQ� WKLV� H[SHULPHQW� RFFXUUHG� IRU�PHWDO� OHYHOV� LQ� VRLO�ZKLFK�ZHUH� EHORZ� WKH� DFWXDOUHJXODWRU\�OLPLW�YDOXHV�RI�WKH����'LUHFWLYH. However, Witter [2000] observed that WKHUH�LV�DW�WKHSUHVHQW� WLPH� LQVXIILFLHQW� HYLGHQFH� WR� VHW� OLPLW� YDOXHV� IRU� VRLO�PHWDO� FRQFHQWUDWLRQV� that canguarantee to avoid adverse effects on soil micro-organisms.
The VSHFLILF�FDVH�RI�5KL]RELXP19 has also been studied. Publications reported a loss of N2 fixationby clover sown on plots previously treated with sewage sludge. Reasons for this N2 fixation lossare unclear. Two explications may be proposed, considering either that metals present in soil woulddisturb proper penetration of Rhizobium in the plant, or that all Rhizobium able to nodulate in theplant and surviving in the metal contaminated plot were unable to fix nitrogen effectively. It maytherefore be assumed that the impact of metals on Rhizobia could depend on the specific strainpresent in soil. It has also been observed that the vegetable host has the effect of protecting theRhizobia once they are in the roots and root nodes from heavy metals’ toxicity [Giller 1998].
19 5KL]RELXP�OHJXPLQRVDUXP biovar WULIROLL is a symbiotic bacteria developing within the tissues of crops for
the mutual benefit of both species involved.
��
6.1.2 Transfer to water
/HDFKLQJ
Extensive research conducted over the past 20 years on metal movement in sludge amended soilshas shown that PHWDOV�PRELOLW\�LQ�VRLO�LV�YHU\�ORZ�even under conditions which raise the mobilityof the compound.
As mentioned above, most of the long-term experiments conducted on sewage sludge showed thatheavy metals enrichment only occur in the upper layers of soil. Transfer to the deeper levels of thesoil, observed experimentally on site, is very slight and can be considered to be negligible. Deepercontamination (up to 70 cm) could be observed in some cases involving sandy soils. Huylebroeck[1981] similarly noted that increased concentrations of heavy metals in groundwater had only beenreported to a minor extent. In contrast, several experiments’ results showed no or little effect ofsludge spreading on the concentrations of toxic metals in groundwater supplies [Kenrick HW� DO.1985].
Decreasing soil pH conditions also increases the solubilisation of metals and laboratory studiesindicate potentially greater movement of metals down soil profiles as soil pH declines [EmmerichHW�DO., 1982c; Gerritse HW�DO., 1982; Welch and Lund, 1987].
This suggests mobility was largely independent of soil type especially for Cd, Cu, Ni and Zn.Brown HW�DO. [1983].
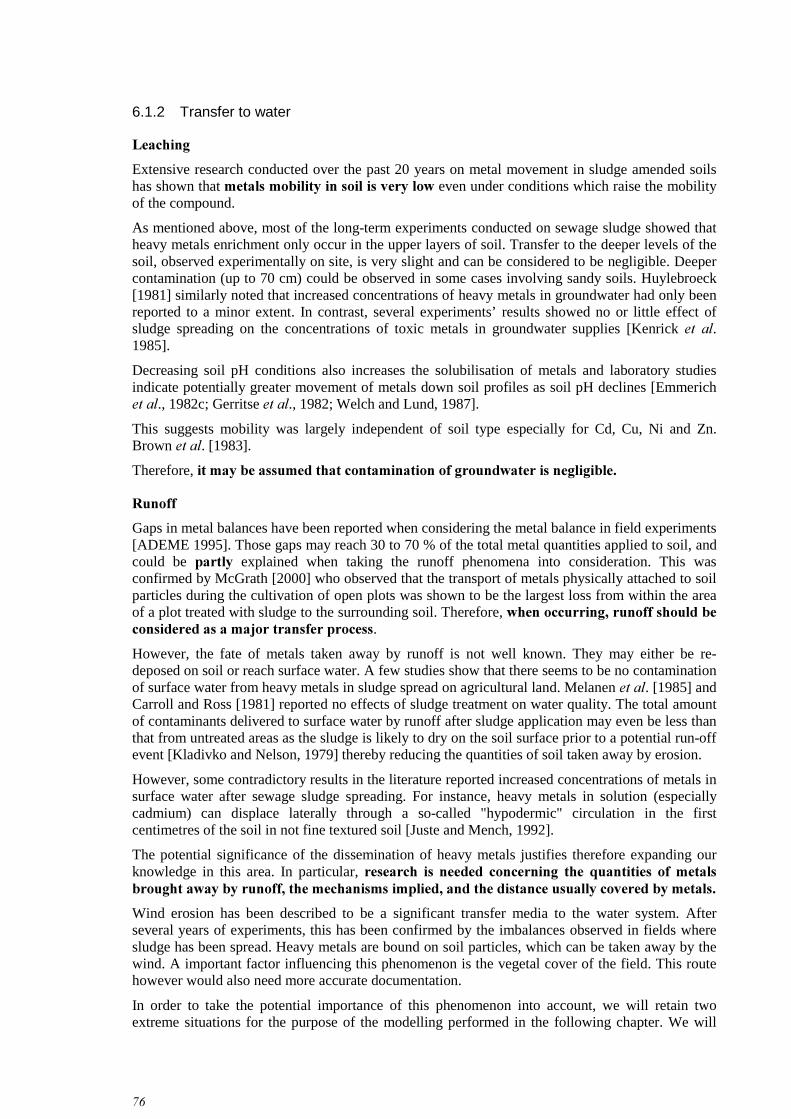
Gaps in metal balances have been reported when considering the metal balance in field experiments[ADEME 1995]. Those gaps may reach 30 to 70 % of the total metal quantities applied to soil, andcould be SDUWO\ explained when taking the runoff phenomena into consideration. This wasconfirmed by McGrath [2000] who observed that the transport of metals physically attached to soilparticles during the cultivation of open plots was shown to be the largest loss from within the areaof a plot treated with sludge to the surrounding soil. Therefore, ZKHQ�RFFXUULQJ��UXQRII�VKRXOG�EHFRQVLGHUHG�DV�D�PDMRU�WUDQVIHU�SURFHVV.
However, the fate of metals taken away by runoff is not well known. They may either be re-deposed on soil or reach surface water. A few studies show that there seems to be no contaminationof surface water from heavy metals in sludge spread on agricultural land. Melanen HW�DO. [1985] andCarroll and Ross [1981] reported no effects of sludge treatment on water quality. The total amountof contaminants delivered to surface water by runoff after sludge application may even be less thanthat from untreated areas as the sludge is likely to dry on the soil surface prior to a potential run-offevent [Kladivko and Nelson, 1979] thereby reducing the quantities of soil taken away by erosion.
However, some contradictory results in the literature reported increased concentrations of metals insurface water after sewage sludge spreading. For instance, heavy metals in solution (especiallycadmium) can displace laterally through a so-called "hypodermic" circulation in the firstcentimetres of the soil in not fine textured soil [Juste and Mench, 1992].
The potential significance of the dissemination of heavy metals justifies therefore expanding ourknowledge in this area. In particular, UHVHDUFK� LV� QHHGHG� FRQFHUQLQJ� WKH� TXDQWLWLHV� RI�PHWDOVEURXJKW�DZD\�E\�UXQRII��WKH�PHFKDQLVPV�LPSOLHG��DQG�WKH�GLVWDQFH�XVXDOO\�FRYHUHG�E\�PHWDOV�
Wind erosion has been described to be a significant transfer media to the water system. Afterseveral years of experiments, this has been confirmed by the imbalances observed in fields wheresludge has been spread. Heavy metals are bound on soil particles, which can be taken away by thewind. A important factor influencing this phenomenon is the vegetal cover of the field. This routehowever would also need more accurate documentation.
In order to take the potential importance of this phenomenon into account, we will retain twoextreme situations for the purpose of the modelling performed in the following chapter. We will
��
consider in one hand that no runoff occurred on the field on which sludge was applied, and on theother hand that severe runoff occurred following sludge spreading.
6.1.3 Uptake by plants
%LRORJLFDO�UROH�RI�KHDY\�PHWDOV
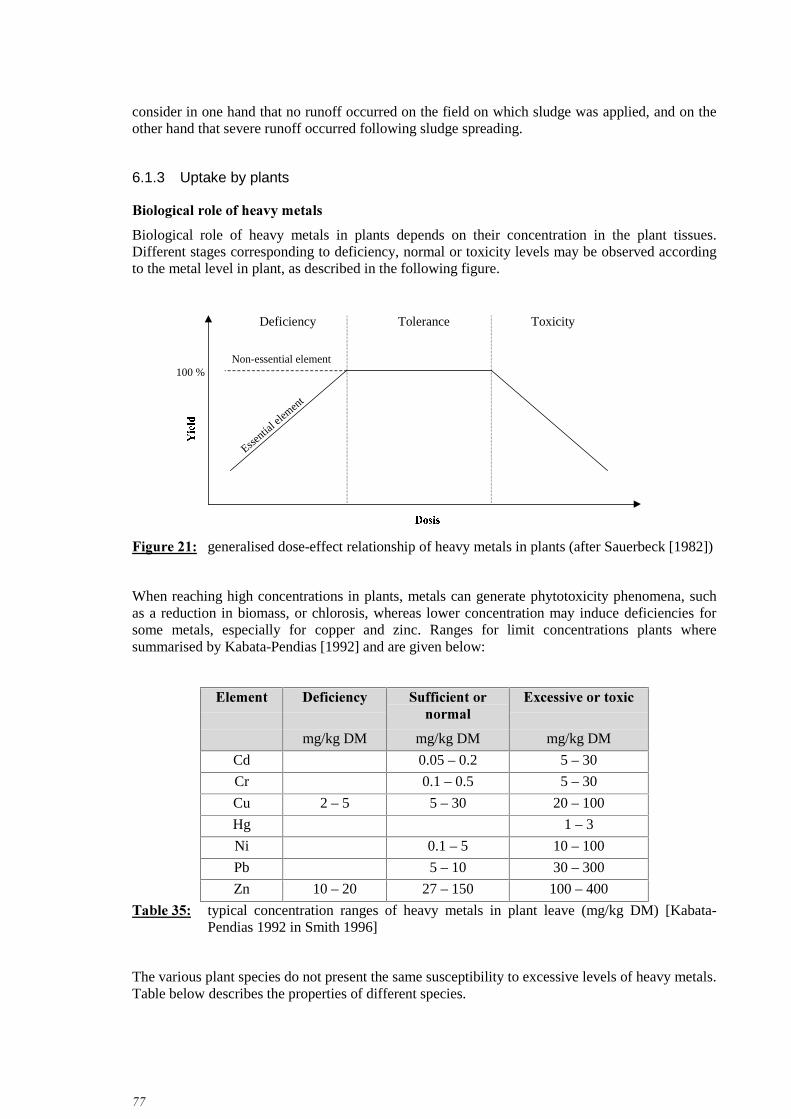
Biological role of heavy metals in plants depends on their concentration in the plant tissues.Different stages corresponding to deficiency, normal or toxicity levels may be observed accordingto the metal level in plant, as described in the following figure.
<LHOG
'RVLV
100 %
Tolerance ToxicityDeficiency
Essenti
al ele
ment
Non-essential element
)LJXUH����� generalised dose-effect relationship of heavy metals in plants (after Sauerbeck [1982])
When reaching high concentrations in plants, metals can generate phytotoxicity phenomena, suchas a reduction in biomass, or chlorosis, whereas lower concentration may induce deficiencies forsome metals, especially for copper and zinc. Ranges for limit concentrations plants wheresummarised by Kabata-Pendias [1992] and are given below:
(OHPHQW 'HILFLHQF\ 6XIILFLHQW�RUQRUPDO
([FHVVLYH�RU�WR[LF
mg/kg DM mg/kg DM mg/kg DM
Cd 0.05 – 0.2 5 – 30
Cr 0.1 – 0.5 5 – 30
Cu 2 – 5 5 – 30 20 – 100
Hg 1 – 3
Ni 0.1 – 5 10 – 100
Pb 5 – 10 30 – 300
Zn 10 – 20 27 – 150 100 – 400
7DEOH����� typical concentration ranges of heavy metals in plant leave (mg/kg DM) [Kabata-Pendias 1992 in Smith 1996]
The various plant species do not present the same susceptibility to excessive levels of heavy metals.Table below describes the properties of different species.
7DEOH����� heavy metal sensitivity of various cultivated plants [ADEME]
Toxicity levels in plants have been established for various plants. The table below shows WKHYDULDELOLW\� RI� WKH� UHVXOWV� REWDLQHG� DFFRUGLQJ� WR� WKH� VWXG\� DQG� WKH� SDUWLFXODU� SODQWV� EHLQJVWXGLHG�
7DEOH����� heavy metal phytotoxicity threshold values for various cultivated plants [ADEME,ITCF, US EPA]
The heavy metal concentrations in plants inducing phytotoxicity depend on the type of soil owingto differences in pH and CEC.
It must be recalled here that experiment reported in the literature, DUH�PRVW�RIWHQ�FRQGXFWHG�ZLWKPXFK�KLJKHU� OHYHOV�RI�DSSOLFDWLRQ of heavy metals than those corresponding to usual spreadingpractices. Results represent therefore worse cases situations.
$EVRUSWLRQ�E\�URRWV
Not all metals present in soil may be absorbed by plants. The main uptake source for metals andother nutritive ions is the VRLO� VROXWLRQ� It is thereby also the main contamination source whenconsidering toxic mineral compounds.
7KH�DPRXQW�RI�PHWDOV�ZKLFK�PD\�EH�WUDQVIHUUHG�WR�WKH�URRWV�LV�QRW�GLUHFWO\�OLQNHG�WR�WKH�WRWDODPRXQW�RI�KHDY\�PHWDOV� LQ�WKH�VRLO, as those may be bound under numerous forms to the solidphase of the soil (see previous part).
The transfer of metals from the soil to the root surface occurs E\�GLIIXVLRQ�RU� FRQYHFWLRQ. Thisphenomenon is also determined by the ELRDYDLODELOLW\� of the compound. Heavy metalsbioavailability depends on the activity of ions in solution at the root surfaces. %LRDYDLODELOLW\� LVVLJQLILFDQW� IROORZLQJ� WKH� VSUHDGLQJ� RI� VOXGJH� DQG� WKHQ� GHFUHDVHV� due to physical-chemicalreactions with the solid phase. 7KH� DPRXQW� RI� PHWDOV� WDNHQ� XS� E\� SODQWV� LQFUHDVHV� ZLWK
20 French technical institute for cereals21 French environment agency
Once on the surface of the roots, mineral ions can penetrate the inner part of the root throughdiffusion. Some metals will then penetrate in the vascular cylinder through diffusion or activetransportation mechanisms and reach the upper parts. Such mechanisms are not possible for allmetals, which then remain in the roots.
It has been observed that H[XGDWHV, which are complex mixtures of carbon and nitrogen organiccompounds UHOHDVHG�E\�WKH�URRWV, have acidic properties and can combine with heavy metals, thusaltering their mobility in the soil. Exudates with high molecular weights can LPPRELOLVH�FHUWDLQKHDY\�PHWDOV� to a greater or lesser extent depending on the element and therefore protect rootsagainst excessive levels of heavy metals. This affinity can be classified in order of decreasingimportance for lead, copper, cadmium and zinc.
7UDQVIHU� GHSHQGV� RQ� WKH� ELRDYDLODELOLW\� RI� WKH� FRPSRXQG� LQ� VRLO� This depends on severalfactors that have already been described before, including S+��VRLO�WHPSHUDWXUH��RUJDQLF�PDWWHUFRQWHQW�RU�VRLO�WH[WXUH. pH is of particular importance. A decrease of the pH value in soil in therange of pH 7 to pH 4 causes an increase in the metal mobility, implying an increased plant uptakefor Cd, Ni and Zn. The same effect is observed for Cu, but is less marked. When considering usualacidity levels in agricultural soils, no effect of a pH decrease was reported for Pb, Cr. Thoseobservations have been confirmed by other works summarised in the review of Witter HW�DO. [1998],in which it is reported that each unit decrease in pH results in approximately a 2-fold increase in theconcentrations of metals such as Zn, Cd and Ni in the soil solution. Sauerbeck and Lübben [1991]reported moreover that the soil type did not influence the uptake level by plant.
Heavy metals bioavailability also depends on their FKHPLFDO�IRUP. Experiences show that, givenequal quantities of micro-pollutants incorporated into the soil, phytotoxicity manifests itself muchless when these are incorporated in the form of sludge rather than in the form of mineral salts[Gomez HW�DO, 1982]. Heavy metals contained in sludge are less bioavailable to plants than thoseintroduced in the form of salts because of adsorption to organic matter.
Level of absorption as well as phytotoxicity will also depend on the SODQW� VSHFLHV. Impacts of ametal are different between plants, and do not occur at the same levels of application. It has alsobeen observed that rapidly growing plants accumulate higher levels of metals.
A study of Vigerust and Selmer Olsen [1986] indicates that spreading sludge increases heavy metalconcentrations in plants in the following descending order:
=Q�!�&G�!�1L�!�&X�!�3E�!�+J�!�&U
Heavy metal absorption also depends on soil chemical composition in major elements. +HDY\PHWDO�ELRDYDLODELOLW\�DQG�DEVRUSWLRQ�E\� WKH�URRWV� LV� LQIOXHQFHG�E\� WKH� FRQFHQWUDWLRQV�RI� WKHRWKHU�HOHPHQWV� The major elements (Ca, Mg, P, K, and N) are antagonistic towards heavy metals.The different situations are summarised in the following table.
��
According to dosage, element interaction can be positive or negative. That is why certain elementshave positive and negative interaction.
7DEOH����� interactions between elements [ADEME 1995]
It has also been reported that composting of sludge may reduce the bioavailability of heavy metalsto plants, as they may be bound to the organic matter of the compost [ADEME 2001]. LastlyDJULFXOWXUDO� SUDFWLFHV may influence mobility of metals in soil. Ploughing for instance helpsmetals to penetrate deeper in soil. Considering the depth and density of the root system, uptake ofmetal by plants may thereby be reduced.
8SWDNH�E\�OHDYHV
Plants can accumulate heavy metals present in the atmosphere through their aerial parts, followingsludge application on plant, atmospheric deposition of metals, or volatilisation of soil borne metals.Heavy metals penetrate into the leaves via the cuticle, which has cavities allowing direct entry intothe plant tissues. The importance of this phenomenon is however not well described in theliterature. Some sources even assessed that absorption via the leaves could be higher thanabsorption via the roots.
4XDQWLWDWLYH�DVVHVVPHQW�RI�WKH�WUDQVIHU
The introduction of heavy metals in soil through the spreading of sludge can contribute to increasethe levels of heavy metals in certain tissues of plants. Increased metal concentration in soil willlead to higher metal levels in plants. Metal distribution in plants however, is highly variable andgoverned by genetic, physiological and environmental factors.
In many species, a significant proportion of the metals absorbed are found in the roots, but otherspecies, such as tobacco, accumulate the absorbed heavy metals in their upper parts. In a generalmanner, DFFXPXODWLRQ�ZLOO�RFFXU�LQ�WKH�YHJHWDWLYH�RUJDQV�DQG�DUH�UDUHO\�WUDQVIHUUHG�LQWR�WKHVWRUDJH�RU�UHSURGXFWLYH�RUJDQV�
Heavy metals accumulated in cereal crops are not distributed in a homogeneous manner in theplant. Levels of heavy metals were reported to be higher in the by-products of the graintransformation than in the grain itself [Quinch, 1995].
Observations reported that there is a maximum level�for heavy metal concentrations in plants whenthe amount of metals introduced in soil increases.
Several mechanisms, yet not fully understood, appear to govern the distribution of metals in plants,which suggests the existence of successive physiological barriers and/or the metals changing state.
In order to describe the transfer of metals to plant, several methods are used in the literature[Sauerbeck and Lübben 1991].
��
- 7UDQVIHU�IDFWRUV compare the metal concentration in plant (in mg/kg DM) to the one in soil:
[ ][ ]
NJ'0PJ
NJ'0PJ
VRLOLQLRQFRQFHQWUDW0HWDO
SODQWLQLRQFRQFHQWUDW0HWDOIDFWRU7UDQVIHU
/
/=
- 7UDQVIHU�FRHIILFLHQWV compare the evolution in the metal concentration in plant to the one insoil (in mg/kg DM):
[ ][ ]
'0NJPJ
'0NJPJ
VRLOLQLQFUHDVHLRQFRQFHQWUDW
SODQWLQLQFUHDVHLRQFRQFHQWUDWHIILFLHQW7UDQVIHUFR
/
/=
- A third way for describing soil to plant transfer is the VWDWLVWLFDO�DQDO\VLV�of a sufficient numberof values. Regression coefficient is then given to compare concentration or concentrationincrease in plant to the ones in soil. However, databases often contain insufficient data orincomparable data (field and laboratory studies for instance).
Transfer factors are the most intuitive way to describe metal transfers to plant and will therefore beretained here. Values have been published by Sauerbeck and Lübben [1991] and are used asreference values in many publications. They are given below:
&G =Q 1L &X 3E &U
��������Maize
����±����CarrotMaizeOats
�����±�����MaizeWheat
�����±����Maize
������±������MaizeOats
Wheat
������±������Pea
MaizeWheat
����±����PeasOats
WheatBean
Alfalfa
����±����PeasLeek
WheatBean
CeleryLettuce
�����±����Leek
CarrotCeleryLettuce
����±����CarrotsCeleryOats
������±�����Pea
Carrot
������±�����CarrotLeek
����±����Carrot
����±����AlfalfaRadishSpinach
����±����Peas
SpinachAlfalfa
����±����Leek
WheatPea
Radish
�����±�����Leek
CeleryBean
Alfalfa
�����±�����Bean
SpinachCeleryAlfalfaLettuceRadishOats
����±����Leek
Radish
����±����Oats
RadishBean
����±����LettuceBean
SpinachAlfalfa
�����±����LettuceSpinachRadish
����±����LettuceCelery
Spinach
7DEOH����� transfer factors soil/plants (edible parts of the plants) [Sauerbeck and Lübben 1991]
Values below 1 indicate that plant only slightly absorbs the metals present in soil. On the contrary,values higher than 1 indicate that plants accumulate the metals.
��
Sauerbeck stressed that transfer factors are not constant values, and depend on several parameters.It was in particular observed that transfer factors decreased by increasing metal concentration insoil. Moreover those values were obtained by considering GLIIHUHQW�VLWXDWLRQ�DQG�VRLO�W\SHV�(pH,organic matter content etc.). It was observed that (except for Nickel) generative plant partspresented lower values than vegetative parts.
Those values have been retained in the following chapter for modelling metals transfer to plant.
Long term experiments in the United Kingdom and France have shown that heavy metal quantityexported by plants remains very low even after 13 to 20 years of experiments.
([SHULPHQW�WLPH 20 years 15 years 13 years7DEOH����� heavy metals total quantity exported by crops in % of heavy metal total quantity
brought by sludge [SYPREA, 1997; Michelin HW�DO., in press 2001]
6.1.4 Uptake by livestock
%LRDYDLODELOLW\�DQG�ELRFRQFHQWUDWLRQ
Heavy metals may be ingested by animals through grazing of contaminated plants, or directingestion of soil on which sludge has been applied. However, the amount of heavy metal ingestedis not sufficient to determine its toxic effects on the animal. The LQWHVWLQDO�ELRDYDLODELOLW\ of theelement must be taken into account. This is related to apparent digestibility (AD), calculated asfollows [Lamand, 1987]:
LQJHVWHGTXDQWLW\H[FUHWLRQVIDHFDOLQJHVWHGTXDQWLW\
$'−=
The amount of an element ingested influences its absorption. It has been reported that theabsorption level decreased with the amount of metal ingested [Doyle HW�DO, 1974].
Absorption is also influenced by the FKHPLFDO�IRUP�of the element. As an example, metallic Hg isnot particularly absorbed by the organism, whereas organic Hg is significantly absorbed.
%LR�DFFXPXODWLRQ� describes the direct increase in the concentration of a contaminant when itpasses from water into an animal. The concept of bio-accumulation indicates the total absorption ofa contaminant by an animal.
A standard practice is to use a bio-concentration factor (BCF) representing the relationship betweenthe concentration in the fat within a tissue or a product and the concentration in the feed [Fries,1986]. The potential for bio-concentration can also be ascertained from the physical-chemicalcharacteristics of the contaminant.
��
*UD]LQJ�DQLPDOV
Grazing animals may be exposed to heavy metals by grazing plants, which accumulated heavymetals, or by direct ingestion of soil, as soil intake may represent about 10% of the animal diet,depending on the time period and the amount of plants available for grazing.
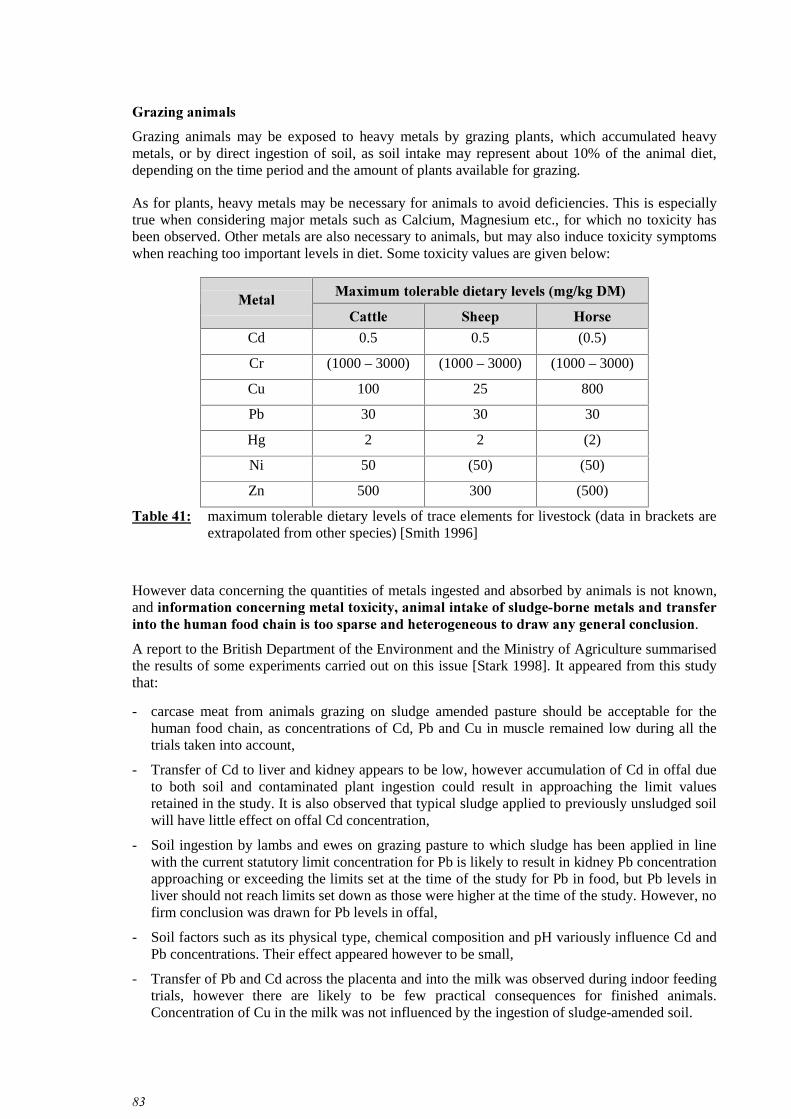
As for plants, heavy metals may be necessary for animals to avoid deficiencies. This is especiallytrue when considering major metals such as Calcium, Magnesium etc., for which no toxicity hasbeen observed. Other metals are also necessary to animals, but may also induce toxicity symptomswhen reaching too important levels in diet. Some toxicity values are given below:
0D[LPXP�WROHUDEOH�GLHWDU\�OHYHOV��PJ�NJ�'0�0HWDO
&DWWOH 6KHHS +RUVH
Cd 0.5 0.5 (0.5)
Cr (1000 – 3000) (1000 – 3000) (1000 – 3000)
Cu 100 25 800
Pb 30 30 30
Hg 2 2 (2)
Ni 50 (50) (50)
Zn 500 300 (500)
7DEOH����� maximum tolerable dietary levels of trace elements for livestock (data in brackets areextrapolated from other species) [Smith 1996]
However data concerning the quantities of metals ingested and absorbed by animals is not known,and LQIRUPDWLRQ�FRQFHUQLQJ�PHWDO�WR[LFLW\��DQLPDO�LQWDNH�RI�VOXGJH�ERUQH�PHWDOV�DQG�WUDQVIHULQWR�WKH�KXPDQ�IRRG�FKDLQ�LV�WRR�VSDUVH�DQG�KHWHURJHQHRXV�WR�GUDZ�DQ\�JHQHUDO�FRQFOXVLRQ.
A report to the British Department of the Environment and the Ministry of Agriculture summarisedthe results of some experiments carried out on this issue [Stark 1998]. It appeared from this studythat:
- carcase meat from animals grazing on sludge amended pasture should be acceptable for thehuman food chain, as concentrations of Cd, Pb and Cu in muscle remained low during all thetrials taken into account,
- Transfer of Cd to liver and kidney appears to be low, however accumulation of Cd in offal dueto both soil and contaminated plant ingestion could result in approaching the limit valuesretained in the study. It is also observed that typical sludge applied to previously unsludged soilwill have little effect on offal Cd concentration,
- Soil ingestion by lambs and ewes on grazing pasture to which sludge has been applied in linewith the current statutory limit concentration for Pb is likely to result in kidney Pb concentrationapproaching or exceeding the limits set at the time of the study for Pb in food, but Pb levels inliver should not reach limits set down as those were higher at the time of the study. However, nofirm conclusion was drawn for Pb levels in offal,
- Soil factors such as its physical type, chemical composition and pH variously influence Cd andPb concentrations. Their effect appeared however to be small,
- Transfer of Pb and Cd across the placenta and into the milk was observed during indoor feedingtrials, however there are likely to be few practical consequences for finished animals.Concentration of Cu in the milk was not influenced by the ingestion of sludge-amended soil.
��
2WKHU�DQLPDOV
Several studies showed that earthworms accumulate heavy metals in their tissues. In fact, their usehas been recommended as control indicators for the effects of sludge spreading [Kruse and Barret,1985]. This could be of concern as earthworms are an important food source for many birds andsmall mammals.
When studying wild animals, Roberts and Johnson [1978] established that heavy metalconcentrations are higher in carnivores than in herbivores. This would indicate bioconcentrationalong the food chain.
Many authors reported heavy metals as having little or no apparent effect on small herbivorousmammals (voles, mice, rabbits) [Alberici HW� DO, 1989] or on birds living in agriculturalenvironments where the spreading of sewage sludge is practised.
In spite of the possible phenomenon of bioconcentration in earthworms, Levin has detected noincrease in heavy metal levels in voles living in a field regularly spread with sludge.
This could be explained by the fact that these animals have a shorter food chain than carnivorousmammals and do not exploit the trophic levels where heavy metals could accumulate. Some otherstudies should be performed to understand what happens for upper vertebrates.
The absence of lead accumulating in the food chain should be noted. This is primarily explained bythe fact that lead is of low bioavailability, and by lead being deposited and immobilised in theskeleton, replacing copper [Roberts and Johnson, 1978] with no effect on animal health.
6.1.5 Human exposure
+XPDQ�WR[LFLW\
Each heavy metal may have impacts on human health, ranging from simple trouble to acute toxicityor carcinogenicity, when reaching toxic levels. Those impacts as well as toxicity levels aredescribed in appendix, when they are available.
+XPDQ�H[SRVXUH�SDWKZD\V
Human beings may be exposed to metals through ingestion, respiration or skin contact. Differentpathways are possible including the following ones:
Sludge spreading can have impacts on heavy metals ingestion. It is assumed to have only littleimpacts on inhalation. Direct contact should only concern workers or farmers handling sludge. Thisrisk may be reduced when good practices are taken into account.
Inhalation and skin contact, however, should not be ignored: dust or mercury may be released inthe air during transportation or spreading. Nevertheless, few scientific publications address thosetwo exposure routes.
Contamination of the soil surface by heavy metals following sludge spreading can constitute a riskfor the general public, particularly from direct soil ingestion.
There are two sources for this:
- Particles ingested during outdoor activities, concerning mainly children, which may ingestbetween 40 and 200 mg per day of dusts or particles.
- Dust brought in from outside on clothes and footwear.
��
This risk applies to people living near to areas that have been spread.
The available literature does not report any specific work on these phenomena, which remainmarginal with respect to other methods of exposure.
It should however be noted that, no serious incident has been reported caused by ingestion ofsludge or following exposure to dust after a sludge spreading operation.
)RRG�LQJHVWLRQ
The determination of the amounts of metals a person may ingest is based on the level in food andthe quantity of food ingested.
Level in food may be determined in tracing the fate of metals in the food chain. It must be observedthat heavy metals are not degraded from one level of the food chain to another; they tend toaccumulate, but can change their speciation and therefore their transfer ability�
Heavy metal bioavailability to animals is low, since the metals are not biologically transformed infarm animals’ digestive or hepatic tracts, but human beings consume offal (liver, kidneys, etc.),which represent areas of heavy metal concentrations. Other animal tissues, particularly muscles, donot concentrate heavy metals.
The amounts due to cereals, vegetables and fruits consumption cannot be ignored because of theimportant part such foodstuffs play in overall diet.
According to recent estimates, these amounts would contribute over half of the total cadmium, leadand mercury levels found on average in the French population [Becloitre, 1998]. The other half iscoming from the remaining foodstuffs, water, and atmosphere.
,QIOXHQFH�RI�IRRG�SURFHVVLQJ�DQG�FRRNLQJ
The heavy metals absorbed by humans through ingestion of foodstuffs of plant and animal originarise not only from the plants or animals themselves but also from potential contamination or lossesresulting from harvesting, transportation, processing, storage and cooking.
The levels in a given foodstuff, therefore, do not always reflect the levels in the raw material. Thesephenomena are well known and, since 1976, a European Directive has laid down the levels ofheavy metals for items coming into contact with foodstuffs [Council Directive 76/893/EEC].
Heavy metals concentration in food may be increased or decreased by food processing chain. It ishowever not possible at present to assess the specific amounts of heavy metals contributed bysludge to the processing chain for foodstuffs destined for human consumption since there are alarge number of interacting factors contributing to the actual levels of heavy metals in suchproducts.
The manufacturing methods also induce changes in the levels of heavy metals in foodstuff. Theymay be limited by washing, or accentuated by freeze-drying. The equipment or packaging usedcould also increase the levels of heavy metals. Table 42 below shows the effects of processingvegetable products into foodstuffs on the levels of heavy metals.
��
3URFHVV (OHPHQW ,PSDFWV�RQ�OHYHOV
Cooking Cr, Pb +
Preserving Cr, Cu, Ni, Pb, Zn +
Wine-making Cd, Pb -
Wine storage Cr +
Flour refining Cr, Cu, Pb, Zn -
Sugar refining Cr -
7DEOH����� the effects of food processing and cooking on the heavy metals levels in somevegetable products [ADEME 1995]
Peeling and cooking may also affect the levels of heavy metals in food. Kampe [1984] reported areduction by 50 % of the cadmium concentration after peeling potatoes. Cooking can also reducecadmium concentrations in root and green vegetables, as well as potatoes.
In conclusion, an assessment of the contribution of sludge spreading to the human heavy metalconsumption is difficult to perform. Sludge spreading does not seem to have any impact on sanitaryquality of human diet. Human exposure via water contamination is limited because of low leachingof soil heavy metals and regulatory levels for heavy metals in drinking water. Human exposure viameat and milk is not significant, as animal tissues, except liver and kidney, do not concentrateheavy metals. The industrial processes and culinary practices may have an impact on the heavymetals content in food.
6.1.6 Conclusion on heavy metals transfers in the food chain
Metals present in soil and sludge are numerous. Heavy metals are naturally present in soil atvarying level, and may originate from several anthropogenic sources such as fertilisers, animalmanure, sludge, or atmospheric deposition. However, variety in the metal levels in European soilsmay also be due to the diversity of the extracting methods used rather than differences in the field.In order to ensure the quality of the comparisons, harmonisation of the sampling and measurementsmethods would be needed.
Once applied to VRLO�� heavy metals� are distributed between the different soil media. Scientificevidence shows that they accumulate in the upper layers of the soil, due to binding to the differentexisting organic or mineral particles. Their mobility and biovailability to plants and micro-organisms may be influenced by several factors of which the pH level of the soil is of greatestimportance.
Micro-organisms species present in soils are numerous. Some of them are of interest for soilfertility and therefore for agricultural production. Concern has been expressed about theconsequences of metal application onto soil on PLFUR�RUJDQLVP� SRSXODWLRQV� DQG� ELRGLYHUVLW\.Available scientific literature shows contradictory results, depending on the species taken intoconsideration, the local conditions of the experiments, and the confusion of short-term laboratoryexperiments with long-term field trials. Some authors mentioned the possibility of microbialpopulations adapting to changing conditions, which may be considered a result of negative pressureon the population. On the basis of long-term field trials, some studies concluded that diversity andpopulation of soil micro-organisms could be negatively affected by sludge-borne metals in thelong-term, at metal levels in soil which were in some cases below current regulatory prescriptions.It must also be stressed that microbial activity indicators must not be used as only indicators ofmicrobial reaction to metal application, as these do not reflect changes in population structure.
/HDFKLQJ�appears to be a negligible phenomenon. On the contrary, UXQRII, when occurring, mayplay a significant role in metal transfer. Its importance depends greatly on the local situation, andthe fate of metals needs to be further documented.
��
3ODQW�XSWDNH�occurs for all heavy metals and is described by transfer factors. Some metals are ofbiological interest for the plant. Uptake will increase with increasing metal levels in soil but onlyapplies to the bioavailable part of the metals present in soil. However there may be no directrelation between total metal concentration and bioavailable metals in soil. pH is the most importantfactor influencing metal uptake. In particular, a decrease in the pH value in soil in the range of pH7 to pH 4 causes an increase in the uptake of Cd, Ni and Zn. The same effect is observed for Cu,but is less marked. Lastly, when considering usual acidity levels in agricultural soils, a pH decreasehad no noted effect on Pb and Cr uptake. This information supports the setting of different limitvalues for Cd, Ni and Zn, and possibly for Cu, for soil pH values between 5 and 7 as well as forsoil pH values higher than 7. Sludge spreading should also be avoided on soil with a pH valuebelow 5.
Heavy metals concentrate in the roots and vegetative parts of plants and are less present in thegenerative parts such as wheat grain. However sludge-borne metal uptake by plants is very lowwhen compared to the total amount of metals present in soil.
8SWDNH of metals by animals occurs through contaminated plant consumption or soil ingestion.However, little information is available concerning metal quantities ingested and absorbed andtheir subsequent toxicity levels in animals. Metals do not seem to accumulate in meat. However,more focus is needed on possible Pb and Cd transfer to offal, as in some cases this could lead tolevels nearing acceptable limits in foodstuffs. Transfer of Pb and Cd across the placenta and intothe milk was observed during indoor feeding trials, but there are likely to be few practicalconsequences for finished animals. Concentration of Cu in the milk was not influenced by theingestion of sludge-amended soil. A quantitative assessment of this contamination pathway is notpossible at the present time.
Generally speaking, KXPDQ� H[SRVXUH� WR�KHDY\�PHWDOV� can be attributed to several sources anddepends on many factors such as diet, actual absorption, and food processing. Consumption ofcontaminated crops appears to be the main means of exposure to sludge-borne metals. It is assumedthat the specific contribution of sludge-borne metals to the human diet is very low, when takinginto account the observed level of metals present in soil, and considering the surface area overwhich sludge spreading takes place.
��
���� 2UJDQLF�SROOXWDQWV
The fate of the organic pollutants in the environment and the food chain is not as well documentedas for heavy metals. A description of the pollutants taken into consideration in this study is given inappendix.
6.2.1 Behaviour in soil
'LVWULEXWLRQ�LQ�VRLO
The figure below summarises all phenomena occurring in the soil and affecting the distribution ofan organic pollutant in the soil.
$LU
6RLO
*URXQGZDWHU
6XUIDFH�ZDWHU$LU
:DWHU
6ROLG
5XQRII
/HDFKLQJ
/L[LYLDWLRQ
5HWHQWLRQ
'HJUDGDWLRQ
9RODWLOLVDWLRQ
'HSRVLWLRQ
3ODQW
$EVRUSWLRQ
,QSXW
)LJXUH����� processes implied in the fate of organic compounds in soil
As soon as they are deposited on soil, organic pollutants are distributed between the three phases ofthe soil: solid, liquid and vapour. Equilibrium constants for adsorption, desorption, andvolatilisation regulate this repartition. Those constants are specific for a compound, but also dependon the type of soil and the climatic conditions.
Phenomena determining the behaviour of organic compounds in soil are biological or abiotic, andmay be categorised in three types:- transformation/degradation processes (metabolism, photolysis, catalysis)- retention processes (absorption, adsorption/desorption22, precipitation, solubilisation,
sublimation, co-ordination reactions)- transport processes (by fauna and flora, leaching, runoff, volatilisation)
Those phenomena induce a modification of the concentration in each phase. Therefore, distributionof the organic compound in soil is not static, and evolves through the time.
22 AGsorption refers to binding to abiotic matter; AEsorption refers to binding to living material (micro-
organisms, soil fauna & flora, roots)
��
For most of the compounds, binding of the organic chemical to the solid phase regulates the otherphenomena.
The most easily available part of the pollutant is that located in liquid and vapour phases. Theavailability of a compound is the key parameter for its efficiency (when considering pesticides forinstance) and ability to be degraded by soil micro-organisms, but also for its leaching to thegroundwater or volatilisation into the atmosphere. It has been observed that sorption of organiccompounds on soil particles plays a major role in controlling the fate of these pollutants in anaquatic environment. According to the compounds, volatilisation may concern 0 up to 90 % of theamount of chemical applied.
The binding of the pollutant to the solid phase of the soil (for instance to the organic matter after itsapplication) helps reducing its diffusion within the environment (especially leaching) and thereforethe pollution, but it also makes its complete degradation more difficult. Adsorption is enhancedwhen the organic matter content of the soil increases, and is also greatly influenced by soil pH andpresence of minerals such as clay, and aluminium or iron salts.
According to Wilson [1994], normal rates of sludge application to agricultural land are unlikely toincrease the volatile organic compounds content of the soil to levels that may cause concern forhuman health and environment. Eljarrat [1999] however reported an experiment on PCDD/Fs. Theconclusion was that in the case of an initial low contamination of the soil, the final soil did notexceed German limit values, but in the case of an initial soil with considerable contamination, thefinal soil exceeded the limits, restricting the cultivation of certain vegetables.
2UJDQLF�FRPSRXQGV�GHJUDGDWLRQ�LQ�VRLO
Available organic compounds in soil undergo numerous physical, chemical and biologicalmodifications, affecting their properties, toxicity and distribution. They are transformed in othercompounds before being totally mineralised. Those so-called metabolites may be more toxic thanthe original chemical. It is therefore of interest to describe the degradation pathway of the organiccompounds, which is not always known or easy to determine, as the number of intermediarymetabolites may be important, and depend on the pedoclimatic conditions. The degradation andpartition of chemicals in soil also depend on other chemicals, with which competition can occur.
The degradation pathway may vary greatly according to the aerobic or anaerobic conditions in soil.For example, it is known that LAS breaks down fairly rapidly in aerobic conditions, but mayremain for a much longer period in soil under anaerobic conditions.
It has been shown that microbial activity is the most important degradation mechanism for manytrace organic contaminants in soil. Fungi also have the ability to mineralise a wide variety ofpersistent organic compounds including PAHs, PCBs and PCDD/Fs, while bacteria havedifficulties degrading chlorinated hydrocarbons. Microbial activity is influenced by climaticconditions (temperature, water availability, and pH mainly). It has also been observed that micro-organisms are able to degrade organic compounds even though those compounds are not naturallypresent in the environment. In this case however, it is referred to as co-metabolism, as it does oftennot correspond to the normal metabolism of the micro-organism. The degradation is then slower.Moreover, microbial activity did not appear to be disturbed by organic sludge contaminants such asPAHs, NP and DEHP except at a very large rate of application [Smith 1996]23.
The fate of chemicals in soil over time is described in the following figure.
23 Some works have also been published concerning toxicity of organic compounds in soil to earthworms.
They did not attempt to move away from contaminated areas [Spurgeon 1994] and it seems that organic
compounds are not toxic to earthworms at low levels. However, PCB accumulation in earthworms has also
been reported.
��
Contaminant loss by a combination of leaching,volatilisation, biodegradation, photolysis, etc.
Bioavailable(labile)
Recalcitrant but extractable as intact parentcompound in solvent
Irreversibly bound non-extractable
Time (arbitrary units)
C/Co
)LJXUH����� fate of organic chemicals in soil over time; C: concentration at time t; C0:Concentration at time t=0 [after Jones HW�DO. 1996]
Chaudri HW�DO� [1996] studied the impact of 12 organic compounds (including LAS, Nonylphenol,Aroclor 1016 and Anthracene) on the population of the symbiotic bacteria 5KL]RELXPOHJXPLQRVDULXP biovar WULIROLL. No impact was observed apart from in the case ofpentachlorophenol. In this case, the highest no observed adverse effect concentration (HNOAEC)was determined to be 50 mg PCP kg-1 soil, and the lowest observed adverse effect concentration(LOAEC) 75 mg PCP kg-1. There may be several reasons for the low impact of other compoundson the 5KL]RELXP population [McGrath 2000]:
- the level of the organic compounds in sludge applied was below the toxicity level forRhizobium,
- they may have been bound to soil organic matter, consequently reducing their availability andtoxicity,
- they may have been subject to microbial degradation,- Rhizobium may tolerate those compounds.
NOEC and EC values for the different organic pollutants considered in this study are given in theappendix.
Different constants describe the behaviour of organic compounds. One of those is the ZDWHUVROXELOLW\, indicating the amount of compound able to be dissolved in the aqueous phase of the soiland to leach or runoff. Another one is the RFWDQRO�ZDWHU� SDUWLWLRQ� FRHIILFLHQW� (KOW), whichexpresses the propensity of a compound to be located in a water or organic phase.
The KDOI�OLIH�WLPH describes the persistence of a compound in soil. It is a statistical figure, definedas the time at which half of the amount of a compound introduced in the soil has been degraded.This value increases with the molecular weight of the compound. Half-life time values vary greatlybetween the different organic compounds, ranging from hours/day to years/decades.
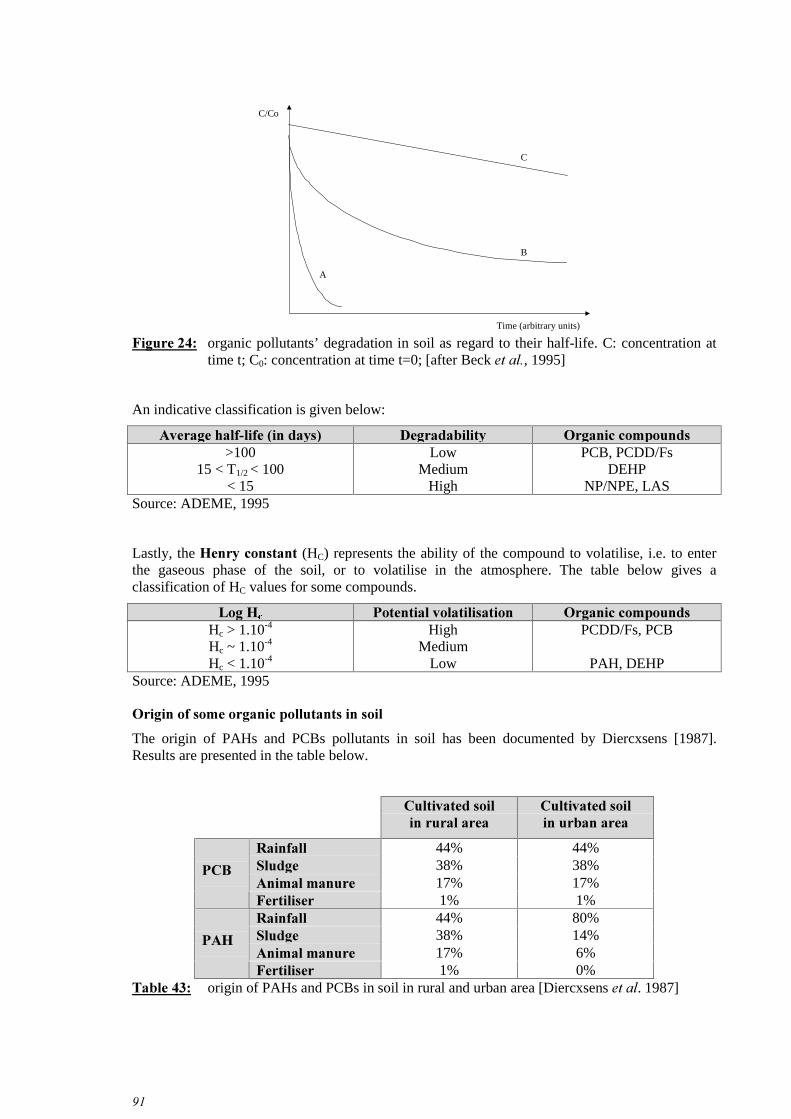
The figure below describes the different possible situations. Situation A shows short half-lives, andrapid degradation. Situation B presents intermediate half-life values corresponding to a short periodof rapid degradation, followed by a slower degradation. Lastly situation C describes the case ofcompounds with long half-life, which are persistent in the soil.
��
Time (arbitrary units)
C/Co
C
B
A
)LJXUH����� organic pollutants’ degradation in soil as regard to their half-life. C: concentration attime t; C0: concentration at time t=0; [after Beck HW�DO�, 1995]
Lastly, the +HQU\�FRQVWDQW (HC) represents the ability of the compound to volatilise, i.e. to enterthe gaseous phase of the soil, or to volatilise in the atmosphere. The table below gives aclassification of HC values for some compounds.
)HUWLOLVHU 1% 0%7DEOH����� origin of PAHs and PCBs in soil in rural and urban area [Diercxsens HW�DO. 1987]
��
6.2.2 Transfer to water
Potential transfer pathways to water for organic pollutants are either transfer to surface waterthrough runoff, or to groundwater through leaching.
It seems that the main proportion of the compound exported to VXUIDFH�ZDWHU is bound to soil solidparticles. According to the compound, runoff may comprise up to 20 % of the amount applied. Thistransfer may be avoided when spreading is not performed near surface water, or on bare or slopingland. However, as mentioned for heavy metals, the runoff mechanisms , the quantities implied andthe fate of the molecules is not well understood.
/HDFKLQJ may apply to some compounds. As described before, it depends on soil properties, and isincreased when the compound presents a high solubility. However, its presence in the water orgaseous phase of the soil also enables its degradation by micro-organisms. Leaching is also reducedwhen increasing the organic matter content of the soil, as it enables its binding in the upper layers.Laboratory experiments showed sludge addition to soil reduced leaching of organic compounds.This result may however be different in the field, considering the amount of sludge applied (seepart 3.4.1).
McGrath [2000] observed that most sludge-borne organic compounds are rapidly broken down orvolatilised from the soil before leaching can take place, or are lipophilic and are therefore bound toorganic matter in the soil’s upper layers and immobilised there. Among the compounds consideredin this report, nonylphenol is the most soluble. Some specific studies have been performed to assessits leaching potential [Mc Grath 2000]. Sludge containing 430 mg/kg DM nonylphenol was appliedon lysimeters at Woburn (UK). No quantifiable amount of nonylphenol leached from the soil aftersludge application was identified in the samples. In contrast, soluble organic carbon was found inthe leachate, indicating that at the same time, some organic compounds, not likely to be pollutants,were leached.
Duarte-Davidson HW�DO. [1995] compared several modelling methods in order to assess the leachingpotential of organic compounds in soil. The main conclusions were:
- Many compounds present low half-life values of less than 20 days, and would therefore belikely to be degraded in soil before being leached to groundwater, even if highly soluble.Among these, non-halogenated monocyclic aromatics, 2,6-dinitro-o-cresol, phtalates, carbonyls,detergents and some amines and haloethers may be found.
- Compounds which are highly persistent in soils and which present high conductive anddiffusive mobilities are more likely to dissipate in soil vapour to the atmosphere, with aresultant low leaching priority. These include non-halogenated aliphatic hydrocarbons and mosthalogenated aliphatics.
- Persistent compounds, which have been identified by the different models as low leachers,mainly due to their high adsorption potential, are unlikely to leach down to groundwater. Theseinclude chlorobenzenes, nitrobenzenes, chlorophenols, non-halogenated aliphatic hydrocarbons,PAHs, PCBs, PCDD/Fs and organochlorine and organophosphate pesticides.
The authors identified a list of organic compounds likely to leach to groundwater, which is givenbelow. Some of these assessments (outlined in italic) are based on limited data.
Organic compounds may penetrate plants either through their roots or through their upper parts.They also can be deposited or sorbed on their surface.
Taking into account the lack of data, experiments have shown that there is little transfer of sludge-borne organic pollutants to the plant [O’Connor 1996], even in experiments implying high loaded-sludge generally spread in high quantities, which do not correspond to the common practice.Transfer factors are often below 0.01 in reference to the total content in the dry matter. It has alsobeen observed that for some organic compounds, plant metabolism may transform them in non-toxic forms once in plant tissues [O’Connor 1991]. Uptake properties of chemicals are summarisedin a recapitulative table to be found in appendix.
8SWDNH�E\�URRWV
The transfer within the tissues of the plant depends on the octanol-water partition coefficient of thecompound. Compounds tending to remain in the water phase will not easily go through the plantepidermis or once within the plant, they will diffuse in the cellulosic cell walls and between thecells of the roots. On the contrary, hydrophobic compounds could penetrate the cell. It must beobserved however that those lipophilic compounds are not mobile within the soil. O’Connor [1991]observed that most organic pollutants are so strongly reactive in the soil-sludge matrix that theirbioavailability to plants is expected to be low.
However, even if a compound can penetrate the plant, the polar nature of sap will avoid its transferto the upper parts [Duarte-Davidson HW�DO� 1996].
It has also been reported that some species such as carrot would concentrate lipophilic chemicals intheir roots because of their lipid content [Wild and Jones 1992]. Some studies reported thatconcentration in roots, when occurring, is located in their external parts and the epidermis(especially for carrots peel).
Lastly, organic compounds may be absorbed on the root hair, but it is likely that the most importantpart of them will remain there without penetrating the inner part of the plant.
8SWDNH�E\�WKH�XSSHU�SDUW
Organic compounds may reach the surface of the plant following atmospheric deposition, or aftervolatilisation from the surface of the soil. Essential chemical parameters for describing thosetransfers are therefore the Henry constant and the octanol-water partition coefficient.
Hydrophilic compounds will be able to penetrate in the stomata, but will not easily go through thecuticle of the plant, whereas this could be possible for hydrophobic compounds.
Lastly, deposition may occur when sludge is directly spread on plants, especially on grassland. Thiskind of treatment should however be avoided when good practices recommendations are followed.
6.2.4 Uptake by livestock
Livestock may ingest organic compounds in two ways: by direct ingestion or grazing.
Soil ingestion may account for significant part of the animal diet (between 0 and 30 %). Therefore,intake will greatly depend on the amount of organic pollutant bound to soil particles.
The direct ingestion of sludge-treated soil by grazing livestock is considered to be the principalroute of trace organic bioaccumulation in the food chain which may result from agriculturalutilisation of sewage sludge [Smith 1996]. Ingestion routes are the same as for heavy metals.
Once ingested, a part of the compound will be degraded in the intestine, while the remaining partwill go through the gastro-intestinal wall (except PAH, which are little absorbed), and will betransported by blood. Some of them like DEHP or PAHs will be metabolised, but other compoundssuch as PCDD/Fs and PCBs are persistent compounds, which will be stored in fatty tissues, and
��
may be then found in milk. Bioaccumulation is especially important when considering chemicals oflong half-life (according to ADEME [1995] more than 10 days) and high octanol-water partitioncoefficient (Log KOW > 4,5).
The second route for livestock exposure is the contaminated plant ingestion while grazing.Considering what has been described before, this route is not likely to account for importanttransfers, as organic pollutants hardly penetrate plants. It has also been suggested that significantelevations in the potential transfer of some compounds to grazing livestock may result from surfaceapplication of sludge to grassland. Good practices however should avoid this application, and thisexposure may be reduced by injecting sludge into soil. Moreover, the period of exposure tocontaminated herbage is expected to be relatively short.
6.2.5 Conclusion and human exposure
Numerous organic compounds are present in sludge. Once applied to land, they are distributed inall soil media, and undergo several retention and transport processes. They are physically,chemically and biologically transformed into other intermediary compounds during theirmineralisation, for which no data is presently available. The degradation pathway of the organiccompounds, and thus the duration before negligible concentration in soils is achieved may greatlydepend on the aerobic or anaerobic degradation conditions.
/HDFKLQJ� RI� RUJDQLF� SROOXWDQWV appears to be insignificant but, unlike metals, must not beneglected. The importance of this mechanism depends on the properties of the compounds and thesoil. It appears on the one hand that many compounds present short half-life values, reducing therisk of leaching to groundwater. On the other hand, persistent compounds, such as PCDD/Fs orPCBs, have an affinity with soil particles and will therefore bind to soil rather than leach to groundwater. 5XQRII, when occurring, may play an important role in the transfer of organic compounds.
Even if definitive evidence is lacking, it appears that soil PLFUR�RUJDQLVPV are not affected bysludge-borne organic pollutants in most cases and that they are able to adapt to changingconditions.
Most organic pollutants are QRW�WDNHQ�XS�E\ SODQWV. However, a risk of contamination of the foodchain exists when spreading sludge directly onto crops, especially on plants which are to beconsumed raw or semi-cooked.
Soil and sludge ingestion while grazing is the main route for DQLPDO contamination. Accumulationof bioaccumulative compounds such as PCDD/Fs, PCBs or PAHs may occur in meat and milk.However, it is currently not possible to assess the quantities and fates of organic compoundsingested by animals.
It appears that the consumption of animal products is the major source of KXPDQ exposure tosludge-borne organic pollutants, due to the ingestion of soil by livestock. As in the case of heavymetals, it is assumed that the specific contribution of sludge-borne organic pollutants to the humandiet is very low, when considering the reduced proportion of the utilised agricultural area ontowhich sludge spreading takes place.
This is confirmed by Wild HW�DO. [1994], which performed an assessment of the human exposure tosludge-borne PCDD/Fs. Assuming that the human diet is composed of products grown or rearedexclusively on soil amended with sludge at a rate of application of 10 t DM/ha, it appeared that thehuman exposure to PCDD/Fs increased by between 15-400 %, according to the congener,compared to background exposure. However, the hypotheses were highly unrealistic. Nevertheless,when considering that only 1 to 3 % of the diet originates from sludg-amended soil (i.e. thepercentage of UK agricultural land currently amended with sludge), the increase in the exposure toPCDD/Fs was below 0.1 % compared to background exposure. This publication also identified themain contamination route to humans from dioxins and furans, and concluded that application ofsludge to crops will not significantly influence human exposure to PCDD/Fs due to the inefficiencyof transfers from soil to plant tissues. In contrast, transfers of dioxins and furans from sludge-amended pasture to livestock via the ingestion of soil and sludge adhering to vegetal are critical
��
with regard to human exposure, and these transfer processes are the principal pathways influencingthe human diet.
Lastly, it must be observed that at the present time no universally accepted and validated analyticalmethod exists for the analysis of most organic compounds. There is also a lack of data concerninglevels of organic pollutants in European sewage sludge as no regular survey has been performed inthe past.
Therefore, considering the present state of the knowledge, it appears at the present time, that:
- transfer to water is low, micro-organisms adapt themselves to changing conditions in soil, andnumerous organic compounds are rapidly degraded in soil. Attention should therefore mainly begiven to compounds with higher half-life time values,
- from the point of view of crop protection, no limit value seems to be necessary as transfer toplant does not occur for most organic compounds,
- restriction should focus on bio-accumulative compounds spread on grazing land such as PCBsand PCDD/Fs. In this case deep injection of sludge could reduce the risk of livestockcontamination by organic pollutants,
- a survey of organic pollutant levels in sludge should be performed by sludge producers,focusing on the specific organic pollutants identified within the waste water catchment area ofthe WWTP.
���� 3DWKRJHQV
Pathogens observed in sludge are of five main types: bacteria, viruses, fungi and yeast, parasiticworms, and protozoa. By now, the potential impacts of fungi and yeast have not been evaluated.Therefore, only the first four types will be reviewed in this study. A description of those pathogensis given in appendix.
6.3.1 Origin in sludge
The main source of sewage sludge contamination by pathogens is human faeces. The sanitary levelof the population will therefore influence the pathogen load sludge. Fauna (rodents) and flora thatmay develop in sewers and the animals’ droppings through runoff also contribute to waste watercontamination. This may be increased when food industry (dairy products production orslaughterhouses) is connected to sewers. WRc [2001] documented that chemicals used during thetanning process disinfect the waste, with the possible exception of %DFLOOXV�DQWKUDFLV. Lastly, paperprocessing sludge can be considered as free of pathogens, as it is mainly composed of lignin orcellulose fibres and of chemicals used for de-inking or bleaching.
Sewage sludge may also contain plant pathogens, as well as weed seeds. They mainly originatefrom the washing of vegetable and fruit, or from road or roof runoff after aerial deposition. Plantpathogens have in general low optimum growth temperature, so that disinfection will be achievedat a lower temperature than for mammalian pathogens [WRc 2001].
Pathogens contained in wastewater concentrate in sludge during the wastewater treatmentprocesses. This concentration occurs either by direct settling (mainly eggs, cysts and protozoa thathave sufficient density) or by adsorption on matter in suspension in the effluent (bacteria andviruses).
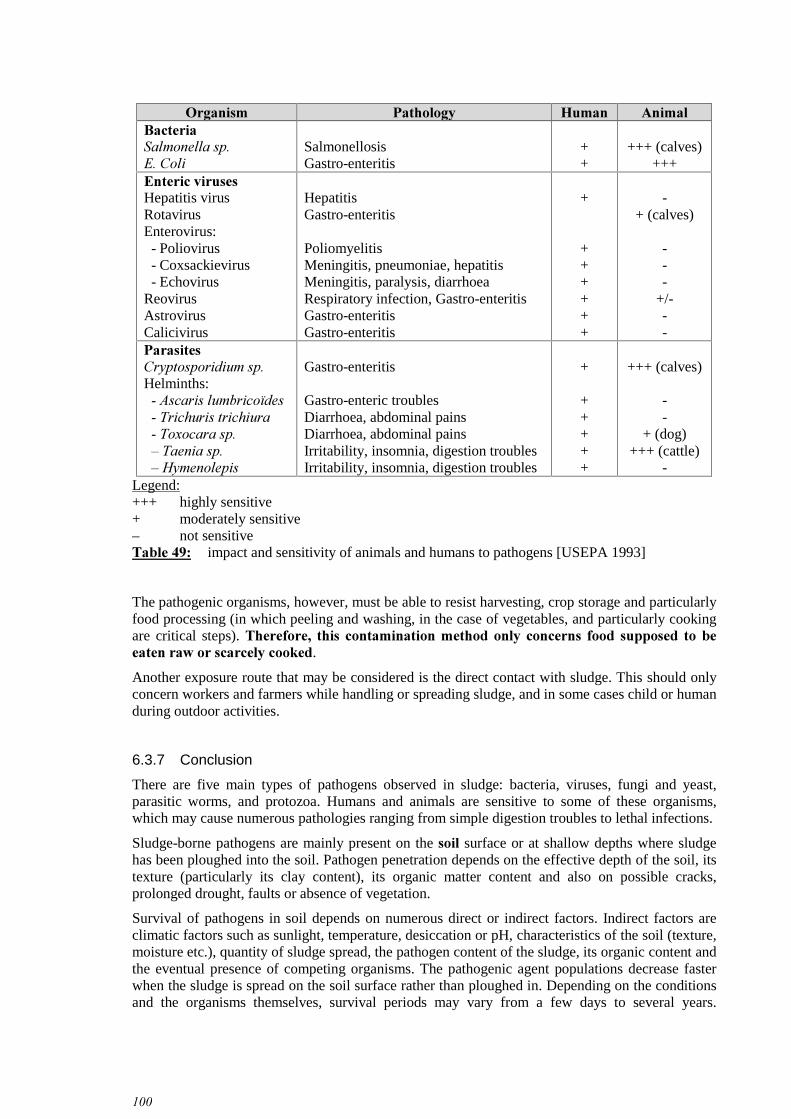
Pathogens that may be present in sludge are presented in the following table.
7DEOH����� pathogenic micro-organisms that may be found in sludge derived from faecal material.[WRc 2001]
6.3.2 Behaviour in soil
'LVWULEXWLRQ�LQ�VRLO
Pathogens are naturally present in the environment. Those introduced after spreading are mainlypresent on the surface of soil, on plants or at shallow depths in the soil where sludge has beenburied.
Pathogen penetration depends on the effective depth of the soil, its texture (particularly its claycontent) and its content in organic matter. Depth of pathogen penetration into the soil deeper layersmay also be increased in certain cases including the presence of cracks, prolonged drought, faults,or absence of vegetation.
Experiments on bacteria, viruses, and parasites originating from sludge show that most remain inthe first centimetres of the soil, although a small proportion may penetrate more deeply.
��
6XUYLYDO�LQ�VRLO
Survival of pathogens in soil depends on numerous direct or indirect factors. Indirect factors areclimatic factors such as sunlight, temperature, desiccation or pH, characteristics of the soil (texture,moisture etc.), quantity of sludge spread, the pathogen content of the sludge, its organic content andthe eventual presence of competing organisms.
Direct factors are related to the biological characteristics of the pathogen, and especially to theform under which it may survive. Spore forming bacteria (e. g. &ORVWULGLXP�VSS.) are more resistantto environmental stress than vegetative bacteria (e. g. 6DOPRQHOOD� VSS). In the same way, non-enveloped viruses (e. g. enteroviruses) are more resistant to pH changes and dehydration thanenveloped viruses. Lastly, most +HOPLQWKV and parasitic protozoa have developed a lifecycle stage(ova or cyst) that is resistant to environmental pressures.
The pathogenic agent populations decrease also more rapidly when the sludge is spread on soilsurface rather than buried.
Depending on the conditions and the organisms themselves, survival periods vary from a few daysto several years in some cases. Parasites’ eggs or cysts are the longest survivors – one to two yearsin certain favourable circumstances.
Cools HW�DO. [2001] examined the survival of (��FROL and (QWHUURFRFFXV spp. derived from pig slurryin order to compare the impact of soil texture, temperature and soil moisture. It appeared that bothspecies survived remarkably better at 5 °C than at 25 °C. Numbers of (QWHURFRFFXV spp. remainedconstant at 5 °C in all soil textures, while numbers of (��FROL declined gradually and reached thedetection limit at day 68. At 25 °C, both species declined rapidly and reached the detection limit atdays 54 and 26 respectively. For both bacterial species, a lower incubation temperature and ahigher soil moisture favoured survival.
The table below [WHO 1989] presents the average pathogens survival in soil.
3DWKRJHQV $YHUDJH�VXUYLYDO�LQ�VRLO
%DFWHULD: VDOPRQHOOD��faecal�coliforms < 70 days (often < 20 d)
9LUXVHV: enteroviruses < 100 days (often < 20 d)
3URWR]RD: (QWDPRHED�KLVWRO\WLFD < 20 days (often < 10 d)
+HOPLQWKV: $VFDULV, 7DHQLD�VDJLQDWD Several months
7DEOH����� survival of pathogens in soil [WHO, 1989]
WRc [2001] provided specific results concerning 6DOPRQHOOD� and $VFDULV survival in differentconditions, concluding on the impact of moisture and temperature as well as of soil vegetation.Results are summarised in the table below.
%DUH�VRLO 0RGHUDWH�YHJHWDWLRQ0RLVWXUH 7HPSHUDWXUH
6DOPRQHOOD $VFDULV 6DOPRQHOOD $VFDULV
< 8% > 10 °C Days Weeks days weeks
> 8% < 10 ° C Days Months 3 weeks years
< 8% < 10 ° C Days Months 6 months 15 months
7DEOH����� approximate survival times of Salmonella and Ascaris ova in sludge applied to soilsurface [WRc, 2000]
��
6.3.3 Water contamination
*URXQGZDWHU
In general, micro-organisms are retained in the upper soil layers by adsorption to soil particles, orbecause of the size of the soil pores. However, adsorbed cells are not permanently fixed, andrelease and transfer to deeper layers could be expected. Transfer to groundwater is only assumed tooccur in some peculiar cases.
Relatively few studies conducted at sludge application sites have assessed the vertical transport ofmicro-organisms under field conditions. Edmonds [1976] and Lue-Hing HW�DO� [1979] showed nomeasurable impact of sludge application on faecal coliform levels in groundwater. Even where highrate irrigation was practised on a coarse textured soil, the percolate was almost entirely free offaecal coliforms at a depth of 1.3 m [Glantz and Jacks, 1967].
The transport of protozoa and helminths in soils appears to be more limited than for bacteria orviruses, probably because of size differences between these groups of micro-organisms.
6XUIDFH�ZDWHU
Surface water contamination is more likely to occur and may induce a risk if concerning bathingwater. During raining events, water may transport soil particles to which pathogens are bound. Thisis confirmed by studies that showed correlation between 6DOPRQHOOD�VSS. contamination in surfacewater and pluviometry.
Runoff intensity and thereby contamination of surface waters depends on soil water content, rainintensity and plant cover. Sludge injection in soil is therefore recommended in order to reduce therisk of pathogen contamination of surface water.
6.3.4 Survival on plants
As mentioned earlier, numerous factors may influence the survival of pathogens. These may beenvironmental factors such as sunlight, temperature, desiccation or pH, or be related to the qualityof the sludge spread (pathogen level, organic content, competing organisms), the quantity of sludgeapplied, or the microbial structure of the micro-organism. These factors will influence the survivalof micro-organisms on plants as well as on soil surface. Several studies confirm that desiccationand sunlight reduce survival times of pathogens. They cause a high mortality among bacterialpathogens adhering to the leaves of crop plants treated with sewage sludge. Viruses may beeliminated from vegetation within 24 days [Larkin HW� DO�, 1976]. Taenia ova are sensitive todesiccation, and viability of both 7DHQLD and $VFDULV is reduced through fungal attack anddegeneration [Silverman, 1955; Jones HW� DO., 1979]. Protozoan cysts are very sensitive todesiccation and only survive a few days on soil or vegetation under drying conditions [Coker,1983; Sorber and Moore, 1987].
This explains why survival on plants is globally shorter than in soil. The table below summarisesthe survival duration of pathogens on plants.
3DWKRJHQV 6XUYLYDO�RQ�SODQWV
%DFWHULD: Salmonella, coliforms < 100 days (often < 20 d)
9LUXVHV: enteroviruses < 60 days (often < 15 d)
3URWR]RD: (QWDPRHED�KLVWRO\WLFD < 10 days (often < 2 d)
+HOPLQWKV: Ascaris, TDHQLD�VDJLQDWD < 60 days (often < 30 d)
7DEOH����� survival of pathogens on plants [WHO 1989]
��
6.3.5 Pathogens transfers to animals and to natural ecosystems
7UDQVIHU�WR�GRPHVWLF�DQLPDOV
Transmission to domestic animals takes place via the ingestion of contaminated feed and soil.Therefore, codes of good practice recommend that a period of no grazing should be respectedbefore grazing. WRc [2001] identifies a period of 3 months before grazing and 10 months beforeharvesting, corresponding to the provisions of the actual directive. However, more stringentconditions would be needed in the colder parts of Europe. It has also been mentioned earlier thatsome pathogens may survive for several years under favourable conditions. More information istherefore needed concerning the fate, and amounts of, such pathogens in soil after sludgespreading.
Some pathogens will be destroyed during digestion. The most sensitive species are cattle, sheep,horses and goats. Table 49 provides information on the impacts of the different pathogens onanimals.
Farm animals at pasture can also be contaminated by fluid flowing onto the pasture from sludgestored on field.
(FRV\VWHP�FRQWDPLQDWLRQ
According to Carrington [1978], sludge-borne pathogens are unlikely to represent a significantimpact on natural ecosystems. This is mainly because the major sludge pathogens, such as 7DHQLDVDJLQDWD and $VFDULV, are host specific. It must however be recalled that sludge may also containplant pathogens.
However, wild animals contaminated by direct contact with sludge can act as a vector forpathogenic agents. They may sustain the contamination within their population and transmit it toother populations. It was also observed that sludge may contain plant pathogens.
In a general manner, deep injection or ploughing down may be recommended during or after sludgeapplication. Although these practices reduce the deleterious effect of weather on micro-organisms,contact with animals, wildlife and humans, as well as dissemination in the environment, will bereduced.
6.3.6 Human exposure
Pathogens, according to the species, may induce effects at various infection levels. In some cases,contact with one individual may be sufficient to suffer from its effects. So-called minimuminfecting doses (MID) have been defined, summarised in the table below.
0LFUR�RUJDQLVPV 0,'��1XPEHU�RI�PLFUR�RUJDQLVPV�
9LUXV 102
%DFWHULD 102 - 106
+HOPLQWK�ZRUPV 1-10
3URWR]RD 10-100
7DEOH����� minimum infectious doses for pathogens [ADEME]
Humans can be affected by consuming contaminated plants or meat products from animals thathave ingested contaminated plants or soil.
The impacts of pathogens on human are presented in the table below.
-Legend:+++ highly sensitive+ moderately sensitive– not sensitive7DEOH����� impact and sensitivity of animals and humans to pathogens [USEPA 1993]
The pathogenic organisms, however, must be able to resist harvesting, crop storage and particularlyfood processing (in which peeling and washing, in the case of vegetables, and particularly cookingare critical steps). 7KHUHIRUH�� WKLV� FRQWDPLQDWLRQ�PHWKRG�RQO\� FRQFHUQV� IRRG� VXSSRVHG� WR� EHHDWHQ�UDZ�RU�VFDUFHO\�FRRNHG.
Another exposure route that may be considered is the direct contact with sludge. This should onlyconcern workers and farmers while handling or spreading sludge, and in some cases child or humanduring outdoor activities.
6.3.7 Conclusion
There are five main types of pathogens observed in sludge: bacteria, viruses, fungi and yeast,parasitic worms, and protozoa. Humans and animals are sensitive to some of these organisms,which may cause numerous pathologies ranging from simple digestion troubles to lethal infections.
Sludge-borne pathogens are mainly present on the VRLO surface or at shallow depths where sludgehas been ploughed into the soil. Pathogen penetration depends on the effective depth of the soil, itstexture (particularly its clay content), its organic matter content and also on possible cracks,prolonged drought, faults or absence of vegetation.
Survival of pathogens in soil depends on numerous direct or indirect factors. Indirect factors areclimatic factors such as sunlight, temperature, desiccation or pH, characteristics of the soil (texture,moisture etc.), quantity of sludge spread, the pathogen content of the sludge, its organic content andthe eventual presence of competing organisms. The pathogenic agent populations decrease fasterwhen the sludge is spread on the soil surface rather than ploughed in. Depending on the conditionsand the organisms themselves, survival periods may vary from a few days to several years.
���
Parasites’ eggs or cysts are the longest survivors – one to two years in certain favourablecircumstances.
Transfer to JURXQGZDWHU is only assumed to occur in some particular cases, while VXUIDFH�ZDWHUcontamination is more likely to occur when runoff water transports pathogens which are bound tosoil particles.
Survival on SODQWV is shorter than in soil, due to the effects of desiccation and sunlight.
Transmission to GRPHVWLF�DQG�IDUP�DQLPDOV at pasture takes place via ingestion of contaminatedfeed and soil.
+XPDQV can mainly be affected by consuming raw or semi-cooked contaminated vegetables ormeat.
Therefore the risks of sewage sludge application onto the land have to be taken into account aspathogens are present in sludge and may have important impacts on humans and animals. This riskis addressed by good practices which are presented in chapter 8 and may be reduced if sludge isdisinfected by means of the processes described in part 4. In a general manner, deep injection orploughing down may be recommended during or after sludge application. Although these practicesreduce the deleterious effect of weather on micro-organisms, contact with animals, wildlife andhumans, as well as dissemination in the environment will be reduced.
Sewage sludge may also contain plant pathogens, as well as weed seeds. They mainly originatefrom the washing of vegetable and fruit, or from road or roof runoff after aerial deposition. Plantpathogens have in general low optimum growth temperature, so that disinfection will be achievedat a lower temperature than for mammalian pathogens.
The impacts and benefits of the incineration and landfilling have been described in the precedingpart. Pollutants generated by each of those two routes are more precisely described below.
In order to have proper comparison values for emissions of the incineration, limits set in theincineration directive24 are summarised in the table below:
< 6 t/h 400 New plants 500&2 50'LR[LQV�DQG�IXUDQV 0,1 ng/m3 0,1&G��7O Total 0,05 0,05+J 0,05 0,056E��$V�� 3E��&U��&R��&X��0Q�1L��9
Total 0,5 0,5
7DEOH����� air emission limit values for waste incineration or co-incineration [Directive2000/76/EC of 4 December 2000]
24 Directive 2000/76/EC of the European Parliament and of the Council of 4 December 2000 on the
incineration of waste
���
6.4.1 Halogens and derived acids
*HQHUDO�SURSHUWLHV
Halogens are a chemical group including chlorine, fluorine, bromine, iodine, and astatine. Theyhave a very high reactivity and can be found under different forms such as acids and gas (forinstance Cl2 and F2, which are known to react with nearly all other chemical elements), orassociated in the structure of hydrocarbons. Waste incineration generates significant amounts ofchloric acid (from a few tens to a few hundreds of mg/m3), and to a lesser extent of fluoric acid (afew mg/m3) which are mostly abated during flue gas treatment. Other acids derived from halogenswill not be found in such amounts in incinerator emissions to air.
,PSDFWV
All halogens are respiratory irritants and can generate severe burns of skin, eyes, and mucousmembranes. Their main toxicity is an acute toxicity (short exposure to high dose). Till now,carcinogenicity of halogens has not been proven. They also have an impact on building materialsand can damage buildings of cultural merit since they acidify ecosystems.
7DEOH����� parameters of the risk for halogen exposure
6.4.2 SO2
*HQHUDO�SURSHUWLHV
SO2 is a colourless gas soluble in water. It may be smelt above a few mg/m3. SO2 can be of naturalorigin, but is mainly generated in urban and industrial areas, because of the combustion of fossilenergy. SO2 may be transformed in an acid form or a salt. Bound together, they constitute anaerosol.
SO2 emission has been notably reduced in the last decades thanks to the improvement of the qualityof fuels and the control of emissions. It is also found under its particulate form, associated with itsacid or salts. This gas has a background value of about 20 to 40 µg/m3. During pollution peaks, itsconcentration in the air may reach 250 to 300 µg/m3. Sludge incineration may generate 300 to 3500mg/m3 SO2.
,PSDFWV
SO2 is mainly inhaled through the nasal mucous membrane because of its solubility. A small partof the amount inhaled, bound to particles, can reach the inferior part of the respiratory system anddeposit in lungs.
25 RfC: reference concentration, definition see glossary26 ADI: acceptable daily intake27 VME: Average exposure value in working conditions28 VLE: Limit exposure value in working conditions
���
It has been observed that a short exposure to a high dose generates respiratory troubles and cough.A long-term exposure to a reduced dose does not seem to generate a sanitary effect. Howeverepidemiological studies could not relate the effects observed to SO� exposure with certitude. It isconsidered that SO2 has an impact as a particulate matter.
SO2 also has an acidification impact, which may indirectly affect agricultural yields. On the otherhand, SO2 can have a positive effect on plant growth. SO2 can also impact building materials.
3DUDPHWHUV�RI�WKH�ULVN
The WHO retained a value of daily exposure of 125 µg/m3 and a yearly exposure value of 50µg/m3.
1DWXUH�RI�GDPDJH I&5��FDVHV�SHU��SHUV�⋅\U⋅µJ�P���SO2 - Acute mortality 5.34E-06SO2 - Respiratory hospital admission 2.04E-06SO2 via sulphates fCR = 1.67(fCR for PM10)
As adapted and recommended by the ExternE Programme in Rabl HW�DO [1998].
7DEOH����� exposure-response functions (fCR) for damages from SO2 (direct and via sulphateaerosols) from incinerators in Europe [after COWI]
6.4.3 NOx
*HQHUDO�SURSHUWLHV
The term NOx comprises usually NO2 and NO. NO2 has been retained as an indicator of the qualityof air. NOx is also known to be a precursor in the formation process of ozone, and may betransformed in aerosols.
,PSDFWV
In vitro studies as well as studies on animals have shown that NOx have an impact on the lungsmorphology, effects on the defence system of the respiratory system, and effects on the immunesystem.
Several studies have also been carried out on humans, showing a resistance of the respiratorysystem to NO2 alone. Epidemiological studies have not shown an impact with certitude, butimpacts on respiratory symptoms and affections are suspected, especially on populations alreadysuffering from respiratory diseases such as asthma.
Health effects of NOx may appear when transformed in aerosols. Their impact is then comparableto the one of particulate matter.
NOx has been classified by the European Commission as toxic and irritating for eyes andrespiratory routes.
NOx also causes acidification and has therefore an impact on ecosystems, and building materials.
3DUDPHWHUV�RI�WKH�ULVN
The amount of NOx necessary to observe any impact on health or agricultural yield is quite high,and is thus not included in ExternE.
6.4.4 Particulate matter
'HVFULSWLRQ
Particulate air pollution may arise due to direct emissions of particles from industrial sources,vehicles, homes etc. Dust generated by incineration is mostly retained by treatment of fumes. Some
���
of it, however, is emitted into the atmosphere corresponding generally to the smallest particles. Theprofile of dust (describing the amount of dust emitted according to the particle size ) emitted by anincinerator is not very well known. The amount of dust emitted is wide: between 5 and 900 mg/m3.
,PSDFWV
Toxicity of particles and exposure routes are different according to their size. Small particles arenot very well retained by the fume treatment of an incinerator and can penetrate the lungs.Pollutants contained in bigger particles are ingested.
Three types of danger have been identified:- allergic effects,- carcinogenic effects especially caused by heavy metals and PAH contained in dust,- inflammatory effects.
The effects of dust will of course greatly depend on its composition. The inflammatory effectshowever are not specific, and can help the penetration of other pollutants of dust in the organism.Particulates with a diameter of less than 10 µm (PM10) are considered as the most harmful. Dustalso aggravates asthma.
Particulate matter also soil buildings, implying frequent cleaning.
As adapted and recommended by the ExternE Programme in Rabl HW� DO [1998].RAD = Restricted Activity Day; YOLL = Years Of Life Lost
7DEOH����� exposure-response functions (fCR) for damages from particulates (primary emission)from incinerators in Europe [after COWI]
6.4.5 Other Gases
Other gases are specifically emitted by incineration and landfilling. VOCs for instance may havevarious impacts on health. Methane (CH4), carbon dioxide (CO2), and in some extent carbonmonoxide (CO) are not known to have an impact on human health, but are of relevance in life cycleassessments as they have an important contribution to climate change.
A global warming potential has been defined for climate change relevant gases. It compares thepotential impact of each on climate gas with carbon dioxide. Those global warming potentials arepresented below:
���
6XEVWDQFH /LIHWLPH�\HDUV�
���\HDUV ����\HDUV ����\HDUV
CO2 variable 1 1 1CH4 12±3 56 g CO2/g CH4 21 g CO2/g CH4 6.5 g CO2/g CH4
NO2 120 280 g CO2/g CH4 310 g CO2/g CH4 170 g CO2/g CH4
7DEOH����� global warming potentials for CH4 and NO2 as a function of time [IPCC 1996]
���
���
��� 0RGHOOLQJ�RI�SROOXWDQW�WUDQVIHUV
���� 2EMHFWLYHV�RI�WKH�PRGHO
Following the description of the transfer mechanisms of different pollutants in the environment,this part aims to develop a model which enables to calculate:
- the sludge-borne pollutants transfers in soil (in particular due to runoff and leaching),
- the sludge-borne pollutants transfer to plants in order to compare it to limit values in foodstuff,
- the sludge-borne pollutants accumulation in soil,
- the time before reaching a given limit value of pollutants in soil.
It must be stressed that only heavy metals have been taken into consideration in this part.Knowledge concerning organic pollutants does not enable accurate calculations as only little isknown about their behaviour and degradation pathways in soils. It appears moreover from theprevious part that organic pollutants’ transfer to plants is negligible and that this particular routeshould not induce any risk for human health. Such calculations applied to pathogens are notrelevant.
���� 0RGHO�SUHVHQWDWLRQ
The model consists of an Excel file in which two scenarios have been considered, referred to as“high accumulation” and “low accumulation” scenarios. ,QGHHG�VFLHQWLILF�OLWHUDWXUH�DV�ZHOO�DV�WKHLPSRUWDQW� QXPEHU� RI� SDUDPHWHUV� LQIOXHQFLQJ� SROOXWDQWV¶� WUDQVIHU� DQG� DFFXPXODWLRQ� LQ� WKHHQYLURQPHQW�GR�QRW�SHUPLW�DQ\�DFFXUDWH�GHVFULSWLRQ�RI�WKRVH�SKHQRPHQD��7KHUHIRUH�WKH�WZRDERYH� PHQWLRQHG� VFHQDULRV� KDYH� EHHQ� FKRVHQ� LQ� RUGHU� WR� JLYH� DQ� LGHD� RI� WKH� UDQJH� RIYDULDWLRQV� RI� WKH� UHVXOWV� DQG� WR� FRPSDUH� WKH� LPSRUWDQFH� RI� WKH� SKHQRPHQD� DQG� RI� WKHGLIIHUHQW�SDUDPHWHUV�LQYROYHG�
Some hypotheses and assumptions were necessary for the calculations, which are described below.All those parameters may be modified, enabling any other calculation according to the evolution ofthe knowledge on the pollutants’ behaviour and transfer in the environment. A sensitivity analysishas been performed and is presented in chapter 7.3.4.
���
7.2.1 Assumptions made
It was considered that
- pollutants are evenly spread throughout the surface to which sludge is applied,
- pollutants brought to soil are distributed evenly in the upper layer of soil,
- metals levels in sludge remain constant over time,
- other pollution sources are not taken into account, since calculations are made to give an idea of29the FRQWULEXWLRQ�RI�VOXGJH to pollutants transfer.
Other hypotheses were made, some of which being specific for each scenario. They aresummarised in the table below.
/LPLW�YDOXHV�IRU�PHWDOV�LQ�VRLO Limit values of the 1986 directive
7DEOH����� assumptions made in the model (* as a proportion of the metal level)
The different sludge types and levels for metals in soil before sludge application are given in thefollowing table. The low and high levels in sludge correspond for each metal to the lowest andhighest mean levels observed in European sludge and reported in appendix.
29 Background level is to be understood here as the metal level in soil just before the first sludge application.
This level will increase over time.30 Available on http://apps.fao.org/page/collections?subset=agriculture31 Whitwham M., Les pailles de céréales, évaluation du potentiel de pailles mobilisables à des fins
énergétiques, Les cahiers du CLIP n° 10, 1999
���
The levels of metals in clay and sandy soils before sludge application originate from German dataof the preliminary evaluation of heavy metal content in European soils32. It must be kept in mindthat levels in soil before sludge application may vary greatly according to local context, soil types,parent material etc. Those are therefore indicative values.
7DEOH����� sludge types and levels in soil before sludge application used in the model
The variation of the quantity of sludge applied on land was introduced in the model in order to takethe diversity of the Member States’ regulations into account.
Plant uptake was estimated by considering 3 different crops, representing the principal situations ofplant transfers: one cereal, one leafy vegetable, and one root vegetable. We took the mainconsumed crops in Europe IRU�ZKLFK�GDWD�ZHUH�DYDLODEOH into consideration, that is wheat, carrotand lettuce.
The transfer factors used in this model are those given by Sauerbeck and Lübben [1991], as theyare widely used in the literature. They are based on the statistical exploitation of numerous data. Asmentioned in chapter 6 of this report, some parameters greatly influence the fate of metals in soiland their transfer to plants, of which pH, organic matter content and CEC are the most important.In particular, a lower pH value will increase the metals’ level in soil solution and increase theirbioavailability. ,W�LV�DVVXPHG�KHUH�WKDW�WKH�UHODWHG�LQFUHDVH�LQ�WKH�PHWDO�XSWDNH�E\�SODQWV�ZLOOEH�REVHUYHG�WKURXJK�D�PRGLILFDWLRQ�RI�WKH�YDOXH�RI�WKH�WUDQVIHU�IDFWRUV��VR�WKDW�WKHLU�LQIOXHQFHLV� WDNHQ� LQWR� DFFRXQW� LQ� WKLV� PRGHO� WKURXJK� WKH� UDQJH� RI� YDOXHV� XVHG� IRU� WKH� WUDQVIHUFRHIILFLHQWV�
Sauerbeck’s transfer factors also apply to the edible part of the plant. As no other data is available,the transfer factor for wheat grain was applied to the whole plant, although literature indicates thatuptake is lower in grain than in other parts of the plant. Plant uptake for wheat is therefore probablyunder estimated.
Lastly, Sauerbeck observed that transfer factors may decrease when soil contamination increases. Itwas here considered that they remain constant over time.
In order to calculate the number of years before reaching a regulatory limit value, the followingassumptions were made:
- one crop is grown each year on the agricultural land,
- the same crop is grown each year,
- land spreading occurs every year.
32 Heavy metal (Trace element) and organic matter contents of European soils – results of preliminary
evaluations for 4 Member States, 2000, European soil bureau – Joint research center Ispra
���
Those assumptions were made to the purpose of the modelling. They do therefore not exactlyreflect the usual agricultural practice.
7.2.2 Equations used
The different equations used for the calculations are presented below. Those calculations are madeon a RQH�\HDU�SHULRG�EDVLV.
6OXGJH�ERUQH�PHWDOV�LQ�VRLO
[ ] [ ] 1000××= VOXGJHVRLO 0HWDO40HWDO
where Q is the quantity of sludge applied to land [t DM/ha][ ]VOXGJH0HWDO is the metal concentration in sludge [mg/kg DM]
[ ]VRLO
0HWDO is the sludge-borne concentration of a given metal in soil [mg/ha]
6OXGJH�ERUQH�UXQRII
[ ]VRLO
0HWDOOHYHO5XQRIIUXQRIIERUQH6OXGJH ×=
where Sludge-borne runoff is given in mg/ha [mg/ha]Runoff level is a dimensionless value [-][ ]
VRLO0HWDO is the sludge-borne metal concentration in soil [mg/ha]
/HDFKLQJ
[ ]VRLO
0HWDOOHYHO/HDFKLQJOHDFKLQJERUQH6OXGJH ×=
where Sludge-borne leaching is given in mg/ha [mg/ha]Leaching level is a dimensionless value [-][ ]
VRLO0HWDO is the sludge-borne metal concentration in soil [mg/ha]
In our calculations and according to scientific literature, it was assumed that leaching is QHJOLJLEOH.
0HWDO is only the sludge-borne metal concentration in soil after erosion and leaching.TF is the transfer factor from the soil to the plant [-]
A conversion of the metal concentration in soil from mg/ha to mg/kg DM was realised by using thefollowing equation:
[ ] [ ]'9
VRLOLQ0HWDOVRLOLQ0HWDO KDPJ
NJ'0PJ ×= /
/
where V is the volume of soil of one hectare, when considering the repartition depth taken intoaccount in the hypothesis [m3/ha]
���
D is the bulk density33 of the soil [kg/m3]
D is calculated by using the formula given by [Keli Zaghbahi 1984]:
%Clay0.0153 - 1.6 ×='
Where % Clay is the clay content of soil [%]
6OXGJH�ERUQH�H[SRUW�E\�SODQW
After having determined the concentration of metals in plant compared to the one in soil, thefollowing equation enables us to determine the amount of metals exported from one hectare ofagricultural land after harvesting.
[ ] ( ) 50HWDO4 SODQWRUW ×−×= θ1exp
where Qexport is the total amount of metal exported when considering one hectare, [mg/ha][ ]SODQW0HWDO is the concentration of metal in plant [mg/kg DM]
is the humidity of the considered crop [-]R is the yield of the harvest [kg/ha]
This calculation was also performed on the total metal content of soil.
6OXGJH�ERUQH�DFFXPXODWLRQ�LQ�VRLO�LQ�RQH�\HDU
38/(66$ −−−=
where SA is the sludge-borne accumulation of metal in soil [mg/ha]S is the metal amount brought by sludge [mg/ha]E is the amount of metals taken away by runoff [mg/ha]L is the amount of metals taken away by leaching [mg/ha]PU is the sludge-borne metal uptake by plant [mg/ha]
It is considered here that plant uptake concerns sludge-borne metals as well as metals present insoil before sludge application. Consequently, the OHYHO� RI� PHWDOV� LQ� VRLO� HYROYHV� HDFK� \HDUfollowing each sludge application. Therefore:
QQQ38(/6%% −−−+= −1
with ( )'9
5(/6%7)38
QQ ×−××−−+= −
θ1)( 1
where Bn is the metal level in soil before sludge application at year n [mg/ha]
33 The bulk density of a soil is the mass of dry soil per unit of total volume of soil
���
PUn is the metal plant uptake at year n [mg/ha]TF is the transfer factor from soil to plant [-]S, L and E are given in mg/ha [mg/ha]Other variables: see before
Runoff as well as leaching is considered to apply RQO\� WR� WKH� DPRXQW� RI� PHWDOV� EURXJKW� E\VOXGJH. Indeed runoff happens on the surface of the soil where metals originating from the sludgeapplication of the year concentrate. Metals present in soil before sludge application, which aredistributed in the whole profile of the soil, are not affected by those phenomena. This is alsoassumed for leaching as part of the metals present in soil before sludge application are stronglybound to soil.
In order to get the metal level in soil after n years compared to the level in soil before the firstsludge application, mathematical transformations give:
∑=
−×−−+×−=Q
T
TQ
Q=(/6%=%
10 )1()()1(
where( )'9
57)=
×−××= θ1
Bo is the background level in soil before the first application of sludge [mg/ha]
Employing the following mathematical formula:
SS
SQQ
T
T
−−=
+
=∑ 1
1 1
0
we get: ( ) ( ) ( ) ( )==
(/6==
(/6%=% Q
Q
−×−−+
−×−−−×−= 11
)1( 0 ���
That is:
( ) ( )( ) ( )
( )=
/(6==
%
/(6==
%
Q
Q
−
−−−−
−−−−
=1ln
1
1
ln
0
where Q is the number of years before reaching a given level Bn in soil [years]
Practically, Z is always below one. Therefore, considering the equation referred to as (1) above,
when n tends toward infinity, Bn tends toward a limit value which is ( ) ( )==
(/6−×−− 1 . This may
be explained by the fact that after a number of years, as the level of metals present in soil beforesludge application increases, the plant uptake also increases toward a value nearing the amount ofmetals brought by sludge, which remains constant. An HTXLOLEULXP� between metals brought bysludge and metal uptake by plant is reached, and the soil metal level no longer evolves. Figure 26below gives an example of such an equilibrium in the case of the low accumulation scenario, whenconsidering wheat and cadmium.
���
A given regulatory limit value O [mg/ha] is reached when %Q = O. Therefore the number of yearsbefore reaching a given regulatory limit value is:
( ) ( )( ) ( )
( )=
/(6==
%
/(6==
O
Q−
−−−−
−−−−
=1ln
1
1
ln
0
7KLV�KRZHYHU� LV� RQO\� YHULILHG�ZKHQ� WKH� UHJXODWRU\� OLPLW� YDOXH� LQ� VRLO� �O�� UHPDLQV� EHORZ� WKHFDOFXODWHG�OLPLW�YDOXH�IRU�PHWDOV�LQ�VRLO��%Q���,Q�WKH�RWKHU�FDVH��WKH�UHJXODWRU\�OLPLW�YDOXH�ZLOOQHYHU�EH�UHDFKHG��VHH�ILJXUH����EHORZ�� This may be expressed in the following way:
( ) ( )==
(/6O−×−−< 1
that is /(6O
/(6=
−−+−−<
0
500000
1000000
1500000
2000000
0 10000 20000 30000 40000 50000
QXPEHU�RI�\HDUV
EDFNJURXQG�OHYHO
UHJXODWRU\�OLPLW�YDOXH�O�
Q
UHJXODWRU\�OLPLW�YDOXH�O�
FDOFXODWHG�OLPLW�YDOXH
)LJXUH����� evolution of the metal level in soil over time according to the model (lowaccumulation scenario, in the case of wheat and cadmium). Metal level is given inmg/ha
In order to avoid any confusion, it must be stressed that the calculated limit value only describesthe equilibrium reached in soil after numerous sludge applications. It may represent very highlevels. Therefore WKLV�YDOXH�PXVW�QRW�EH�FRQVLGHUHG�DV�D�SRVVLEOH�UHJXODWRU\�OLPLW�YDOXH.
Moreover this FDOFXODWLRQ� KHDYLO\� GHSHQGV� RQ� WKH� DVVXPSWLRQV� PDGH� for the calculations.Results may greatly vary according to the local situation (real runoff level, different metal level insoil before sludge application, different metals level in sludge etc.).
���� 5HVXOWV�DQG�GLVFXVVLRQ
7.3.1 Results
All results of the calculations are given in appendix. Main results are summarised in tables 57 to62.
Main results concerning metals transfers are given in table 58 and 59.
Low accumulation scenario in the caseof wheat and cadmium.
If the limit value is set at the O� level, itwill never be attained as theequilibrium reached will induce a levelof metals in soil below O�.
On the contrary, if the limit value is setat the O� level, this limit value will beachieved after Q years.
���
First of all, RQ� D� RQH�\HDU� EDVLV� it must be observed that pollutants brought to soil by sludgeapplication represent D� YHU\� ORZ� SURSRUWLRQ� RI� WKH� DPRXQW� RI� PHWDOV� SUHVHQW� LQ� VRLO� EHIRUHVOXGJH. In the case of the “low accumulation” scenario, the amount of sludge-borne metals in soilranges from below 0,03% to 0,5% of the metal present in soil before sludge application. In the caseof the “high accumulation” scenario, this figure is higher and ranges from 0,5% to 6,5 %. However,it must be clearly stated that in the long-term, the evolution of the heavy metal levels in soil in thismodel is mainly due to the sludge-borne metals, as sludge application is the only input source forheavy metals considered herein. This is further described in the paragraph “time before reaching alimit value”.
In order to compare sludge contribution with contribution of other sources of pollution, thefollowing figures of atmospheric deposition of metals on soil may be found in the literature[Isermann 1992 in Amlinger 1994].
6OXGJH�ERUQH�PHWDOV�LQ�VRLO(g/ha/year)0HWDO
$WPRVSKHULFGHSRVLWLRQ(g/ha/year)
KLJK�DFFXPXODWLRQ ORZ�DFFXPXODWLRQ
&G 3,5 19 0,8
&U 20 1 020 32
&X 75 3 205 78
+J 1 15 1
3E 20 1 105 26
1L 130 450 18
=Q 500 8 140 286
7DEOH����� comparison of air deposition of metals [Isermann 1992 LQ Amlinger 1994] to theresults of the modelling
Those figures outline that atmospheric deposition is reduced compared to the amount of metalsbrought by sludge. According to the metal considered, atmospheric deposition of metals rangesfrom 2 to 30% of sludge-borne metals in soil.
3ODQW�XSWDNH�VKRZV�D�JUHDW�YDULHW\�DFFRUGLQJ�WR�PHWDO�W\SH��ORFDO�VLWXDWLRQ�DQG�SODQW�VSHFLHV.The transfer factors from soil to plant reported by Sauerbeck [1991] and used in this model rangefrom 0,005 to 6 in the low accumulation scenario, and 0,001 to 3 in the other case consideredherein. Factors below 1 indicate low uptake, whereas factors higher than 1 indicate a possibleconcentration of metals in plant tissues, compared to the metal concentration in soil.
In those conditions, in the case of the “low accumulation” scenario, plant uptake of sludge-bornemetals may represent from below 0,001% up to 0,1% of the sludge-borne metals in soil, except forcadmium uptake by lettuce which may represent up to 0,33 %. In the case of the “highaccumulation” scenario, plant uptake ranges also from below 0,001 % to 0,1 %, with the cadmiumuptake by lettuce being slightly different (0,26%). In any case, it represents D�PLQRU�SURSRUWLRQ�RIWKH�VOXGJH�ERUQH�PHWDOV�LQ�VRLO.
3ODQW�VSHFLHV�GRHV�QRW�KDYH�D�JUHDW�LPSDFW�RQ�WKH�SODQW�XSWDNH�according to the factor used inthis model. Except for cadmium (in particular for lettuce as mentioned above), for which factorsrange from 0,1 to 6, amounts of all other metals taken up by plants do not show significantvariations depending on the plant species.
���
As mentioned in the hypotheses, UXQRII� represent an important factor of metal transfer in soil,which in this model may reach 20% of the metal amount brought to soil. In the global balance andfor both scenarios, it is the PDLQ�IDFWRU�LQIOXHQFLQJ�PHWDO�DFFXPXODWLRQ�LQ�VRLO.
7DEOH����� main results of the metal transfers modelling (*: % of sludge-borne metals in soil) –Low accumulation scenario
As an example, this table should be read as follows: 79,98% of Cadmium contained in the sludgespread on wheat crop accumulates in soil in the case of the low accumulation scenario. 0.033% ofthe sludge-borne metals is taken up by the crop.
Lettuce 3 0,01937 0,646 1,83937 61* as set in the draft commission regulation setting maximum levels for certain contaminants in foodstuffs amendingcommission regulation (EC) N° 194/97 of 31 January 1997.
7DEOH����� exceedance of limit values in foodstuff following sewage sludge application
It appears from this model that JOREDO�SODQW�XSWDNH�of metals remains below the limit values infoodstuff in each case considered herein, following WKH�ILUVW�VOXGJH�DSSOLFDWLRQ. However, in theworst case, it may reach a significant proportion of this limit value (80 % in the low accumulationscenario), and the uptake of metals by plants will increase with increasing metal concentration insoil over time. It must be stressed that those limit values have been set based upon what isachievable using good working practice and not only to their toxicity. The Scientific Committee forFood however recommended that those values should be as low as reasonably achievable.
On the contrary, uptake of metal RULJLQDWLQJ� IURP� VHZDJH� VOXGJH application is very low, andreaches in the worst case 1 % of the limit value in foodstuff.
7LPH�EHIRUH�UHDFKLQJ�D�OLPLW�YDOXH
As explained in chapter 7.2.2, the model enables us to determine a calculated limit value of metalcontent in soil representing an equilibrium reached after a number of years of sludge spreading.The figures obtained may be very different according to the scenario taken into consideration. Thenumber of years is determined at the moment where the curve of the metal level in soil crosses theone of the regulatory limit value. In some cases, such crossing does not happen, which means thatthe regulatory limit value would never be reached.
The following table summarises the whole results of the modelling. As mentioned before, the limitvalues for metals in soil used for the purpose of the calculations were those of the 86 directive(upper limits).
���
It must be stressed that sludge composition was assumed to remain unchanged over the differentsludge applications. However, a sludge quality improvement has been observed over the past years(see part 3 of this report). If this would continue, the number of years should be increased. Thoseresults therefore correspond to a ZRUVH�FDVH�VFHQDULR.
1R�RI�\HDUV :KHDW &DUURW /HWWXFH
6FHQDULR Low High Low High Low High
&G Ø 416 Ø 509 Ø Ø
&U - - - - - -
&X Ø 101 Ø 101 Ø 102
+J Ø 270 N/A N/A Ø 270
1L Ø 265 Ø 272 Ø 268
3E 54 519 681 78 870 683 Ø 694
=Q Ø 81 Ø 79 Ø 80
7DEOH����� number of years before reaching a given limit value for metal in soils. Sludgecomposition corresponds to the lower and higher mean value for metals in sludge inthe European Member States (-: no limit value for Chromium in the 86 directive; ø:limit value not reached, N/A: no data on plant transfer in the case Hg/carrot)
As mentioned in the hypotheses, it appears in some cases that the regulatory limit value is abovethe calculated limit value, indicating that the regulatory limit would never be reached (Ø). Thisindicates that an HTXLOLEULXP�EHWZHHQ� WKH� DPRXQW� RI�PHWDOV� EURXJKW� E\� VOXGJH� DQG� WKH� RQHDEVRUEHG�E\�SODQWV would be established in soil before the metal level reaches the regulatory limitvalue.
It may be observed that the limit values which are set in the 86 directive do not induce for eachmetal the same number of years before reaching its limit. Besides, D� JUHDW� GLIIHUHQFH� LQ� WKHQXPEHU�RI�\HDUV�LV�REVHUYHG�EHWZHHQ�WKH�WZR�VFHQDULRV. In the case of low accumulation, whenavailable, the figures range from around 54 000 years to over 78 000 years, whereas in the highaccumulation scenario, values range from around 80 years to 694 years.
As it was already observed, the SODQW�VSHFLHV�GRHV�QRW�KDYH�D�VLJQLILFDQW�LPSDFW�RQ�WKH�QXPEHURI� \HDUV�� H[FHSW� IRU� FDGPLXP, of which transfer factors show the largest range of variation.Lettuce also presents, in most cases, higher transfer coefficients than other crops, inducing highernumber of years.
7KH� PDLQ� IDFWRUV� LQIOXHQFLQJ� WKH� UHVXOWV� DUH� WKH� OHYHO� RI� UXQRII� DQG� VOXGJH� FRPSRVLWLRQ.Therefore, increasing the time before reaching a limit value could be achieved by improving thesludge quality.
Another calculation has been performed, in order to assess the impact on the results, whenconsidering a sludge containing heavy metals at the level of the 86 directive. All parameters areunchanged, except sludge composition, which has been set to the limit values of the 86 directiveIRU�ERWK�VFHQDULRV (see assumptions). It corresponds therefore to a worse-case scenario comparedto the one using the mean values observed in the Member States. It must also be stressed that whenconsidering this level of metals in sludge, the amount of metals supplied to the soil would exceedthe maximum annual quantities of heavy metals which may be introduced into soil intended foragriculture given in the 86 directive.
���
1R�RI�\HDUV :KHDW &DUURW /HWWXFH
6FHQDULR Low High Low High Low High
&G 170 39 185 39 284 41
&U - - - - - -
&X 174 37 174 37 175 37
+J 135 32 N/A N/A 139 32
1L 395 60 399 60 394 60
3E 521 125 522 125 531 126
=Q 167 32 164 32 165 32
7DEOH����� number of years before reaching a given limit value for metals in soil; sludgecomposition corresponding to the higher limit values of the 86 directive (-: no limitvalue for Cr in the 86 directive; ø: limit value not reached; N/A: no data for plantuptake in the case of Hg/Carrot).
Contrary to the preceding situation, limit values would be attained in most cases. The number ofyears ranges in the low accumulation scenario between 135 and 531 years. In the case of the highaccumulation scenario, values range between 32 and 126 years. The number of years issignificantly reduced when comparing to the preceding calculation. All other conclusions drawnbefore also apply to those results.
Of course, the evolution of the heavy metal levels in soil shown by the results indicates an increaseof the metal levels in soil in the long-term, due to the application of sludge to soil, as it is the onlyinput source considered in this model.
7.3.2 Influence of sludge composition and transfer phenomena
The preceding modelling has been performed in order to describe the wide variety of the results.Therefore, two extreme scenarios have been chosen and all parameters have been modified.
The aim of this paragraph is now to describe WKH� VSHFLILF� LPSDFW� RQ� WKH� UHVXOWV� RI� WKH� VOXGJHFRPSRVLWLRQ and of the phenomena taken into account. Therefore, additional modelling has beencarried out of which results are presented in the following figure. The ORZ�DFFXPXODWLRQ scenariohas been used, and calculations have been performed when considering the following cases:
- Only metal accumulation in s o i l ; no transfer phenomenon,
- Metal accumulation in soil a n d plant uptake; no runoff,
- Metal accumulation in soil, p l ant uptake and runoff.
Those calculation have been performed in the case of cadmium and wheat, for sludge containing0,4 ; 3,8 and 40 mg/kg DM cadmium, the latter value corresponding to the limit value of the 86directive.
It appears of course that the number of years before reaching a limit value for metals in soilincreases with the number of phenomena taken into account, and decreases with increasing metallevels in sludge. As shown in the following figure, the main parameter influencing this number ofyears is however sludge composition.
���
0
2
4
6
8
10
12
14
16
18
20
0 50 100 150 200 250 300 350 400 450 500
1XPEHU�RI�\HDUV
0HWDO�OHYHO�LQ�VRLO��NJ�KD�\HDU�
Only accumulation in soil
Soil accumulation and plant uptake
Soil accumulation, plant uptake and runoff
86 Limit value in soil
0,4 mg/kg DM Cd
3,8 mg/kg DM Cd
Cd level corresponding to the limit value of the 86 directive
)LJXUH����� influence of sludge composition and the phenomena taken into account on the number of years before reaching a given regulatory limit value formetals in soil. (Low accumulation scenario for cadmium and wheat). As a comparison, the limit value of 3 mg/kg DM for Cd, given in the 86directive, corresponds in this model to a metal level in soil of about 10,8 kg/ha
���
7.3.3 Limits and evolution of the model
This model presents two situations, which are supposed to represent WZR�H[WUHPH�FDVHV� that maybe observed in the field. Calculations were therefore performed in order to give a range of valuesfor the different issues taken into consideration, and an idea of the importance of the differentphenomenon. )LJXUHV�JLYHQ� LQ� WKLV� UHSRUW� DUH�QRW� VXSSRVHG� WR�EH� XVHG� QHLWKHU� LQGLYLGXDOO\�QRU�ZLWKRXW�LQGLFDWLQJ�WKH�K\SRWKHVHV�PDGH�
Moreover, this model is a simplification of the reality, and only integrates the main routes andthose for which sufficient knowledge could be found in the literature. All routes and all parametersinfluencing metals transfer and transformation could not all be taken into consideration. Moreover,assumptions made represent extreme situations and do not exactly correspond to agriculturalpractices. Figures are therefore LQGLFDWLYH� YDOXHV. In particular, soil parameters, soil types(especially metal levels in soil before sludge application) and local situations (temperature,humidity etc.) may present great variations throughout Europe. As already mentioned, it was alsosupposed that metals are equally distributed within the plant, and that sludge composition remainsunchanged over time. Consequences on the results must be kept in mind when using the model.
In order to take accurately local parameters such as soil type, sludge composition, agriculturalpractices etc. into account, a site specific approach could be recommended. As it is presently thecase when determining background metal levels for soil, experiments should be made in the fieldenabling to take all parameters (including European soil diversity and agricultural) intoconsideration. Results could then be represented as a map showing areas on which you could applymore sewage sludge than on others.
The case of mercury must also be taken carefully. Less data is available for this metal, and the oneused in the model originates from different sources than those used for other metals. Moreover,volatilisation seems to be an important transfer route, about which no data could be found in theliterature. Results given herein do therefore not present the same level of confidence than in thecase of other metals.
Lastly, this model was conceived in order to be easily adapted to the improvement of theknowledge on pollutants’ transfer. Therefore, DOO�SDUDPHWHUV�XVHG�LQ�WKRVH�FDOFXODWLRQV�PD\�EHPRGLILHG�LQ�RUGHU�WR�UHSUHVHQW�UHDOLW\�DV�DFFXUDWHO\�DV�SRVVLEOH�
7.3.4 Sensitivity analysis
In order to assess the relative importance of the different inputs of the model on the number ofyears before reaching a limit value for metals in soil, a sensitivity analysis has been performed.Sensitivity analysis is the study of how the variation in the output of a model can be apportioned,qualitatively or quantitatively, to different sources of variation.
The different input parameters of the model have been separately modified, and the impacts on theoutput parameters have been calculated and summarised in several figures provided in appendix.Only one case has been studied, namely the case of cadmium for wheat on the basis of the lowaccumulation scenario, as equations used in the model are the same for all metals and scenarios.
As sludge quality has been shown to greatly influence the results, the modification of inputparameters has been performed for the three levels of cadmium used in paragraph 7.3.2. Figurestherefore present, for each metal level, the impact of the modification of one input parameter. Theparameters which have been tested are:
- Sludge quality
- Metal level in soil before first sludge application
- Clay content
- Crop yield
���
- Crop humidity
- Transfer factor
- Repartition depth
It appears from those calculations that the main factors influencing the number of years beforereaching a limit value for metals in soil are:
- sludge quality
- sludge quantity
- some model specific parameters such as clay content and repartition depth
On the contrary, the following input parameters have little impact on the values of the outputs ofthe model:
- metal level in sludge before first sludge application
- crop parameters: yield, humidity and plant transfer
���
��� *DSV�LQ�NQRZOHGJH�DQG�JRRG�SUDFWLFHV
���� *DSV�LQ�NQRZOHGJH
Today, uncertainties remain concerning the transfer of pollutants (especially organic pollutants) inthe environmental media and the food chain. Several issues would need to be more accuratelydocumented. Among those, followings may be quoted:
• The importance of the runoff process in the pollutant transfer should also be assessed.Mechanisms need to be understood, as well as quantities of pollutants concerned, and their fate.
• An issue of concern is the degradation pathway of the organic compounds in soil. Compoundsmay be degraded in intermediary chemicals before total mineralisation. Toxicity and leachingpotential of those metabolites are not well known. Lysimeter and field studies should beusefully carried out.
• Long-term impacts of heavy metals and organic pollutants, in particular on soil micro-organisms and fertility, are not well documented.
• More data is needed concerning the ingestion and absorption levels of organic compounds andin some extent of heavy metals by animals.
• There is also a lack of knowledge concerning the specific contribution of sewage sludge topollutant transfers.
• A survey of organic pollutant level in sewage sludge should be performed in the Member Statesin order to gain an accurate appreciation of their occurrence. This may only be possible ifanalytical methods are set and broadly accepted. Lastly, toxicity of numerous organiccompounds to human and animals as well as their occurrence in the environment need to beassessed.
• Available literature does not always enable a comparison between the different countries as nocommon research protocol and no trans-national study has been carried out.
• More information is also needed concerning other routes for sludge recycling, such as landreclamation or use in forestry and silviculture. In this last case, research should be carried out toidentify more precisely the agricultural benefits of sewage sludge spreading and itsenvironmental and sanitary impacts (especially concerning organic pollutants for which no datais currently available). Moreover, information currently available does not enable to assess andcompare the benefits and the risks of the practice in the conditions of the different Europeanforests.
• Lastly, some interesting new technologies such as wet oxidation, pyrolysis or gasification havebeen identified. More information concerning their environmental impact is needed, andconcerning their implementation conditions. Tests have not always been carried with sludge,and this issue needs further documentation.
���� *RRG�SUDFWLFHVFollowing the literature review which has been performed in chapter 6 and the gaps in knowledgeidentified, following recommendations for sludge use may be proposed, in order to reducepollutants transfer and food chain contamination. Those recommendations derive from the analysisof the literature and the codes of good practice which have been published in several MemberStates, and from the conclusions drawn in this study. Some of them were already in force in the1986 Directive or in some Member States (See sub-component regulatory report). 3URYLVLRQVDOUHDG\�PHQWLRQHG� LQ� WKH� �����'LUHFWLYH� DUH� KLJKOLJKWHG� LQ� EROG. Specific recommendationsconcerning sludge use in forestry and silviculture are given in chapter 5.
6.1.1Determination of background levels in soil • 6RLO�DQDO\VLV• Identification of other pollution sources and their significance
• )RU�RUJDQLF�SROOXWDQWV:Identify degradation pathways of pollutants in soil
6.2.1
Determination of pollutant content insludge
• $GHTXDWH�VDPSOLQJ�DQG�DQDO\VLV�SURFHGXUHV�LQFOXGLQJ- Frequency
- Number of samples,
- Analysis protocols
- Confidence in results
- Results availability
Safe storage of sludge • Ensure safe storage in order to reduce leaching
• Ensure sufficient storage capacity on WWTP
• Reduction of the storage duration in the field
:DWHU�FRQWDPLQDWLRQ�E\�KHDY\�PHWDOV�DQG�RUJDQLF�SROOXWDQWVLimit transfer to water • )RUELG�VOXGJH�VSUHDGLQJ�LQ�VHQVLWLYH�DUHDV�HVSHFLDOO\�
- On sloping land
- Near surface water
- On wet areas
- Within water resource protection areas
- On frozen ground (especially for liquid sludge)
- On sandy soil
- In areas where the water table is near the surface (< 1m)
• Encourage fast ploughing down in order to reduce the risk of runoff, and the use ofclose-to-ground techniques in order to reduce the formation of aerosols.
• )RU�RUJDQLF�SROOXWDQWV:Better knowledge of their specific behaviour in soil and water
Reduce transfer in the food chain • Encourage sludge spreading before non-food crops
Limit plant uptake • Adapt sludge spreading to soil types (mainly according to soil pH and CEC)
• Take into consideration heavy metal bioavailability in soil
• Define a crop / sludge type matrix with specific recommendations in co-operationwith professional organisations (see below)
• Prohibit sludge spreading on plants/crops which are known to accumulate heavymetals
6.1.36.2.3
ADAS
Limit deposition on plant • /LPLW�XVH�RI�VOXGJH�RQ�YHJHWDEOH�DQG�FHUWDLQ�IUXLW�SURGXFWLRQV CSHPF 1997
Control of the metal level in foodstuff • Analysis of the heavy metal level in crop
No specific recommendation concerning plant uptake of organic pollutants
$QLPDO�FRQWDPLQDWLRQ�E\�KHDY\�PHWDOV�DQG�RUJDQLF�SROOXWDQWVLimit pollutant transfer to animals • Tighten limits concerning quantity and quality of sludge which may be applied
• *UD]LQJ�ODQG�,QWURGXFH�D�WLPH�SHULRG�EHIRUH�JUD]LQJFavour sludge ploughing down
• *UDVVODQG�Allow spreading before sowing and after each cut
• )RU�RUJDQLF�SROOXWDQWV�- Introduce limit values for compounds with a higher half life value (PCDD/F,
PCB)
- Introduce several limit values (spreading prohibited, ploughing down / deepinjection compulsory, no constraint)
- Encourage deep injection on grazing land
6.1.46.2.4
CSHPF 1997
Control of the metal level in foodstuffs • Analysis of the pollutant levels in animal products (especially in offal and milk)
• *UDVVODQG�Allow spreading before sowing and after each cut
• Encourage fast ploughing down of sludge
• Encourage use of liquid sludge
6.3CSHPF 1997
Human contamination • Make sludge disinfection compulsory in areas to which humans may have access ;restrict public access after sludge spreading
• Encourage fast ploughing down when spreading non disinfected sludge
• Prohibition of sludge spreading on products which are to be consumed raw
• Safe transportation of sludge
• Prohibition of sludge spreading in the vicinity of houses and habitations and nearbathing water and drinking water supply area
6.3
CSHPF 1997
���
As mentioned in the table, sludge/crop matrix could be defined, describing the type of sludgewhich could be spread according to the type of culture. As an example, the British ADAS defined aso-called “safe sludge matrix”, defining the possible use of different sludge types according to thecrop. This matrix is presented in the table below.
7DEOH����� ADAS safe sludge matrix35 (Yes: applications allowed when complying with DoEcode of Practice)
34 sludge in which any pathogens are virtually eliminated35 available at http://www.adas.co.uk/env/environment/INDEX.HTM
���
*ORVVDU\
$EVRUSWLRQ Absorption refers to the binding to living material (micro-organisms, soil fauna & flora,roots)
$'' Average Daily Dose$'(0( Agence de l’Environnement et de la Maîtrise de l’Energie (French EPA)$', Acceptable Daily Intake$GVRUSWLRQ Adsorption refers to binding to abiotic matter$2; Adsorbable Organohalogen (Organochlorine) Compounds%&) Bioconcentration factor%2' Biological Oxygen Demand%XON�GHQVLW\ The bulk density of a soil is the mass of dry soil per unit of total volume of soil&DUFLQRJHQ An agent capable of inducing cancer&2' Chemical Oxygen Demand&(& Cation Exchange Capacity&(( Central and Eastern European countries&(3 2-Chloroethanol phosphate&RQJHQHU A chemical compound closely related to another in structure and exerting similar or
antagonistic effects, or something derived from the same source or stock'(+3 Di (2-ethylhexyl) phthalate'2 Dissolved Oxygen'0 Dry matter(& Effect concentration(3$ Environment Protection Agency(8 European UnionKDOI�OLIH describes the persistence of a compound in soil. It is a statistical figure, defined as the time
at which half of the amount of a compound introduced in the soil has been degraded+F Henry constant (HC) represents the ability of the compound to volatilise, i.e. to enter the
gaseous phase of the soil, or to volatilise in the atmosphere+HDY\�0HWDOV Refers to Cadmium, Copper, Chromium, Lead, Mercury, Nickel, Zinc,7&) Institut Technique des Céréales et des Fourrages (F).RZ octanol-water partition coefficient (KOW), which expresses the propensity of a compound to
be located in a water or organic phase./$6 Linear alkyl-benzenesulphonate/&$ Life Cycle Analysis/2(& Lowest observed effect concentration0&/ Maximum Contaminant (Contamination) Level0,' Minimum Infection Dose12(& No observed effect concentration13 Nonylphenol13( Nonylphenol ethoxylates23 Organic PollutantsS�H� population equivalent3$+V Polyaromatic hydrocarbons3&%V Polychlorinated biphenyls3&'' Polychlorinated dibenzodioxines3&') Polychlorinated dibenzofurans30�� Particulates with a diameter of less than 10 µm323V Persistent Organic Pollutants33* Polypropylene glycol5I& Reference concentration : an estimate of a continuous inhalation exposure to the human
population that is likely to be without an appreciable risk of deleterious effects during a
���
lifetime66 Sewage Sludge60 Suspended Matter7&'' Tetrachlorine dibenzo-p-dioxin7( Toxicity equivalent7(4 Toxic Equivalent Quantity8.:,5 United Kingdom Water Industry Research Ltd86�(3$ United States Environment Protection Agency8:: Urban Waste Water8::7 Urban Waste Water Treatment Systems9/( Limit exposure value in working conditions90 Volatile matter90( Average exposure value in working conditions92& Volatile Organic Compounds:+2 World Health Organisation::73 Wastewater treatment plant<2// Years Of Life Lost5LVNDVVHVVPHQW
Determination of potential adverse health effects from exposure to chemicals, includingboth quantitative and qualitative expressions of risk. The process involves four major steps :hazard identification, dose-response assessment, exposure assessment, and riskcharacterisation
7KUHVKROG Dose or exposure below which no deleterious effect is expected to occur