Evidence Based Big Data Benchmarking to Improve Business Performance D4.3 Evaluation of Business Performance Abstract The goal of this deliverable is to present the results of the evaluation of business process performance based on evidence from data collection activities. We have learnt several lessons from this research that can help companies approaching BDA (Big Data and Analytics) to more quickly understand the opportunities and guide tests and implementations. This knowledge has been made available from the DataBench Toolbox and constitutes the basis for the DataBench Handbook (the last deliverable of WP4, D4.4). An important goal of DataBench is to understand the role played by technical benchmarking and the benefits that can be obtained in BDA projects when technical choices are based on accurate benchmarking. A fundamental lesson that we have learned from the case-study analysis is that BDT (Big Data Technology) projects can deliver important and measurable business benefits. However, we have understood that technical performance can be an enabler of big data benefits and, on the other hand, technical cost can represent a barrier to reap business benefits. We have performed research in this direction to define a methodology for the architectural sizing and cost assessment of an infrastructure supporting BDA use cases. We have then mapped benchmarks on the architectural components and analyzed the impact of software selection of the cost and performance of this architecture, to support the assessment of the potential benefits from an accurate software selection based on technical benchmarking in WP5.
Transcript
Evidence Based Big Data Benchmarking to Improve Business Performance
D4.3 Evaluation of Business Performance
Abstract
The goal of this deliverable is to present the results of the evaluation of business process performance based on evidence from data collection activities. We have learnt several lessons from this research that can help companies approaching BDA (Big Data and Analytics) to more quickly understand the opportunities and guide tests and implementations. This knowledge has been made available from the DataBench Toolbox and constitutes the basis for the DataBench Handbook (the last deliverable of WP4, D4.4).
An important goal of DataBench is to understand the role played by technical benchmarking and the benefits that can be obtained in BDA projects when technical choices are based on accurate benchmarking. A fundamental lesson that we have learned from the case-study analysis is that BDT (Big Data Technology) projects can deliver important and measurable business benefits. However, we have understood that technical performance can be an enabler of big data benefits and, on the other hand, technical cost can represent a barrier to reap business benefits. We have performed research in this direction to define a methodology for the architectural sizing and cost assessment of an infrastructure supporting BDA use cases. We have then mapped benchmarks on the architectural components and analyzed the impact of software selection of the cost and performance of this architecture, to support the assessment of the potential benefits from an accurate software selection based on technical benchmarking in WP5.
Keywords
Big data, case study analysis, interviews, desk analysis, business impact, business KPIs, technology costs.
Disclaimer
This document reflects the authors view only. The European Commission is not responsible for any use that may be made of the information this document contains.
Copyright Notice
Copyright belongs to the authors of this document. Use of any materials from this document should be referenced and is at the user's own risk.
Deliverable D4.3 Evaluation of Business Performance
Reviewers Todor Ivanov (URFR), Brian Elvesæter (SINTEF)
Table of Contents ............................................................................................................................................................................................. 1
Table of Contents .......................................................................................................................................................... 3
1 Introduction and objectives ........................................................................................................................... 6
2 Final evidence from Databench survey ..................................................................................................... 6
3 Final evidence from the desk analysis ....................................................................................................... 9
3.1 Summary of qualitative results .............................................................................................. 10
3.2 Most frequent use cases from the desk analysis ............................................................... 11
3.3 Evidence on business process performance from the desk analysis .......................... 12
4 Final evidence from the analysis of case studies ................................................................................. 13
4.1 Industries, use cases and approaches to BDT projects ................................................... 14
4.2 Evidence on business process performance from case studies .................................... 19
5 Assessing the business impact of technical benchmarking ............................................................ 26
5.1 Sizing and cost-assessment methodology ........................................................................... 26
5.2 Example: Targeting in the Telecommunications Industry ............................................. 30
5.3 Mapping technologies on architectural blueprints .......................................................... 33
5.4 Mapping benchmarks on technologies ................................................................................ 34
5.5 Using the methodology: technology cost assessment and benefits from technical benchmarking ........................................................................................................................................... 35
Figure 8 – Design and deployment process of markdown optimization software……...………22
Figure 9 – Data preparation for yield prediction……………………………………………………….…….23
Figure 10 – Digital twin, example (source: Whirlpool)…………………………………………………….24
Figure 11 – New smart manufacturing services (data sharing and model centralization…...25
Figure 12 – An overview of the sizing and cost-assessment methodology………………………...26
Figure 13 – Integrated architectural blueprint for BDA…………………………………………………...28
Figure 14 – Designing a targeting architecture based on the overall BDA blueprint…………..29
Executive summary
The goal of this deliverable is to present the results of the evaluation of business process performance based on evidence from data collection activities. In DataBench, we have collected a vast amount of information with different and complementary data collection activities: a large-scale survey, a desk analysis, and a case study analysis.
We have learnt several lessons from this research that can help companies approaching BDA to more quickly understand the opportunities and guide tests and implementations. This knowledge has been made available from the DataBench Toolbox and constitutes the basis for the DataBench Handbook (the last deliverable of WP4).
An important goal of DataBench is to understand the role played by technical benchmarking and the benefits that can be obtained in BDA projects when technical choices are based on accurate benchmarking. A fundamental lesson that we have learned from the case-study analysis is that BDT projects can deliver important and measurable business benefits. However, we have understood that technical performance can be an enabler of big data benefits and, on the other hand, technical cost can represent a barrier to reap business benefits. We have performed research in this direction to define a methodology for the architectural sizing and cost assessment of an infrastructure supporting BDA use cases. We have then mapped benchmarks on the architectural components and analyzed the impact of software selection of the cost and performance of this architecture, to support the assessment of the potential benefits from an accurate software selection based on technical benchmarking in WP5.
1 Introduction and objectives
The goal of this deliverable is to present the results of the evaluation of business process performance based on evidence from data collection activities. In DataBench, we have collected a vast amount of information with different and complementary data collection activities:
- A large-scale survey has been conducted in WP2, which included both business and technical questions and has been used in WP4 as a reference to focus the following data collection activities.
- A desk analysis, surveying all use cases published in the academic literature, EU project deliverables and vendor Web sites and white papers.
- A case study analysis, to perform an in-depth analysis of the BDT pilots and implementations in selected companies and gains insights useful to explain the trends observed with large scale surveys.
We have learnt several lessons from this research that can help companies approaching BDA to more quickly understand the opportunities and guide tests and implementations. This knowledge has been made available from the DataBench Toolbox and constitutes the basis for the DataBench Handbook (the last deliverable of WP4, D4.4).
An important goal of DataBench is to understand the role played by technical benchmarking and the benefits that can be obtained in BDA projects when technical choices are based on accurate benchmarking. A fundamental lesson that we have learned from the case-study analysis is that BDT projects can deliver important and measurable business benefits. However, we have understood that technical performance can be an enabler of big data benefits and, on the other hand, technical cost can represent a barrier to reap business benefits. We have performed research in this direction to define a methodology for the architectural sizing and cost assessment of an infrastructure supporting BDA use cases. We have then mapped benchmarks on the architectural components and analyzed the impact of software selection of the cost and performance of this architecture, to finally gauge the potential benefits from an accurate software selection based on technical benchmarking.
In this deliverable, we present the results of these research activities, starting from a brief presentation of some additional analyses that have been performed on the data from the DataBench survey and ending with architectural considerations on the role played by technical benchmarking.
2 Final evidence from DataBench survey
The data collected with the DataBench survey (WP2) have been thoroughly analyzed with different techniques (e.g. clustering, statistics). Most of the results from these analyses have been presented in D4.2 at M18. After M18, we have involved all DataBench team members in a research effort aimed at positioning DataBench in the scientific literature on the business benefits of IT applications. We have used the data collected with the DataBench survey to measure the direct impact of technical choices on perceived business benefits measured through interviews, based on hypothesis testing. Results have been summarized in a paper that has been submitted to the International Journal of Business Information Systems and is under review. The paper that has been submitted is available from the DataBench repository1. Here, we provide a short summary of the paper.
The paper puts forward the following 5 research hypotheses:
• (H1) Companies that have implemented analytics with a descriptive approach to data processing have obtained greater business benefits compared to companies that have not implemented analytics.
• (H2) Companies that have implemented analytics with a predictive approach to data processing have obtained greater business benefits compared to companies that have implemented analytics with a descriptive approach.
• (H3) Companies that have implemented analytics with a prescriptive approach to data processing have obtained greater business benefits compared to companies that have implemented analytics with a descriptive or predictive approach.
• (H4) Companies that have real-time access to their data have obtained greater business benefits compared to companies that do not have real-time access to their data.
• (H5) Companies that have integrated big data and analytics with their business processes have obtained greater business benefits compared to companies that have not integrated big data and analytics with their business processes.
Variables have been operationalized and then measured based on responses to the Databench questionnaire. A linear regression has been performed to study the hypotheses. A linear relationship has been assumed between dependent and explanatory variables, as follows:
Business Benefits = c1·Descriptive + c2·Predictive + c3·Prescriptive + c4·Real Time + c5·Integration + c6·Size
Table 1 reports the results of the model. The coefficients for the variables included in each model are reported as rows. Each row is identified by the name of the corresponding variable.
Residuals:
Table 1 – Parameter estimates, p-values, and goodness of fit statistics for fitted regression model including the independent effects of descriptive, predictive and prescriptive analytics, integration of analytics with business processes, real-time availability of information and company size on business benefits.
Empirical testing supports the use of descriptive analytics, the integration with business, the ability to access data in real time and company size as factors correlated with business benefits from big data and analytics (BDA). In contrast, the use of predictive and prescriptive analytics is not supported as drivers of business benefits. These results do not confirm the progression from descriptive to predictive analytics as a source of greater business benefits. However, they support the idea that the actual availability of data in real-time is important even for companies that limit their efforts to descriptive analytics. In turn, this seems to confirm the change in the approach to business intelligence (BI), shifting from batch reporting to real-time decision making [1]. In this process of change, the integration with business processes plays an important role as driver of the business benefits that can be achieved.
In our model, the variables that have been found not to be significant, that is predictive and prescriptive analytics, have a high p-value, in both cases above 0.5. This high p-value does not allow us to reject the null hypothesis and does not support these variables as drivers of business benefits.
The other variables are instead strongly significant. The coefficients of significant variables are comparable, suggesting that these variables have a similar weight in explaining the dependent variable, with no single predominant independent variable. This includes company size, which is found to contribute to explaining business benefits with an impact comparable with that of other significant explanatory variables. In this respect, the only exception is the intercept which is considerably high (0.41, with all variables normalized between 0 and 1). A high intercept indicates that benefits are perceived as high, irrespective of other organizational or technical discriminating variables. This suggests a general optimism towards the benefits from big data and analytics, which seems consistent with the positive orientation of the professional literature [2].
Predictive and prescriptive analytics have been found not to be significant drivers of perceived business benefits (our second and third hypotheses are not supported). This finding has multiple possible interpretations:
1) A more direct interpretation is that companies do not perceive that additional benefits are associated with predictive and prescriptive analytics. This would mean that companies do not think that they can obtain benefits from the full automation of decision making. In fact, they believe that supporting human-made decisions with better, real-time information provides all possible benefits.
2) This finding could also be explained by considering that the changes involved in the usage of big data and analytics are significant and companies are only at the beginning of a long-term change process. Predictive and prescriptive analytics will be experimented in the future. From this perspective, additional benefits from predictive and prescriptive analytics are not excluded, but do not represent a current goal.
Overall, the hypothesized growth of business benefits from descriptive to prescriptive analytics is currently not supported, but might be supported in the future. Repeating our survey in the future may lead to different findings.
From a technical standpoint, the fact that real-time availability of data is found to be a driver of business benefits points to new challenges that will emerge in the next years. Through big data and analytics, modern BI seems to deliver benefits by providing information to decision makers in real time. This means that their goal is not limited to controlling the outcome of their decisions, but it includes making decisions based on evidence. This approach to decision making is indeed generally perceived as a source of business benefits.
However, the real-time availability of data involves several technical challenges. First, data should be stored in real-time when they are created, raising organizational challenges. Second, accessing and processing large quantities of data in real time can be technically challenging.
A future challenge for IT managers is to make their infrastructure fast. Response time, latency and throughput seem to represent important indicators of IT quality and key to deliver business benefits. However, the combination of a high level of detail of information with real-time requirements represents a technical challenge. This challenge is more difficult to overcome if decision making is frequent and the hierarchical level where decisions are made is lower. If the hierarchical level is operational and decisions are frequent, processing becomes particularly intense and data sets are potentially very large, with a need for an outcome in real-time. This could represent a factor contributing to the big data problem [3].
There is a tight relationship between the availability of data in real-time and the integration of analytics with business processes. The integration with business processes has been found to be perceived as an important driver of business benefits, showing that managers are aware of the need for an organizational change that enables positive returns from big data and analytics initiatives.
Company size has been found to be a significant driver of business benefits. We have put forward the corresponding hypothesis by tying benefits to the availability of a larger amount of historical data in larger companies. Given that the value of analytics lies inside data, the greater the amount of data the higher the business benefits. An alternative interpretation is that larger companies have easier access to scale economies related to the implementation of the new technologies needed to manage big data. In both cases, data represent an asset and larger companies seem to perceive to have an edge in reaping benefits while smaller companies are more cautiously optimistic. It should be noted that in both cases benefits should be objectively measured to confirm perceptions.
3 Final evidence from the desk analysis
In the scope of the DataBench project, we have collected more than 700 articles, gathered from three main types of sources:
• the scientific literature,
• European research projects (including ICT 14-15 projects),
• customer success stories of the most important BDT providers.
Each of these articles was tagged with different metadata, e.g., the magnitude of data size, the velocity, the type of sources. These metadata have been thoroughly discussed in D4.2 and are reported here in Figures 2 and 3, for the sake of clarity.
Figure 1 – Business dimensions (tags) of the desk analysis (see D4.2).
Business KPI
• Cost reduction
• Time efficiency• Product/service quality• Revenue and profit
Figure 2 – Technical dimensions (tags) of the desk analysis (see D4.2).
The desk analysis has been continuously updated throughout the project. A complete list of references, tagged according to the dimensions reported in Figures 1 and 2 is available from the DataBench document repository1, file “desk_analysis.xls). It includes a total of 711 use cases (110 additional use cases since M18).
3.1 Summary of qualitative results
The sources of information of the desk analysis are focused on research (academic literature and European projects) and innovation (case studies from BDT providers). Comparing data from the survey with data from the desk analysis provides mainstream vs. innovation insights. We have made this comparative analysis in D4.2. Here, we summarize the main results for the sake of clarity. In summarizing this comparative analysis, our focus is on the technical variables that characterize BDT projects, as a fundamental goal of this work package is to understand the business benefits from technical benchmarking.
The main insights that have emerged from the DataBench survey (WP2) can be summarized as follows:
• Companies mainly analyze and store gigabytes and terabytes of data, while a small number of companies (less than 10%) deal with petabytes and exabytes.
• Tables and structured data seem to play a prominent role, followed by structured-text and graph data.
• Currently, descriptive and diagnostic analytics are the most popular types of analytics among European companies.
• The batch processing approach is most common, and only 16% of companies are pioneering the management and exploitation of real-time data.
• In the future, companies are planning to move to prescriptive and predictive analytics.
• There is an emerging need to integrate heterogenous data to effectively exploit all the information gathered by companies.
• The most adopted technical performance metric is data quality.
Overall, the survey indicates that companies are still in the early phases of their BDT innovation process, focusing on the more traditional aspects of analytics. Sivarajah et al. [4] have defined a taxonomy of big data usage, making a general distinction among descriptive, predictive and prescriptive analytics. Descriptive analytics aims at scrutinizing data and information in order to define the current state of a business situation. So, developments, patterns and exceptions are highlighted by producing standard regulations, ad hoc reports, and alerts [5]. Predictive analytics consists in statistical modelling and forecasting, in order to determine future trends of variables relevant to a particular process [6]. Prescriptive analytics is about the optimization of processes and related continuous improvement of
Data size
• Gigabytes• Terabytes• Petabytes• Exabytes
Data type
• Tables and structured data
• Graph and linked data
• Geospatial and temporal data (including time series and IoT data)
• Media (image, audio or video)
• Text and semi-structured data (XML, genomic data, etc.)
performance KPIs [7, 5]. This taxonomy of big data usage has become extremely popular, particularly in the professional literature [8]. From the DataBench survey, companies seem to be mostly focused on descriptive analytics, which represents the first step of their BDA innovation journey.
The main insights from the desk analysis show a different picture:
• Use cases from the desk analysis mainly deal with terabytes of data.
• Most use cases are mainly processing data in streaming, as well as iterative/in-memory processing.
• The most widely used analytics type is by far predictive analytics, while prescriptive, descriptive and diagnostic analytics are adopted in approximately the 30% of use cases.
• The most widely adopted performance metric seems to be the throughput.
• Data types are primarily tables and structured data, including structured legacy data, graph and linked data and text and semi-structured data.
• Use cases store and process highly heterogenous data, thus stressing the growing need and potential for data integration.
It should be noted that these insights are confirmed even with the 110 additional use cases collected as part of WP4 since M18. Consistent with the taxonomy defined in [4], the insights from innovation-oriented sources indicate a shift of focus towards the predictive and prescriptive steps of the BDA innovation journey, with a prevalence of use cases focusing on predictive analytics. This indicates that the automation of decision making involved by prescriptive analytics is positioned further down the innovation timeline for the majority of the companies, although it general associated with the highest potential business benefits.
Only a few contributions from the desk analysis (roughly 25%) provide a quantitative evaluation of business KPIs for their use cases. The evaluations that are provided are diverse, but in most cases business benefits are provided as a percent change with respect to a baseline that is usually not quantified. We have noted that the business KPIs selected to provide these evaluations of benefits vary with the use case and with the industry (consistent with WP2). Consequently, to provide benchmarks of business KPIs from the desk analysis we have first identified the most frequent use cases in different industries (Section 3.2) and then evaluated the mean value of the most frequently used business KPIs for different use cases in different industries (Section 3.3).
3.2 Most frequent use cases from the desk analysis
As a first step, we have grouped the contributions from the literature and related use cases by industry. We have found that nine industries are represented: agriculture, automotive, financial services, healthcare, manufacturing, retail, telecommunications, transport & logistics, and utilities. The distribution of use cases (articles) by industry is shown in Figure 3.
Figure 3 – Distribution of use cases (articles) across industries (results from desk analysis).
We noticed that, while the scientific articles and European projects range evenly across the 9 industries and related use-cases, the customer stories coming from cloud companies and IT solution providers are a little biased towards financial services. Table 2 shows the 3 most frequent types of use cases for each of the 9 industries. Overall, we have identified 23 distinct use cases, instead of 27, as a few types of use cases are common to multiple industries (namely, targeting, churn prediction & promotions, network capacity optimization). The most common use cases account for over 70% of the total number of use cases documented in the desk analysis (502 out of 711).
Table 2 – Number of use-case occurrences (total=502) per industry (results from desk analysis).
3.3 Evidence on business process performance from the desk analysis
As noted, in the literature, business KPIs are most often selected and explained (what should be measured), but rarely assessed. The few quantitative results are reported in Table 3. It can be noted that they represent highly optimistic results compared to results from the DataBench survey (WP2), where business KPIs are in the 4-8% range. This can be explained partly from a bias in the sources of information that include many use cases from BDT providers. Another explanation is that they are estimates from pilots which may result into lower benefits at deployment time, due to a variety of operational hurdles. In addition to this, the variance in the evaluation of benefits for the same use case is broad and the significance is further limited by the fact that the subset of use cases is really small compared to the overall sample (roughly 25%). This points to a need for more in-depth analyses. In DataBench, we have taken a step in this direction with the analysis of case studies (see Section 4).
The added value of the desk analysis lies in the vast survey of the literature which can represent a reference for both scientists and practitioners, and has been made available to the users of the Toolbox.
The desk analysis is particularly useful for one group of users of the Toolbox, namely researchers who can extract use cases (and related articles) classified according to different dimensions, including case study (according to the classification in WP1), industry, volumes of data, technical and business KPIs. These aspects are discussed in WP3’s deliverables.
Table 3 – Evaluation of business KPIs from the desk analysis.
4 Final evidence from the analysis of case studies
In D4.1 and D4.2 we have defined a methodology for the analysis of case studies that is reported in Figure 4. The depth of the analysis depends on the case study, on the outcome of the first interview and on the openness to discussion and cooperation of the different companies. Case studies involve a considerable effort and, as a consequence, the goal is not to reach statistical significance and generality per se, but to provide qualitative, insightful explanations to findings from extensive surveys (such as the DataBench survey and the desk analysis) as well as indications for subsequent research. In DataBench, the case studies described in the next sections have provided interesting explanations for the results of previous extensive research and have indicated interesting research paths that we have followed. Results of the additional research that we have conducted as a consequence of the evidence from case studies are discussed in Section 5.
Figure 4 – DataBench methdology for the analysis of case studies (D4.1 and D4.2).
For the sake of clarity, we report a summary of the interview template in Figure 5. The extended version of the interview template can be found in D4.2. The transcripts of interviews (where we had consent from the interviewees) can be found in the DataBench document repository1.
Figure 5 – Summary of the interview template for the analysis of case studies (see D4.2).
4.1 Industries, use cases and approaches to BDT projects
We have performed a total of 22 case studies distributed across 8 industries and 7 countries. Figure 6 shows the companies that have participated in the DataBench case-study analysis. All companies have gone through the first interview, 15 have provided documentation, 9 have accepted to perform a second interview and 6 have provided data and involved the DataBench team to be supported in their decision processes. Not all companies have consented to disclosing the information that they have shared, 3 have requested to remain anonymous (their name does not appear in Figure 6).
Figure 6 – Case studies (22 case studies across 8 industries).
We summarize the more general lessons learned from the case studies in the following. The evidence provided by the case studies on business process performance is discussed in the next section.
A new approach to business intelligence and decision making
The progression from descriptive to predictive and prescriptive analytics is seen as an innovation path leading companies towards the full exploitation of the opportunities created by new big data technologies. With descriptive analytics, technology is used to bring the right information to decision makers at all levels in the organizational hierarchy and decisions are then made by humans. With predictive analytics, the information on past decisions and their outcome is used to predict the future outcome of current decisions. Still, predictive analytics are used to help human decision-makers to better understand the consequences of their decisions. Predictive analytics also enable greater awareness of the business impact of decisions and push decision makers along the learning path leading them to make evidence-based decisions. With prescriptive analytics, decision-making can be delegated to machines whenever machines are recognized to have better performance and obtain greater business benefits. Decisions supported by an accurate prediction are usually better than decisions supported by descriptive statistics only. For example, descriptive statistics may show future sales as a trendline, while predictive models can be multi-variate, possibly non-linear and capable of recognizing more complex relationships among variables to reach a better prediction. Clearly, descriptive statistics are better than mere opinions, since they provide the quantitative evidence that is key to starting on the big data and analytics learning curve. In summary, the three approaches are considered to add to business benefits, increasingly.
While traditional BI was aimed at collecting, aggregating and presenting information, BDA’s ultimate goal is the automation of decisions making. This is seen both as an opportunity and as a threat. Managers are used to the automation of manual work, for example through robotization, but they are skeptical about the superiority of machines at making decisions and they are certainly not used to the idea of automating managerial work.
High awareness for opportunities
All companies believe that BDA can provide benefits and have pointed to decision-making inefficiencies where BDA could help. During the interviews, we have learnt about interesting practical ideas on how different use cases could be implemented, on the key decisions that should be addressed and on how to redesign decision processes. In this respect, there has been significant interest in learning about the most frequent use cases in different industries and in taking part in the DataBench survey to obtain benchmarks for their industry.
As an example, the CEO of a fashion retailer has pointed to “markdown” decisions as key determinants of revenues and margins in the fashion industry. He believes that “human decisions on a large assortment are sub-optimal and the company could save millions in discounts and sell more by making better decisions.” Promotions represent one of the most frequent use cases from our desk analysis and this case study has confirmed that promotion optimization is a priority with high perceived benefits. However, the execution of this vision is far from clear. The CEO of the fashion retailer has stated that the best-case scenario for the company is to buy an off-the-shelf markdown optimization tool, but, unfortunately, they could not find a suitable tool from the market. Their options seem to be either to buy general-purpose consulting services to implement their own optimization algorithms or to buy optimization services (not tools) with a pricing based on revenue sharing. However, providers are not willing to share risks with the fashion retailer by committing to measurable business KPIs.
Data are the starting point
Irrespective of supplier issues, end-user companies own the data, not suppliers, and they believe that preparing their data for subsequent analyses is important and can be a good starting point. It is generally believed that it is possible and beneficial to work on the data and on the related technology infrastructure without a specific application target. From a technical standpoint, data- and processing- intensive analytics require a dedicated database, with its own hardware, data management technologies and data design. Setting up this infrastructure requires time and a significant investment, but represents an enabler of subsequent application-level implementations.
An incremental approach is rare. Companies have accepted the idea that they have to make an initial investment, choose a technology stack and create a so called “data lake” to store all their data. For example, PAM, a retailer, has launched a data-lake project in 2015 with the goal of storing all data in the data lake with a common time stamp. This has involved significant organizational changes, as they had to design data governance processes and sensitize employees towards the importance of keeping their data up-to-date. Many interesting BDA ideas would not be feasible without a certain level of data quality. When data quality is low, human decisions makers can gather information by making a phone call or by involving other colleagues, but algorithms do not have this option and require diligent data governance to work properly. While working on data governance, PAM has unveiled several other issues, in some cases old, unresolved problems that have been ignored in the past and are now preventing innovation. In this respect, business benefits from BDA do not seem to be low-hanging fruits, but rather the outcome of a change process that starts from the data.
Data quality is a concern
Data quality is a general concern. It should be noted that when interviewees use the term “data quality” they can refer to very different aspects of quality, depending on the context. Quality could mean level of detail, correctness, completeness, consistency or even availability. For example, some use cases, such as predictive maintenance in manufacturing or risk assessment in financial services, require data sharing across companies and cannot be implemented unless companies share data with each other. Data sharing is not always easy to achieve, especially when the use case requires a critical mass of data to be interesting or feasible, and cannot be approached incrementally.
However, we have found that data quality is also an excuse to postpone critical BDA initiatives. If quality is assessed in absolute terms, without a reference to a specific use case, companies may identify quality issues and start working on them even if data are already good enough to start reaping the benefits of certain use cases. For example, issues with stock data in retail are pervasive, but sales predictions can be “good enough” even with errors in stock as long as the error rate is below a certain level. In one of our case studies, the management had to run a pilot to demonstrate this and convince their IT staff that they could stop working on quality and start using the data.
Data governance is a concern
Data governance is another common concern. Similar to quality, governance represents a general concept, with organizational, technical and legal implications. First of all, governance includes data security. Similar to quality, security is a relative concept and, the words of an IT manager in a hospital: “security is impossible to guarantee in all conditions. However, privacy is a must and there’s no privacy without security.” This tight relationship between privacy and security can be an obstacle to innovation, but also an opportunity for technical innovation. We have found that many companies work under the assumption that private data cannot be shared and, as a consequence, they make an effort to verify that data are not private. For example, they set incentives that customers can obtain only if they explicitly agree to share their data. We have found that this represents an effective strategy, as most customers (and, particularly, the most active customers) accept to share their data.
Clearly, companies also set a number of conditions and limitations under which data can be shared, that are typically context-dependent. Technical innovation can help meet these conditions for a broader set of use cases. For example, in our interview with FILL, we have learnt that homomorphic encryption can be used to share encrypted data and run machine learning algorithms on encrypted data, without a need to decrypt them. The application of homomorphic encryption, which is currently a hot innovation area, can enable use cases that require data sharing across companies to reach a critical mass of data for algorithms to be effectively trained.
Only a few projects reach deployment stage
We have found that most case studies are at pilot/POC stage, while very few projects reach deployment stage. This is consistent with the findings from the DataBench survey (WP2), where the change process associated with BDTs has been observed to be in the early stages. With the case-study analysis, we have taken a step forward to provide an explanation for this cautious and slow progress with BDT deployment.
First of all, the pilots and POCs that we have analyzed show how machines can be better than humans at making decisions. This is typically the case when decisions involve large amounts of data that are practically impossible to process manually. For example, in retail the assortment is so vast that evaluating the performance of each individual item in different geographical regions is practically impossible without the aid of an evaluation algorithm. We have also observed how the algorithm should be intelligent enough to make the decision, as opposed to preparing the data and leaving the decision to a manager. Preparing the data is certainly complex, but the decision is complex too, it is multi-variate, it should optimize a basket of items as opposed to individual items, it should consider the impact of decisions on business KPIs and learn from the outcome of past decisions. While an algorithm can be designed to make complex decisions, a human decision maker has bounded rationality and will simplify decisions, leaving some money on the floor.
Lack of business benefits from BDTs does not seem to be the reason why companies are hesitant to extend the deployment of their pilots. We have found that their reluctance is due to a combination of technical, human and organizational factors, which are briefly discussed in the following.
Fear of losing decision control
A straightforward reason why companies are slow at embracing BDTs is the fact that managers would be either replaced by algorithms or evaluated with tangible indicators supported by data. Clearly, nobody is happy when their work is automated. However, there is a more subtle reason why managers feel uneasy about the idea of replacing human decision makers with algorithms. Machine learning has to embed a mechanism to assess the outcome of past decisions. This allows algorithms to improve their decisions over time based on a continuous learning cycle. To enable this learning cycle, there is a need for indicators to assess the outcome of decisions. These indicators should be designed to assess the outcome of specific decisions. Ideally, each decision should be equipped with reliable indicators that asses the outcome of that decision only. If an indicator changes as a consequence of more than one decision, it becomes
impossible to know which decision was right/wrong. The impact of poor indicators on the learning capabilities of algorithms is poor decisions.
In some cases, there exist clear indicators of overall business performance, but it is impossible to disentangle decisions from one another and measure the separate effect of different decisions. For example, a retailer may change the assortment and observe and increase in revenues. However, if at the same time that retailer has discounted certain products that are part of that assortment it becomes impossible to assess whether revenue increase is due to promotions or to the changes in the assortment. In one of our case studies, a retailer has run a pilot to demonstrate the effectiveness of assortment optimization algorithms with a “living lab” approach by changing the assortment only and stopping promotions in one of their shops. But what happens when both decisions are made simultaneously? Can algorithms learn anyway? Answering these questions seems to require a leap of faith, extending the pilot out of a general IT-orientation. Some claim that humans and machines may not be that different from each other after all, as they will both have to make sub-optimal decisions.
Lack of flexibility and adaptability of algorithms
Even companies who are willing to embrace change fear that algorithms may not be as flexible as individuals. For example, assessing the performance of a new product may require some vision. A marketing manager told us that she was convinced that items with the word “without” on the packaging were trendy no matter the ingredient that was stated to be missing (sugar, lactose, palm oil etc.). An algorithm designed to make decisions based on quantitative indicators will not be able to recognize this trend and translate it into a systematic change in the assortment. This lack of flexibility can result into a loss for the company and represents a tangible risk that leads managers towards the idea of using machine learning to complement rather than replace human decisions.
A number of other more technical issues can challenge the flexibility of algorithms. For example, algorithms should be able to classify new items automatically based on the item text description or recognize a change in item categories and adapt to this change. Companies cannot afford to slow down or stop operations because an algorithm needs maintenance.
Slow transformation of business requirements into code
Software maintenance is considered slow. Several interviewees have honestly admitted that their company is slow at translating business requirements into code. The service time of their IT function is very long, they are often not responsive, errors in newly released code are very common and, overall, managing ad hoc software development is considered challenging. Some companies look for off-the-shelf tools to avoid coding. They are willing to trade software personalization for deployment speed.
Formalizing and bureaucratizing the process from requirements to code does not seem to help. We have observed that the informal cooperation between IT and business is key to success. Information technology is continuously changing and has not yet reached maturity. Common management practices are very effective with mature technologies, but do not seem to be effective with IT. Programmers can easily become elusive and without a strong technical background it is very difficult for managers to attribute the responsibility of issues to the right people and give credit for good practical ideas. Without cooperation, software development quickly becomes slow and very expensive.
Lack of alignment between technology and strategy
Giving up software personalization and relying on tools can create a mismatch between technology and strategy. This is a well-known traditional issue in the management information systems literature. For BDA, this issue involves specific challenges.
BDA supports managerial decisions which should be consistent with business strategy. For example, companies may focus on specific market segments and their decisions should satisfy clients in those segments. Companies strive to differentiate from each other and gain competitiveness in their target
segments. If the software tools that they adopt for BDA do not support this differentiation, adopting a tool could result in an economic loss, as opposed to positive business benefits. On the other hand, software tools make more money if they are standard and limit personalization (according to well-known industrialization principles) and will strive to limit differentiation, leaving it to ad hoc software developments typically made by third-party companies. If the goal of a company is to avoid software development, they will have to use standard functionalities. With BDA, this may result in a negative impact on business KPIs.
For example, recommendation tools tend to recommend/select the most popular items, which by definition represent the mass market segment. By using these tools, companies that are stronger in niche, possibly richer segments may push their customers towards a mass market behavior and reduce their profitability. This phenomenon has been experienced by an e-commerce operator among our case studies. Admittedly, giving up software development may result into business superficiality.
Lack of entrepreneurship (short-term financial view)
Another common issue is setting the right priorities. Sometimes, the most innovative and promising applications are postponed due to more urgent mission-critical issues, especially in companies owned by funds. A short-term financial view can be detrimental when long-term change is needed. We have observed a general attitude where IT investment is not taken for granted and top management is demanding evidence on the impact of IT investments on business KPIs. This has created a new wave of attention towards the ROI of IT projects and a need for evidence on business benefits.
4.2 Evidence on business process performance from case studies
We have evidence of business KPIs for a subset of our case studies. Overall, evidence from case studies is aligned with results from the DataBench survey and positions business impact in the 4-8% range. Companies that have measured a positive business impact have all developed their own software, focusing on selected use cases with a practical approach. They had a clear view of the business issues to be tackled and of the potential benefits of advanced analytics techniques. Some of them are currently working on the large-scale deployment of their pilots, others have already reached full-scale deployment.
Intelligent fulfilment (Retail, physical shops)
In physical shops, procurement is a responsibility of shop personnel. In our case study, shop personnel would enter orders every day by manually inspecting the shelves and placing an order of a fixed quantity (a “lot”) for the products that were found to have a few items left. For products that are part of a promotional initiative, orders are performed by the shop manager ahead of time (when the promotion is announced) based on the sales of past similar promotions. Usually, managers end up overstocking and then deal with the issue of unsold items by extending the promotion or applying a larger discount towards the end of the promotional period.
This manual fulfilment process is not considered perfect, as it generates numerous out of stocks that go unnoticed due to manual errors or lack of precision in positioning products on the shelves. Automated or semi-automated fulfilment could reduce these issues, especially if it embeds a good algorithm to predict future sales and anticipate possible out of stocks. However, a prediction algorithm requires information on sales and on stock levels. The company has identified a number of issues on the stock data:
• Negative stock
• Sold quantities greater than stock availability
• Stock record does not change according to sales
• Delivery without corresponding order (and vice versa)
• Unjustified stock increment
The company has placed the project on hold due to these quality issues, hoping to be able to work on the organizational processes to improve the quality of the stock data. As noted before, this has not been possible, due to the nature of some of the stock errors. For example, thefts and damages are not accounted for as sales and cause a delta between stock and sales data. While a shop employee can physically see a missing product, an algorithm has to rely on data. The company has opted for the definition and application of a set of corrective procedures to improve the quality of stock data. A specific corrective action has been defined for each data issue identified in the preliminary analysis of the data.
The following KPIs have been considered to measure the performance of the intelligent fulfilment procedure:
• mean value of the stock
• number of stockout days
• number of order placements
• mean time between order placements
• impact of lost sales on revenue and margin
The mean value of stock and the number of orders are slightly reduced by the automated procedure. The total number of stockouts has been reduced by 27%, creating a corresponding sale opportunity that can reduce lost sales by 25% and lost margins by 30%. This has an estimated impact of the overall margins of the shop of roughly 5%.
Recommendation system (Retail, eCommerce)
The basic idea of the retailer that we have interviewed is to use recommendations to increase margins by applying an up-sell and cross-sell business logic. Figure 7 shows an example of up-sell. Up-selling means selling a product with a price or margin greater that the price or margin of the product habitually purchased by a customer. If recommendations are personalized to the level of the individual customer, up-selling is not in contrast with customer satisfaction, as it can be fine-tuned avoiding products that would stretch the willingness to spend of customers.
Figure 7 – Up-sell, example.
The mechanisms to build sound and complete recommendation tables based on this simple idea are rather complex. For example, customers are first clustered to identify their preferences and focus recommendations on their hot spots. Clustering is performed automatically based on machine learning (k-means clustering algorithm) and is repeated periodically to accommodate for seasonality and other changes in customer preferences. As shown in Figure 7, the key information is in the triples customer-habitual product-recommended product. The size of a recommendation table is therefore large, as it grows as the product between number of customers and number of items.
Other mechanisms are also implemented by the recommendation system, such as cross-sell. Different types of up-sell and cross-sell are considered and mixed by focusing on the customer’s segment, or on other segments, depending on the product category. For example, the segment “nerd” would be considered for recommendations of electronic products even for customers who are not nerds.
This business logic has been reported to be processing intensive and require a significant amount of processing capacity. Due to internal scalability issues, the company has deployed the system in cloud, after a long negotiation process on data security and privacy issues. The company has observed a 3-4% impact of the recommendation system on the overall margins of their e-commerce. However, they have indicated cloud costs as a potential concern, as their order of magnitude is too close to that of business benefits. This has raised issues on the opportunity to extend recommendations to the physical shop experience.
Markdown (Fashion, physical shops)
Markdown refers to specific points in time when companies apply discounts and applies to businesses where discounts are not always present. Fashion companies have several markdown events, which are key to the overall volumes and profitability of the business. For example, seasonal discounts and “black Fridays” are markdown events.
Our interviewees have noted how markdown events are associated with a corresponding cost (called markdown cost or promotional investment), which represents the amount of money that the company gives up by discounting products instead of selling them full price. This reduces unit margin, but increases revenue. Clearly, the company makes more money if revenues can be increased with a lower markdown cost. Even a small percent reduction of markdown cost can add up to a large amount of money saved. This makes the application of BDA techniques particularly interesting.
The company that we have interviewed had run a markdown optimization pilot. They have explained how the idea that they have tested with the pilot is that discounts should be decided based on several variables, including sales, stock levels, product age, seasonality, and, dynamically, the price elasticity that customers demonstrate when the product is discounted. They studied the impact of progressive discounts that start low and are increased based on sales growth. They realized that progressive discounts can reduce the promotional investment, with a positive impact on the overall margin of the company close to 5%.
The innovation process envisioned by the company to move from pilot to deployment stage is reported in Figure 8. The main challenges in stepping through this innovation process are the variety of the company’s production assortment accompanied by a lack of information on the fashion-related characteristics of products. An item sells a lot or a little due to a number of possible design details that are typically not coded in the company’s operational database. This can limit the generalizability of pilot results to the items that have sufficient descriptive information and indicates a need for initiatives aimed at improving the knowledge base. In addition to this, several analyses have to be performed to fine tune the design of the application logic of the markdown optimization system, including:
• customer/cart segmentation,
• assessment of as-is markdown performance,
• separate analysis of fashion and permanent products,
• comparison of cluster-level and product-level markdown approaches,
• evaluate markdown efficiency for different product age ranges (year of purchase),
• evaluate markdown optimization based on product elasticity,
• evaluate markdown optimization techniques based on balancing techniques (by geographical zone, product category and customer segment).
Figure 8 – Design and deployment process of markdown optimization software.
Yield prediction (Agriculture)
In our case study, yield prediction was based on satellite data, with a focus on Sentinel and Landsat data. Satellites take snapshots as they orbit around the earth, providing a new snapshot of every time they fly on top of a given area. Snapshots are characterized by a definition, that is the size of the pixel in the snapshot (measured in meters), which depends on the technology of the satellite and the altitude of the orbit. For example, the pixel size of the snapshots taken by Sentinel is 30x30 square meters, while Landsat’s is 250x250 meters. Snapshots can be organized as time series, as the position of pixels is fixed.
A pixel of a snapshot taken in the middle of a corn field changes color over time, going from brown when the field is freshly ploughed to different shades of green as corn is growing up, to hay yellow when corn is dry and ready to be reaped. By analyzing these colors, it is possible to gather information on the growth stage of corn, on its health status based on the shade of green, on growth speed etc. All this information can be used to predict the extent of corn cultivation and the yield that will be provided.
An important application of these predictions is stock trading. For example, stock prices vary with the quantity and quality of corn yield and having an early estimate of yield can result in a significant change in investment strategy and, ultimately, in greater profits from trading. In this use case, an important KPI of predictions is precision, as a large error may invalidate investment strategy and cause economic losses instead of gains. Designing a prediction algorithm that can increase precision has a tangible economic value.
The company that we have interviewed has designed and tested an algorithm that combines multiple prediction approaches to extract the most accurate yield estimates with a 10% growth in precision compared to the average market. This greater precision translates into a +0.3% profit increase from stock trading. The company considers the algorithm an asset that can enable new services.
Figure 9 – Data preparation for yield prediction.
Despite the importance of prediction algorithms, data preparation and, more generally, data management represents a critical activity in this use case and a potential threat to innovation in subsequent project phases. Figure 9 shows the data preparation process, including data cleaning, integration and final formatting. Satellite data represent images (snapshots of the earth) and longitudinal data are needed to support yield prediction. Sentinel produces 1 Pbyte/year and a sequence of data points would add up to several petabytes.
There are ways to reduce data size by focusing on a specific geographical region or on a limited set of different crops. However, managing large dataset is expensive. For example, storing 1 Pbyte on AWS costs roughly 400 Keuro/year. Given that storage is relatively inexpensive compared to processing, scaling up a yield prediction system requires careful financial planning.
Rail quality of service (Transports)
This case study has been conducted in the context of the H2020 project “TransformingTransport.” The overall goal of TransformingTransport (TT) is to demonstrate in a measurable way the transformations that big data can bring to the logistic and mobility market. TT has several pilots in different pilot domains. Our case analysis has focused on rail Infrastructure. The use case is a bi-modal terminal, where logistic efficiency could be significantly increased by applying advanced analytics, including the predictive maintenance of railway assets. The KPIs of this use case are not only economic, including greater safety, reliability and capacity. However, cost efficiency is also an important KPI that has been assessed to demonstrate the short-term economic impact of BDTs.
The pilot has demonstrated the use of big data solutions for the proactive management of bi-modal terminal operations as well as for predictive maintenance of terminal equipment during terminal operations of ports. The port has a multitude of roads, tracks and water ways that serve as entry and exit points for containers to and from the actual terminals and ports.
The terminal is connected to the public train system and operations have to stick to the time schedule of trains. The loading of containers needs to be completed on time. The port is currently managed in a reactive mode, by reacting to problems as opposed to anticipating and avoiding them. With predictive analytics, the goal is to shift port management to a proactive approach. Two issues have emerged at pilot stage and both should be seen as opportunities in terms of potential efficiency gains:
• Issue #1 – There is a decision approach (habit) problem. Operators make decisions based on facts, such as a description of a problem that has already occurred and needs to be solved. Predictions are not taken as a basis for decisions. Enhancing predictions with reliability estimates is important to favor trust and help change.
• Issue #2 – The port has very little space to store the containers. So, throughput should be maximized and can only be increased by becoming more efficient and productive. Given that capacity is limited, efficiency is the only solution.
Both issues represent opportunities from the point of view of BDT application. The first issue indicates that decisions can be improved, with consequent economic benefits. The second issue shows how BDA is the only viable approach to reap those economic benefits. In TT, researchers were able to measure efficiency improvement and cost savings have been assessed as 5%.
Production quality (Manufacturing)
We have interviewed several manufacturing companies and production quality is a common concern, as it represents a source of significant costs as well as a driver of customer satisfaction. As production processes and products themselves are equipped with sensors, companies can collect large amounts of data to support their quality control processes. To understand these data, companies need models of their production machines, processes and products. These models have been a focus of research over the past years and have become more and more accurate in representing their physical counterpart, to the point that they are now called digital twins (see Figure 10).
Designing digital twins has been an effort and exploiting them to increase production quality is an important next step. Current quality control is based on measuring key indicators during stress tests and verify the values of these indicators against critical thresholds. For example, a washing machine is tested with a stress test. If noise reaches above 80 dB during this test, the washing machine fails the quality test and cannot be sold. However, noise is typically a consequence of an internal issue, which is currently not reported as a result of the quality test, even if it is modelled by the digital twin. Companies believe that the inner cause for noise is important, as it would help fixing issues before they surface. Collecting data and discovering the mutual relationships among different measures to improve quality control is a current goal for BDA.
Figure 10 – Digital twin, example (source: Whirlpool).
Simulations with digital twins indicate that production quality could improve by 4-5% with advanced quality control models. However, we have found that companies believe that maintaining a model is time consuming, while machine learning should be able to learn from data and build the model without a need for an analytical representation of the physical object. Models are currently used to cross-check and validate AI, but the goal is to let AI gather new insights over time and adapt to process and product changes without a need for modeling and coding.
Service innovation (Manufacturing)
Digital technologies transform machine tools into intelligent assets. It is possible to observe the production process in real-time and to react to any circumstance during the process, by using real-time problem solving, advanced process control or real-time error corrections. The
OEE (Overall Equipment Effectiveness) = Performance x Availability x Quality
is the most important KPI in the manufacturing industry. To avoid downtime, the prediction of maintenance actions is of utmost importance. Data is collected and analyzed at the customers’ premises and partly also shared with the manufacturer. Data sharing is particularly useful in the context of maintenance forecasting and it is very likely to lead to win-win situations, if implemented properly. If the manufacturer succeeds in obtaining comprehensive machine tool data from its customers, the company can create far better prediction models than any of its customers or a third party could (see Figure 11).
This use case is distributed in the sense that it requires the exchange of encrypted data across organizational boundaries. Machine learning with homomorphically encrypted data seems to have the potential to enable distributed predictive maintenance using sensitive machine tool data and a model not intended for the public. Manufacturers can obtain comprehensive machine tool data from their customers and create several prediction-based services than any of its customers or a third party could with limited data. The insights created are valuable not only for customers, which can reduce breakdowns and downtime, but also for the manufacturer, which can not only provide superior service and increase customer satisfaction, but also use the insights for product development. While business benefits are clear, the economics of cloud services represent a barrier. Data volumes are impressive. As an example, an important market is automotive, harvesting large amounts of data, 16 GB (gigabytes) from 1 machine per day. A year data would roughly equate to 6 TB (terabytes) per machine per year and result into several PB (petabytes) per year from all the operational machines produced by a manufacturer across their customers’ production plants. Simply storing these data in a global public cloud has costs that are in the range of several million euro per year, let alone processing it with advanced analytics techniques. These costs translate into service prices that manufacturers consider too high to be competitive and represent an economic barrier to service innovation. Manufacturers need to rely on a smaller cloud provider to reduce hardware capacity prices and carefully select high-performance basic software that reduces hardware capacity requirements.
Figure 11 – New smart manufacturing services (data sharing and model centralization).
5 Assessing the business impact of technical benchmarking
From the evidence that has been collected so far, an important lesson learnt is that most companies believe that technical benchmarking requires highly specialized skills and a considerable investment. We have found that very few companies have performed an accurate and extensive benchmarking initiative. In this respect, using cloud solutions grants them with an easier access to a broader set of technologies that they can experiment with. On the other hand, companies acknowledge the variety and complexity of technical solutions for big data and envision the following risks:
• The risk of realizing that they have chosen a technology that proves non-scalable over time, either technically or economically.
• The risk of relying on cloud technologies that might create a lock-in and require a considerable redesign of software to be migrated to other cloud technologies.
• The risk of discovering that cloud services are expensive, especially as a consequence of scalability, and that technology costs are higher than business benefits (edge vs. cloud decisions).
From a technical benchmarking perspective, it is important that benchmarking is supported with tools that reduce complexity by guiding users along predefined user journeys towards the identification and execution of benchmarks. Results from previous benchmarking initiatives are also very useful. It is also important to have cost estimates of individual technologies and end-to-end solutions, on premises and in cloud.
To address these issues, we have defined a sizing and cost-assessment methodology that is discussed in the next sections. The methodology is largely supported by the lessons that we have learned based on the research described so far. The goal of the methodology is to address some of the issues described above, obtain a preliminary cost assessment of the BDTs involved in a specific use case and understand the cost benefits of IT benchmarking.
5.1 Sizing and cost-assessment methodology
Let us provide a description of the steps of the sizing and cost assessment procedure, in order to understand the input needed and the output generated at each step. Figure 12 illustrates the complete methodology, highlighting the modelling and data collection processes needed by each step. Then, the output obtained in each phase is passed as input to the following step. At the end of the procedure, we can obtain several results: a sketch of a working architecture, modelled through the blueprints, the data model, the schemas and the size of data handled, an estimation of the total processing time and, finally, the assessment of the infrastructural cloud costs.
Figure 12 – An overview of the sizing and cost-assessment methodology.
The first step is mostly focused on understanding the problem, identifying the most promising use cases and estimating business benefits to define a BDA strategy. DataBench has extensively studied the literature and performed a large-scale survey that have provided:
• A classification of use cases by industry (from WP1 and WP2).
• The identification of the most common use cases (with the desk analysis, see Table 2).
• The definition of benchmarks for business KPIs from BDA, with industry-specific (from the DataBench survey in WP2) and use-case specific (from the case-study analysis in WP4) insights.
All this knowledge supporting the first step of the methodology in Figure 12 has been made available in the Toolbox in the form of knowledge nuggets (WP3).
A company moves on to Step 2 with a focus on a particular use case that they would like to experiment with. To support this step, we have designed architectural blueprints for the 27 most frequent use cases reported in Table 2. The full documentation of these architectural blueprint is open, is currently available on the DataBench document repository and can be obtained upon request. Architectural blueprints are also available in the DataBench Toolbox in the form of knowledge nuggets. These use-case-specific architectural blueprints have been integrated into the overall architectural blueprint shown in Figure 13.
The blueprint is generic, as it indicates the building blocks of a BDA architecture, with no reference to specific technologies. For example, it reports NoSQL technologies, but do not specify any particular NoSQL database such as MongoDB, Cassandra or HBase. Companies can use benchmarks for NoSQL databases to support software selection based on technical performance parameters. If different technologies have a different performance, this software selection can be critical to ensure the overall performance of the architecture and to obtain the best cost/performance ratio. As noted, our goal here is to assess the impact of IT benchmarking on the outcome of software selection and to obtain an evaluation of the benefits of benchmarking.
Different technologies can implement different components of the technology blueprint. Clearly, data- and/or processing-intensive components are critical, as they play a key role in determining the performance, cost and scalability of the overall architecture. Different use cases have different critical components. For example, real-time AI is a critical component of the predictive maintenance use case in manufacturing, while data preparation and data management are critical in the targeting use case. It seems intuitive to assume that the more data- and/or processing-intensive components should be carefully selected based on technical benchmarking. For example, if selected software does not perform
well, the component would likely turn into a bottleneck, or would require additional processing/storage capacity with additional related costs.
Steps 4 and 5 of the methodology are aimed at sizing data and processing requirements for these critical components. This can be done based on each company’s knowledge of their own data and usage processes. For example, a company could estimate the size of the training set of a machine learning algorithm with a pilot project that collects performance metrics by benchmarking different implementations of the selected algorithm. This would lead to an estimate of the total hardware capacity needed for full-scale deployment. If the different implementations of the selected algorithm show significantly different performance, the benchmarking effort could be paid back by consistent hardware savings.
To support steps 4 and 5 we have mapped technologies on blueprint components and benchmarks on technologies. These mappings are described in sections 5.3 and 5.4. Before describing these mapping efforts, we briefly discuss an example to show the application of the methodology in the next section.
Figure 13 – Integrated architectural blueprint for BDA.
5.2 Example: Targeting in the Telecommunications Industry
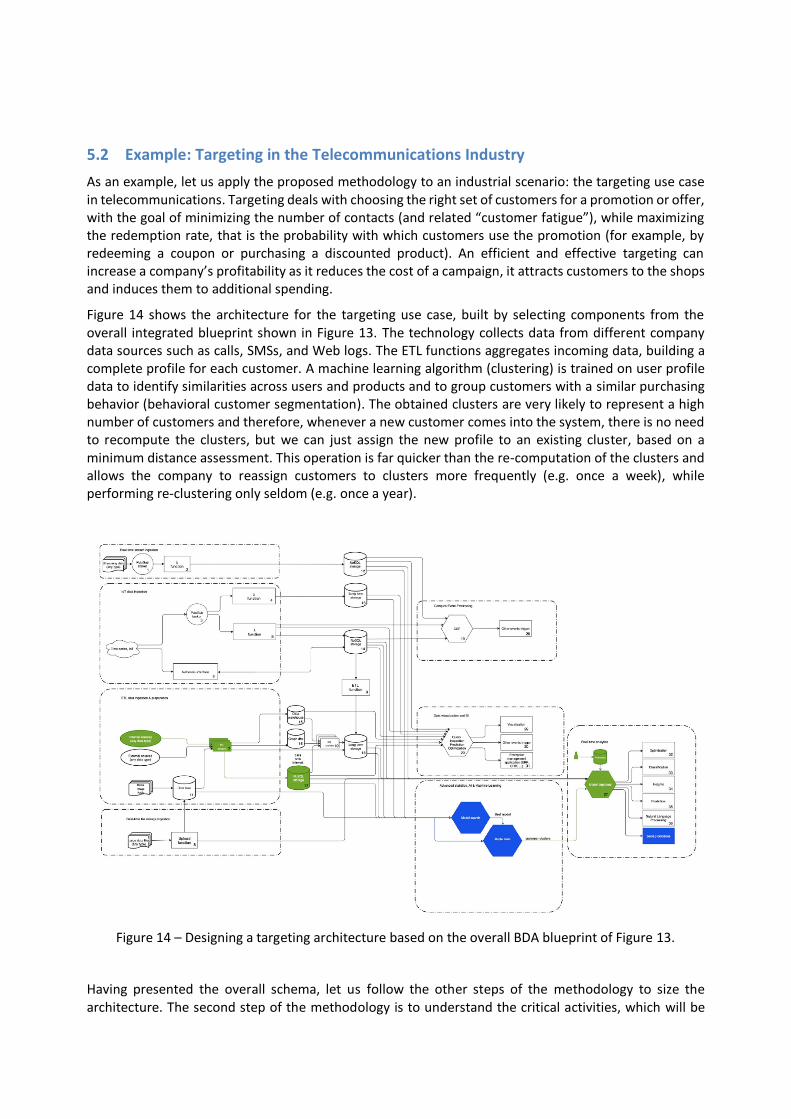
As an example, let us apply the proposed methodology to an industrial scenario: the targeting use case in telecommunications. Targeting deals with choosing the right set of customers for a promotion or offer, with the goal of minimizing the number of contacts (and related “customer fatigue”), while maximizing the redemption rate, that is the probability with which customers use the promotion (for example, by redeeming a coupon or purchasing a discounted product). An efficient and effective targeting can increase a company’s profitability as it reduces the cost of a campaign, it attracts customers to the shops and induces them to additional spending.
Figure 14 shows the architecture for the targeting use case, built by selecting components from the overall integrated blueprint shown in Figure 13. The technology collects data from different company data sources such as calls, SMSs, and Web logs. The ETL functions aggregates incoming data, building a complete profile for each customer. A machine learning algorithm (clustering) is trained on user profile data to identify similarities across users and products and to group customers with a similar purchasing behavior (behavioral customer segmentation). The obtained clusters are very likely to represent a high number of customers and therefore, whenever a new customer comes into the system, there is no need to recompute the clusters, but we can just assign the new profile to an existing cluster, based on a minimum distance assessment. This operation is far quicker than the re-computation of the clusters and allows the company to reassign customers to clusters more frequently (e.g. once a week), while performing re-clustering only seldom (e.g. once a year).
Figure 14 – Designing a targeting architecture based on the overall BDA blueprint of Figure 13.
Having presented the overall schema, let us follow the other steps of the methodology to size the architecture. The second step of the methodology is to understand the critical activities, which will be
the main focus of the architectural sizing, as they are data- and/or processing-intensive. From the architecture in Figure 14, we can clearly distinguish two critical activities: the Extract-Transform-Load function and the clustering function. The ETL functions are designed to execute simple operations, as aggregating daily (or weekly) data for each customer. The problem is the huge amount of data which they have to deal with in a Telecommunication company with millions of customers. For example, counting the minutes spent on call by each customer is a simple sum across the different calls for that customer, but it becomes demanding as the same operation has to be repeated for millions of customers (the size of a medium telco company is 10 million customers).
We have two clustering functions in the targeting use case: the main function, which evaluates, as we already stated, the clusters and calculates the centroids of each cluster based on a machine learning algorithm (e.g. k-means) and the function that assigns the customer to the closest cluster, by evaluating the distance between his/her profile and the various centroids. Let us assume that we use k-means as the clustering algorithm for the first function. A factor that determines the necessary processing capacity is knowing the number of clusters in advance. A technique that can be adopted, in order to overcome this problem, is looking for a number of clusters k that maximizes the inter-cluster difference and minimizes the intra-cluster cohesion. This solution requires to run the k-means algorithm for all the possible values of k or by exploiting previous experience and knowledge, it can be focused on fewer, but more promising values.
However, this procedure can be executed once or a few times in a year, mediating between the high computational requirements of k-means and the accuracy of clusters. In an industry such as telecommunications, clusters are not likely to change over a short period of time. If customer behavior changes, it is likely that changes can be accommodated by assigning the customer to a different cluster.
We assume that data result from the integration of three databases, calls, SMSs and Web logs. These databases, could have the following schemas (based on our case study analysis and [10]):
Each row in these databases could be around 200 bytes. A small-medium telecommunications company has 5 million customers (large telecom companies can reach 30 million customers in one country). Two other important inputs are the average number of calls per customer, which is around 7/day, and the average number of SMSs sent by each customer, which we estimated to be 10/day. Therefore, we can estimate that a small-medium size company can gather around 3 GB of calls data and 5 GB of SMSs each day. The processing functions should keep information about the daily usage statistics for each customer in the three categories (calls, sms and internet usage), possibly divided in time slots. Ideally, assuming six time slots 0-4, 4-8, 8-12, 12-16, 16-20, and 20-24, we want to create the following profile for each customer: client_id, (call_minutes, sms_number and internet_size) for the six time slots and a total weekly aggregation, which accounts in total for 90~100 bytes; by considering the total number of customers, we derived that 0.5 GB data is generated each week and 185 GB each year.
As far as the processing time is concerned, the data preparation procedure is the one taking most of the time. From the benchmarks of the aggregating procedures on Spark, it takes around 2 hours of daily processing to produce aggregated results for each day (in the machine configuration provided in Liu 2015), and two more hours of processing at the end of each week to compute the mean values. Finally, 8 hours of processing are needed to compute the minimum distance between all the customers and the clusters centroids, which adds up to a total of 24 hour of processing each week. We are not considering the time spent in running the k-means, since we supposed to perform it only twice a year.
Given these premises, we have estimated the scaling function for the number of cores, the costs with various Amazon EC2 instances, all running the Spark framework (through Amazon EMR) and using Amazon S3 as storage. The results are shown in Table 4. Billed hour(s) represent the hours charged by the provider in each week, while the Total cost accounts indicates the cost of an entire year of usage.
It can be noted that costs vary significantly (by an order of magnitude) with the AWS instance, given the same overall resources of a cluster. This suggests that a careful benchmarking of the solution on different machines could provide significant economic benefits. These estimates have been presented to the telecommunications company that has participated in the case-study analysis. Based on cost considerations, we have proposed the application of this framework in order to select a smaller group of “targeted” customers to be called by the company, in place of sending an SMS, which is their current approach with their customers. This would increase redemption rate (calls have a greater redemption rate compared to SMSs), at affordable costs. The company confirmed that this change in approach could also reduce churn and that the results of the sizing and cost analysis were realistic and useful for this type of strategic considerations.
These considerations were based on a cost-benefit analysis about the advantages that a telecommunication organization can gain. A telecommunication company cannot call their customers to present an offer, as the call center is an expensive channel and costs would soar. A promotion has limited returns which would not compensate costs. On the other hand, they can call their competitor’s customers to invite them to churn out with an interesting offer, as in this case costs are offset by a much larger customer lifetime value. A company implementing smarter targeting and customer selection, will result in cost reductions by over 90% if the set of targeted customers does not exceed 10% of the overall number of customers: accurately selecting customers to be called, drastically lowers the number of calls, reducing expenses from 15 Million euro to 400.000 euro yearly (for a medium-size telecommunication company). On the other hand, targeting through SMSs would not involve the same cost for the company: text messages are very cheap for a firm that holds its own infrastructure. The benefits granted by a smarter promotion campaign through SMSs would be a higher customer satisfaction, given by the lower number of texts received and consequently lower customer fatigue.
It should be noted that costs reported in Table 4 are limited to processing and exclude data management and replication costs. The overall costs of the architecture reported in Figure 14 are higher, as different components typically require separate machines. For example, the database has a dedicated machine/cluster. In this example, data are roughly 150 GB/year, but targeting may require a longer time frame and, in turn, involve additional hardware. Companies may decide to keep promotional information on a separate machine, for performance reasons, further increasing the necessary hardware.
However, our estimates provide an order of magnitude for the hardware necessary for the most processing intensive functions and, hence, for the whole architecture. This is effective to support the identification of opportunities and related strategic decisions. A pilot project should be implemented based on this type of considerations to verify costs and perform an accurate software selection with benchmarking.
Table 4 – Costs of processing capacity for targeting in telecommunications with different Amazon node types (data taken on March 2020).
5.3 Mapping technologies on architectural blueprints
In order to use benchmarks, companies have to select appropriate benchmarks first. Our goal is to associate technologies with the components of the blueprints discussed in the previous sections and, then, associate benchmarks to technologies. In this way, companies are supported from the selection of a use case and corresponding blueprint to the selection of the key benchmarks for the data and processing intensive components to choose the best technologies among those mapped on the blueprints. This mapping of technologies on blueprints is discussed in this section.
The first step is the selection of the most relevant technologies for different blueprint components. Our research work has partially leveraged on the selection made by Matt Turck in 2019 [11], in which more than 1300 Big Data companies and technologies have been identified. The technologies selected in the research by Matt Turck were already classified in category and subcategory, facilitating our mapping on blueprint components. We have modified this selection of technologies by enriching the list of database engines, that is a relevant part of the general blueprint as it involves about one-fourth of its components. For this reason, the aforementioned list of technologies by Matt Turck has been integrated with the annual selection of database technologies proposed by the authoritative website DB-Engines [12]. DB-Engines offers a list in which DBMS technologies are classified depending on their DBMS model -i.e
relational DBMS, key-value store, document stores, etc. As evidence of the completeness of the list of DBMS available on DB-Engines site, it is relevant to mention that it includes all DBMS technologies listed in Matt Turck research and adds many more. The output of this first step has been an excel file with more than 1500 different Big Data technologies to be mapped and ranked to the general blueprint.
To reduce this set of technologies to a more manageable and, still, representative sample of technologies, we have first ranked them by popularity and then selected the top 50 technologies for each component of our integrated blueprint. We have assessed the popularity of the technologies by querying Google Scholar and taking the number of results as a ranking parameter. Although this popularity assessment method is quite easy to perform, it is also very easy to obtain biased results due to the name of the technologies. For example, when querying Google Scholar with “Luminoso” -which is a data analytics platform- the search engine will return results that have nothing to do with the context of Big Data, thus creating a bias. To minimize the chances of bias, we have carefully defined our queries by applying the following criteria:
• Add classification-specific keywords. For every cluster of technologies, new keywords were selected. For example, while assessing the popularity of TensorFlow and all the technologies about machine learning, “Machine Learning” was used as search keyword combined with “TensorFlow”. This makes the search more accurate and keeps it uniform among technologies in the same category.
• Only consider pages in English. Bias can be largely avoided by excluding pages that are not in English. For example, the bias obtained by querying Google Scholar with “Luminoso” -an Italian word that stands for bright- is easily avoided. Since more than 80% of scientific articles are written entirely in English [13], excluding articles written in other languages does not influence sensibly the popularity assessment.
• “Big Data” as a keyword. Our classification aims to evaluate the relevance of the technologies in the Big Data landscape and this keyword reduces biases and improves the overall quality of the evaluation.
• Use quotation marks. Adding quotation marks to a query forces the search engine to look for results containing all the words in the query, thus avoiding Google Scholar to return pages that are not consistent with search goals.
The results of this ranking process can be found on DataBench document repository. Based on this ranking, technologies have been selected according to the following criteria:
• Select the most popular technologies in each category corresponding to a component in the blueprint, aiming for 10-15 technologies per component.
• Select technologies that provide enough technical documentation to be associated with benchmarks (see next section).
• Avoid technologies with a narrow focus, especially if their focus is not consistent with our use-case specific architectures.
By selecting technologies according to the criteria listed above, we have obtained 285 technologies for a total of 20 components, corresponding to roughly 14 technologies per component. The resulting excel file (which can be found on DataBench document repository) can be used to identify popular and well documented technical alternatives to build an operational IT architecture for the different use cases, according to our blueprints.
5.4 Mapping benchmarks on technologies
The last step of our methodology is mapping benchmarks on technology categories (corresponding to components in our blueprints). In this way, companies are supported up to the identification of applicable benchmarks.
To select a set of benchmarks as a starting point for mapping, we have referred to WP1’s framework and, particularly, the benchmark survey presented in D1.2. This deliverable identifies and discusses the most popular Big Data benchmarks. Benchmarks in D1.2 have been selected to satisfy the following criteria:
• Their code should be publicly available and open-source (source code and/or execution binaries).
• They should have good documentation.
• They should be regularly maintained and updated (bug fixing, improvements, new features).
• They should be popular, that is their performance results should be widely reported and referred to.
D1.2’s list of benchmarks has been updated and enriched to have benchmark technologies for all the components of our blueprints (particularly, graph and NoSQL database benchmarks). The total number of benchmarks that has been obtained is 51. At this point, the very last step of the mapping process has been to map the 51 benchmarks onto the 285 technologies. The excel files reporting this mapping can be found in the DataBench document repository. The excel file is organized according to the following columns, consistent with D1.1’s framework:
• Name - The name of the benchmark tool.
• Blueprint area - The area of the general blueprint that the benchmark tool involves.
• Benchmark typology - The exact typology of the benchmark. This value has been obtained by strictly relying on the definition given by the official website or the official documentation.
• Stack implementation - A list of technologies that the benchmark tool involves and tests (e.g., technologies using MapReduce paradigm, Relational DBMSs, ...)
• Official website - Link to the official website.
• Technical documentation - Link to the Official website area containing the formal technical specification of the Big Data solution.
• Workload - The details of the workload that the benchmark simulates on a blueprint component or a group of components.
• Data type and generation/datasets - The type of data that the benchmark tool uses for the evaluation of the performance of the technology (e.g. structured data, unstructured data, ...).
• Metrics - The list of parameters that are given as an output to the evaluation of the performance of the technology by the benchmark tool (e.g, execution time, throughput, latency, ...).
• Year - The year in which the benchmark tool has been made publicly available.
• Description. A short description of the technology is given by summarizing official descriptions taken from the website or official documentation.
5.5 Using the methodology: technology cost assessment and benefits from technical benchmarking
Our methodology is embedded in the Toolbox in the form of knowledge nuggets and related search mechanisms and navigation paths. As thoroughly explained in D3.4, the Toolbox users can browse through the DataBench knowledge base in various ways, with different goals. Our underlying methodology guarantees that they can go from a general uptake of BDA trends, to a focus on a specific use case, to the design of the corresponding architecture and related technology selection through benchmarking.
The methodology is used and evaluated in WP5. In WP5 it is applied to understand the role played by technical benchmarking and assess the economic benefits from using a quantitative benchmarking approach for architectural design and technology selection of BDA use cases.
6 Conclusions
The methodology defined in WP4 and documented in this deliverable indicates that despite the diversity of BDA’s practical applications, the most frequent use cases have similar technology requirements. We have modelled those requirements and obtained an integrated architectural blueprint that can be used to select technologies and benchmarks. The knowledge that we have accumulated in DataBench can be very useful to speed up the learning and decision-making processes of companies approaching BDA. This knowledge is also timely, as most companies are still in the early stages of BDA implementation, as shown by our surveys and case analysis. As noted before, the methodology presented in this deliverable is used in WP5 to validate it and understand the business benefits from technical benchmarking. Our use cases indicate a need for careful IT investments and point to a reduction of technology cost as a key to unlock business benefits from BDA in many use cases. The extent to which technical benchmarking can help in this direction is also assessed in WP5.
7 References 1. Shahrivari S. Beyond Batch Processing: Towards Real-Time and Streaming Big Data, 2014. 2. Raguseo E. Big data technologies: An empirical investigation on their adoption, benefits and risks for companies.
International Journal of Information Management 2018, Elsevier. 3. Sagiroglu S and Sinanc D. Big data: A review, International Conference on Collaboration Technologies and
Systems 2013. 4. Sivarajah U, Kamal MM, Irani Z and Weerakkody V. Critical analysis of Big Data challenges and analytical
methods. Journal of Business Research 2017; 70, 263-286. 5. Joseph RC and Johnson NA. Big data and transformational government. IT Professional 2013; 15(6), 43-48. 6. Waller MA and Fawcett SE. Data science, predictive analytics, and big data: a revolution that will transform
supply chain design and management. Journal of Business Logistics 2013; 34(2), 77-84. 7. McAfee A, Brynjolfsson E, Davenport TH et al. Big data: the management revolution. Harvard business review
2012; 90(10), 60-68. 8. Grover V, Chiang RH, Liang TP and Zhang D. Creating strategic business value from big data analytics: A research
framework. Journal of Management Information Systems 2018; 35(2), 388-423. 9. Liu, L. (2015), Performance comparison by running benchmarks on Hadoop, Spark, and HAMR, PhD thesis,
University of Delaware. 10. https://medium.com/@prunamihai1984/service-assessment-based-on-cdrs-c0f99a2ebfe2 11. url: http://dfkoz.com/ai-data-landscape/. 12. DB-Engines, Knowledge Base of Relational and NoSQL Database Management Systems, URL: https://db-