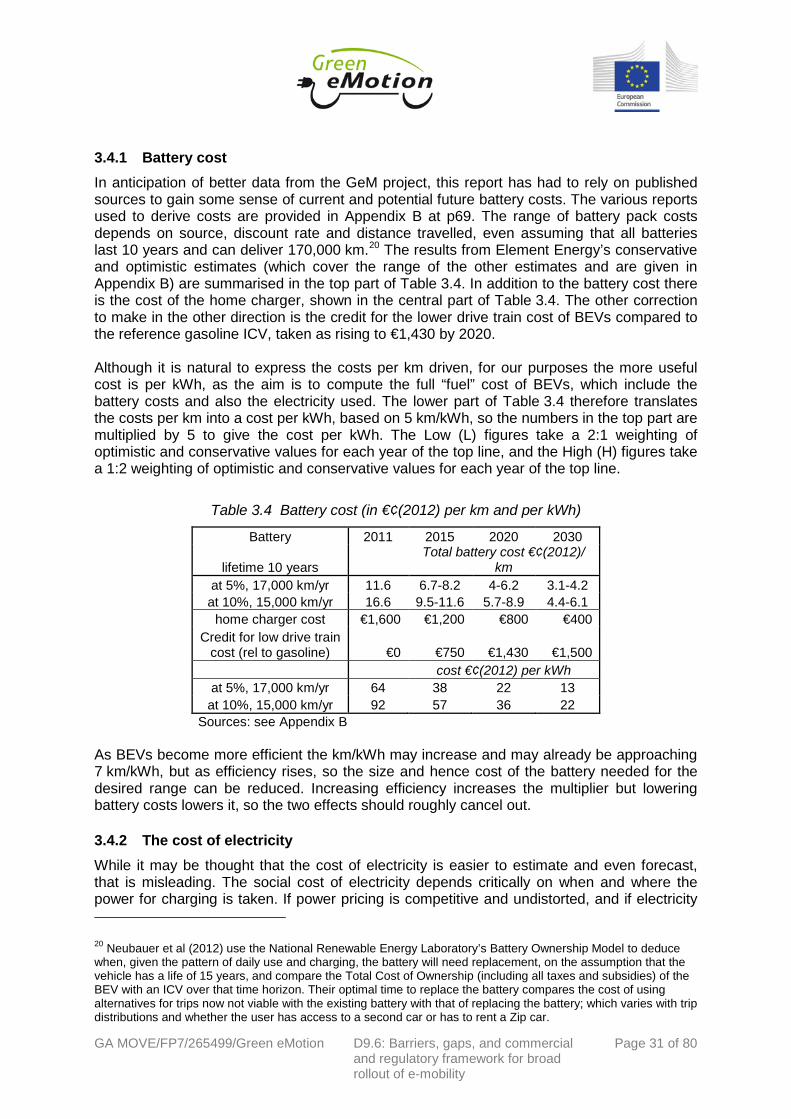
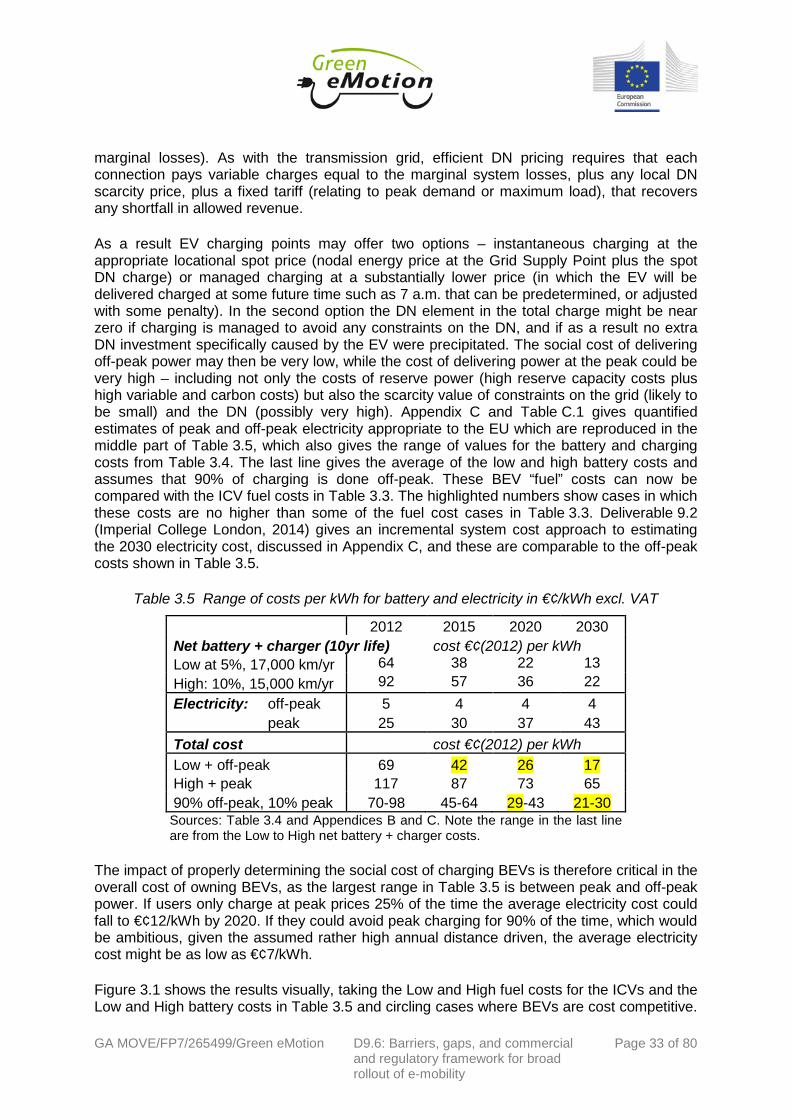
Deliverable 9.6 Barriers, gaps, and commercial and regulatory framework for broad rollout of e-mobility Final Report Prepared by: David Newbery Goran Strbac Imperial College London Date: 20 January 2015 Version: 2.1 GA MOVE/FP7/265499/Green eMotion D9.6: Barriers, gaps, and commercial and regulatory framework for broad rollout of e-mobility Page 1 of 80
Transcript
Deliverable 9.6
Barriers, gaps, and commercial and regulatory framework for broad rollout of e-mobility
Final Report
Prepared by:
David Newbery Goran Strbac
Imperial College London
Date: 20 January 2015 Version: 2.1
GA MOVE/FP7/265499/Green eMotion D9.6: Barriers, gaps, and commercial and regulatory framework for broad rollout of e-mobility
Page 1 of 80
Document Information Authors
Name Company Key author David Newbery Imperial College London Further authors Goran Strbac Imperial College London
Distribution
Dissemination level PU Public x PP Restricted to other programme participants (including the Commission Services) RE Restricted to a group specified by the consortium (including the Commission
Services)
CO Confidential, only for members of the consortium (including the Commission Services)
Revision history
Version Date Author(s) Description 1.0 November 8, 2013 Imperial College London Draft outline 1.1 January 6, 2014 Imperial College London Draft Report 1.2 February 18, 2014 Imperial College London Draft Report 1.3 March 1, 2014 Imperial College London Draft Report 1.4 March 21, 2014 Imperial College London Draft Report 1.5 April 21, 2014 Imperial College London Draft Report 1.6 May 9, 2014 Imperial College London Draft Report 1.7 August 4, 2014 Imperial College London Draft Report 1.8 October 4, 2014 Imperial College London Draft Report 2.0 November 27, 2014 Imperial College London Draft Final Report 2.1 January 20, 2015 Imperial College London Final Report
Status For Information Draft Version Final Version (Internal document) Submission for Approval (deliverable) x Final Version (deliverable, approved on)
GA MOVE/FP7/265499/Green eMotion D9.6: Barriers, gaps, and commercial and regulatory framework for broad rollout of e-mobility
3 The economics of EVs ........................................................ 23
3.1 Perceived advantages and disadvantages of BEVs .................................................. 23
3.2 Social cost benefit analysis of BEVs ......................................................................... 24
3.3 Target net battery and electricity costs ...................................................................... 27
3.4 Current estimates of battery and electricity cost evolution ......................................... 30 3.4.1 Battery cost 31 3.4.2 The cost of electricity 31
3.5 Other EVs 35
3.6 Summary of the economics of electric vehicles ......................................................... 37
4 Implications for the electricity system ........................................... 38
4.1 Charging infrastructure 38
4.2 Electricity supply 43
5 Commercial and regulatory framework required ................................... 45
5.1 Evidence from a Japanese case study ...................................................................... 45
5.2 The economics of networks 46
5.3 Coordination, standards, ICT and the GeM Clearinghouse ....................................... 47
5.4 Stakeholders 49 5.4.1 EV driver 49 5.4.2 Charging infrastructure: providing the EV Supply Equipment 51 5.4.3 EV Service Provider (EVSP) 53 5.4.4 Electricity suppliers, DNOs, DSOs and TSOs 56 5.4.5 OEMs 57 5.4.6 Other business models: Better Place 57
5.5 Cost-benefit analysis and Business Models .............................................................. 59
Figure 4.2 Estimated Costs of EV Batteries through 2020 ...................................................42
Figure 4.3 Price duration curve for the Single Electricity Market in Ireland, 2009 .................44
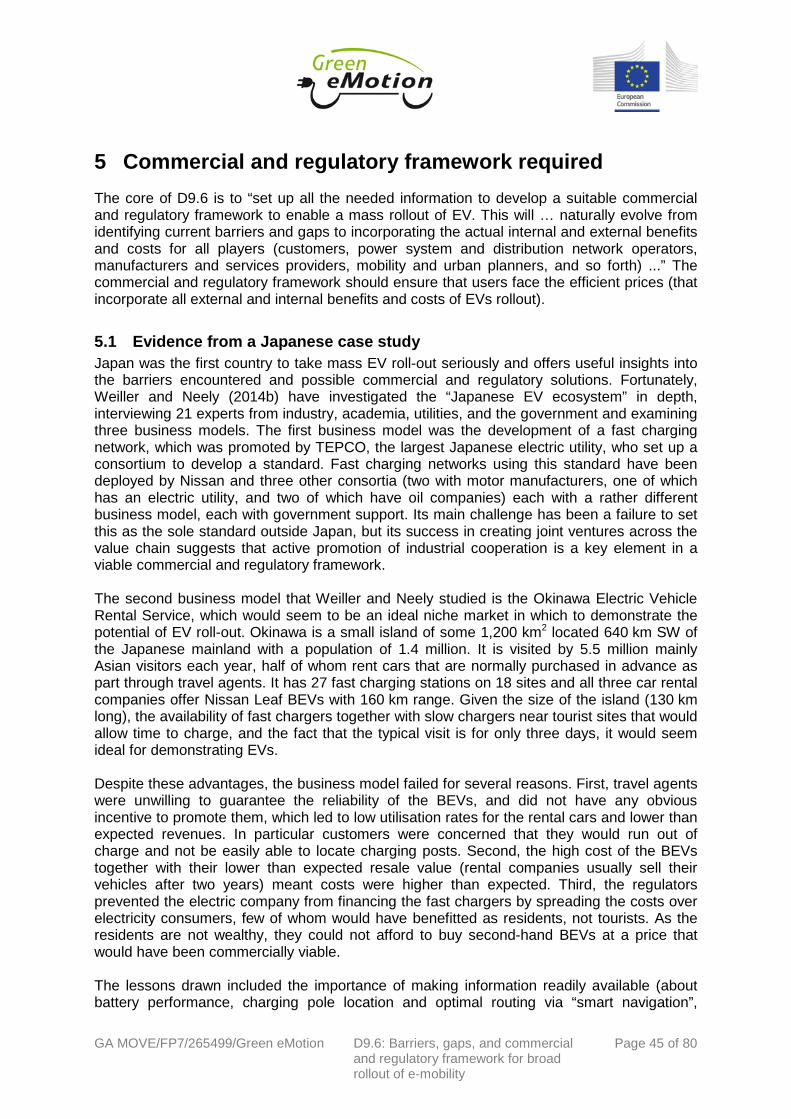
Figure 5.1 Total cost of ownership .......................................................................................51
Figure 5.2 Cost savings from smart EV charging in Germany and Denmark in 2030 (D9.2, Imperial College London, 2014, fig 3.4) ................................................................................55
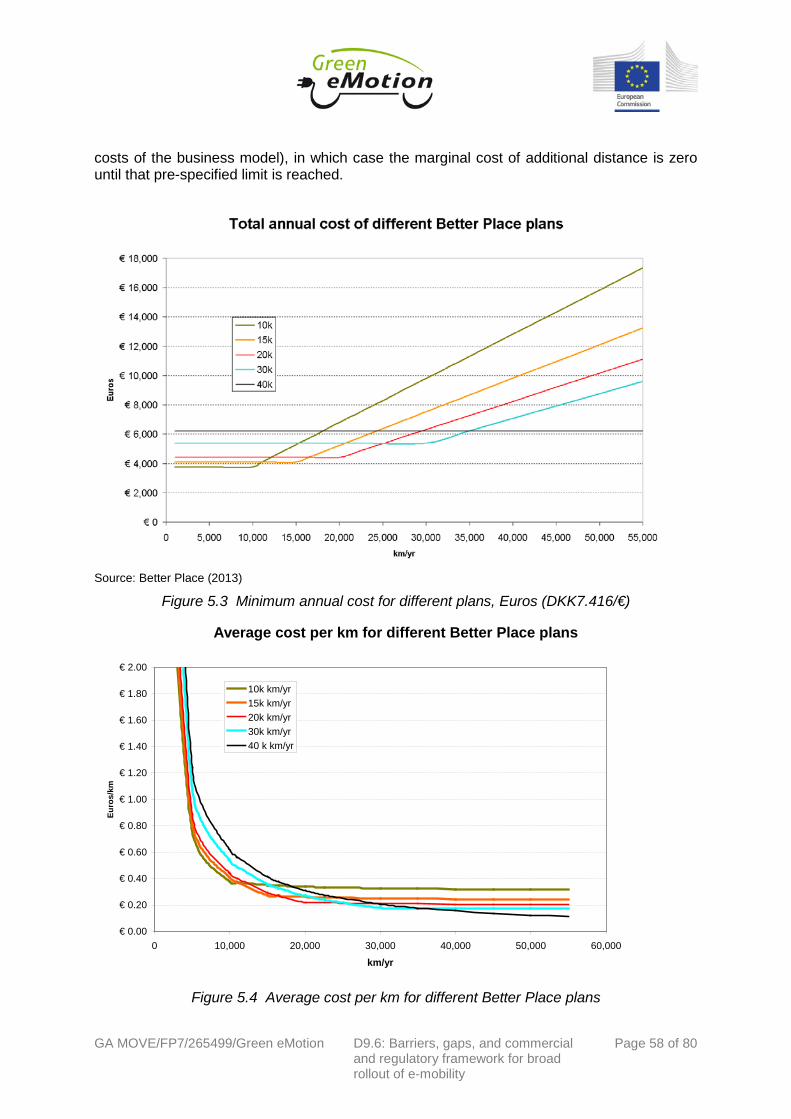
Figure 5.3 Minimum annual cost for different plans, Euros (DKK7.416/€) ............................58
Figure 5.4 Average cost per km for different Better Place plans ..........................................58
Figure A.1 Evolution of real imported price of oil and products and margins, US, 1980-2010 .............................................................................................................................................66
Figure A.2 Moving averages of US real crack spreads, 1985-2010 .....................................67
Figure A.3 Crack spreads for European import prices .........................................................68
Figure B.1 Possible evolution of battery pack costs from Element Energy (2012, Fig. 6.1) ..69
Figure B.2 Battery characteristics from Element Energy (2012, Table 2.1) ..........................70
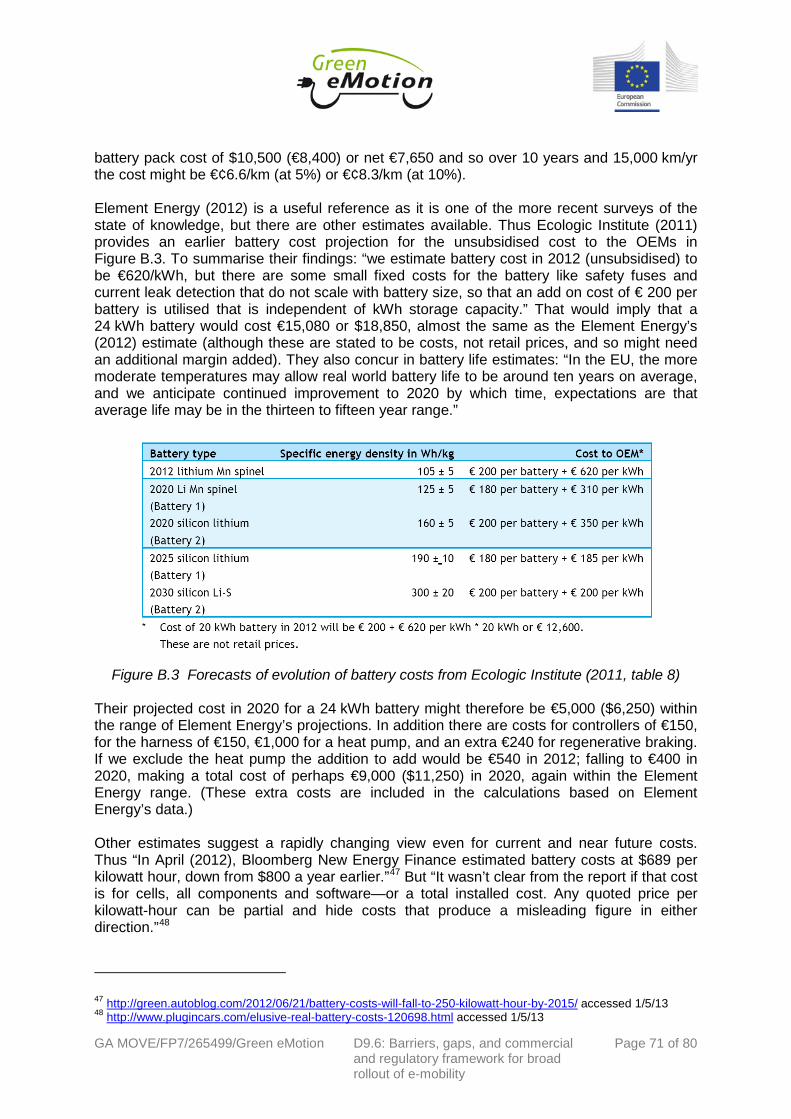
Figure B.3 Forecasts of evolution of battery costs from Ecologic Institute (2011, table 8) ....71
Figure C.1 Effect of smart charging of BEVs .......................................................................75
Figure C.2 Additional system cost per EV in UK and Ireland in 2030 ...................................75
Figure C.3 Average energy prices for medium-sized domestic customers excluding taxes and levies, Jan-June 2013 ....................................................................................................76
Figure C.4 Price duration curve for wholesale spot electricity in European power exchanges in 2012 .................................................................................................................................77
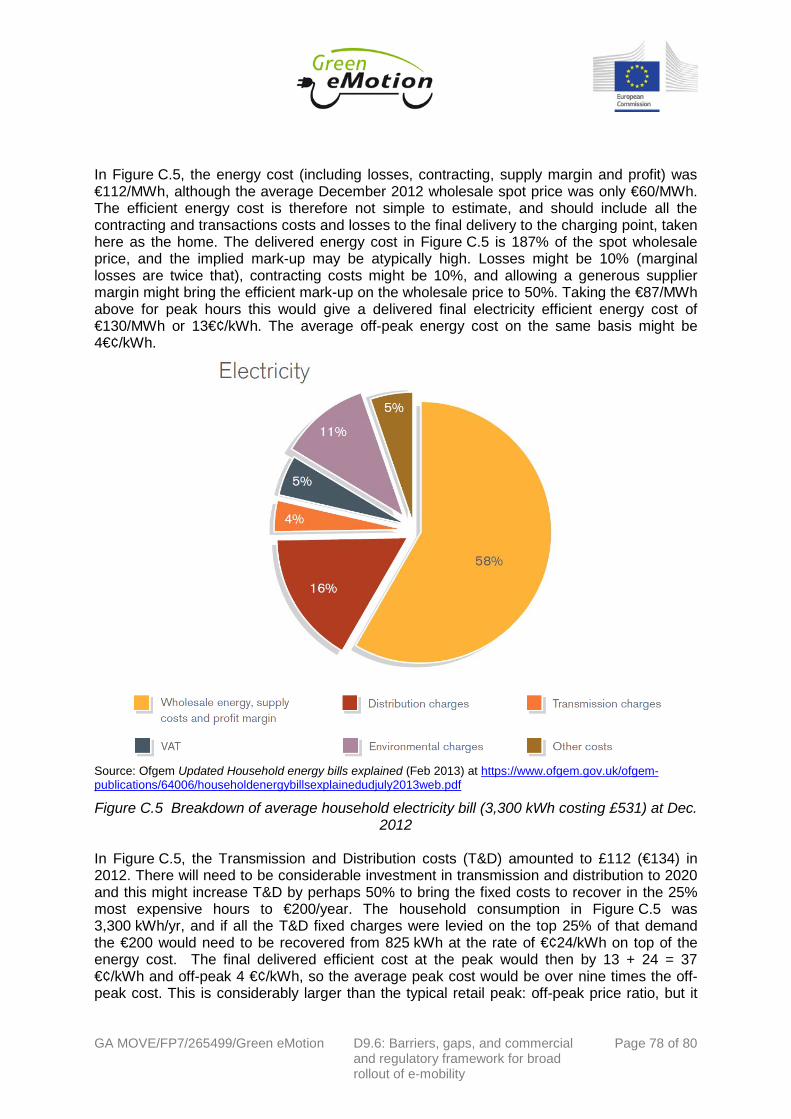
Figure C.5 Breakdown of average household electricity bill (3,300 kWh costing £531) at Dec. 2012 .....................................................................................................................................78
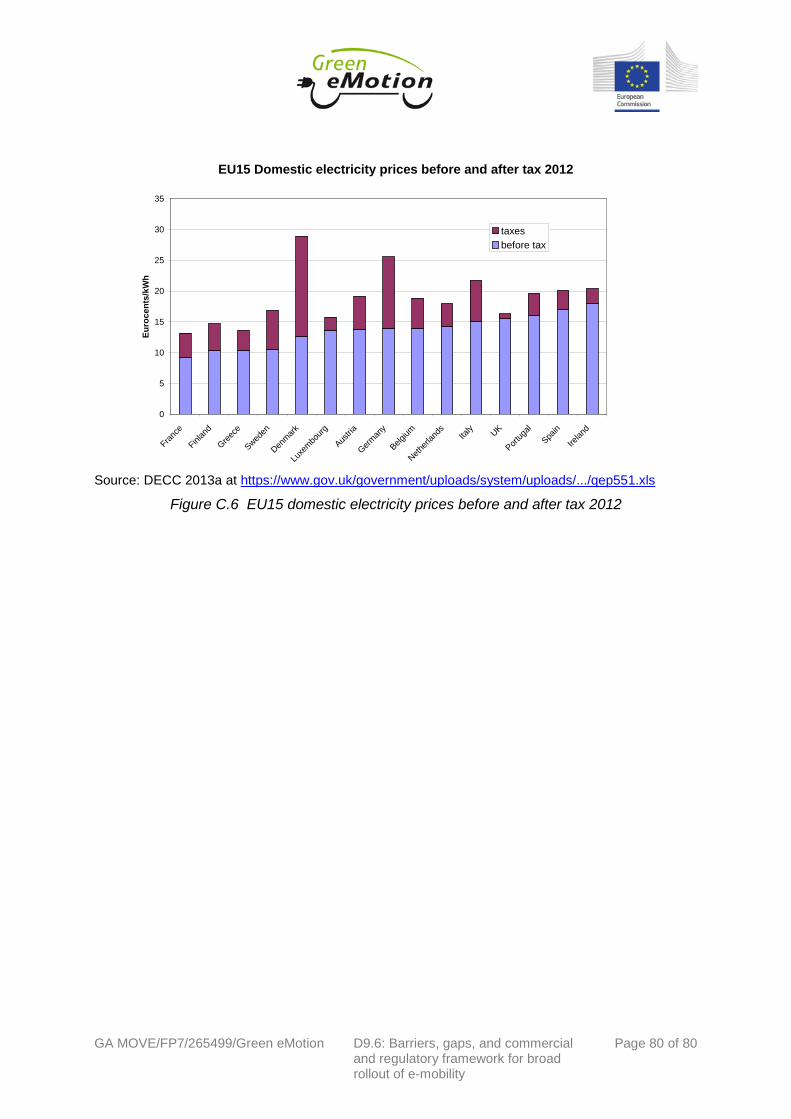
Figure C.6 EU15 domestic electricity prices before and after tax 2012 ................................80
GA MOVE/FP7/265499/Green eMotion D9.6: Barriers, gaps, and commercial and regulatory framework for broad rollout of e-mobility
Page 5 of 80
List of Tables Table 3.1 Calculation of social cost of road fuels excluding excise taxes, US $(2012)/litre ..28
Table 3.2 Assumed conversion efficiencies and multipliers for road fuel relative to EVs ......29
Table 3.4 Battery cost (in €¢(2012) per km and per kWh) ....................................................31
Table 3.5 Range of costs per kWh for battery and electricity in €¢/kWh excl. VAT ..............33
Table C.1 Projected peak and off-peak electricity costs, €¢/kWh .........................................79
GA MOVE/FP7/265499/Green eMotion D9.6: Barriers, gaps, and commercial and regulatory framework for broad rollout of e-mobility
Page 6 of 80
List of Abbreviations AER All-electric range (of HEV or PHEV) bbl Barrel (of oil) bhp Brake Horse Power (1 hp = 0.746 kW) BEV Battery Electric Vehicle BSS Battery Switch Station CBA Cost Benefit Analysis DER Distributed Energy Resources DG Distributed Generation DoD Depth of Discharge DN(O) Distribution Network (Operator) DSO Distribution System Operator DSM Demand Side Management DSR Demand Side Response EPA Environmental Protection Agency (US) EV Electric Vehicle (includes HEV and BEV) EVI Electric Vehicle Initiative (countries) EVSE Electric Vehicle Supply Equipment GSP Grid Supply Point HEV Hybrid Electric Vehicle ICE Internal Combustion Engine ICV Internal Combustion (i.e. conventional) Vehicle ICT Information and Communications Technology ISO Independent System Operator IP(R) Intellectual Property (Right) MCP Market Clearing Price OEM Original Equipment Manufacturer, e.g. a vehicle or battery manufacturer OTC Over the counter PHEV Plug-in Hybrid Electric Vehicle PV Photo voltaic SCBA Social Cost Benefit Analysis SMC System Marginal Cost – marginal cost of the most expensive plant on the system TDM Transmission, Distribution and Margin costs ToU Time of Use (tariff) TSO Transmission System Operator VPP Virtual Power Plant WP Work Package
GA MOVE/FP7/265499/Green eMotion D9.6: Barriers, gaps, and commercial and regulatory framework for broad rollout of e-mobility
Page 7 of 80
Executive Summary The objective of this report is to identify current gaps and barriers to incorporating the actual internal and external benefits and costs for all players in the EV ecosystem, and to investigate the requirements of a suitable commercial and regulatory framework to enable a mass rollout of EV. This report draws on the results of deliverables D9.1-D9.5 and D9.8 as well as other Green eMotion WPs to the extent they are available, and on other publicly available information.
Gaps and barriers The most obvious gaps are the availability and inter-operability of the charging infrastructure, and the ability of Electricity Supply Industry to engage with the services that Battery Electric Vehicles (BEVs) might provide both to the entire electricity system including distribution networks, transmission networks and generation system. The barriers are more extensive, and range from the high purchase cost (particularly of the battery), the slow charging rate, actual and perceived range anxiety, a lack of confidence in the life-time, resale value and hence user cost of BEVs, and possibly some concerns over safety. In addition to these barriers to consumer acceptance, there are financial and some regulatory barriers to the commercial viability of business models for highway located public charging poles and for battery exchange services. Some of the barriers of consumer acceptance can be overcome by providing subsidies and other forms of support that make BEVs more attractive to users (e.g. access to parking in congested urban area, access to High Occupancy Vehicle or bus lanes) but at the cost of shifting the financial problem to the government and then on to tax-payers. There is thus a further (fiscal) barrier if the full cost (including the cost of subsidies or lost fuel tax revenues) remains high compared to conventional Internal Combustion Vehicles (ICVs). This fiscal barrier should not be underestimated – the loss in fuel tax duty might range from €500-€750 /BEVyr, If the 2020 target of 2% BEVs is reached, that would be 5 million BEVs in the EU, and the cumulative fiscal cost to 2020 in lost fuel revenue could be €5-7billion. At present EVs receive substantial subsidies, and even if these are phased out, so that their average over the period to 2020 is only €2,000/BEV, the 5 million BEVs on the road by then would have received €10 billion in purchase subsides, or in total €15-17 billion by 2020, which, to be justified, would need to lead to both a substantial fall in their cost and transport emissions sufficiently valuable to exceed this sum.
Social cost-benefit analysis In estimating the full social cost (including the fiscal costs) it is necessary to strip out subsidies and revenue raising taxes like road fuel excises and VAT, but add in environmental costs, to identify the economics of BEVs. Given the considerable uncertainty over future battery costs, lifetimes and value in subsequent use (if any), the report instead estimates a target for the delivered levelised cost of energy measured in kWh (the net battery and electricity cost) at which BEVs will be cost competitive with ICVs. The target levelised costs depend on future oil and carbon prices, given in Table 3.1, as well as on the differential extra ICL maintenance costs, and are given in Table 3.3. They range from €¢29-58/kWh when competing against a diesel ICV and €¢23-56/kWh against a gasoline ICV, allowing for the differential in drive train and maintenance costs. Looking ahead to 2020, the levelised costs for BEVs charging 90% of the time controlled off-peak and only 10% discretionary peak are given in Table 3.5 and might be €¢36/kWh (+/- €¢7/kWh). The large gap in the electricity price between peak charging at €¢37/kWh and off-peak (controlled) home charging at €¢4/kWh estimated for 2020, a range of more than nine to one, might even widen further with increased intermittent renewable generation.
GA MOVE/FP7/265499/Green eMotion D9.6: Barriers, gaps, and commercial and regulatory framework for broad rollout of e-mobility
Page 8 of 80
Thus by 2020, if oil and carbon prices are at the High level ($147/barrel and $28/tonne CO2), BEVs could compete against both diesel and gasoline ICVs. It should, however, be stressed that the cost comparisons are very sensitive to a large number of rather uncertain cost and performance assumptions, but there is a defensible case that BEVs can become economic and that this would justify further R&D and financial deployment support. The build-up of the various components of costs (Low and High) for category of vehicle (Diesel, Gasoline, BEV) and each of the chosen years is given in Figure E.1, which demonstrates the importance of securing a low (off-peak) electricity price. The circles indicate cases where BEVs under some cost conditions can be competitive against some combination of oil and carbon prices.
Figure E.1 Build-up and range of costs for vehicle types, 2015-2030
The underlying problem facing BEVs is that as a more capital-intensive transport solution than ICVs they ought to be used in higher intensity use (as capital-intensive generation should be used for base-load power), which means high annual driving distances, but this runs up against the obstacle of slow charging times and limited range. There are natural but niche markets such as longer-distance commutes with charging at home and work, and possibly for taxi use in urban environments, but until battery range and costs improve and charging speeds increase (as might happen if and when a viable battery-swap business emerges) these niches are likely to remain modest, and domestic BEV ownership likely restricted to two-car families. With growing confidence in the range and normal driving distances, the two-car families may decide to retain just the BEV, and use that to travel to car rental locations to hire ICVs for longer journeys. Studies from the US suggest that Hybrid Electric Vehicles (HEVs) and Plug-in Hybrid Electric Vehicles (PHEVs) could be cost competitive by 2015 against gasoline ICVs for typical car usage patterns, particularly with a reasonable carbon price and low cost at home or work charging, provided the battery size is kept small (4 kWh). As such these PHEVs offer a useful transition to extensive BEV
GA MOVE/FP7/265499/Green eMotion D9.6: Barriers, gaps, and commercial and regulatory framework for broad rollout of e-mobility
Page 9 of 80
penetration, encouraging the development of charging infrastructure and further battery development.
Implications for charging infrastructure and electricity supply Given the salience of electricity pricing by location and time of use, and the potential for BEVs to offer ancillary services to distribution and transmission system operators (DSOs and TSOs), as well as the development of business models for public charging poles, considerable effort will be needed to develop and deploy suitable charging and incentive schemes for DSOs and TSOs, of the kind currently being trialled under Ofgem’s Low Carbon Network Fund challenge. Similarly, the UK Government’s Plugged-in Places (PiP) trials have provided useful learning about the infrastructure needed for successful BEV penetration. They have revealed considerable dissatisfaction with the lack of standardisation of public charging points and the importance of developing viable business models for these charging points. The IEA (2013) study reveals the very considerable level of public support in its study countries between 2008 and 2012, amounting to $50,000 per BEV, which has delivered a substantial decrease in the cost of batteries. The high subsidy also indicates the urgency of further reducing costs and delivering viable and sustainable business models. When it comes to developing an EV infrastructure, comprising the sale, leasing and/or rental of EVs or their batteries, the charging infrastructure and the associated ICT to allow EVs to roam and charge from poles provided by a range of different operators, and of the associated EV Supply Equipment (EVSE) and Service Providers (EVSP), there are lessons to be learned from the economics of networks, as well as from various trials in Japan and Europe. Fortunately, while profit-driven networks may undersupply interoperability, the requirement for heavy public support probably facilitates “thoughtfully pro-competitive public policy.” If the public sector is willing to provide such massive fiscal support, then one might expect it would also be pro-active in removing obstacles and barriers to new business models for delivering various services. Suitable standardisation and interoperability are two key requirements to enable a clearing house to facilitate roaming, should this emerge as a favoured option, and will be valuable in their own right.
Commercial and regulatory framework At present BEVs enjoy heavy tax advantages in avoiding the high fuel excise taxes, and frequently also receive large purchase subsidies. These go a considerable way to support faster penetration and the associated demand for the charging infrastructure, as well as providing a pull to technological innovation. Even so, creating a sustainable business model for public EVSE will be challenging, as service stations make low margins on high throughput fuelling, and EV charging is much slower. Some form of subscription service would be needed to support public charging, and finding suitable locations will require the cooperation of town planners as well as the Distribution Network Owners (DNOs). In some countries DNOs have been keen to provide EVSE and become EVSPs and they have the advantage that they can internalise the costs and benefits of controlled charging (using that to deliver frequency response and demand side response). Nevertheless, they likely lack the business skills to provide the required transport services, and might best be encouraged to provide efficiently located and priced connections to EVSEs and to ensure that they do not discriminate against aggregators and EVSPs when they offer services to the DNOs. EVSPs sell km or kWh to the consumers, and may be automotive OEMs making ownership more attractive, specialist e-mobility service providers like Better Place, electricity suppliers, or even Distribution System Operators optimising the charging regime. Battery Switch
GA MOVE/FP7/265499/Green eMotion D9.6: Barriers, gaps, and commercial and regulatory framework for broad rollout of e-mobility
Page 10 of 80
stations appear to overcome the problem of charging time and refuel as quickly as ICVs, but face the barrier of a considerable increase in the capital cost of the EV ecosystem. They have been trialled with dedicated taxi fleets located at an airport where the BEV taxis average 80,000 km per year, but even here the business case looks marginal without a considerably larger fleet of BEVs. Small autonomous BEVs that can be summoned by hand-held devices in otherwise pedestrianised shopping centres and smart cities may eventually become viable, but again they would have to compete with ICV autonomous vehicles that are already under development. In conclusion, the case for heavy subsidies is that they will stimulate battery development to drive down costs and create the demand to support the necessary mass roll-out of the charging infrastructure and associated roaming capabilities. At some future date it seems likely that BEVs will be required to largely replace ICVs, leaving the key question of when is the best time to provide the financial stimulus. On the evidence presented here, a 2020 (or even earlier) target for cost competitiveness is not implausible, given high oil and carbon prices, and thereafter the attractions of BEVs should improve, although one should not under-estimate the rate at which ICVs might improve under the same pressures to reduce carbon emissions.
GA MOVE/FP7/265499/Green eMotion D9.6: Barriers, gaps, and commercial and regulatory framework for broad rollout of e-mobility
Page 11 of 80
1 Introduction Deliverable D9.6 “will naturally evolve from identifying current barriers and gaps to incorporating the actual internal and external benefits and costs for all players (customers, power system and distribution network operators, manufacturers and services providers, mobility and urban planners, and so forth)”. D9.6 will inform D9.7, which will synthesise project and other findings, including the costs, benefits and impacts of a mass-market rollout of EVs in Europe to develop a roadmap and list of actions needed to prepare for the successful rollout of EVs throughout Europe. This report draws on the results of deliverables D9.1-D9.5 to the extent they are available as well as other Green eMotion WPs (e.g. D9.8) and on other publicly available information listed in the References. Deliverable 9.1 focused on consumer acceptance of EVs, Deliverables D9.2 and D9.3 assessed the impact of EV penetration on power systems (from generation to transmission and distribution), Deliverable D9.4 looked at the business perspective of public charging infrastructure deployment and Deliverable 9.5 assessed the environmental impact of EVs. Deliverable D9.8 provides some limited information about battery performance and durability. In this report EVs are taken to be electric vehicles that can be charged externally (i.e. can be plugged into a Charging Pole or Point, in contrast to Hybrid Electric Vehicles, HEVs, that have an internal combustion engine (ICE) and a modest battery (4-10 kWh) that can only be charged from the ICE. Within the class of plug-in EVs, the main emphasis is on Battery Electric Vehicles (BEVs) with no ICE, but there is also a brief discussion of Plug-in Hybrid EVs, PHEVs, which may have a larger battery than an HEV as well as an ICE, and as the name implies, can be charged externally from a charging point just like a BEV. The report is organised as follows. Chapter 2 discusses the key gaps and barriers for a widespread adoption of EVs. Chapter 3 investigates the economics of BEVs, with particular focus on social cost-benefit analysis and determining targets for battery and electricity costs. Implications for the electricity systems are discussed in Chapter 4, distinguishing between the charging infrastructure requirements and the existing entities involved in electricity supply. Chapter 5 identifies the requirements for appropriate regulatory and commercial framework to support an efficient mass rollout of EVs in Europe, while also analysing the roles of and implications for various stakeholders in the EV value chain.
GA MOVE/FP7/265499/Green eMotion D9.6: Barriers, gaps, and commercial and regulatory framework for broad rollout of e-mobility
Page 12 of 80
2 Barriers and gaps for massive EV rollout The first objective of Deliverable 9.6 (of Task 9.5) is to “identify existing barriers and gaps for the rollout of EVs”. The most obvious gaps are the availability and inter-operability of the charging infrastructure, and the ability of the Electricity Supply Industry to engage with the services that BEVs might provide to the system, including distribution networks, transmission networks and the generation system. The barriers are more extensive, and range from the high purchase cost (particularly of the battery), slow charging time, actual and perceived range anxiety, a lack of confidence in the life-time, resale value and hence user cost of BEVs, and possibly some concerns over safety (battery fires, lack of audibility for pedestrians and cyclists). In addition to these barriers to consumer acceptance, there are barriers to the commercial viability of business models for public charging infrastructure and for battery exchange services. Some of the barriers of consumer acceptance can be overcome by providing subsidies and other forms of support that make BEVs more attractive to users (e.g. access to parking in congested urban area, access to High Occupancy Vehicle or bus lanes) but at the cost of shifting the financial problem to the government and then on to tax-payers. There is thus a further (fiscal) barrier if the full cost (including the cost of subsidies or lost fuel tax revenues) remains high compared to conventional Internal Combustion Vehicles (ICVs).
2.1 Barriers to efficient integration of EVs The barriers can be grouped into four categories: economic (factors affecting cost of use, including resale value, life-time, ownership models, etc.), technical (range, charging time, performance, determinants of battery life, etc.), informational (about performance, location of charging poles, resale value, etc.), and utilisation (charging standardisation, interoperability, billing systems, etc.). It is clear that the economic and technical barriers interact, in that some technical barriers such as range can be overcome, but at a cost, and so there is an inevitable overlap in considering these completely separately.
2.1.1 Economic barriers
The most important barrier, clearly identified in D9.1 (Cherchi et al., 2015, hereafter D9.1), is the high purchase cost driven by the cost of the battery, which is partly offset by the lower drive train cost. In all three analysed countries (Denmark, Ireland and Italy), “potential customers are particularly sensitive to the purchase price of the EV, more than to any other attributes including range.” (D9.1, p14, emphasis in original). The total cost of ownership may be reduced by the lower cost of the fuel (electricity), and of maintenance, but a major barrier to realising these future reduced costs is uncertainty about the lifetime and replacement cost of the battery and the related problem of uncertainty about the second-hand sales price of the EV. Another somewhat indirect measure of the cost barrier was the willingness to pay (WTP) for an increased range of the EV. In Ireland and Italy there was a rather modest WTP for an extra km range for small to medium sized cars (less than €25/km) but in Denmark (where ICVs are very heavily taxed) the WTP even for mini cars was about €80/km. WTP to increase the range of large cars was far higher – over €100/km in Italy and Denmark, but only 34/km in Ireland. Averaging over all vehicles sizes, “the average WTP in Italy is 61€/km, in Ireland is 21€/km and Denmark is 98/km.” (D9.1, p42, emphasis in original). While recognising that the WTP is non-linear in range, these estimates suggest that moving from the normal EV range of perhaps 160 km to 300 km might be worth between €3,000 and €14,000 on the purchase price; or putting it the other way round, having to sacrifice (at least) 140 km compared to an ICV would cost that much. Another way to
GA MOVE/FP7/265499/Green eMotion D9.6: Barriers, gaps, and commercial and regulatory framework for broad rollout of e-mobility
Page 13 of 80
interpret this WTP is that at 5km/kWh, if the average WTP for extra km is €50/km, this would be €250/kWh. This is still below the current marginal cost of increasing battery size, but is within striking distance sometime after 2020 (see Table 3.4).
The conclusion drawn from D9.1 was that “The purchase price of the EV needs to be made comparable with that of the ICEV. But also focus on the total cost of operation, because the operating cost is cheaper for EVs and can (partially) compensate higher prices.” (D9.1, p18, emphasis in original).
One of the key determinants of the total cost of operation is battery life. “In this study conducted in Denmark we also tested the effect of battery life and top speed. Results show that the marginal utility of battery life is higher after having tried the EV and significantly different from the effect before the experience. In line with this result, the direct elasticity for EV increases on average from 0.31 to 0.51, while the marginal valuation increases from 15-46 Euros per 1000 km before the experience to 27-68 Euros after the experience.” (D9.1, p50, emphasis in original). This amounts to roughly 5€¢/km in use cost, unfortunately still below the current use cost, but possibly achievable sometime between 2020-2030, at least with modest interest costs and reasonable annual distances driven (Table 3.4).
One of the implications of any equipment that has a high capital cost but low use costs is that such equipment is of most value in high intensity uses – thus nuclear power stations run on base load, while open cycle gas turbines, which are relatively cheap to buy but have high running costs, are used for peak shaving and run only a small fraction of the time. EVs with a high capital cost are therefore best used for high annual mileages, such as longer distance daily commutes, taxis, or possibly for rental in urban areas where a modest range is not an impediment.
The problem of range has technical and economic aspects, as the WTP for range indicates. “Range anxiety” emerged as the second most important factor after cost in the D9.1 study, as were (unsurprisingly) concerns about ready and reliable access to fast charging stations. Even a fast charger charging at 50 kW takes 20 minutes to provide an 80% charge (e.g. at 300-380 km/hr), which is not the kind of experience that motorists are accustomed to at service stations, quite apart from the cost of providing such services. One solution is battery swap facilities which can “refuel” the BEV in about the same time that an ICV can be refuelled, but the additional costs of such facilities appears to present overwhelming commercial barriers at present, and the only supplier of such facilities (Better Place) has recently gone bankrupt.
The barriers of range and charging speed obviously interact in that high intensity use requires rapid charging and/or long distances between charging, while rapid charging combined with a dense network of charging facilities requires an additional high infrastructure cost, and as we shall see, a higher cost of electricity if it is to be available at short unplanned notice. The effect is likely to be to restrict the market segments for which BEVs are suited to e.g. regular middle distance daily commuting with the possibility of charging off-peak while stationary at home and the office, and possibly to rental car use in dense urban environments with the ability to exchange the car at other affiliated rental outlets, with the cars charged while not in use. As battery costs decrease and durability increases, the market size should expand, while infrastructure investment and mass roll-out will reduce range anxiety.
GA MOVE/FP7/265499/Green eMotion D9.6: Barriers, gaps, and commercial and regulatory framework for broad rollout of e-mobility
Page 14 of 80
Some of these cost barriers are also scale dependent, as the fixed overheads of providing charging facilities, battery swap stations and even rental agencies require a high throughput of EVs to drive the overhead cost per EV down to acceptable levels. That creates an obvious entry barrier in that without the supporting infrastructure, BEVs remain a niche market which restricts the commercial viability of providing the infrastructure, while it is clearly risky to invest in anticipation of the mass roll-out that would justify the investment. That is clearly a barrier that may require cross-subsidies or public support. The evidence from D9.1 is that EV users rarely use public charging poles, that their use is highly variable, but at the same time EV owners value highly the existence of an adequate fast charging network. (D9.1, p15-17). This compounds the economic barrier to the commercial provision of fast charging poles and/or battery swap stations, as they have to be sized to provide a high availability, but this will in turn result in a low average utilisation rate and high average costs per visit. One measure of this is the WTP for charging, and D9.1 cites one German study: “The average price interviewed customers (n=17) would pay for energy at public columns, is 24 cent/kWh.” (D9.1, p52). This is admittedly a small sample and also WTP on the road when there is a risk of running out will be above this average, but even so it strengthens the concern that fast charging facilities will struggle to make a business case, as their average cost will be higher than the average WTP, and the higher the price they charge, the lower will be their capacity utilisation.
In addition, the vision of the decarbonised economy envisages extensive penetration of intermittent or unreliable renewable electricity, which would benefit from cheap storage and smart demand management systems. At first sight, BEVs would seem an attractive solution in already having a storage system – the battery – and an ability to offer services to other users (sometimes described as V2X) and specifically to the grid (V2G) or the home (V2H). These services range from providing frequency regulation, to demand response (specifically timing and rate of charging depending on the value of power), fast reserve and energy storage for later supply to the grid or home. One of the uncertainties at present is whether repeatedly charging and discharging the battery leads to a faster performance decline than would be suggested by the cumulative kWh taken from the battery over its lifetime. If so then there would be an additional cost over and above the depreciation per kWh that would need to be factored in to the economics of providing grid services, while if there is no such penalty for varying the rate of charging, then BEVs offer the potential for useful Demand Side Response (DSR).
To the extent that these services offered by EVs are valuable they reduce the net cost of EV ownership, but offering these services encounters a considerable number of additional barriers, which ultimately come down to problems with the value chain. In order to realise value from any of these services, three conditions must be satisfied. The first is that the underlying value exceeds the various costs of delivering the service from the EV to the end-user (the “X” in the V2X). The second is that the legal and ownership rights and incentives are aligned so that the participants will cooperate to deliver the value. The third is that the various participants have confidence that they will realise this apparent value, for which they need good information on the costs they incur. The first two are economic barriers, while the last will be treated under informational barriers below.
The first barrier is that the gross value needs to exceed the total costs. These costs are usually a function of scale, so that if an intermediary such as an aggregator is to be attracted, the gross profits from trading the service must be higher than the costs of any physical infrastructure and the management and labour costs of acquiring and managing EV
GA MOVE/FP7/265499/Green eMotion D9.6: Barriers, gaps, and commercial and regulatory framework for broad rollout of e-mobility
Page 15 of 80
customers and the end users. D9.4 (Tecnalia, 2014b fig 2) shows that these costs can be high and very sensitive to scale. To take a simple example, if EVs are to be able to offer fast reserve response by injecting power to the grid (V2G), they will need to be able to transform the DC of the battery to AC at mains voltage (both of which will require equipment costs for each EV), and they will need to be sufficiently numerous so that the aggregator can offer the minimum efficient scale to the grid – perhaps of the order of 1-5 MW. If, as is likely, there are limits on the rate at which EVs can be discharged without undue battery deterioration, that will determine the minimum number of EVs that can be deployed, and as their availability will be restricted to when they are at a suitable charging point, that in turn will require a larger number of EVs to be contracted to the aggregator (Weiller and Neely, 2014a). Again to give an illustration, if the discharge limit is 4 kW, and the minimum scale for useful reserve is 4 MW, then 1,000 EVs will have to be reliably available. At some times of the day (e.g. 6pm-6am) availability may be quite high – perhaps 80% - and only 1,250 EVs might be needed, but if availability drops to 25% then 4,000 EVs would need to be contracted. If the cost of the equipment, premises of the aggregator and operating costs are to be covered out of the value, then larger scales still would be required. In addition to this V2G approach, significant frequency regulation services could also be delivered through interruptible charging for short period of time, which would not require injection of power from the battery. Stand-alone frequency response and regulation up and down through varying the battery charge rate should be possible at a much lower unit cost. Other barriers to EV service provision are also scale dependent – thus developing the software and communications equipment and protocols require a large enough market to justify the initial development expense, and it will be some time before EV numbers reach a critical level, unless this activity is centrally procured and financed. Arguably this is a minor barrier in that the costs are likely to be modest compared with the costs of the charging infrastructure needed for a viable EV roll-out.
2.1.1.1 Property right problems Property right barriers are highly problematic, as some parts of the value chain of delivering electro-mobility may be patented, or otherwise protected by Intellectual Property Rights. One important problem is that motor manufacturers will almost certainly need to offer warranties on the batteries (either directly or from the battery manufacturer) and these will have limitations on how they can be used without violating the terms of the warranty. Weiller and Neely (2014a) have interviewed a large number of key experts and practitioners, who argue that the internal architecture of each EV, including communications, management systems and software, are proprietary sources of competitive advantage. OEMs manufacture vehicles as "closed" systems, and seem unwilling to make them "open" to complementary innovators downstream who may want to build systems around them that are compatible. OEMs are also largely unwilling to develop brand new architectures for their vehicles with complementary firms as partners, although there may be scope for collaboration via joint ventures. Even where this is possible within a country (and Japan offers a valuable case study), competition between European, US and Japanese industry groups has prevented agreement on e.g. fast charging standards across borders (Weiller and Neely, 2014b). Some of these barriers of consumer acceptance can be overcome by providing subsidies and other forms of support that make BEVs more attractive to users (e.g. access to parking in congested urban area, access to High Occupancy Vehicle (HOV) lanes or bus lanes) but at the cost of shifting the financial problem to the government and then on to tax-payers, who
GA MOVE/FP7/265499/Green eMotion D9.6: Barriers, gaps, and commercial and regulatory framework for broad rollout of e-mobility
Page 16 of 80
may resist such costs. There is thus a further (fiscal) barrier if the full cost (including the cost of subsidies or lost fuel tax revenues) remains high compared to conventional Internal Combustion Vehicles (ICVs). Other barriers may be overcome by addressing the particular problem, whether it is informational asymmetry, a lack of incentives to cooperate, or legal and/or regulatory restrictions on who can do what. These are considered in greater detail in the second half of this report, starting at section 5.
2.1.2 Technical barriers Range anxiety has already been mentioned, and clearly has a high economic penalty revealed by the high WTP for additional range. What is perhaps more concerning is that even though EV trip distances are on average very short, range anxiety increases after experiencing driving EVs for a few months. Thus 75% of journeys in Ireland, France and Sweden are shorter than 6km, and 75% of trips in Denmark, Spain and Italy are less than 12km (D9.1, p87), 70% of daily distances in the region as a whole were less than 40km (D9.1, p144) and “4 of the 7 regions had a mean SOC (state of charge) before charge event value of 62% or higher indicating very regular charging practices.” “The mean percentage state of charge within a battery prior to a trip event is consistently high across the demo regions with the lowest at 7(D9.1, p99, emphasis in original).2% and the highest at 81%. Additionally, the highest and lowest mean values are within 10% of each other, showing a degree of consistency in user behaviour.” (D9.1, p17, emphasis in original). Thus even though most daily use is modest, reflected in the high state of charge at the end of the trips and before recharging, range anxiety was not decreased with experience: “However, the most interesting case is the importance of driving range that increases (i.e. almost doubles) after individuals had tried an EV for three months. This clearly reflects the fact that individuals tried an early version of the EV (that had low range), but still show that preferences change with experience and that a negative experience may significantly affect the diffusion of the EV market.” (D9.1, p16).
Other technical characteristics that affect performance are important, notably acceleration and top speed, which are affected by power, torque and weight, all of which may improve with further development. Thus “Acceleration is another important characteristic studied especially in the earlier researches ([1] [2] [4] [6] [7] [9] [14] [15]). Recent improvements in the EV acceleration have made this attribute less relevant for researches.” (D9.1, p20, references are those in D9.1).
“Top speed is another attribute that in this panel experiment varies significantly before and after individuals have tried an EV. As expected, the marginal utility is higher for top speeds lower than 120 km/h and, similar to the result for driving range, it increases twice as much after experience with the EV. Interestingly, the coefficients for top speeds above 120 km/h become insignificant after the experience, while for speeds above 160 km/h the coefficient is never significantly different from zero, in both waves. In line with these results the WTP point estimate for top speeds lower than 120 km/h increases from 233 Euro/(km/h) before the experience to 434Euro/(km/h) after trying the EV. Clearly, top speeds below 120 km/h are not acceptable and have a significant impact on the demand for EV.” (D9.1, p50, emphasis in original).
2.1.3 Informational barriers There are initially considerable informational barriers about the reliability and life of the battery, its replacement cost, other maintenance costs and the second-hand value of the vehicle. If EV owners do not know what deterioration might be caused by using the battery to
GA MOVE/FP7/265499/Green eMotion D9.6: Barriers, gaps, and commercial and regulatory framework for broad rollout of e-mobility
Page 17 of 80
supply these services, given that their value per EV is at best modest, and the cost of the battery is high, they are likely to be cautious and risk averse and decline invitations to offer the service. Part of the problem is that although some agents may possess that information (e.g. OEMs, battery developers, vehicle suppliers) they may have incentives to keep that information to themselves, or at the least have no incentive to incur any costs in making it available.
“Individuals tend to charge their vehicles more frequently than required and do not let vehicle batteries deplete a significant amount.” (D9.1, p17, emphasis in original). This may reflect uncertainty about the remaining range in the battery, which depends on speed and temperature. Thus one of the policy recommendations in D9.1 is that “more onboard/ during journey information with more accurate range predictions (e.g. real-time traffic, temperature, and public charging options en-route) are important” (D9.1, p19, emphasis in original). As noted above, range anxiety might not matter so much if there were a dense network of charging facilities that allowed rapid charging, but most charging (at home or offices, and slow public chargers) fails that test. If BEVs can achieve roughly 5 km/kWh (see below in Section 3.3) and are charged at 4 kW, that translates into 20 km/hr of charging time, which is not consistent with normal expectations about refuelling a vehicle on the road.
Some of these barriers can be overcome by providing warranties on the life of the battery, or leasing the battery or the whole vehicle, as well as rentals, which is a standard way in which potential consumers can become familiar with the characteristics of new vehicles, as well as providing one of the potential market segments. D9.8 (Winther and Holst, 2014, hereafter D9.8) found it surprisingly difficult to accurately describe the state of health of a battery, although they “found a significant impact of temperature on the available energy capacity of the batteries.” (D9.8 p7) On the very limited evidence they had they “found no proof of irreversible degradation over the time span of the project. One battery did break down at the age of 4 years, but even this was relatively easily repaired. Our tests confirmed that the battery performed as new after the repair.” (D9.8 p7, emphasis in original).
The evidence from the D9.1 trials is that information derived from experience can work in either direction. As noted above, experience increases range anxiety and the WTP for greater range, perhaps as the fear of being stranded, even on isolated occasions, becomes more apparent. On the other hand, “with more driving experience respondents (especially women) show more positive attitude towards the driving performance of EVs and less concern about getting used to charging these cars. On the other hand, after having tried an EV, respondents do become more sceptical about EVs. In particular, they express more concern about the ability to maintain their present mobility with an EV. (D9.1, p16, emphasis in original).
2.1.4 Utilisation barriers Utilisation barriers are considered in greater detail in Section 5 below and summarised here. One of the barriers to infrastructure deployment is the proliferation of fast charging standards (which differ in Japan, and the US/Germany) and clearly standardisation is particularly important in Europe where EVs will need to be able to travel between different countries (and use all available charging networks). After that, it must be easy for EVs to locate charging poles, which requires an agreed standard form of signage, as well as on-line access (via mobile phones or satellite navigation devices) to locate the nearest unoccupied charging point.
GA MOVE/FP7/265499/Green eMotion D9.6: Barriers, gaps, and commercial and regulatory framework for broad rollout of e-mobility
Page 18 of 80
Another potential barrier is the ability of EVSE owners or operators to supply electricity and hence widen the range of possible infrastructure supply options. According to IEA (2013), in some countries only regulated utilities are allowed to sell electricity directly to consumers, which would dramatically limit the potential suppliers of EVSEs, or at the least would raise the complexity of using the EVSE, as it would require a payment to the electric utility and another payment to the EVSE owner/operator or an indirect way of charging – perhaps for time spent charging with the electricity notionally free. Again this might be overcome with the right protocols for communicating and charging, but at the cost of increased complexity. An additional barrier to the entry of EVSEs is the requirement in some countries or on some types of roads (e.g. motorways, toll roads) for service stations to hold a licence or be part of a franchise. If only the existing road fuel stations are allowed to offer vehicle services, and if they are owned by oil companies, then they may be reluctant to offer charging poles that might be seen as undermining their main market, and might attempt to prevent dedicated charging places setting up in competition. While such barriers can be addressed by standard competition law, it may be more difficult to persuade existing service stations to install charging poles, as they will argue (plausibly) that forecourt parking space is in short supply and the time take to charge reduces vehicle throughput substantially per square meter of space. In addition given the doubtful business model for inter-urban charging stations except as part of an EVSE network willing to cross-subsidize “security of supply” charging points, existing service stations are likely to require heavy subsidies to provide EVSEs, and it would be challenging to build this into a viable business model. One possibility is that large motorway service areas often have fast food outlets, which might naturally offer fast charging as a customer inducement to break their journeys. The business model assessment for public charging infrastructure can be found in D9.4, which will have an updated version at the end of the project (February 2015).
Public charging poles have high overheads, and are viewed as insurance options by EV users, who are willing to pay for additional charging facilities (when offered battery swap facilities, D9.1 p43). That suggests the need for a subscription model, in which case it becomes important to offer roaming facilities to enhance their insurance value. The two key (related) issues that emerge in the GeM vision of future mass roll-out of EVs are the importance of a communications standard and ICT Platform to identify users, enable roaming and billing, and of a Clearinghouse to simplify financial transactions and contract management, structured as a Business-to-Business (B2B) intermediary. See section 5.3.
2.2 Cost of overcoming barriers In order to judge whether there is some value to be shared in the first place, it would be appropriate to start with an estimate of the private and social cost of BEVs, which, together with an evolution of the number of BEVs over the period to 2020 and perhaps even to 2030, will provide an estimate of the cost of supporting their roll-out and hence the fiscal burden, which will be one of the major barriers. Ideally there will be a time when BEVs become socially profitable (that is, privately profitable without any subsidy). At that time it should be possible for the business models for the various elements in the whole delivery system of Green eMotion (GeM) each to be profitable, assuming the removal of the final barrier of distortions that prevent market prices reflecting the underlying efficient prices. The final step in this analysis would be to estimate the cost of underwriting the transition to the eventual sustainable BEV deployment, and checking that it is justified in terms of the subsequent EV benefits – essentially the environmental benefits that can be reaped after commercial viability is reached. Both the costs of reaching sustainability and the subsequent
GA MOVE/FP7/265499/Green eMotion D9.6: Barriers, gaps, and commercial and regulatory framework for broad rollout of e-mobility
Page 19 of 80
benefits will depend on the rate and extent of EV penetration. As a working hypothesis, Rösler (2013) provides three examples of possible scenarios (Business as Usual, BAU, Moderate Penetration and Fast Penetration), of which the last two coincide until 2020, reaching 2% penetration by that date. Figure 2.1 shows the various scenarios to 2050.
Figure 2.1 Examples of possible penetration of BEV cars as share of total fleet
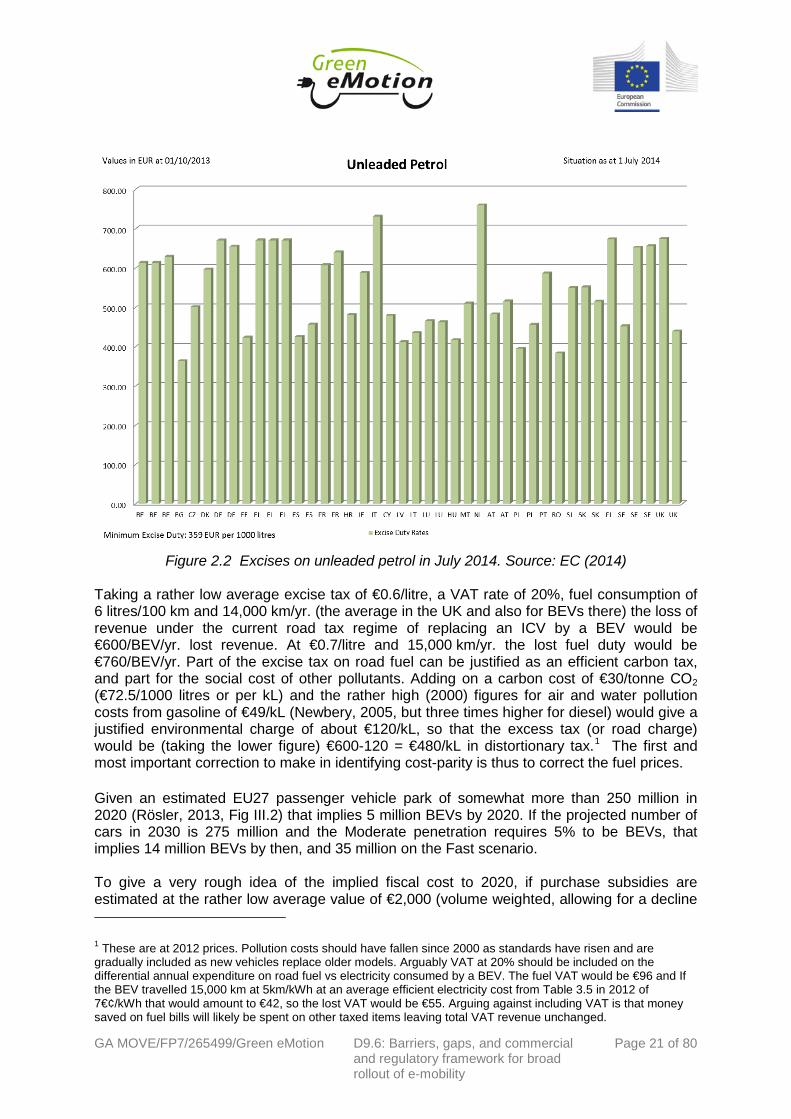
Looking across the core EU countries, the 2014 excise taxes on unleaded gasoline required to fund the transport system (and generate additional tax revenue above that) lie mainly between €600-700/1000 litres (EC, 2014 and Figure 2.2), on top of which the fuel and excise tax bear VAT at rates typically around 20%.
0%
10%
20%
30%
40%
50%
60%
2010 2015 2020 2025 2030 2035 2040 2045 2050
Reference
Fast
Moderate
GA MOVE/FP7/265499/Green eMotion D9.6: Barriers, gaps, and commercial and regulatory framework for broad rollout of e-mobility
Page 20 of 80
Figure 2.2 Excises on unleaded petrol in July 2014. Source: EC (2014)
Taking a rather low average excise tax of €0.6/litre, a VAT rate of 20%, fuel consumption of 6 litres/100 km and 14,000 km/yr. (the average in the UK and also for BEVs there) the loss of revenue under the current road tax regime of replacing an ICV by a BEV would be €600/BEV/yr. lost revenue. At €0.7/litre and 15,000 km/yr. the lost fuel duty would be €760/BEV/yr. Part of the excise tax on road fuel can be justified as an efficient carbon tax, and part for the social cost of other pollutants. Adding on a carbon cost of €30/tonne CO2 (€72.5/1000 litres or per kL) and the rather high (2000) figures for air and water pollution costs from gasoline of €49/kL (Newbery, 2005, but three times higher for diesel) would give a justified environmental charge of about €120/kL, so that the excess tax (or road charge) would be (taking the lower figure) €600-120 = €480/kL in distortionary tax.1 The first and most important correction to make in identifying cost-parity is thus to correct the fuel prices.
Given an estimated EU27 passenger vehicle park of somewhat more than 250 million in 2020 (Rösler, 2013, Fig III.2) that implies 5 million BEVs by 2020. If the projected number of cars in 2030 is 275 million and the Moderate penetration requires 5% to be BEVs, that implies 14 million BEVs by then, and 35 million on the Fast scenario. To give a very rough idea of the implied fiscal cost to 2020, if purchase subsidies are estimated at the rather low average value of €2,000 (volume weighted, allowing for a decline
1 These are at 2012 prices. Pollution costs should have fallen since 2000 as standards have risen and are gradually included as new vehicles replace older models. Arguably VAT at 20% should be included on the differential annual expenditure on road fuel vs electricity consumed by a BEV. The fuel VAT would be €96 and If the BEV travelled 15,000 km at 5km/kWh at an average efficient electricity cost from Table 3.5 in 2012 of 7€¢/kWh that would amount to €42, so the lost VAT would be €55. Arguing against including VAT is that money saved on fuel bills will likely be spent on other taxed items leaving total VAT revenue unchanged.
GA MOVE/FP7/265499/Green eMotion D9.6: Barriers, gaps, and commercial and regulatory framework for broad rollout of e-mobility
Page 21 of 80
in subsidies as volumes increase) the 5 million BEVs would require €10 billion to 2020.2 As noted above the distortionary fuel tax element is €580-700/kL. Taking a rather low average of €0.6/litre and 6 litres/100 km and 14,000 km/yr. (the average in the UK and also for BEVs there) this would be €500/BEV/yr. lost revenue. If growth from the current stock is steady then between 2014 and 2020 the cumulative number of EV years will be about 11 million EV years, so the total lost fuel revenue might be a further €5.5 billion (in addition to purchase and licence fee subsidies). At €0.7/litre and 15,000 km/yr. the lost fuel duty would be €630/EV/yr. and just under €7 billion cumulative lost fuel duty revenue. If we calculate these costs for a single country like the UK, 2% of the car park would be 570,000 vehicles and the fuel tax loss at €0.67/litre would be €560/EV/yr., or for the 1.25 million EV years to 2020 about €700 million. Avoiding the annual road tax of £140 would cost €165/EVyr or a further €200 million, even ignoring any purchase subsidies. If the current grant of £5,000 were to be maintained until 2020 that would add €3.36 billion, and clearly that is unlikely to be viable (plans to remove the subsidy within two years have already been announced – see footnote 2). These fiscal costs are potentially significant even at low (2%) levels of penetration, and need to be recognised as one of the barriers to public acceptance. It also points to the importance of recognising the various taxes and subsidies on ICVs and BEVs when making economic comparisons. There could be off-setting benefits if electricity prices continue to over-charge off-peak use and under-charge peak use if BEVs charge mainly at off-peak hours. In addition, a switch to road pricing and away from road fuel taxes would reduce the fiscal cost, and may become feasible once BEVs reach (social) cost parity. The logical place to start an analysis of barriers and gaps is with the attractiveness and economics of using BEVs, as if they are viable at some level of penetration, the infrastructure needed to support them is more likely to be delivered, although again there are barriers and gaps that will need to be addressed to support their deployment (see e.g. Tecnalia, 2014b). In short, the business case, and behind that the underlying economics of BEVs, determines the size of the market to be met by the infrastructure. The approach adopted here is to address the need to reduce the key barrier – the high initial cost of the battery – and identify the circumstances in which mass roll-out of BEVs may become economically viable.
2 The UK offered subsidies of £5,000/EV but these may be phased out by 2016 (source: Mail online, 5 Sep 2013, at http://www.dailymail.co.uk/news/article-2411883/5k-electric-car-grants-scrapped-experts-incentive-did-little-help-environment.html. Other countries also offer various subsidies (e.g. up to €7,000 in France but not more than 30% of the pre-tax price) or registration fee exemptions (worth 105% of the purchase price in Denmark) or annual circulation fees (e.g. Germany and Italy). The US government provides subsidies of $7,500 which is augmented by additional subsidies in some states and manufacturer discounts (e.g. $4,000 on the Chevy Volt which still leaves it costing $8,000 more than the Chevy Cruz on which the Volt is based – see http://dddusmma.wordpress.com/2013/07/19/ev-and-phev-sales-update/). There appears to be growing resistance to offering purchase subsidies where these are seen as subsidies to richer families to buy second cars, particularly as the environmental benefits will only be forthcoming once the electricity system has reduced its carbon intensity considerably.
GA MOVE/FP7/265499/Green eMotion D9.6: Barriers, gaps, and commercial and regulatory framework for broad rollout of e-mobility
3 The economics of EVs 3.1 Perceived advantages and disadvantages of BEVs The main barriers to consumer acceptance of BEVs are range anxiety and purchase cost, although TRL’s (2013) survey3 found that a lack of knowledge about all aspects of buying and using BEVs was one of the main short-run barriers likely to be eroded with increasing penetration. Test drives were helpful in alleviating this barrier, but only for those who had decided purchasing a BEV would be worth further investigation. Concerns over the second-hand value and battery life were also important, as these clearly affect use costs. As many customers buy cars second-hand, the residual life of the battery is clearly important. One of the websites that offers second-hand BEVs offers a 6-month warranty, which seems hardly reassuring.4 Not surprisingly, the main motive for buying a BEV is the saving of fuel costs (nearly 60% noted this), although this is in large part the avoidance of very heavy road fuel duties, as noted above. Avoiding paying the annual road tax (£140/year from a car less than 1550cc in the UK) was also seen as a benefit, although not decisive in the purchase decision (unsurprisingly as it is modest compared to the annual fuel cost saving). Annual mileage driven was lower for BEVs than PHEVs, with 68% driving less than 12,000 miles per year (19,000 km) and the average 8,850 miles (14,000 km). 88% of two-car families claimed that the BEV was the main vehicle used, which is consistent with most trips being short and therefore well-suited to the BEV range (and it would clearly be cheaper to use the BEV for such trips). Trip patterns of BEVs were similar to all vehicles in the National Travel Survey, with short trips predominating (shopping, school runs, visiting friends, and commuting). In addition to fuel economy, these early adopters were motivated by the assumed environmental benefits and were attracted by novelty. Grants were very or fairly important for 85% of those sampled, while access to the Plug-in Places (PiP) charging infrastructure (see below) was important for 40% (but the sample had been constructed so that only half those surveyed were in the PiP areas. The qualitative survey revealed a variety of interesting reactions, such as how difficult it was to find basic information such as range on the battery charge (and how this would vary with speed, such as motorway vs town driving, and temperature, especially for winter driving), how long it would take to charge the battery at home and how to do it, as well as information about acceleration, speed, and battery life. Users appreciated the rapid acceleration and comfort once they had acquired the EV, as well as the lack of engine noise. Given the uncertainty about the resale value some users decided to lease or rent. As most users surveyed had another car, one reaction was to replace the EV and the other car with a PHEV to get the best of both worlds. Contented customers mentioned that the range of the EV fitted into their daily commute or periodic journey length and the convenience of charging at home rather than travelling to a petrol station.
3 The sample size was 512 organizations and 327 private individuals who between them had 51 PHEVs and 141 EVs. The survey was conducted at the end of 2012. Notably the EV was the sole car in only 20% of households. 4 http://www.gemelectriccars.co.uk/used-electric-cars-for-sale.php accessed 13/11/13
GA MOVE/FP7/265499/Green eMotion D9.6: Barriers, gaps, and commercial and regulatory framework for broad rollout of e-mobility
Range anxiety was felt particularly acutely by women, but the evidence shows that all potential users considered the limited range was a critical deterrent. One common criticism was that the achieved range was less than the advertised range and that the indicated range remaining was prone to sudden falls. Winter driving lowered range more than expected (in one case from 80 miles to 50 miles). Preheating before disconnecting the charger helped. Users were also deterred from motorway use as range drops rapidly with the faster speeds common on motorways. MacKay (2013) shows that the power needed to overcome air resistance rises as the cube of the speed, as does braking (BEVs recovered half the kinetic energy from braking as they regenerate and recharge the battery). This implies that the energy required for a given distance (kWh/km) only increases as the square of the speed. The power needed to overcome rolling resistance is proportional to speed and at 110 km/h would be 3 kW/tonne or about 15% of the total, as the drag dominates at higher speeds, which is why motorway driving reduces range.5 The lack of a rapid public charging network on motorways and at destinations such as hotels and restaurants was seen as a problem, but there was felt to be little need to have public charging points close to home or work where private charging was available – although this might reflect a high proportion of convenient home/work parking places such as garages – nor at shops or supermarkets as these are close to home/work. Half those surveyed had a home charger installed but some used a standard 13 amp socket which takes longer to charge (but charging overnight was considered satisfactory and avoided the considerable cost of £1,000 for a home charger). More than 80% of EV users had never charged at work or on-street, confirming that home charging is the preferred mode, with 44% charging every day and almost half charging regardless of the state of discharge. Off-peak tariffs had a strong effect in that 72% delayed charging until the off-peak period (after 9pm) while those without an off-peak tariff were twice as likely to charge between 5-9pm as after 9pm. One conclusion that might be drawn from this is that the high capital cost and low running costs favour intensive use, but the slow charging rate and the limited range are not very consistent with this, except for very specific niches, such as regular medium distance daily commuting and shopping, while having access to a longer range vehicle. It may be that taxis with access to a charging pole at every taxi rank might be viable but matching the dwell time with the desired rate of utilisation may be challenging. The other conclusion is that the public charging places are likely to be relatively under-used, given the evident reluctance to charge except at home (and possibly work) and the time charging would take. A counter-argument is that a shared-ownership model like Zipcar6 would logically choose a parking place with charging pole in an accessible location, near work, shops or dense residential areas.
3.2 Social cost benefit analysis of BEVs A social cost-benefit analysis (SCBA) determines the value to the economy of the project or policy, including non-monetised costs and benefits (to the environment, health, and welfare); while a business case determines the profit to the private sector.7 By definition the non-
5 Ignoring all braking for motorway driving a car at 110kph needs 20 KW for drag and 3 kW for rolling resistance, so if the electric motor is 85% efficient the power needed would be 27kW (considerably less than the 80kW of e.g. the Nissan Leaf), and the power consumed would be 25 kWh/100km. See MacKay (2013, p256) and note that without drastically reducing air resistance by reducing frontal area this is an absolute physical limit. 6 See e.g. http://www.zipcar.co.uk/ 7 Most comparisons of the Total Cost of Ownership use tax-inclusive prices and often also subsidies. See e.g. Aguirre et al (2012), Al-Alawi and Bradley (2013), Element Energy, 2013, fig17; EPRI (2013), Kley et al (2011), Madina et al (2012), Prud'homme and Koning (2012). There is a small number of social cost benefit studies of
GA MOVE/FP7/265499/Green eMotion D9.6: Barriers, gaps, and commercial and regulatory framework for broad rollout of e-mobility
monetised costs and benefits do not appear in the market prices, but market prices may also differ from the efficient prices needed to measure social costs and benefits. Market and efficient prices differ for various reasons, of which the most important is that governments need to raise revenue by taxation, and companies may need to recover fixed costs by adding a mark-up to the marginal cost, in both cases by distortionary additions to efficient prices. In the case of BEVs, the SCBA and business case will likely further diverge as there will need to be subsidies to overcome barriers (including ignorance and uncertainty), develop the market, fund R&D and deliver other learning benefits. These subsidies are part of the policy towards BEVs, and as such it is necessary to evaluate this policy through a proper SCBA. The policy will be justified if its cost is outweighed by the eventual benefits once BEVs will have become commercially viable and deliver additional environmental benefits. The SCBA can also inform the design of policies to overcome obstacles and failures to correctly price pollutants (of which the most important is likely to be CO2 although particulates, especially from diesel engines are particularly damaging to health). The business case will determine what additional support and/or subsidies are needed, and these will be the fiscal and other costs invested in delivering what is hoped to be eventually a socially profitable EV policy. If we could project future vehicle costs and performance (which seem the major barriers to making BEVs commercial), then it should be possible to undertake an SCBA, at least given projections of fossil transport fuel prices, carbon costs, and future vehicle performances. While the latter are uncertain, they raise no essentially different problems from those in making decisions on, e.g., the choice of generation technology. In the case of battery technology, there appears to be greater uncertainty on which technology may eventually emerge as the winner, and what it may cost (or even whether batteries will be superior to zero-carbon hydrogen fuel cells).8 That suggests a different approach to the normal SCBA. Instead of making an estimate of whether (or with what degree of confidence) BEVs will be attractive on social cost-benefit grounds at some future date, it is conceptually simpler to estimate a target for the “fuel” costs of a BEV, namely the cost of the battery per kWh delivered (on average over the battery life-time, which is also uncertain) and the cost of the electricity. In order to do that, one needs to be clear that other attributes of the BEVs and the ICVs are comparable, or where costs differ, that they are considered as part of the target EV fuel cost. Clearly some features of both kinds of vehicles are likely to be almost identical (size, comfort, frame, etc.) but others, specifically the drive train and the fuel tank/battery, will differ, as may maintenance costs. For a given weight of the ICV, the engine size and weight, capacity, comfort and associated features such as air conditioning etc. will determine the size and weight of the total vehicle, which given the engine characteristics will determine its performance. A comparable EV will have a higher battery weight, presumably lower drive train weight, but as it is likely to be heavier, it might seem to require a higher power output in
EVs that remove taxes and add environmental costs, including an early one by Carlsson and Johansson-Stenman (2003) and one examining the 2010 case in Denmark (Christensen and Christensen, 2011), but they are concerned just to judge whether the example chosen is socially attractive, not what would be required for this to be the case in future. 8 MacKay (2013) argues that hydrogen fuelled cars are ten times more energy intensive than the Tesla EV (which claims 0.15 kWh/km) while the Honda fuel-cell car, the FCX Clarity, consumes 69 kWh/100 km but energy is needed to generate the hydrogen. See Chapter 20 in http://www.withouthotair.com/download.html. Whether the cost of fuel cells with hydrogen derived from natural gas with CCS might be competitive given the speed of refuelling and their range remains to be seen but looks doubtful.
GA MOVE/FP7/265499/Green eMotion D9.6: Barriers, gaps, and commercial and regulatory framework for broad rollout of e-mobility
kW for the same performance. However, an electric motor can reach higher output more rapidly than an ICE, and so a higher power may not be necessary. The economics will then depend on the purchase cost of the vehicle and its expected life, its fuel consumption (kWh/km) under varying driving cycles, which will depend on performance and weight and for BEVs, the external temperature, maintenance costs, the rate of deterioration of the battery (number of kWh before degradation), and its resale value, as well as the charging rate. Offsetting this to some extent, the EV may be able to sell ancillary services to the electricity system, whose value will depend on the least cost alternative way of securing those services. It is even possible that a BEV will be better suited to future smart-car technology, such as automatic driving and even driverless delivery of the EV to the driver upon an electronic request (although Plug-in electric hybrid vehicles, PHEVs, and even ICVs may also be able to supply such services when they are road-tested and become cost-effective).9 ANL (2009) sets out a methodology to make realistic comparisons between different vehicles, including fuel cell, hydrogen combustion, and varying range PHEV (but not pure BEVs). It starts from specifying performance in acceleration, top speed, and sustained speed on a grade, and then deduces the power needed for different sized vehicles. The reference vehicle is a 2007 ICE spark ignition (SI, i.e. gasoline) vehicle, and it makes projections to 2045. The alternative reference vehicle against which to compare BEVs is a compression ignition (CI, i.e. diesel) ICE vehicle, which, like BEVs, are both more costly but more fuel efficient. ANL (2009, Table 3-11a) gives the estimated 2015 costs for the reference CI diesel motor plus additional exhaust costs as €(2012)3,860 and for the SI gasoline vehicle as €(2012)1,941.10
The crucial cost differences apart from the battery are the motor and its associated control equipment. Delft (2011) breaks down these costs for BEVs as the sum of the motor, the inverter, the converter, the converter for other electrical equipment, and the regenerative brakes. The 2012 cost is estimated at €475+ €21*kW, so for a 75kW BEV the cost would be €2,050. Very roughly it would seem that a BEV has the same motor cost as an SI gasoline ICV, and that an IC diesel ICV would be perhaps €1,900 more expensive.
More recent cost estimates looking forward to 2030 are provided by Contestabile et al (2011).Their central cost estimate for the IC 80kW SI gasoline ICV in 2030 for the engine and mechanical transmission (gearbox) is $(2010)3,480, to which must be added $425 for the fuel tank and pollution control (or €2,930 in total), with considerably enhanced performance. At that date the central cost estimate for an electric motor and power electronics for a BEV is $2,000 (€1,500), a cost advantage (ignoring the battery) of €1,430. Using their pessimistic cost estimates (closer to a 2010 cost base) the differential advantage would fall to €1,160. This is about the cost of the gearbox for an ICV, and it is not clear whether ANL includes the gearbox costs, which might explain the apparent cost parity of gasoline and electric drive trains. That suggests taking the 2030 case favourable to BEVs as enjoying a cost advantage
9 Weiller and Neely (2014b) provide an excellent example of two smart city projects in Japan, designed to integrate smart energy, smart mobility and an ageing population by providing autonomous public BEV taxis that are better suited to public demand than inflexible and infrequent public transport, and which meet the objective of high utilisation required of such a capital intensive form of transport. 10 The conversion from US$(2007) to €(2012) euros is problematic as the exchange rates changed considerably over the period. The conversion from $ to £ in 2007 was £0.57 = $1, the price inflation in £ from 2007 to 2012 was by a factor of 1.19 and £(2012)=€1.2. The conversion from $2009 would be 24% higher.
GA MOVE/FP7/265499/Green eMotion D9.6: Barriers, gaps, and commercial and regulatory framework for broad rollout of e-mobility
Page 26 of 80
of €1,430 and in 2015 as €1,000, but assuming no difference in costs in the unfavourable case.
3.3 Target net battery and electricity costs The implication for the social cost-benefit analysis of BEVs is that it is desirable to compare fuel costs in ICVs as the retail price less all excise taxes and VAT, but including various levels of carbon (CO2) taxes that might be expected in the future. In addition to adding the correct carbon tax, fossil fuels give rise to various air pollutants (e.g. as estimated in Newbery, 2005) and their costs (shown in the appendix) need to be added. Table 3.1 provides the UK Government’s forecast ranges for future oil prices and the traded cost of carbon for 2015, 2020 and 2030 for comparison with evolving BEV costs.
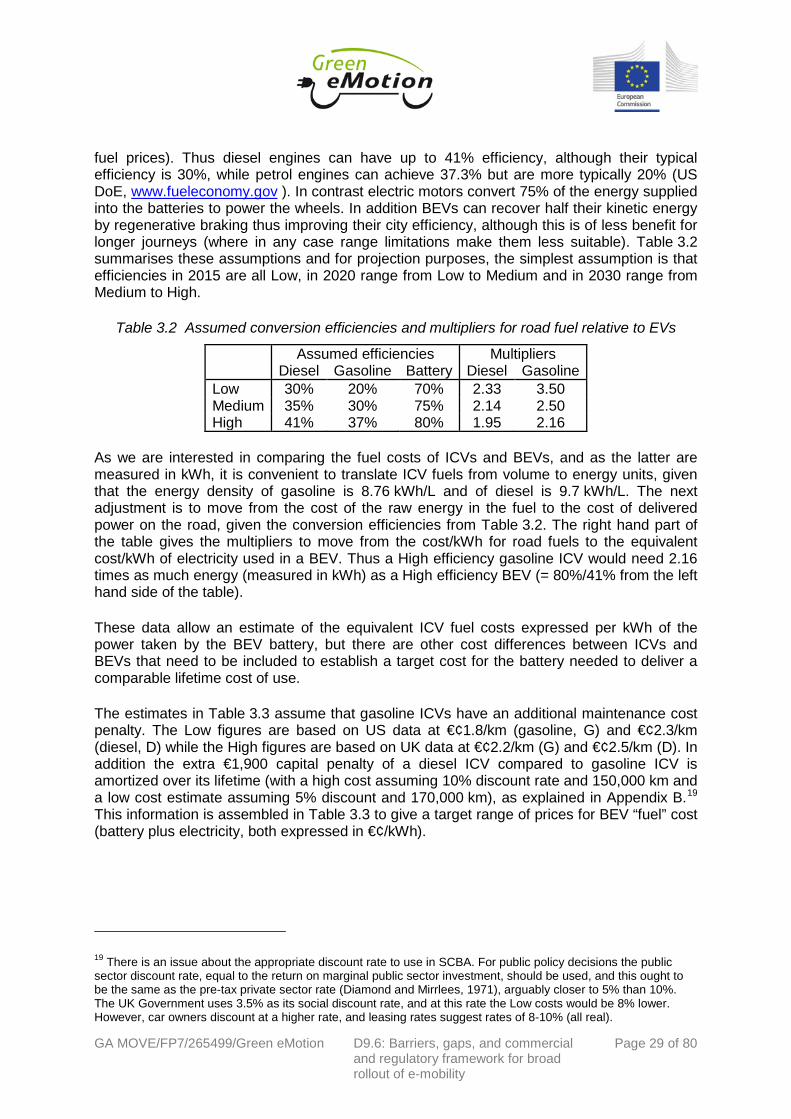
The natural way to project future transport fuel prices is to start with the future price of oil in US$/barrel, then add on refining and retailing margins to arrive at a pre-tax fuel cost at the pump. This is not simple as gasoline and diesel are joint products and their relative price depends on relative demand. In addition, oil prices have been both volatile across time (see Figure A.1), and also, since 2011, have diverged between the USA and Europe as a result of shale oil. The relative wholesale and pre-tax retail prices of gasoline to diesel and each to oil (measured per litre, L) have also varied quite widely across countries, as discussed in Appendix A. It is therefore not simple to move from forecasts of oil prices (given in US$/bbl) to wholesale product prices and instead we take a range as explained in Appendix A. These wholesale prices are adjusted to the pre-tax retail price by adding the retail margin of roughly US (2012) ¢8/L for gasoline, ¢10/L for diesel.11 The next adjustment is to add on carbon costs based on the DECC (2012) assumed traded values, noting that the carbon content of fuels is 2.68 kgCO2/L for diesel and 2.36 kgCO2/L for gasoline. The final adjustment is to add predicted pollution costs. These are derived from Newbery (2005), and at 2012 prices they would add US¢6/L to gasoline and US¢8/L to diesel fuel. These might be expected to decrease over time with rising standards, and are assumed to have fallen to 60% of these values by 2015 in the central case, to 50% by 2020 and to 40% by 2030, in each case with the low value at 0.75 and the high value 1.25 times as much. The results of these calculations are gathered together in Table 3.1. Note that once the carbon and pollution costs have been added and the excise taxes removed, gasoline is cheaper per litre than diesel, although preferential tax treatment in many countries (but not in the UK) leads to diesel pump prices lower than gasoline pump prices. This differential tax advantage may change in future with the growing awareness of the health costs of diesel particulates.
In addition to fuel cost and drive train cost differences, BEVs should have lower maintenance costs compared to ICVs. Again, evidence on BEV maintenance costs is hard to find and somewhat anecdotal, but that for ICVs is well documented. The cost of tyres would seem to be the same for all vehicles, arguably slightly more for the heavier Diesel ICV and BEVs. The UK AA12 gives the service and labour costs as follows - Gasoline: €¢3.3/km; Diesel:
11 US margins for gasoline are readily available at http://energyalmanac.ca.gov/gasoline/margins/index.php and are about 6-8 US¢/L but diesel margins are harder to find and may be somewhat higher (see e.g. http://www.forecourttrader.co.uk/news/fullstory.php/aid/8496/Diesel_3_pence_per_litre_more_than_it_should_be_says_AA.html). UK gross margins are higher at 12 US¢/L (http://www.ukpia.com/files/pdf/ukpia-briefing-paper-understanding-pump-price.pdf) 12 At https://www.theaa.com/motoring_advice/running_costs/
GA MOVE/FP7/265499/Green eMotion D9.6: Barriers, gaps, and commercial and regulatory framework for broad rollout of e-mobility
€¢3.6/km or 8% more. More anecdotal evidence13 suggests that servicing the electric motor (but not the battery) might be one-third this cost, or only €¢1.1/km.
Table 3.1 Calculation of social cost of road fuels excluding excise taxes, US $(2012)/litre
Oil price
US$/bbl
CO2 cost US$
/tonne retail pre-tax prices US$/L
CO2 cost US$/L
Pollution US $/L Total US$/L
Date Scenario
G D G D G D G D 2015 Low $91 $0 $0.70 $0.72 $0.00 $0.00 $0.03 $0.08 $0.73 $0.81 Central $110 $9 $0.91 $0.89 $0.02 $0.02 $0.04 $0.11 $0.97 $1.03 High $130 $21 $1.11 $1.06 $0.05 $0.06 $0.05 $0.14 $1.21 $1.26 2020 Low $85 $0 $0.66 $0.68 $0.00 $0.00 $0.02 $0.07 $0.69 $0.75 Central $117 $14 $0.95 $0.94 $0.03 $0.04 $0.03 $0.09 $1.02 $1.07 High $147 $28 $1.25 $1.19 $0.07 $0.07 $0.04 $0.11 $1.35 $1.38 2030 Low $74 $61 $0.60 $0.62 $0.14 $0.16 $0.02 $0.06 $0.76 $0.83 Central $132 $121 $1.09 $1.07 $0.29 $0.32 $0.03 $0.07 $1.41 $1.46 High $191 $182 $1.59 $1.52 $0.43 $0.49 $0.03 $0.09 $2.05 $2.10
The approach adopted is to assume that gasoline ICVs have an additional cost penalty of €¢2.2/km and diesel ICVs one of €¢2.5/km. Additional information from the U.S.14 suggests somewhat lower maintenance costs for gasoline vehicle of 4.6 US¢/mile (2.2€¢/km) for a small sedan (e.g. Ford Focus) and 4.92 US¢/mile (2.4€¢/km) for a medium sedan (e.g. Honda Accord). The Vincentic 2013 Diesel Analysis shows that diesels typically have slightly higher insurance, repair and maintenance costs than gasoline vehicles. If that amounted to the extra 8% in the UK, this would amount to 2.6€¢/km.15 That implies a cost penalty of 1.6€¢/km for gasoline vehicles and 1.8€¢/km for diesel. Over 150,000km the maintenance cost penalty for an SI ICV might therefore be €2,400-3,300 and for a CI ICV €2,700-3,750, which represent considerable, although delayed, reductions to the relative Total Cost of Ownership of a BEV.16
As an example of current ICV technology, the Škoda Octavia has a combined Euro rating for the 102 bhp (76 kW) gasoline engine of 6.2 L/100 km (16 km/L, or, given the energy density of gasoline of 8.76 kWh/L) 0.55 kWh/km. For the 105 bhp (78 kW) diesel engine, the combined rating is 4.4 L/100 km (54 mpg, 23 km/L), and given the energy density of diesel of 9.7 kWh/L, 0.42 kWh/km. It is not immediately obvious what the correct comparator might be. Thus the Ford Focus EV has a similar size and suitable additional power (107 kW) and does 0.2 kWh/km, which seems typical of several vehicles (e.g. the 80 kW 2013 Nissan Leaf, according to users,17 although Nissan claims18 0.15 kWh/km on the EU test cycle). These efficiencies are current good practice but in future the efficiency of ICVs is likely to improve (under pressure of various performance standards and also in response to higher
13 At http://auto.howstuffworks.com/will-electric-cars-require-more-maintenance.htm 14 At http://newsroom.aaa.com/wp-content/uploads/2013/04/YourDrivingCosts2013.PDF 15 At http://vincentric.com/Home/IndustryReports/DieselAnalysisNovember2013.aspx 16 This is comparable to the figure of €3,000 lower O&M costs for a BEV from Tecnalia (2014a) table 16 (GeM D9.3.2) 17 John Voelcker (2013-02-08). "2013 Nissan Leaf: Efficiency Up 15 Percent to 115 MPGe from 99 MPGe". Green Car Reports. Retrieved 2013-02-1 by Wikipedia: http://en.wikipedia.org/wiki/Nissan_Leaf . 18 At http://www.eperformance.com/car/nissan_leaf.html
GA MOVE/FP7/265499/Green eMotion D9.6: Barriers, gaps, and commercial and regulatory framework for broad rollout of e-mobility
fuel prices). Thus diesel engines can have up to 41% efficiency, although their typical efficiency is 30%, while petrol engines can achieve 37.3% but are more typically 20% (US DoE, www.fueleconomy.gov ). In contrast electric motors convert 75% of the energy supplied into the batteries to power the wheels. In addition BEVs can recover half their kinetic energy by regenerative braking thus improving their city efficiency, although this is of less benefit for longer journeys (where in any case range limitations make them less suitable). Table 3.2 summarises these assumptions and for projection purposes, the simplest assumption is that efficiencies in 2015 are all Low, in 2020 range from Low to Medium and in 2030 range from Medium to High.
Table 3.2 Assumed conversion efficiencies and multipliers for road fuel relative to EVs
As we are interested in comparing the fuel costs of ICVs and BEVs, and as the latter are measured in kWh, it is convenient to translate ICV fuels from volume to energy units, given that the energy density of gasoline is 8.76 kWh/L and of diesel is 9.7 kWh/L. The next adjustment is to move from the cost of the raw energy in the fuel to the cost of delivered power on the road, given the conversion efficiencies from Table 3.2. The right hand part of the table gives the multipliers to move from the cost/kWh for road fuels to the equivalent cost/kWh of electricity used in a BEV. Thus a High efficiency gasoline ICV would need 2.16 times as much energy (measured in kWh) as a High efficiency BEV (= 80%/41% from the left hand side of the table).
These data allow an estimate of the equivalent ICV fuel costs expressed per kWh of the power taken by the BEV battery, but there are other cost differences between ICVs and BEVs that need to be included to establish a target cost for the battery needed to deliver a comparable lifetime cost of use.
The estimates in Table 3.3 assume that gasoline ICVs have an additional maintenance cost penalty. The Low figures are based on US data at €¢1.8/km (gasoline, G) and €¢2.3/km (diesel, D) while the High figures are based on UK data at €¢2.2/km (G) and €¢2.5/km (D). In addition the extra €1,900 capital penalty of a diesel ICV compared to gasoline ICV is amortized over its lifetime (with a high cost assuming 10% discount rate and 150,000 km and a low cost estimate assuming 5% discount and 170,000 km), as explained in Appendix B.19 This information is assembled in Table 3.3 to give a target range of prices for BEV “fuel” cost (battery plus electricity, both expressed in €¢/kWh).
19 There is an issue about the appropriate discount rate to use in SCBA. For public policy decisions the public sector discount rate, equal to the return on marginal public sector investment, should be used, and this ought to be the same as the pre-tax private sector rate (Diamond and Mirrlees, 1971), arguably closer to 5% than 10%. The UK Government uses 3.5% as its social discount rate, and at this rate the Low costs would be 8% lower. However, car owners discount at a higher rate, and leasing rates suggest rates of 8-10% (all real).
GA MOVE/FP7/265499/Green eMotion D9.6: Barriers, gaps, and commercial and regulatory framework for broad rollout of e-mobility
Table 3.3 Deriving the equivalent BEV target “fuel” cost, €¢(2012)/kWh
Total fuel energy content €¢/kWh
Battery energy equivalent
€¢/kWh
Maintenance penalty €¢/kWh Total €¢/kWh
Date Scenario G D G D G D G D 2015 Low 6.4 6.4 22.5 14.9 8.0 16.2 31 31 Central 8.5 8.2 29.7 19.0 9.5 19.5 39 39 High 10.6 10.0 37.1 23.3 11.0 22.8 48 46 2020 Low 6.0 6.0 15.1 12.8 8.0 16.2 23 29 Central 8.9 8.5 26.8 18.9 9.5 19.5 36 38 High 11.9 10.9 41.5 25.5 11.0 22.8 53 48 2030 Low 6.7 6.6 14.4 12.9 8.0 16.2 22 29 Central 12.3 11.6 28.8 23.8 9.5 19.5 38 43 High 18.0 16.6 45.1 35.6 11.0 22.8 56 58
Source: Table 3.1 and Table 3.2, and own calculations (exchange rate $1.3 = €1)
Thus in 2030 Low scenario, Table 3.1 shows that the oil price is $74/bbl, the CO2 price is $61/tonne so the gasoline cost is 6.7€¢/kWh for the energy content. Table 3.2 High shows that gasoline efficiency is 37%, diesel efficiency is 41%, battery efficiency is 80%, and the multiplier for gasoline is 2.16 so the battery energy equivalent cost is 2.16 x 6.7€¢/kWh = 14.4€¢/kWh. Adding on the maintenance cost penalty of 8€¢/kWh so Table 3.3 2030 Low shows (in the right hand columns) that the target EV “fuel” cost is €¢22/kWh compared with the cheaper gasoline ICV, (€¢29/kWh for diesel). In the 2020 High scenario the oil price is $147/bbl, the CO2 price is $28/tonne, gasoline efficiency is 20%, diesel efficiency is 30%, battery efficiency is 70% (the same assumptions for all the 2015 scenarios), and the target EV “fuel” cost is €¢48/kWh compared with the cheaper diesel ICV, (€¢53/kWh compared with a gasoline ICV) as shown 2020 High line of Table 3.3.
The final column of Table 3.3 shows that unless oil and carbon costs are high, the extra capital cost (in the maintenance column) makes diesel ICVs more costly per kWh delivered in power for travel (as opposed to power contained in the fuel shown in the first two columns) when compared to gasoline ICVs.
3.4 Current estimates of battery and electricity cost evolution In order to see whether the target electricity and battery costs are realistic (or by what date they may be) it is useful to collect current evidence and projections for the costs of the battery and of charging the EV. While it may be thought that the cost of electricity is relatively easier to estimate and even forecast, a closer inspection reveals that to be far from the case, as the wholesale cost of generating electricity varies significantly by time of day and day of the year (windy or not, summer or winter, etc. and depending on the marginal cost of generation, which might be zero if wind is spilled, to very high if fossil fuel paying a high carbon price is at the margin). It also varies by location, particularly across countries with their different fuel mixes and marginal generation plant, but also within countries when transmission congestion isolates areas and hence leads to differing marginal costs of supply within that area. To the (local) wholesale marginal generation cost must be added the marginal cost (including the scarcity cost) of delivering that electricity to the EV, which depends critically on whether there is spare transmission and distribution capacity, which in turn will depend on the time and volume of charging at each location. Given the complexity of determining the likely efficient price of electricity, the evidence on battery costs is reviewed first.
GA MOVE/FP7/265499/Green eMotion D9.6: Barriers, gaps, and commercial and regulatory framework for broad rollout of e-mobility
Page 30 of 80
3.4.1 Battery cost In anticipation of better data from the GeM project, this report has had to rely on published sources to gain some sense of current and potential future battery costs. The various reports used to derive costs are provided in Appendix B at p69. The range of battery pack costs depends on source, discount rate and distance travelled, even assuming that all batteries last 10 years and can deliver 170,000 km.20 The results from Element Energy’s conservative and optimistic estimates (which cover the range of the other estimates and are given in Appendix B) are summarised in the top part of Table 3.4. In addition to the battery cost there is the cost of the home charger, shown in the central part of Table 3.4. The other correction to make in the other direction is the credit for the lower drive train cost of BEVs compared to the reference gasoline ICV, taken as rising to €1,430 by 2020. Although it is natural to express the costs per km driven, for our purposes the more useful cost is per kWh, as the aim is to compute the full “fuel” cost of BEVs, which include the battery costs and also the electricity used. The lower part of Table 3.4 therefore translates the costs per km into a cost per kWh, based on 5 km/kWh, so the numbers in the top part are multiplied by 5 to give the cost per kWh. The Low (L) figures take a 2:1 weighting of optimistic and conservative values for each year of the top line, and the High (H) figures take a 1:2 weighting of optimistic and conservative values for each year of the top line.
Table 3.4 Battery cost (in €¢(2012) per km and per kWh)
Battery 2011 2015 2020 2030
lifetime 10 years
Total battery cost €¢(2012)/ km
at 5%, 17,000 km/yr 11.6 6.7-8.2 4-6.2 3.1-4.2 at 10%, 15,000 km/yr 16.6 9.5-11.6 5.7-8.9 4.4-6.1
home charger cost €1,600 €1,200 €800 €400 Credit for low drive train
cost (rel to gasoline) €0 €750 €1,430 €1,500 cost €¢(2012) per kWh
at 5%, 17,000 km/yr 64 38 22 13 at 10%, 15,000 km/yr 92 57 36 22
Sources: see Appendix B As BEVs become more efficient the km/kWh may increase and may already be approaching 7 km/kWh, but as efficiency rises, so the size and hence cost of the battery needed for the desired range can be reduced. Increasing efficiency increases the multiplier but lowering battery costs lowers it, so the two effects should roughly cancel out.
3.4.2 The cost of electricity While it may be thought that the cost of electricity is easier to estimate and even forecast, that is misleading. The social cost of electricity depends critically on when and where the power for charging is taken. If power pricing is competitive and undistorted, and if electricity
20 Neubauer et al (2012) use the National Renewable Energy Laboratory’s Battery Ownership Model to deduce when, given the pattern of daily use and charging, the battery will need replacement, on the assumption that the vehicle has a life of 15 years, and compare the Total Cost of Ownership (including all taxes and subsidies) of the BEV with an ICV over that time horizon. Their optimal time to replace the battery compares the cost of using alternatives for trips now not viable with the existing battery with that of replacing the battery; which varies with trip distributions and whether the user has access to a second car or has to rent a Zip car.
GA MOVE/FP7/265499/Green eMotion D9.6: Barriers, gaps, and commercial and regulatory framework for broad rollout of e-mobility
Page 31 of 80
is nodally priced,21 the wholesale spot price (and particularly the intra-day and/or balancing price) should reflect this social cost. However, in many countries there are ethical objections to retail prices varying much over space, and there are practical problems in time-of-use pricing without smart meters, so that actual retail prices are likely to be quite distorted. To repeat, the calculations here are all in terms of efficient prices or costs, and not market prices. To the relevant wholesale price must be added the cost of distribution to the charging point.
As the share of low cost plant on the system rises (wind, PV, nuclear) so the System Marginal Cost and nodal price at the export nodes could fall to near zero. That does not imply zero nodal prices at all nodes, particularly if there is adequate transmission to points of higher scarcity value, but export constraints will surely bind in many periods (otherwise transmission has been over-built), and then keep local prices low.
Several consequences follow from such granular pricing (by moment and location). First, generation will become more like transmission and distribution in that its cost will be dominated by fixed costs. Their efficient recovery is to load them onto residual (i.e. net of intermittent generation like wind and PV) peak periods. Second, wholesale nodal spot prices will become both very volatile (either near zero or at rationing levels) and unpredictable (renewables are highly weather dependent). Interconnection and storage will become more valuable and will mitigate both volatility and unpredictability, but transmission constraints will still be important in many places and for many hours, keeping prices either low or high depending on intermittent supply. The concept of an off-peak price will change from certain times of the day (e.g. late evening to early morning) to certain states of residual fossil supply (when low variable cost plant like wind, PV, or nuclear dominates).
Third, in consequence, most consumers will be hedged with contracts that will offer various options (just as there are many plans for mobile phones). The simplest and least suitable for BEVs will be a flat tariff equal to the (consumer’s) demand-weighted average cost, but with smart metering some form of peak/off-peak pricing will surely become more prevalent, possibly with some super peak hours signalled in advance (as with some current French tariff plans). More likely is the option of controllable demand where the right to allow some control over some appliances, including BEVs, will lead to a discount on the standing charge and on the power taken by such controllable devices. Contracts will either be for a fixed number of kWh/month with variable charges applying to deviations from those, or for all consumption, or for variants (all consumption except in certain pre-announced conditions). As a result some fraction of total demand in any location will face time-of-use prices and may have pre-programmed responses to such prices. Whether one describes these contracts as the standard electricity price with netting off for the benefits of controllability supplied, or just the relevant spot price, is primarily a matter of contract design and labelling.
It seems reasonable to assume that EV charging points will be required to have smart metering and one or two-way communication facilities, and by the time BEVs have more than marginal penetration, that the distribution networks (DNs) will also be adequately instrumented to monitor power flows and voltages at a sufficiently granular level to assess the capability of the network to accommodate more power flows (and their attendant
21 The EU Target Electricity Model envisages zonal pricing, with quite large price zones to facilitate trading, although nodal pricing is the efficient solution and the U.S. Standard Market Design now employed for more than half U.S. electricity consumption. Nodal pricing gives potentially different spot prices at each node or Grid Supply Point.
GA MOVE/FP7/265499/Green eMotion D9.6: Barriers, gaps, and commercial and regulatory framework for broad rollout of e-mobility
Page 32 of 80
marginal losses). As with the transmission grid, efficient DN pricing requires that each connection pays variable charges equal to the marginal system losses, plus any local DN scarcity price, plus a fixed tariff (relating to peak demand or maximum load), that recovers any shortfall in allowed revenue.
As a result EV charging points may offer two options – instantaneous charging at the appropriate locational spot price (nodal energy price at the Grid Supply Point plus the spot DN charge) or managed charging at a substantially lower price (in which the EV will be delivered charged at some future time such as 7 a.m. that can be predetermined, or adjusted with some penalty). In the second option the DN element in the total charge might be near zero if charging is managed to avoid any constraints on the DN, and if as a result no extra DN investment specifically caused by the EV were precipitated. The social cost of delivering off-peak power may then be very low, while the cost of delivering power at the peak could be very high – including not only the costs of reserve power (high reserve capacity costs plus high variable and carbon costs) but also the scarcity value of constraints on the grid (likely to be small) and the DN (possibly very high). Appendix C and Table C.1 gives quantified estimates of peak and off-peak electricity appropriate to the EU which are reproduced in the middle part of Table 3.5, which also gives the range of values for the battery and charging costs from Table 3.4. The last line gives the average of the low and high battery costs and assumes that 90% of charging is done off-peak. These BEV “fuel” costs can now be compared with the ICV fuel costs in Table 3.3. The highlighted numbers show cases in which these costs are no higher than some of the fuel cost cases in Table 3.3. Deliverable 9.2 (Imperial College London, 2014) gives an incremental system cost approach to estimating the 2030 electricity cost, discussed in Appendix C, and these are comparable to the off-peak costs shown in Table 3.5.
Table 3.5 Range of costs per kWh for battery and electricity in €¢/kWh excl. VAT
Sources: Table 3.4 and Appendices B and C. Note the range in the last line are from the Low to High net battery + charger costs.
The impact of properly determining the social cost of charging BEVs is therefore critical in the overall cost of owning BEVs, as the largest range in Table 3.5 is between peak and off-peak power. If users only charge at peak prices 25% of the time the average electricity cost could fall to €¢12/kWh by 2020. If they could avoid peak charging for 90% of the time, which would be ambitious, given the assumed rather high annual distance driven, the average electricity cost might be as low as €¢7/kWh.
Figure 3.1 shows the results visually, taking the Low and High fuel costs for the ICVs and the Low and High battery costs in Table 3.5 and circling cases where BEVs are cost competitive.
GA MOVE/FP7/265499/Green eMotion D9.6: Barriers, gaps, and commercial and regulatory framework for broad rollout of e-mobility
Page 33 of 80
The wide range of electricity costs is very clear, and by 2020 the Low and High BEV costs with off-peak electricity are competitive with the both the High diesel and High gasoline ICV costs, and as early as 2015 the Low BEV with off-peak power is comparable to High diesel ICV and cheaper than the High gasoline ICV). By 2030 off-peak BEVs are competitive against even Low ICV fuel costs and can support considerably higher electricity prices against High ICV costs. Perhaps surprisingly, uncertainty about carbon costs has less impact than uncertainty about oil prices, at least until 2030 when the carbon price range becomes very large.
Source: Table 3.5
Figure 3.1 Cost ranges for ICVs and BEVs, in equivalent €¢(2012)/kWh for BEV
Another way of comparing costs is to note that the electricity consumed driving 170,000 km at 0.2 kWh/km is only 34 MWh which might cost €2,500-2,700 in electricity charges (90% off-peak). In contrast the lifetime fuel cost (including carbon and pollution costs but excluding the maintenance credit) on the 2030 Central gasoline case would be €9,800 (battery energy equivalent columns in Table 3.3). The (undiscounted) fuel cost advantage alone is thus over €7,000 over the BEV’s life. This fuel cost advantage would be entirely lost if the BEV charged at peak rates for two-thirds of its consumption.
Assuming $5,000 (€4,000) for the optimistic 2030 battery pack cost and a drive train cost credit for a BEV that offsets the battery plus charger cost by €1,000, the additional capital cost of the BEV is only €3,000. If the BEV maintenance cost advantage of €¢2.2/km can be realised, that amounts over a lifetime to a surprisingly large €3,740 and would offset (gradually over the lifetime) the extra capital cost, leaving the advantage of cheaper (and lower carbon intensity) electricity displacing carbon-intensive gasoline. Battery cost and life,
GA MOVE/FP7/265499/Green eMotion D9.6: Barriers, gaps, and commercial and regulatory framework for broad rollout of e-mobility
Page 34 of 80
together with drive train and maintenance cost savings, are therefore critical determinants of competitive advantage.
If the target battery costs can be achieved, and if 2020 oil and carbon prices are medium to high ($120-150/bbl in 2012 prices, and $15-30/tonne CO2) and ICV performance has not improved too much, then the efficient cost per km of BEVs with a high annual distance that are able to charge at off-peak electricity costs can be lower than the cost of a comparably powerful ICVs. Under very high oil and CO2 prices and optimistic projected battery costs with only off-peak charging this might happen before 2020.
The higher capital cost of a BEV requires a high annual distance travelled to be competitive against ICVs, except in a household using BEVs intensively for shorter journeys and an ICV (owned or rented when needed) for longer journeys. The number of BEVs that meet this requirement may be modest, and confined to long-distance commuters, or other intensive users who can access cheap off-peak power, and richer two-car families. It may be that as confidence with the BEV performance grows so two-car families may abandon their now under-utilised ICV and rely on renting for longer journeys. By 2030 the range of costs of all ICVs and BEVs overlap, so there will be a wider range of circumstances in which BEVs are cheaper than ICVs.
These comparisons make no judgments about the non-fuel merits of BEVs and ICVs, where charging time, range, and weather sensitivity all conspire to make BEVs less attractive, except for the market segments listed above, of regular lengthy commutes to a work-place with charging facilities. It was for such reasons that the Committee on Climate Change (2014, Ch. 5) scaled back its projections of BEVs and replaced them with PHEVs.
In the future other developments, such as autonomous vehicles that can be summoned and used per trip may overcome these obstacles. In the meantime, some care is needed in making proper cost comparisons, given both the numerous distortions to fuel and electricity pricing, and the considerable uncertainty over future fuel prices and battery costs.
3.5 Other EVs The first EVs to gain wide-spread penetration were Hybrid Electric Vehicles (HEVs) which had sold about 6.8 million vehicles worldwide by August 2013. The most popular and well-known model is the Prius, which by June 2013 had sold 3 million worldwide.22 These have the advantage of relaxing range anxiety and the time needed to refuel, combined with the advantage of capturing about half the kinetic energy when braking or coasting downhill and allowing the ICE to stop when the vehicle stops, cutting in when required after the vehicle starts in battery mode and improving the efficiency of the ICE. The disadvantages are that the small battery (typically about 5 kWh) provides limited range on battery alone, and the extra cost of the battery and electric drive train raises the purchase price. To overcome the small all-electric range (AER) Plug-in Hybrid Electric Vehicles (PHEVs) have been developed with typically larger batteries. The best-selling example is GM’s Chevy Volt or Ampera, whose 2011/12 model has a 16 kWh battery that is guaranteed for 160,000 km or eight years. GM estimates that the Volt batteries will degrade by 10 to 30% after eight years or 160,000 km. The EPA official all-electric range is 56 km with an energy consumption of
22 Wikipedia at http://en.wikipedia.org/wiki/Hybrid_electric_vehicle#cite_note-Prius3mi-1 and Toyota Europe News (2013-07-03). "Worldwide Prius sales top 3-million mark; Prius family sales at 3.4 million". Green Car Congress. Retrieved 2013-07-03.
GA MOVE/FP7/265499/Green eMotion D9.6: Barriers, gaps, and commercial and regulatory framework for broad rollout of e-mobility
0.23 kWh/km. The total range with a full tank of gasoline and a fully charged battery is 379 miles (610 km) according to EPA tests.23 Compared to HEVs, PHEVs are more expensive because of the higher battery cost, although they enjoy subsidies in some countries, notably the US, where the American Recovery Act 2009 provides a tax credit of $2,500 for the first 4 kWh of battery, and $417/kWh up to $7,500. Thus the Chevy Volt at 16 kWh would receive the maximum federal subsidy of $7,500. This is supplemented by additional subsidies in some states, some of which offer other advantages such as access to HOV lanes. The effect of these subsidies can be considerable, so the Chevy Volt lists for around $40,000, which, with a current GM discount of $4,000 plus the $7,500 federal subsidy results in a selling price of around $28,500. This is still around $8,000 more than the Chevy Cruz on which the Volt is based.24 As a result PHEVs sell less well than HEVs, and US sales for the first half of 2013 were only 18,335, less than BEVs (22,712), and together with BEVs selling about 0.5% of total car sales. Compared with the increase in the US HEV car park of 165,746 in 2012,25 PHEVs are selling at only one quarter the rate. Peterson and Michalek (2013) report a cost-effectiveness study of PHEVs, which they compare to ICVs and HEVs, looking ahead to 2015 vehicle costs (derived from US DOE, 2011). That source gives the incremental costs of various drive train configurations at different future dates compared to a reference 2010 gasoline vehicle. Their assumed cost for a home charging unit is only $75 charging at 1.4 kW (presumably little more than a normal plug) and $1,125 for charging at 7.7 kW). It is unclear what price they assumed for electricity but the source (EIA 2011) projects about 9 US¢/kWh in 2015. The additional vehicle incremental prices (compared to the reference ICV) are assumed to be 50% higher than the forecast incremental costs, and so include margins and ignore subsidies. However, the gasoline and diesel prices (from EIA 2011) include taxes (the federal gasoline tax is 18.4 US ¢/US gallon or 3.5€¢/L equivalent to 16€/tonne CO2). If an explicit carbon price were to be added (not to mention charges for other pollutants) the required corrective fuel tax might double and so the fuel prices used probably understate the true cost. Assuming a low discount rate of 5% real, a 12 year lifetime, and solely home charging, the lifetime present discounted cost of HEVs is about $3,000 less than the reference ICV, while PHEVs are $4,000 cheaper with a 5 mile range, falling almost linearly with increasing battery size and electric-only range up to a life-time saving of $2,500 with a 25 mile (40 km) range. If the additional cost of a work-place charging unit is included then the savings are reduced by about $1,800. If consumers discount at 20% and as a result choose a loan at 8.7% and a down payment of 31%, the lifetime saving is reduced by about $2,000.26 Thus the lowest cost option is a PHEV5 with a 5 mile range (2 kWh battery). Larger batteries save fuel (and therefore carbon emissions) but cost more. A PHEV10 with an extra 5 miles (8 km) electric range needing an extra 2 kWh has a life-time extra cost of $275 and saves 165 gallons (625 L) releasing 1.4 tonnes CO2. The cost of reducing this emission would thus be €140/tonne. The conclusion is that both HEVs and PHEVs should be cost effective with low charger costs and cheap electricity compared to gasoline ICVs in 2015 (and become increasingly
23 http://en.wikipedia.org/wiki/Chevrolet_Volt accessed 31/12/13 24 http://dddusmma.wordpress.com/2013/07/19/ev-and-phev-sales-update/ 25 http://en.wikipedia.org/wiki/Hybrid_electric_vehicle 26 The case for using a high discount rate is that 80% of new vehicles are purchased by a loan.
GA MOVE/FP7/265499/Green eMotion D9.6: Barriers, gaps, and commercial and regulatory framework for broad rollout of e-mobility
competitive with falling relative costs), but that the main benefit appears to be in having a small battery to improve the efficiency of the ICE. This is based on typical use, and for those with higher daily commutes that could be combined with charging at both work and home, the economics of greater range would presumably improve, as would decreases in battery costs.
3.6 Summary of the economics of electric vehicles
The economics of BEVs depend critically on the future battery cost (specifically, the cost per kWh delivered) and the spot price of electricity when charging, as well as the cost of oil and the cost of carbon. The business case will require various subsidies as part of the program of establishing commercial viability and driving down the cost of the technology (although the balance between R&D and deployment at this stage may need careful rethinking in the light of experience in R&D and deployment outcomes). At present BEVs are explicitly subsidized through purchase grants and reduced road licence fees. They are also heavily but less obviously subsidized (in most EU countries) by escaping the fuel excise duty (which in the UK is 60p (€0.75) /L for gasoline and 70p (€0.875)/L for diesel). These translate into implicit subsidy rates to BEVs of 7.7 €¢/kWh compared to gasoline ICVs and 10 €¢/kWh against diesel ICVs. On the other hand, in some countries (Germany and Denmark are good examples) taxes on electricity can be high (see Figure C.6) and should also be ignored in making cost comparisons, while in other countries, like the UK, electricity enjoys a relative subsidy through its reduced rate of VAT that (in 2014) still more than offset the environmental charges. As an additional complication, off-peak domestic electricity is overcharged relative to its cost while peak electricity is undercharged, even where there are different peak and off-peak tariffs. Flat rate tariffs amplify this distortion, so allowing BEVs to pay average electricity prices for peak charging would involve a significant additional subsidy (arguably justified as part of the experiment to test out non-home based charging points). In addition, BEVs are given further inducements in many countries by preferential or discounted access to bus and/or High Occupancy Vehicle (HOV) lanes, congestion charging zones, and reserved parking in congested urban areas. These may be justified as ways of stimulating demand to create sufficient numbers to justify the infrastructure deployment (public charging poles, battery exchange facilities, etc.) but are clearly a start-up measure that cannot be sustained with mass roll-out (and nor can the loss of fuel excise revenue).
GA MOVE/FP7/265499/Green eMotion D9.6: Barriers, gaps, and commercial and regulatory framework for broad rollout of e-mobility
Page 37 of 80
4 Implications for the electricity system The implications of the previous sections are that impact studies (and SCBA) should be conducted at the efficient prices, which for electricity are highly locationally and temporally dependent, and for road fuels should be net of road fuel excises (but should include environmental charges such as the correct carbon price). This in turn implies that prices should be moved to their efficient level where possible so that agents make better decisions. That in turn suggests that it will be important to trial various ways in which DSOs can manage, charge, control and/or ration access to the domestic charging points. It seems likely that the efficient charges will vary considerably across different locations, as some DNs will need to be upgraded in any case and at such time can be sized at modest extra cost to handle higher loads with thus lower charges for BEVs, while others might benefit from managing loads for a longer period and need higher scarcity prices. Third, it seems clear from trials that efficient time-of-use pricing of electricity (and the distribution network) will encourage a significant fraction of EV users to control the timing of charges with considerable cost savings (TRL, 2013). Even if electricity prices are not set at efficient time-of-use levels, contracting with the DSO to control charging has the potential to considerably lower costs, provided the control equipment is not too expensive. Proposing innovative contracts between DSOs and others that simulate the effect of such pricing is an important part of early trials, to determine the extent of willingness to accept controllable charging. Another implication is that Plug-in Hybrids (PHEVs) begin to look like an attractive bridging technology, as the battery can be considerably smaller and hence cheaper (see Figure 3.1, which shows the importance of the battery cost). As most trips are relatively short, a large fraction of total distance travelled can still be electric, while range anxiety and charging time hold-ups can be removed. It may also be that substantial penetration of PHEVs would stimulate the smart home and office charging and infrastructure deployment that would support subsequent BEV roll-out, as well as creating the demand to continue battery development.
4.1 Charging infrastructure At present there are a limited number of public charging poles, and in some cases it may not be completely straightforward to locate ones that are available to particular users (although this is surely a temporary state of affairs). Thus in early November 2013, the UK had two types of public charging network: the POD Point Open Network and the Government-funded Plugged in Places (PiP) networks. POD Point claimed 940 charging points, with 60 under construction, and the website shows the locations of the ones that are currently charging, those that are available, and those that are offline.27 To quote from their website:28 “The POD Point PAYG Network is Europe’s first pay as you go electric vehicle charging network. It allows anyone with a mobile phone to access charging points across the UK. There is no membership fee – anyone can use the charge points.” In contrast (and again quoting from the POD website)29 for the PiP:
“Members pay a yearly membership fee to the PiP scheme. This varies by region but is typically about £50. Membership gives them:
• an RFID tag, providing access to free charging at all charge points that are part of that regional PiP scheme
• a user login account where they can view their usage profile • in some regions, free parking in EV charging bays • call centre support line in case of any charging problems • Additionally, the PiP scheme will maintain a website showing the locations of all
charge points on the scheme. Companies & boroughs join a PiP scheme and become a PiP scheme partner. PiP scheme partners buy and install charge points on their property, and provide electricity free of charge. The PiP scheme refunds 50% of the cost. The charge point is added to the PiP scheme, and can be used by all EV drivers who join the PiP scheme. Obligations are placed on PiP providers in return for a 50% Government subsidy:
• Ensuring the charge points you install meet the requirements of the PiP scheme • Managing the purchase and installation of the charge points • Maintaining the charge point • During an initial period (typically 3 years): • The charge point must be in a dedicated parking bay, for the sole use of PiP scheme
members • Covering the cost of electricity used by the charge point • You will not be able to bill EV drivers to use the charge points (though in many
regions you may still charge for parking) • Use of the charge point will be restricted to EV drivers who have joined the PiP
scheme (and pay an annual membership fee to the PiP scheme) • Including the branding of the PiP scheme on the charge point (alongside your own if
desired).” More details about PiP are available from the Government‘s Office of Low Emission Vehicles (OLEV).30 OLEV (2013a) provides lessons from the eight PiP projects that the Government co-funded starting in 2010, and provides a convenient model shown in Figure 4.1. The government has allocated £30 million to eight pilot regions with a target of 8,500 charging points installed. By the end of March 2013, over 4,000 charge points had been provided through the eight Plugged-in Places projects. About 65% of these Plugged-in Places charge points are publicly accessible. Using data provided by charge point manufacturers, it is estimated that non-PiP organisations may have also installed about 5,000 charge points nationwide. OLEV (2013a) identified the importance of the business case and centrality of the payment model, discussed in more detail below. One of the lessons learned is the need to be able to
30 See https://www.gov.uk/government/publications/plugged-in-places accessed on 8 Nov 2013. OLEV is a cross Government, industry-endorsed team, combining policy and funding streams to simplify policy development and delivery for ultra-low emission vehicles. OLEV currently comprises people and funding from the Departments for Transport (DfT), Business, Innovation and Skills (BIS), and Energy and Climate Change (DECC). OLEV is based in DfT which publishes the reports referenced here.
GA MOVE/FP7/265499/Green eMotion D9.6: Barriers, gaps, and commercial and regulatory framework for broad rollout of e-mobility
transition from a membership scheme to a pay-as-you-go model and to be flexible enough to accommodate to a variety of future payment models. It is important to determine when to move from free (promotional) electricity to a payment model which does not rely on government support, particularly if the scheme is funded initially as a trial or subsidised experiment (as in the PiP scheme). Such transitions would need to be clearly explained to early members. OLEV (2013a) contains an extensive check list of lessons learned for a sustainable business model, and a rich set of references to the UK experience.
Source: OLEV 2013a
Figure 4.1 Plug-in Vehicle Charging Scheme Delivery Framework OLEV (2013b) reports the high level analysis of the data collected during the trial, which is a useful adjunct to the data reported in Green eMotion (2013). OLEV (2013b) has data from 39,525 charging events at 988 charging points (an average of under 3 charging events per charging point per month). Even so, the PiP data has limitations as at the end of the 17-month trial in December 2012 there were only 4 rapid (50 kW) charging poles in operation. Rapid chargers (22/50 kW) accounted for 9% of charging events. Although most EV users charge at home overnight their charging points usually lack data capture (only 4% of the charging locations surveyed were at home but they accounted for 16% of the charges). Workplace and public poles typically charged 9am-5pm Mon-Thurs with an early morning peak from 7-9am but home users usually charged between 5-9pm. The mean amount of energy withdrawn was 6.2 kWh (equivalent to about 25 km) and the median 4.5 kWh (equivalent to about 18 km), with about one third of charging events taking 2 kWh (8 km) or less. TRL (2013) reported considerable dissatisfaction with the lack of standardization of public charging points and of payment systems, some users carrying a “whole fistful of different swipe cards from different firms” and that they could be difficult to locate with poor signage. In some cases it was hard to find out whether or not the charging point was working and frustrating to arrive and find it was not.
GA MOVE/FP7/265499/Green eMotion D9.6: Barriers, gaps, and commercial and regulatory framework for broad rollout of e-mobility
Page 40 of 80
IEA (2013) provides a description of the current (2013) situation globally and an outlook to 2020. Thus at the end of 2012 Europe accounted for 26% of the global stock of 180,000 BEVs compared to 230 million passenger cars (or 0.02 of 1% of the total stock of passenger cars), compared to 38% in the U.S. and 24% in Japan. Sales in 2012 doubled compared to 2011 to 113,000. The stock of Electric Vehicle Supply Equipment (EVSE, i.e. smart charging points) was 46,000 slow chargers (almost certainly an underestimate as not all home chargers are accounted) and 1,900 fast chargers. RD&D expenditure in EV Initiative (EVI) countries between 2008 and 2012 was US$ 8.7 billion (or nearly $50,000 per EV delivered over that period). Of this some $1.25 billion has been spent on battery development, which has lowered their cost over this period from $1,000/kWh to $485/kWh, as shown in Figure 4.2,31 while demonstration costs were over $2.5 billion (IEA, 2013, fig 15). EVI countries have a target of 5.9 million BEVs by 2020 (a penetration of 2.4%), which would require a compound rate of growth of 72% p.a. from 2011. Plug-in Hybrids (PHEVs) would seem an attractive bridge technology that allays range anxiety while providing a large share of electric-only driving in many situations. Half of all EV car sales in 2012 were PHEVs, and 70% of those were sold in the US, while only 26% of BEVs were sold there. In contrast Japan sold 2.4 times as many BEVs and PHEVs (presumably the lower fuel taxes in the US may account for some of this disparity). Given that one survey of American consumers found that three-quarters considered range as the main or significant disadvantage, their preference for PHEVs is understandable.32 However, the cost of having a dual drive train is considerable; as a 16 kWh Chevrolet Volt costs $5,000 more than a Nissan LEAF with a 24 kWh battery (whose battery alone costs some $12,000). EVI countries have a target of 2.4 million slow EVSEs and 6,000 fast EVSEs (about 80% of the target is accounted for by Japan which already has 1,381 or 76% of the current total, so presumably other countries have not set realistic 2020 EVSE targets yet). Estimates of the number of the heavy current fast DC chargers needed suggest that it might be quite low – California estimated that 100-200 would be sufficient for the majority of drivers. The Netherlands had 0.5 slow chargers per EV, compared to 0.1 in Japan, but Japan had 0.03 fast chargers per EV compared to 0.01 in the Netherlands.
31 Costs do not include warranty costs or profit, and are based on a production volume of at least 100,000 batteries per year. 32 “Unplugged: Electric Vehicle Realities Versus Consumer Expectations,” Deloitte Touche Tohmatsu, 27 July 2011 cited in IEA (2013).
GA MOVE/FP7/265499/Green eMotion D9.6: Barriers, gaps, and commercial and regulatory framework for broad rollout of e-mobility
Page 41 of 80
Source: IEA 2013, fig 16; U.S. DOE, Deutsche Bank
Figure 4.2 Estimated Costs of EV Batteries through 2020 The IAE (2013) report confirms that the most urgent need for EV deployment is a viable financial model for the EVSE infrastructure deployment. The evidence suggests that earlier fears (that no-one would build the infrastructure without an adequate number of EVs, and few would buy EVs without an adequate public charging infrastructure) have been allayed in most countries by a simultaneous roll-out of EVSEs with EVs, so the ratio of EVSEs to EVs seems moderately flat. This has been greatly aided by government support ($800 million support to date), as evidenced by the UK Government’s PiP support of 50% of the cost (and all the data acquisition cost). The concern is that once public support is withdrawn it may be more difficult to find a sustainable business model for public charging poles, given that their installation may cost $5,000-15,000, particularly as they will be in direct competition with home and work-place charging and they may therefore have relatively low usage rates (the PiP data suggests fewer than three charging event per EVSE/month, which would be commercially unsustainable). Tecnalia (2014b) in their D9.4 report quantifies the costs and scale needed to deliver a sustainable business model for public charging poles. One of the barriers to infrastructure deployment is the proliferation of fast charging standards (which differ in Japan, and the US/Germany) and clearly standardisation is particularly important in Europe where EVs will need to be able to travel between different countries (and use all available charging networks). After that, it must be easy for EVs to locate charging poles, which requires an agreed standard form of signage, as well as on-line access (via mobile phones or satellite navigation devices) to locate the nearest unoccupied charging point. Given that most vehicles spend 90% of their time stationary, the logical places to locate public or quasi-public charging poles are at workplaces, multi-unit dwellings and possibly shopping plazas (although the time available for charging there is likely to be limited, and in any case they are likely to be located near home or work). In the Netherlands it is a
GA MOVE/FP7/265499/Green eMotion D9.6: Barriers, gaps, and commercial and regulatory framework for broad rollout of e-mobility
Page 42 of 80
requirement that each EV must be provided with a dedicated charging point within 50 m of the owner’s residence, and clearly building codes can facilitate EVSE provision for new developments. The situation changes with a shared-ownership model like Zipcar, which would logically be located with its charging pole in a densely populated area, including main town streets. Another potential barrier is the ability of EVSE owners or operators to supply electricity and hence widen the range of possible infrastructure supply options. According to IEA (2013), in some countries only regulated utilities are allowed to sell electricity directly to consumers, which would dramatically limit the potential suppliers of EVSEs, or at the least would raise the complexity of using the EVSE, as it would require a payment to the electric utility and another payment to the EVSE owner/operator or an indirect way of charging – perhaps for time spent charging with the electricity notionally free. Again this might be overcome with the right protocols for communicating and charging, but at the cost of increased complexity. An additional barrier to the entry of EVSEs is the requirement in some countries or on some types of roads (e.g. motorways, toll roads) for service stations to hold a licence or be part of a franchise. If only the existing road fuel stations are allowed to offer vehicle services, and if they are owned by oil companies, then they may be reluctant to offer charging poles that might be seen as undermining their main market, and might attempt to prevent dedicated charging places setting up in competition. While such barriers can be addressed by standard competition law, it may be more difficult to persuade existing service stations to install charging poles, as they will argue (plausibly) that forecourt parking space is in short supply and the time take to charge reduces vehicle throughput substantially per square meter of space. In addition given the doubtful business model for inter-urban charging stations except as part of an EVSE network willing to cross-subsidize “security of supply” charging points, existing service stations are likely to require heavy subsidies to provide EVSEs, and it would be challenging to build this into a viable business model. One possibility is that large motorway service areas often have fast food outlets, which might naturally offer fast charging as a customer inducement to break their journeys. The business model assessment for public charging infrastructure can be found in D9.4, which will have an updated version at the end of the project (February 2015).
4.2 Electricity supply Assuming that the barrier to allowing EVSEs to retail electricity can be overcome, there remain a number of barriers to the efficient provision of charging services, which may influence the range of possible EVSE operators. As already stressed, the efficient price of electricity varies considerably by time of use and also by location. At times of low residual demand (that is, total demand less the supply of renewables and other low variable cost and/or inflexible plant such as nuclear power) the scarcity value of wholesale power is very low (Table 3.5), and possibly almost zero. At times of high residual demand at which inefficient peaking plant running on expensive fuel (gas or distillate) is at the margin, the wholesale cost can be very high, not just because of the high variable fuel cost but because the capital costs of such plant should be recovered at times of peak residual demand.
GA MOVE/FP7/265499/Green eMotion D9.6: Barriers, gaps, and commercial and regulatory framework for broad rollout of e-mobility
Page 43 of 80
Figure 4.3 Price duration curve for the Single Electricity Market in Ireland, 2009
Figure 4.3 shows the wholesale price duration curve for the most expensive 5% of the half-hours in the Irish Single Electricity Market (SEM). The SEM is a good model as its prices are calculated as the system marginal price (SMP, which is required to be the system marginal cost including start-up costs, the lower curve) suitably averaged, and include an explicit capacity payment (CP, shown added to the SMP in the top curve). The capacity inclusive price is above €85/MWh 10% of the year and above €100/MWh for 5% of the year, with the average in the most expensive 5% of the hours for SMP of €103/MWh, and including capacity payments €133/MWh. The average GB wholesale spot price in the most expensive 5% of the hours in Figure C.4 is €105/MWh (and was the same in 2009, the same year as in Figure 4.3). Ireland has on average higher costs than GB as it is a smaller and more isolated system with peaking distillate turbines. It also has explicit capacity payments, so it is reassuring that these prices are quite close (and suggests that the wholesale price in the energy-only GB market include a capacity element). As noted above, systems with a higher share of renewables need higher peak prices to offset the lower off-peak prices. Distribution Service Operators (DSOs) may benefit from the ability to engage directly or indirectly (through EVSEs) with EVs to indicate efficient times to charge and to secure services that EVs might provide both to the DSO and to the transmission system operator (TSO). The most obvious service would be frequency control (increasing or reducing the rate of charge for those EVs who are in a position to offer increases or reductions, as discussed in more detail in D9.2 (Imperial College London, 2014). In addition, the ability to vary load and possibly even withdraw power from batteries if the scarcity price is temporarily high enough are also valuable balancing services, provided again that the cost of control and aggregation are low enough.
GA MOVE/FP7/265499/Green eMotion D9.6: Barriers, gaps, and commercial and regulatory framework for broad rollout of e-mobility
Page 44 of 80
5 Commercial and regulatory framework required The core of D9.6 is to “set up all the needed information to develop a suitable commercial and regulatory framework to enable a mass rollout of EV. This will … naturally evolve from identifying current barriers and gaps to incorporating the actual internal and external benefits and costs for all players (customers, power system and distribution network operators, manufacturers and services providers, mobility and urban planners, and so forth) ...” The commercial and regulatory framework should ensure that users face the efficient prices (that incorporate all external and internal benefits and costs of EVs rollout).
5.1 Evidence from a Japanese case study Japan was the first country to take mass EV roll-out seriously and offers useful insights into the barriers encountered and possible commercial and regulatory solutions. Fortunately, Weiller and Neely (2014b) have investigated the “Japanese EV ecosystem” in depth, interviewing 21 experts from industry, academia, utilities, and the government and examining three business models. The first business model was the development of a fast charging network, which was promoted by TEPCO, the largest Japanese electric utility, who set up a consortium to develop a standard. Fast charging networks using this standard have been deployed by Nissan and three other consortia (two with motor manufacturers, one of which has an electric utility, and two of which have oil companies) each with a rather different business model, each with government support. Its main challenge has been a failure to set this as the sole standard outside Japan, but its success in creating joint ventures across the value chain suggests that active promotion of industrial cooperation is a key element in a viable commercial and regulatory framework. The second business model that Weiller and Neely studied is the Okinawa Electric Vehicle Rental Service, which would seem to be an ideal niche market in which to demonstrate the potential of EV roll-out. Okinawa is a small island of some 1,200 km2 located 640 km SW of the Japanese mainland with a population of 1.4 million. It is visited by 5.5 million mainly Asian visitors each year, half of whom rent cars that are normally purchased in advance as part through travel agents. It has 27 fast charging stations on 18 sites and all three car rental companies offer Nissan Leaf BEVs with 160 km range. Given the size of the island (130 km long), the availability of fast chargers together with slow chargers near tourist sites that would allow time to charge, and the fact that the typical visit is for only three days, it would seem ideal for demonstrating EVs. Despite these advantages, the business model failed for several reasons. First, travel agents were unwilling to guarantee the reliability of the BEVs, and did not have any obvious incentive to promote them, which led to low utilisation rates for the rental cars and lower than expected revenues. In particular customers were concerned that they would run out of charge and not be easily able to locate charging posts. Second, the high cost of the BEVs together with their lower than expected resale value (rental companies usually sell their vehicles after two years) meant costs were higher than expected. Third, the regulators prevented the electric company from financing the fast chargers by spreading the costs over electricity consumers, few of whom would have benefitted as residents, not tourists. As the residents are not wealthy, they could not afford to buy second-hand BEVs at a price that would have been commercially viable. The lessons drawn included the importance of making information readily available (about battery performance, charging pole location and optimal routing via “smart navigation”,
GA MOVE/FP7/265499/Green eMotion D9.6: Barriers, gaps, and commercial and regulatory framework for broad rollout of e-mobility
Page 45 of 80
residual values, etc.) and the need to overcome or address range anxiety. Finally, demand for EV rentals relied on travel agents who had little incentive to push the product. The final business model that that Weiller and Neely present is the development of energy service business models (G2X), and in particular the G2H to deploy used BEV batteries for home energy management services. One company, ORIX, rents 6kWh batteries and its management system for 3,000 Yen (€21) per month which are attractive as back-up if the normal power supply is unreliable (as happened after the Fukushima disaster). For about €4,000, Nissan will provide a Leaf-2-Home device that makes the 24 kWh battery available, and able to deliver 48 hours of normal home use. However, while this is an attractive option if power is unreliable, the combination of a high income (needed to buy the BEV) and unreliable power is unusual (and perhaps just confined to tsunami-prone Japan).
5.2 The economics of networks The EV ecosystem, that is the whole value chain from vehicles, the charging and related ICT infrastructure and OEMs, are an excellent example of a network in which coordination and interoperability or compatibility are central to competitive effects and system efficiency. There is an extensive economic literature on systems competition and network effects, standardisation and competition between platforms (Katz and Shapiro, 1994; Besen and Farrell, 1994, both in a special issue of the Journal of Economic Perspectives; and a comprehensive survey in Farrell and Klemperer, 2007, together with its references). Katz and Shapiro (1994) stress three important factors that influence decisions: expectations, coordination and compatibility. The decisions affected are the number of consumers who choose a given system, how the consumers choose between systems, and whether suppliers will make their systems compatible or not. Besen and Farrell (1994) argue that network markets in which agents compete to establish standards have a number of characteristics that strongly influence the nature and efficiency of competition and which therefore raise important issues of public policy. First, they tend to evolve into a single winning standard (e.g. VHS drove out Betamax in the video recording market), and the choice of that standard will often depend on consumer expectations of which will eventually dominate. Second, where, as with EV charging networks, there are network externalities so that larger networks are more attractive than smaller networks, the firm that controls the standard finally chosen can become very profitable, particularly when switching from one standard to another is costly. Third, this raises the issue of whether firms will find it attractive to make their offerings compatible by agreeing standards, and then compete in the resulting single market, or whether they will prefer to make their offerings incompatible and compete for market share. As Besen and Farrell (1994) observe, economic theory is not conclusive in predicting which outcome is more likely, but they note that price competition is more intense when products are compatible, and locking-in customers to incompatible products reduces the intensity of competition, which can be attractive to the firms. That leads Farrell and Klemperer (2007) to conclude that “firms probably seek incompatibility too often. We therefore favour thoughtfully pro-competitive public policy.” The EV ecosystem has one strong advantage in favouring this “thoughtfully pro-competitive public policy” in that the EVs are not yet commercially viable without considerable subsidy, and so public policy is necessarily heavily involved and can reasonably require companies to adopt socially desirable choices, and specifically interoperability. It is notable that automotive OEMs are not so much hotly pursuing market dominance to establish their standard (as
GA MOVE/FP7/265499/Green eMotion D9.6: Barriers, gaps, and commercial and regulatory framework for broad rollout of e-mobility
Page 46 of 80
Microsoft might) as desperately hoping that the EV market will reach critical mass so that they can survive. While they each wish to have the largest market share to recover their high fixed costs, they are also aware that any uncertainty that affects consumer willingness to adopt EVs (such as a lack of interoperability of public charging poles) is likely to lead to fewer customers entering choosing to adopt. A large share of a small market is likely less attractive than a smaller share of a much larger market, so there are incentives for the automotive (and battery) OEMs to cooperate to maximise the size of the EV market.
5.3 Coordination, standards, ICT and the GeM Clearinghouse The two key (related) issues that emerge in the GeM vision of future mass roll-out of EVs are the importance of a communications standard and ICT Platform to identify users, enable roaming and billing, and of a Clearinghouse to simplify financial transactions and contract management, structured as a Business-to-Business (B2B) intermediary. D3.133 lists the following services that the ICT Platform would offer:
• Identification of the end customer, providing a customer with a unique ID • Authentication of the driver • Service Indication for the driver • Charge detail record (CDR) routing to enable billing for the consumption of electricity
and other e-Mobility services • Data analysis • Providing web interfaces to display information of any kind for charging and added
value services • Compatibility with on-going demo projects • Flexibility to eventually welcome different business models • Competitiveness against service provisioning based on direct agreements between
business actors D3.1 conducted interviews to assess stakeholder views on the e-Mobility Clearinghouse (GeM CH). They agreed that the CH should provide or support these ICT services, but went further in characterizing the capabilities of the CH:
1. The CH should enable different business models for different stakeholders and would be voluntary for e-mobility business actors, depending on their own business models and needs. Being a B2B intermediary, the businesses would have the right to establish agreements and provide services as a consequence, without accessing a higher routing/managing level. This is likely in the early stages when businesses manage their own direct agreements and service provisions. Thus GeM CH will guarantee a competitive but compatible way for businesses to deal with agreements, contracts and services on a larger scale, coordinating where possible lower levels of the architecture that is under design or being deployed.
2. Some of these current or proposed business models that need to be accommodated include:
33 GA MOVE/FP7/265499/Green eMotion WP 3: Deliverable 3.1 Business Analysis, 12 January 2012, from which much of the following section is taken directly.
GA MOVE/FP7/265499/Green eMotion D9.6: Barriers, gaps, and commercial and regulatory framework for broad rollout of e-mobility
Page 47 of 80
• The Distribution Service Operator (DSO) acting as the EVSP, or managing the EVSE connection to the grid, possibly installing the charging stations and the network infrastructure, and being responsible for metering activities.
• OEMs as EVSPs, acting as a wider service provider, such as cooperating with utilities or energy companies to offer eMobility Services like providing access to public charging station, providing telematics services and offering packages for green electricity or fleet services.
• Other stakeholders like Better Place which are specialized in electro mobility services may act in the roles of EVSP and EVSE Operators.
3. The GeM CH should focus on financial issues and should not be in charge of
enabling the sale of electricity, but only of e-Mobility Services to assure the driver of being able to recharge his/her car when and where he/she wants. To enable financial clearing, the GeM Clearinghouse should provide the required information to the EVSEs and EVSPs before charging an EV and for billing and clearing after the charging event.
4. The GeM CH could be in charge of contract management to efficiently facilitate contractual relationships between different business partners in the e-Mobility ecosystem (EVSE Operators, EVSE Manufacturers, Utilities, OEMs, etc.). The GeM CH should enable roaming34 without having an EVSP needing to negotiate with hundreds of other EVSE Operators or EVSPs.
5. The GeM CH would be responsible for simplifying the payment processes, to enable the coexistence of different ways of payments which may or may not involve the GeM CH (tokens, prepayments, cards) and should take over if no local payment means exist.
6. The GeM CH could also offer services related to the customer interface to provide charging information to the customers, like a web portal.
7. An additional service could be dispute handling.
8. The GeM CH should be “light” and performing, that is to have standardized processes in place, which efficiently manage contractual relationship and payment processes.
9. It should be open to local communities.
10. There could be more Clearinghouses at a lower and higher level.
11. The Clearinghouse could handle also pre-session activities, e.g. identification. As a reference, the signalling procedures and signalling gateway could be located in the telecommunication system. With signalling it is meant the procedures for setting up, maintaining and disconnecting calls, which would correspond to setting up, maintaining and ending the recharging session at a foreign charging spot. Currently there are few EVSPs, so market needs for signalling are low, but they will grow in the future.
34 Better Place (2013) defines roaming as the ability to charge from a charging pole not operated by the subscriber’s company and be charged by the subscriber’s company.
GA MOVE/FP7/265499/Green eMotion D9.6: Barriers, gaps, and commercial and regulatory framework for broad rollout of e-mobility
Page 48 of 80
12. An open question for the GeM CH concerns how it would cover its costs. A possible business model could include a transaction/roaming fee on top of a percentage on the revenue share.
Two assumptions therefore seem appropriate for developing a suitable framework for mass BEV roll-out, assuming that the economics have improved to the point where there is an adequate number of BEVs to support an extensive EV ecosystem. The first, and more urgent, is agreement on the necessary ICT Platform, standards, and protocols to enable seamless interoperability. The second is the GeM CH with those attributes that seem to be agreed as important. Interoperability is a precondition of the GeM CH, which might evolve through pressures to reduce transactions costs. The message from the various GeM studies is that this evolution should be guided by a vision of what would be required given mass roll-out and extensive roaming, to avoid expensive re-engineering. The conclusion from the earlier G4V project was that “the development of ICT infrastructure should be made in a gradual way, using upgradable solutions, to keep the investment low and perform additional investment according to needs and sustained by cost/benefit analysis.” (G4V, 2011). The key recommendation was to “take advantage of current ICT infrastructure in order to minimise new infrastructure investment and upgrade it according to needs. Aggregators/Retailers should consider the prepaid option as a priority when the user has no contract. At an earlier stage of EV deployment, to avoid the costs of roaming, a prepaid option or a payment at the gateway should be considered.” Given these assumptions and recommendations, the remaining framework should be guided by the interests and requirements of the various stakeholders.
5.4 Stakeholders The main stakeholders, starting with the end consumer and working back up the value chain are: the EV driver, who may also be the EV owner, the infrastructure with which the driver interacts (charging, billing, contracting, including the EVSE and EVSP), other possible value-added service providers, electricity suppliers, DSOs, TSOs, rental/leasing and battery exchange providers, and OEMs. Standing outside these but playing a critical role will be the member State governments and European Commission, setting the legal framework and policy, the government departments charged with delivering e-mobility, regulatory agencies advising on and implementing regulations, and local, planning and licensing authorities granting permissions.
5.4.1 EV driver Given that drivers have a choice between ICVs, HEVs, and EVs (both BEVs and PHEVs) it is clear that for EVs to be attractive they have to offer quality-adjusted comparable value for money. Assuming the durability, cost and performance of the battery reaches levels that make EVs viable for an adequate market share, it is nevertheless the case that compared to a comparably performing ICV, EVs have higher capital costs but potentially lower operating costs, particularly if the battery cost is taken as a fixed cost, and if the life of the battery is primarily age rather than distance related. Much of the apparently lower operating costs are
GA MOVE/FP7/265499/Green eMotion D9.6: Barriers, gaps, and commercial and regulatory framework for broad rollout of e-mobility
Page 49 of 80
the result of a failure to charge for road use in the way road fuel excises do, and if transport fuel taxation is replaced by road pricing much of this apparent advantage will disappear.35 Nevertheless, with smart charging and using cheap electricity (i.e. electricity supplied at times when there is no network congestion and adequate low-cost power from e.g. baseload and/or renewable generation), EVs should still offer a lower cost per km. As such they are best suited to intensive use, by medium distance commuters, car rental firms, shared company cars, and taxis, provided the charging can be delivered without significant time penalties. Thus commuters will charge overnight at home, and possibly top-up at work, where controlling the charge time and rate should avoid peaky prices, and possibly deliver V2X services to offset the cost of the power. Rental companies in dense urban areas can offer rentals to access the neighbourhood, and travels to and from destinations that will by then have adequate charging facilities. The same is true of company cars, where a fleet can have a range of options including ICVs or PHEVs for longer trips and BEVs for shorter trips between locations with charging poles. If taxis can find a way of readily recharging while waiting for custom (possibly via induction loops at taxi stands) or have scheduled downtimes for recharging, or use battery swap facilities as described in Section 5.4.6, then their quietness and acceleration in urban settings may offset these drawbacks. The main barriers to wide-spread adoption are, in increasing order of difficulty of resolution, informational asymmetries, range anxiety, charging speed, and cost. If potential users are to be persuaded to buy or rent EVs, they will need credible, reliable and trustworthy information about user cost, including durability, maintenance costs and resale value, range under different driving conditions and weathers, timely information about the location of available and bookable charging poles with parking, about suitable contracts for power, and the costs of EV rental and battery rental. As experience accumulates and assuming it is sensibly disseminated, most of these informational problems can be addressed, particularly with mobile / smart phone and satnav technology optimising routes and departure times. Clearly the driver will want to avoid any hassle with accessing and paying for charging, and that is where standards and an intelligent CH will facilitate roaming. Range anxiety may be reduced with better information in general, and better in-car information provided from the satnav optimizing the route and estimating the likely battery demand, given speed, traffic conditions and weather, and routing via fast charging poles where necessary. It remains to be seen to what extent an adequate public charging network will alleviate range anxiety, and how dense a network would be required. Thus ESB, sponsoring the Irish ecar programme, plans on “A Fast Charger every 60 km with seamless re-charging and payment, regardless of location.”36 However, even a fast charger charging at 50 kW takes 20 minutes to provide an 80% charge (e.g. at 300-380 km/hr) while a standard public charger takes 2-6 hours and home charging takes 6-8 hours (for a full charge). A direct implication of the time taken to charge is that demand for public charging will be low per EV, so sustaining a dense network commercially will be challenging (as discussed below).
35 As an example, consider the enthusiastic commuter at http://www.esbecarsblog.ie/what-an-electric-year-and-i-saved-over-e2000-in-fuel-costs-in-the-process/ who commuted 24,000 km per year. At 5 km/kWh for the Nissan Leaf, compared to 6.7 L/100km for the ICV, and using 2013 UK petrol and off-peak electricity prices and taxes, the saving post-tax would be £1,864 (€2,237) but removing all taxes the saving would be less than one-third as much at £580 (€696). 36 At http://www.esb.ie/electric-cars/electric-cars-ireland/electric-car-key-players.jsp accessed 16/1/14
GA MOVE/FP7/265499/Green eMotion D9.6: Barriers, gaps, and commercial and regulatory framework for broad rollout of e-mobility
Figure 5.1 Total cost of ownership Finally, the cost barrier remains, although the automotive OEMs are already claiming that with the considerable tax advantages enjoyed by BEVs, they are already price (if not cost) competitive. Thus the ESB website claims that “Because of their relative newness, electric cars have a higher purchase price than conventional cars. However, several factors push the costs down. These include a zero rate of VRT37, purchase grant for €5,000, lower road tax, reduced maintenance costs (due to fewer moving parts), plus dramatically lower fuel costs. For certain car models, the driver purchases the car and leases the battery. The graph (Figure 5.1) shows that electric cars are more cost effective than a conventional car.” However, if the fuel cost saving is calculated pre-tax and the other taxes are removed, the situation is reversed.
5.4.2 Charging infrastructure: providing the EV Supply Equipment The charging infrastructure is a key part of the EV ecosystem, and is itself a subsystem in which a number of agents interact – the Electric Vehicle Supply Equipment (EVSE) owner and operator who provide the physical charging equipment in the home, office, or at a public pole, and the Electric Vehicle Service Provider (EVSP).38 The role of the EVSP is considered in the next section.
37 Vehicle Registration Tax 38 From GeM D3.1 this is the “legal entity that the customer has a contract with for all services related to the EV operation” according to the ISO_IEC 15118 definition. An EVSP offers e-mobility services to the end customers so that they can recharge their EVs at any charging point and any battery switch station across Europe, or benefit from additional services while driving.”
GA MOVE/FP7/265499/Green eMotion D9.6: Barriers, gaps, and commercial and regulatory framework for broad rollout of e-mobility
Private EVSE is normally provided either by sale to the EV user, or as part of a contract either with the automotive OEM, leasing company or the electricity supplier (i.e. with an EVSP). Direct sale to the home forms part of the capital cost of owning the EV, and increases the fixed cost, but could offer cheaper electricity in return, provided the EVSE has the capability of controlling the timing and rate of charge, so that it can effectively sell services (frequency response, DSM, etc.) to the Distribution Service Operator (DSO) or an aggregator. Leasing/contracting with the electricity supplier or DSO is a way of bundling these activities and reassuring the contractor of the availability of these services. The main regulatory/legal barrier to remove is any restrictions on what agents are allowed to sell and/or meter electricity and offer services to or as aggregators. The other obstacle is one of cost, which depends on the scale at which the EVSE is produced and the complexity of any ICT bundled up with it, and that comes back to the general issue of setting standards discussed in Section 5.3. The main danger is that EVSE design will be dealt with as part of each country’s smart metering programme, which, at least in the UK case, has become over-complex, excessively expensive, and incompatible with other programmes.39 Providing the various standards for plugs and ICT are sensibly set, the OEMs can compete and innovate within that defined market to drive down costs. Absent that, each OEM and perhaps each large incumbent electricity supplier may develop idiosyncratic solutions at higher unit cost. Public EVSE presents a quite different challenge to developing a viable business model, as they are unlikely to be commercially viable as free-standing enterprises until EVs reach critical mass (see Deliverable 9.4). They require either a public parking space, which is the responsibility of the municipality or road authority, or a dedicated private parking space such as a service station, shopping centre, tourist site or hotel. Planning laws and regulations may need adjustment (although this should follow any public commitment to supporting EVs and in any case siting should be less problematic than siting service stations). Commercial venues like shopping centres have an incentive to attract customers and may therefore be willing to support the financial burden of a public EVSE, and the trials for Plug-in Places discussed in Section 3.1 are directed to establishing sustainable business models. The problem is that subsidised charging may make free-standing EVSEs appear expensive and further undermine demand (although subsidised and paid parking co-exist so this may not be a serious problem). Service stations make low margins on the high turnover of selling transport fuel and each ICV spends only a short time refuelling, while even a fast charging pole would be occupied for many times that length of time. To deliver the same return per square meter of forecourt per hour, the margin over the cost of the electricity would need to be much higher than on the transport fuel. In addition the utilisation of the EVSE would need to be quite low if users were to be confident of finding one available. The evidence to date is that most EVs prefer to charge at home or work and rarely use public EVSEs. It is hard to see why any existing service station chain would be willing to offer an EVSE unless required (and compensated) for doing so. If public fast charging poles are to be deployed extensively, they will almost certainly need a source of additional external revenue above that charged for use. One potentially viable solution is that as they provide insurance and reassurance to EV users, they could be paid via a subscription model (rather like vehicle rescue services such as the Automobile
39 For a rather jaundiced view of the UK smart metering programme see http://www.nickhunn.com/smart-metering-is-fcuked/
GA MOVE/FP7/265499/Green eMotion D9.6: Barriers, gaps, and commercial and regulatory framework for broad rollout of e-mobility
Association) once the numbers of EVs were high enough to make the subscription relatively cheap. In the meanwhile, at subcritical mass, they will either need to be subsidised by the government, conceivably by the OEMs, particularly if they form large consortia and subscribe in proportion to their cumulative sales, or by electricity incumbents like ESB in Ireland (which is problematic in a regulated world which objects to cross-subsidies). This raises the question where to place the task of developing the EVSE charging infrastructure, and whether the obligation should be placed on the DNOs or the electricity incumbent in countries where there is an obviously dominant national player (like ESB, EdF or ENEL). The DNOs are well-placed to judge where on their network new and potentially significant intermittent loads might best be located, but they are unlikely to have the necessary transport-related skills and knowledge to develop the best business models. It would therefore be a mistake to restrict such activities to DNOs. Instead they should be required to provide the necessary information about the local capacity of the network to accommodate new charging poles and indicative or standardised connection and usage tariffs The DNO will in any case be responsible for providing the connection and it would be helpful if this information were readily available. The other institutions that should be involved are the town and transport planners who can coordinate new building developments (residential, commercial and work-place) to ensure that EVs can be accommodated at least cost through the provision of adequate parking and charging infrastructure.
5.4.3 EV Service Provider (EVSP) “The EVSP would sell km or kWh to the consumer when he/she recharges the EV either at home, at work or at any other public parking location. The charging devices communicate with the EVSP or a third party invoicing service provider, so that the EVSP can periodically send bills directly to the consumer.”40 Once the ICT protocols and standards have been agreed, the main requirement for easy roaming is the creation of the GeM Clearinghouse (CH). The EVSP could be:
• The automotive OEM, providing effectively the required after-sales care to reassure buyers and contracting with the DSO and electricity supplier or some other intermediary,
• An electricity supplier selling the electricity with a contract with the DNO/DSO and buying wholesale power spot or contract (as is standard for normal electricity sales),
• Another intermediary, either aggregating the services that the EVs can offer to the DSO/TSO, and dealing with one or other parties, or
• A specialist in e-mobility services (the business model of Better Place). In each case the EV will need to be able to roam and hence will need to be able to access either his original contract holder via another network or will need to be able to deal with a different set of EVSPs. Roaming for those who do not have a simple pay-as-you-go contract will require the exchange of information and a settlement system of the kind that might be handled by the CH, but which might not necessarily require a single or centralised CH. The obvious intermediate model would build on the mobile phone network (and especially smart phones), as the cost of charging when roaming is likely to be considerably less than the current cost of
40 GA MOVE/FP7/265499/Green eMotion WP 3: Deliverable 3.1 Business Analysis, 12 January 2012
GA MOVE/FP7/265499/Green eMotion D9.6: Barriers, gaps, and commercial and regulatory framework for broad rollout of e-mobility
Page 53 of 80
data roaming, and hence should raise fewer issues of credit risk, provided the necessary authentication ICT is in place. The problems that need to be addressed are that if EVs are not given incentives to charge at suitable times, then they will likely choose periods that are congested. In that case either generation and/or transmission or distribution networks will require expensive expansion to cope with this congestion. If EVs are given suitable price signals (directly or via contracts that cede some control to those offering to manage these constraints) then they can make informed choices and only charge at congested times when their willingness to pay (i.e. the value to them) exceeds the costs placed on the system. With large numbers of EVs and after efficient charging systems and contracts have been allowed to reach equilibrium, the outcome should be an efficient development and use of the whole electricity system (generation, transmission and distribution). If there are impediments to this, then the results will be less satisfactory, and other cruder forms of intervention may be needed. Thus if time-of-use (TOU) tariffs are made illegal (as is the case in many of the US states) then it may be necessary to ration connections for EVSE, and restrict charging or require it to be dispatched, which would reduce the value of the EV to the user. Sensible policies here that avoid the cost of extra peaking plant were estimated in G4V (2011) to be €180/EV/year and updated in D9.2 and shown in Figure 5.2 below. Note that spot wholesale electricity markets already give strong TOU price signals that should be efficient if the markets are competitive, and so it is the regulated assets that create problems of entry or incentives to price efficiently. The main problem is allowing these efficient wholesale prices to be translated into efficient TOU retail prices and to augment them with efficient TOU charges for transmission and distribution. The DSO has an obvious comparative advantage as an EVSP in that it can encourage users to optimise the loads they place on the local network by guiding the choice of location through access charges, and the time of use through TOU tariffs, or contracts that cede control to the DSO. It can internalise any services that the EVs can offer to the DSO, although it may have conflicts of interest where these services are also valued by TSOs, given the inherent market power of the DSO. If that were considered serious, then either the DSO would need to be an Independent System Operator (ISO) dealing with the DNO and the TSO on an equal footing, or aggregators should be encouraged (and may be the only such intermediary where the concept of a DSO is ruled out by regulations). However, where the DSO function has not been developed, the transaction costs of setting up and operating aggregation services can be considerable, and may deter businesses from offering these services. It would be desirable to undertake a careful cost-benefit analysis of this function to see whether it needs to be financially supported and demonstrated to kick-start entry, or whether the lack of interest is an accurate assessment that the costs exceed the benefits of offering more sophisticated contracts and services to the DNO/TSO. The assessment in G4V (2011) was that “the needs for investment in an advanced infrastructure to implement flexibility services, especially under an uncertain policy and regulatory framework, can hinder the implementation of the aggregation function.” The proposed solution was to “establish coordination processes, that can be just declaration of forecasts of services to be provided or active distribution congestion management actions, between retailers/aggregators and DSO; and to reduce the uncertainty for investments in infrastructure by defining electro-mobility policies, regulatory framework and standards.” D9.2 (discussed below) concluded that “smart scheduling significantly reduces the incremental
GA MOVE/FP7/265499/Green eMotion D9.6: Barriers, gaps, and commercial and regulatory framework for broad rollout of e-mobility
Page 54 of 80
cost to supply EV demand” and that “The value of EVs providing frequency regulation (FR) is also found to be considerable.” Selling EV services Weiller and Neely’s (2014a) interview evidence suggests that selling energy storage services from the vehicle to the grid (V2G) is not likely to be commercially viable for 10-15 years, as it would require mass roll-out of EVs, considerable ICT development that is not yet commercially justified, and more reassurance about, and cost reduction of, the use-cost of the battery in such service provision. Other V2G services such as frequency control and optimal timing of charging to deliver demand side management are likely to become commercially viable earlier, but will still need to develop suitable business models. Here D9.2 of GeM provides useful information, as one of the key players in dealing with the EV owner will be the Distribution Service Operator (DSO, or a proxy if the distribution network plays a more traditional passive role as a DNO). The key issue that needs to be addressed is how to realise and allocate the split benefit that flexible demand (and possibly in future, storage) provides to both the TSO and the DNO/DSO.41 The benefits can be (and have been) estimated in a centrally optimised system model. An example based on the analysis reported in D9.2 calculates the potential savings from controlled EV charging in the assumed 2030 systems of Germany and Denmark, illustrated in Figure 5.2. Following the whole-system approach of Deliverable D9.2, the benefits are quantified for different sectors of the electricity system (operating cost, and investment cost into generation, transmission and distribution infrastructure), and are expressed as annual monetary values per vehicle for varying shares of national EV fleets participating in smart charging schemes (between 25% and 100%). Although the exact split between benefits generated in different sectors varies depending on the particular system, D9.2 typically observes that controlled EV charging brings multiple system benefits simultaneously, i.e. that the same EV resource can be used for more efficient system balancing as well as avoiding investments into generation, transmission and distribution infrastructure.
Figure 5.2 Cost savings from smart EV charging in Germany and Denmark in 2030 (D9.2,
OPEX Generation CAPEX Transmission CAPEX Distribution CAPEX Total
GA MOVE/FP7/265499/Green eMotion D9.6: Barriers, gaps, and commercial and regulatory framework for broad rollout of e-mobility
Page 55 of 80
Here the DSO needs sufficient knowledge of the loading on the distribution system and of the services that can be commanded through various smart devices to be able to call on these services, both to manage loading of the DN and to offer services to the TSO. In the present context BEVs (and to a lesser extent, PHEVs) can offer a range of services, as can a wider range of devices including demand side response (DSR) and distributed generation (DG). Various network management devices are being trialled on the DNs under Ofgem’s Low Carbon Network Fund42 that can offer services from all these devices to both the DN and the TSO. One potential solution is the Virtual Power Plant (VPP) concept (see Pudjianto et al, 2007), which aggregates a number of sources of DG, EVs, and DSR to provide a flexible source of balancing services (positive and negative power) that can be delivered to one or more points on the DN (and via that through a Grid Supply Point to the TSO).43 At present the main barrier to offering small-scale decentralised ancillary and balancing services is the transaction cost of aggregating, contracting and communicating with these services, as well as the cost (real and perceived) to the EV owner of providing the battery services. A VPP is merely an element in the aggregation process that allows a simpler and hence less costly interface with DSOs and TSOs. As standard contracts are evolved and communications protocols established and implemented via cheap software and hardware (Moore’s law ensures that the future will be cheaper) so the value of these services to the DSOs and TSOs should be increasingly available to intermediaries and the EV owner. If these costs fall sufficiently they may eventually become commercially viable, provided the regulatory framework is accommodating. Another important barrier results from the regulatory framework for grid operators. The most important change to make to the regulatory framework governing DN/SOs and T(S)Os is to allow/incentivise them to secure these various services competitively, rather than restricting the eligibility of service providers. Thus if balancing services can only be procured under restrictive contract conditions (e.g. above some minimum size, and with registration as a balancing responsible party and with various equipment requirements) then it may be difficult to overcome the barriers for new entrants such as VPPs or other aggregators. Ofgem, through its Low Carbon Network Fund challenge scheme,44 offers a model for trialling and encouraging the development of new service models and its lessons are being made publicly available. Similarly the Ofgem’s new form of incentive regulation45 for network companies provides incentives for innovating lower cost solutions to network investment and operations. Managing the charging time of EVs can avoid substantial network investment as shown in Figure C.2, which under rate-of-return regulation may be unduly encouraged through the incentive to “gold-plate” known as the Averch-Johnson effect (Averch and Johnson, 1962).
5.4.4 Electricity suppliers, DNOs, DSOs and TSOs Some of these agents (such as suppliers and DSOs) may be directly involved in the EV value chain as EVSPs, but others will be interacting with EVSPs and will need to ensure that these interactions are efficient. That means that the prices at which they transact should reflect the relevant costs (spot prices should reflect the short-run marginal cost of offering or
42 See https://www.ofgem.gov.uk/electricity/distribution-networks/network-innovation/low-carbon-networks-fund/second-tier-projects 43 See Strbac et al (2012a, 2012b) 44 See https://www.ofgem.gov.uk/electricity/distribution-networks/network-innovation/low-carbon-networks-fund 45 See https://www.ofgem.gov.uk/network-regulation-%E2%80%93-riio-model
GA MOVE/FP7/265499/Green eMotion D9.6: Barriers, gaps, and commercial and regulatory framework for broad rollout of e-mobility
bidding for the service, long-run marginal costs become relevant for longer-term contracts which may have two parts: a fixed charge and a variable charge). The main regulatory problems have already been identified, as DNOs, TSOs, and to a slightly lesser extent DSOs have a natural monopoly position that requires their regulation. Regulation is typically inefficiently constrained by asymmetries of information between the utility and the regulator, or, possibly worse, the form of regulation discourages collecting the information that would be needed for efficient charges. There is now considerable experience with incentive regulation, and a recognition that innovation needs active stimulation, ideally through competitive processes, and in large part that is left to Member States subject to EU Directives (e.g. on unbundling, independence of the regulator, etc.). The main EU level action needed will be requirements to harmonise to the extent that roaming is facilitated, and that local incumbents are not preferentially advantaged, but that is already covered by State Aids requirements.
5.4.5 OEMs Automotive and battery OEMs have a strong interest in maximising the generic attractiveness of EVs by cooperating where this reduces barriers to consumer acceptance, but they have a self-interest in maximising their share of that market and retaining the value of their IP. To the extent that various value-added services such as smart navigation, route planning and hence more reliable range estimates enhance the value of the EV and also require access to information produced within the battery system or vehicle, the OEM may wish to deny access to other providers, and make these systems incompatible, thus reducing scale economies. This comes back to the discussion of network effects in section 5.2. There is not much more that can be added to that discussion, other than to note that where public funds pay for innovation, the resulting IPR should be made accessible as appropriate, and that may require opening access or requiring compatibility for some elements. As almost all additional IP is built on existing IPR, this will likely require careful negotiations before support is provided, and if not handled efficiently can delay the process. This is particularly problematic when the ultimate social value of the IPR is in doubt and where the funders have to be reassured that public money is being wisely used. Considering that public support is running at roughly $50,000 per EV deployed (section 4.1) this is not an insignificant consideration.
5.4.6 Other business models: Better Place Better Place (2013) provides information about the battery switching trial in Denmark (18 Battery Switch Stations (BSSs), and roughly 400 charge spots delivering 2 million km of e-mobility and 20,000 switches.46 The interest of this concept is that it addresses the problem of the time taken to recharge, as the swap can be completed in five minutes. Their business model also separates ownership of the battery from that of the car, and then has a contract for a specified distance per year and an excess charge per km – e.g. 10,000 km for DKK 1,495 (€202)/month and then DKK2.24 (€0.30)/km, with higher annual distances having lower excess charges. Figure 5.3 shows the minimum annual cost of different plans, and Figure 5.4 shows the resulting average cost per km. The plans provide strong encouragement for drivers to aim at high annual distances (consistent with the high fixed
46 Better Place filed for bankruptcy in Israel in May 2013 (see http://www.ft.com/cms/s/0/f36f685a-c5d5-11e2-99d1-00144feab7de.html#axzz2qgFRbV3Y accessed 17/1/14, which noted that the company raised almost $1 billion when launched in 2007) but the Danish operation has since been bought by E.On.
GA MOVE/FP7/265499/Green eMotion D9.6: Barriers, gaps, and commercial and regulatory framework for broad rollout of e-mobility
costs of the business model), in which case the marginal cost of additional distance is zero until that pre-specified limit is reached.
Source: Better Place (2013)
Figure 5.3 Minimum annual cost for different plans, Euros (DKK7.416/€)
Figure 5.4 Average cost per km for different Better Place plans
Average cost per km for different Better Place plans
€ 0.00
€ 0.20
€ 0.40
€ 0.60
€ 0.80
€ 1.00
€ 1.20
€ 1.40
€ 1.60
€ 1.80
€ 2.00
0 10,000 20,000 30,000 40,000 50,000 60,000
km/yr
Euro
s/km
10k km/yr15k km/yr20k km/yr30k km/yr40 k km/yr
GA MOVE/FP7/265499/Green eMotion D9.6: Barriers, gaps, and commercial and regulatory framework for broad rollout of e-mobility
Page 58 of 80
The average cost of the “fuel” (the owner is presumably responsible for the cost of the car excluding the battery) is higher than 20 €¢/km up to 30,000 km/yr. The cost of road transport fuel without the road excise taxes but including the carbon and air pollutant costs is given in Table 3.3 in €¢/kWh. For a gasoline vehicle with 6.2 L/100 km the energy use is 0.55 kWh/km, so the fuel costs (not the pump price which includes tax) for such a gasoline vehicle would be between 3.5 and 6 €¢/km, or considerably below the cost of the BEV. (If the maintenance penalty is added these figures would rise to between 5.3 and 8 €¢/km.) Only at 40,000 km/yr and above does the BEV fuel cost fall to 15 €¢/km, casting considerable doubt on the longer-run sustainability of this business model. Perhaps the most interesting part of the Better Place trial is the Amsterdam Taxi Project, whose 10 taxis achieved 237,220 km and 3,248 switches (73 km/switch) in 21 months, with the average distance driven 80,000 km/yr. According to Better Place (2013) “The taxi project, which was located at Schiphol/Amsterdam, served 10 electric vehicles taxis that all had the ability to switch the battery at the station in Schiphol airport.” This confirms that taxis with high usage from short urban trips might justify the higher EV and BSS capital cost and possibly lower use cost and could then be a promising, if modest, market. The economics of the BSS looks even less promising than the fuel cost comparison, as each BSS in the trial had on average only just over 1,000 switches. The data from the taxi project suggests an average of 5 switches per day over the 21 months although the more detailed data from 106 days of operation shows 30 switches per day (3 per taxi). The capital cost of the battery switching and charging equipment as well as the high cost of the stock of batteries needed to be able to have a battery immediately available and charged explains the high minimum annual fees, which in this case would have produced a total annual revenue of some €62,000 for the 10 taxis; barely enough to cover staff costs, let alone any interest and depreciation of capital.
5.5 Cost-benefit analysis and Business Models Deliverable 9.4 of GeM (Tecnalia, 2014b) presented an analysis of a commercial business case, in that the costs and benefits are assessed at market prices which include taxes and subsidies (and specifically use the tax-inclusive price of road transport fuels in comparing the operating costs of EVs and ICVs). The current tax and subsidy systems in place are directed at encouraging the early stage development of EVs, while charging ICVs heavily for fuel and/or road use. Both would need to change if a significant share of road transport shifted from ICVs to EVs. D9.4 considered three main services: basic charging, EVSE reservation and constraint management, with the main focus on the charging service. It restricted attention to slow-speed public charging, although D9.1 has identified the need for public fast-charging as the key insurance element needed to encourage EV take-up. It used Spanish price and cost data and ignored public subsidies to identify what would be needed for fully commercial provision. Longer-term policy that includes a fiscally sustainable environment for EVs will need a full Social Cost Benefit Analysis (SCBA). That would quantify not only the monetary “transactions between the parties involved” mentioned in Deliverable 9.4, but also the social costs of GHG emissions as well as other environmental costs studied in Deliverable 9.5, whilst also correcting for any differences between monetary transaction values and the economic values (of which the most important are various road taxes, and the failure to directly and efficiently charge for using the transport infrastructure). While these corrections will raise the relative economic cost of EVs compared to ICVs, current distortions in electricity
GA MOVE/FP7/265499/Green eMotion D9.6: Barriers, gaps, and commercial and regulatory framework for broad rollout of e-mobility
Page 59 of 80
pricing could go in the other direction and will also need to be addressed, using information coming from Deliverable 9.2 and/or the methodology of Appendix C. Together these corrections and the resulting SCBA will help identify “the commercial and regulatory framework that could lead to incorporating all external and internal benefits and costs of EVs rollout” required in this task. The guiding principle for creating a supportive and enduring commercial and regulatory framework is to align market prices with efficient prices (social marginal costs and benefits measured by willingness to pay) and to target subsidies to best achieve their objective. This will not be simple, as any changes are likely to have distributional impacts and be strongly resisted by those who lose. Road pricing is a good example, where charging vehicles for the use they make of the road and the congestion they cause would remove most of the case for high fuel excise duties, leaving the residual duty to cover the representative cost of driving on (moderately) uncongested roads as well as charging for air pollution and CO2. The idea of road pricing or congestion charging has been under active consideration since the 1960s, and has led to the resignation of many transport ministers in various countries before the London Congestion Charge was successfully introduced. Even after that demonstration, motorists deeply mistrust the concept, which they suspect (correctly to date) will be an addition to, not a replacement of, road fuel excises. Thus Peterson and Michalek (2013) criticize current US battery subsidies because they are directed at nominal rather than effective capacity, encouraging manufacturers to over-size but under-utilise the batteries to prolong their life and maximise their support. Targeting subsidies on the all-electric range (AER) would focus attention on the end service that is most desired and avoid such distortions. The UK approach via PiPs seems well designed as it provides subsidies to establish the infrastructure for a limited period and encourages the development of self-sustaining business models, while monitoring the trials closely.
GA MOVE/FP7/265499/Green eMotion D9.6: Barriers, gaps, and commercial and regulatory framework for broad rollout of e-mobility
Page 60 of 80
6 Conclusions In the present and until 2020 the costs of batteries and lack of familiarity with BEVs seriously restricts the demand for unsubsidised roll-out. The hope behind the extensive public support and subsidy programme to date is that these costs will fall sufficiently, and other obstacles will be overcome, to the point where the is a critical mass of BEVs in operation to support the various business models providing for EVSE and EVSP needed to attract BEV users. If the target battery costs can be achieved, and if 2020 oil and carbon prices are high ($150/bbl in 2012 prices, and €20/tonne CO2) and diesel performance has not improved too much, then the efficient cost per km of BEVs with a high annual mileage that are able to charge at off-peak electricity costs can be lower than the cost of a comparably powerful diesel ICV, but this combination of conditions does not seem likely much before 2020. For lower oil and carbon prices, gasoline ICVs are cheaper than diesel and are therefore the comparator against which to test BEV economics. BEVs appear most advantageous with high annual mileages but modest and regular daily trips, such as medium-long distance commuting (100 km/day), except in households that use a BEVs intensively for shorter journeys and either own or rent a gasoline ICV for longer journeys. The number of BEVs that meet this requirement may be modest in the near term. By 2030 the range of costs of all ICVs and BEVs overlap, so there will be a wider range of circumstances in which BEVs are cheaper than ICVs.
These comparisons make no judgments about the non-fuel merits of BEVs and ICVs, where charging time, range, and weather sensitivity all conspire to make BEVs less attractive, except for the market segments listed above of regular lengthy commutes to a work-place with charging facilities. It was for such reasons that the Committee on Climate Change scaled back its earlier projections of BEVs and replaced them with PHEVs.
In the future other developments, such as autonomous vehicles that can be summoned and used per trip may overcome these obstacles. In the meantime, some care is needed in making proper cost comparisons, given both the numerous distortions to fuel and electricity pricing, and the considerable uncertainty over future fuel prices and battery costs. There is therefore a good case that at some time in the 2020’s, BEVs could become economically attractive compared to ICVs and, with suitable changes to road fuel taxes, vehicle subsidies and electricity pricing, could also become commercially viable.
GA MOVE/FP7/265499/Green eMotion D9.6: Barriers, gaps, and commercial and regulatory framework for broad rollout of e-mobility
Page 61 of 80
7 References Aguirre K., L. Eisenhardt, C. Lim, B. Nelson, A. Norring, P. Slowik, N. Tu (2012). Lifecycle
Analysis Comparison of a Battery Electric Vehicle and a Conventional Gasoline Vehicle at http://www.environment.ucla.edu/media/files/BatteryElectricVehicleLCA2012-rh-ptd.pdf
Al-Alawi, B.M. and T. H. Bradley (2013). “Total cost of ownership, payback, and consumer preference modeling of plug-in hybrid electric vehicles” Applied Energy, 103, Mar, 488–506. DOI: 10.1016/j.apenergy.2012.10.009
ANL (2009) Multi-Path Transportation Futures Study: Vehicle Characterization and Scenario Analyses. Argonne National Laboratories, at http://www.transportation.anl.gov/pdfs/TA/613.PDF
Averch, H. and L.L. Johnson, (1962). "Behavior of the Firm Under Regulatory Constraint". American Economic Review 52 (5): 1052–1069.
Besen, S.M. and J. Farrell, (1994) ‘Choosing How to Compete: Strategies and Tactics in Standardization’, Journal of Economic Perspectives Vol. 8(2), 117-131
Better Place (2013) Lessons Learned, available at the GeM website (not yet published) Dec 15, V 1.0
Carlsson, F. and O. Johansson-Stenman (2003). “Costs and Benefits of Electric Vehicles, A 2010 Perspective”, Journal of Transport Economics and Policy, 37,(1), Jan., 1-28, at http://www.economics.gu.se/digitalAssets/1456/1456318_jtep-2003.pdf
E. Cherchi, P. Morrissey, M. O’Mahony, P. Weldon (2015) Consumers’ preferences and attitudes to, demand for, and use of electric vehicles (EV), Deliverable 9.1 of Green eMotion project, January 2015. Available at: http://www.greenemotion-project.eu/dissemination/deliverables-evaluations-demonstrations.php .
Committee on Climate Change (2014). Meeting Carbon Budgets – 2014 Progress Report to Parliament, at http://www.theccc.org.uk/publication/meeting-carbon-budgets-2014-progress-report-to-parliament/
Contestabile, M., G. J. Offer, R. Slade, F. Jaegerc and M. Thoennesc (2011). “Battery electric vehicles, hydrogen fuel cells and biofuels. Which will be the winner?” Energy Environ. Sci., 4, 3754
Christensen, A.S. and E.E. Christensen (2011). A Social Cost-Benefit Analysis of an Electric Vehicle. MSc. in International Economic Consulting, Aarhus, at http://pure.au.dk/portal-asb-student/files/39501041/Master_Thesis.pdf
DECC (2013a) Estimated impacts of energy and climate change policies on energy prices and bills, Department of Energy and Climate Change, March, at https://www.gov.uk/government/uploads/system/uploads/attachment_data/file/172923/130326_-_Price_and_Bill_Impacts_Report_Final.pdf#page=8&zoom=auto,0,811
DECC (2013b) DECC Fossil Fuel Price Projections at https://www.gov.uk/government/uploads/system/uploads/attachment_data/file/212521/130718_decc-fossil-fuel-price-projections.pdf
Delft (2011) Assessment of electric vehicle and battery technology at http://ec.europa.eu/clima/policies/transport/vehicles/docs/d2_en.pdf
Diamond, P.A. and Mirrlees, J.A. (1971). “Optimal Taxation and Public Production, Part 1: Production Efficiency”, American Economic Review, 61(1), 8-27.
GA MOVE/FP7/265499/Green eMotion D9.6: Barriers, gaps, and commercial and regulatory framework for broad rollout of e-mobility
EC (2013) EXCISE DUTY TABLES Part II – Energy products and Electricity available at http://ec.europa.eu/taxation_customs/resources/documents/taxation/excise_duties/energy_products/rates/excise_duties-part_ii_energy_products_en.pdf
Ecologic Institute (2011). Assessment of electric vehicle and battery technology, Delft, CE Delft, April 2011, available from http://www.cedelft.eu
EIA (2011) Annual Energy Outlook, at http://www.columbia.edu/cu/alliance/documents/EDF/Wednesday/Heal_material.pdf
Element Energy (2012). Cost and performance of EV batteries, Final report for The Committee on Climate Change, 21 Mar at http://www.element-energy.co.uk/wordpress/wp-content/uploads/2012/06/CCC-battery-cost_-Element-Energy-report_March2012_Finalbis.pdf
EPRI (2013). Total cost of ownership model for current plug-in electric vehicles, at http://www.epri.com/abstracts/Pages/ProductAbstract.aspx?ProductId=000000003002001728
Farrell, J. and P. Klemperer, (2007) ‘Coordination And Lock-In: Competition With Switching Costs And Network Effect’, Chapter 31 in Handbook of Industrial Organization, Vol. 3, Ed. M. Armstrong and R. Porter DOI: 10.1016/S1573-448X(06)03031-7
G4V (2011) List of identified barriers and opportunities for large scale deployment of EV/PHEV and elaboration of potential solutions WP3 D3.3 FINAL 31/8/11
Green eMotion (2013) Demo Region: IE1 Data Analysis: Charge Point and Vehicle Data, 1.2 April, lead author Paul McDonald, Trinity College Dublin (TCD)
HM Treasury (2007). The King Review of low-carbon cars Part I: the potential of CO2 reduction, www.hm-treasury.gov.uk/king
IEA (2013a). Global EV Outlook: Understanding the Electric Vehicle Landscape to 2020, at http://www.iea.org/publications/globalevoutlook_2013.pdf
IEA (2013b). International Energy Agency: Energy Prices and Taxes (Edition 2013, Quarter 2)
Imperial College London, (2014). Smart (and less smart) large‐scale integration of EV into European power systems. Green eMotion Deliverable 9.2, 26 Nov.
Katz, M. and C. Shapiro, (1994) ‘Systems Competition and Network Effects’, Journal of Economic Perspectives Vol. 8(2) 93–115
Kley, F., C. Lerch, and D. Dallinger, (2011). “New business models for electric cars—A holistic approach,” Energy Policy, 39(6),3392–3403.
MacKay, D. (2013) Sustainable Energy without the hot air at http://www.withouthotair.com/download.html
Madina, C., G. Coppola, D. Schumann, P. Hartung, and E. Zabala. (2012). “Business and services models for electric vehicles,” in European Electric Vehicle Congress,1–12
Newbery, D.M. (2005) ‘Road User and Congestion Charges’ ch 7 pp 193-229 in S. Cnossen (ed.) Theory and Practice of Excise Taxation, Oxford: OUP.
OLEV (2013a) Lessons Learnt from the Plugged-in Places Projects, Office for Low Emission Vehicles at https://www.gov.uk/government/publications/lessons-learnt-from-the-plugged-in-places-projects July
OLEV (2013b) High level analysis of the Plugged-in Places chargepoint usage data, Office for Low Emission Vehicles at https://www.gov.uk/government/publications/high-level-analysis-of-the-plugged-in-places-chargepoint-usage-data Sep
GA MOVE/FP7/265499/Green eMotion D9.6: Barriers, gaps, and commercial and regulatory framework for broad rollout of e-mobility
Peterson, S.B., Michalek, J.J. (2012) Cost-effectiveness of plug-in hybrid electric vehicle battery capacity and charging infrastructure investment for reducing US gasoline consumption. Energy Policy doi: 10.1016/j.enpol.2012.09.059
Prud’homme, R and M Koning (2012). “Electric vehicles: A tentative economic and environmental evaluation”, Transport Policy, 23, Sep, 60-69
Pudjianto, D. C. Ramsay and G. Strbac (2007) “Virtual power plant and system integration of distributed energy resources”, IET Renew. Power Gener., 2007, 1, (1), pp. 10–16
PWC (2013) Battery update: Can the Lithium-ion industry satisfy the growing demands of the auto market? Available at http://www.pwc.com/en_US/us/technology/publications/cleantech-perspectives/pdfs/pwc-cleantech-perspectives-ev-lithium-ion.pdf
Rempel, J., B. Barnett and Y. Hyung (2013) PHEV Battery Cost Assessment at http://www4.eere.energy.gov/vehiclesandfuels/resources/merit-review/sites/default/files/es001_barnett_2013_o.pdf
Rösler, Hilke (2013) Proposal for common EV deployment scenarios in WP9 – draft, ECN V1.0 dated 8 Oct
Strbac, G., M. Aunedi, D. Pudjianto, P. Djapic, F. Teng, A. Sturt, D. Jackravut, R. Sansom, Vl. Yufit and N. Brandon (2012a) Strategic Assessment of the Role and Value of Energy Storage Systems in the UK Low Carbon Energy Future; Report for the Carbon Trust, Energy Futures Lab, Imperial College, June
Strbac, G., M. Aunedi, D. Pudjianto, P. Djapic, S. Gammons and Richard Druce (2012b) Understanding the Balancing Challenge , prepared for the Department of Energy and Climate Change, 16 July
Strbac, Goran, Chin Kim Gan, Marko Aunedi, Vladimir Stanojevic, Predrag Djapic, Jackravut Dejvises, Pierluigi Mancarella, Adam Hawkes, Danny Pudjianto (Centre for Sustainable Electricity and Distributed Generation, Imperial College); Scott Le Vine, John Polak (Centre for Transport Studies, Imperial College); Dave Openshaw, Steven Burns, Phil West, Dave Brogden, Alan Creighton, Alan Claxton (Energy Networks Association) (2010) Benefits of Advanced Smart Metering for Demand Response based Control of Distribution Networks, available at http://www.energynetworks.org/modx/assets/files/electricity/futures/smart_meters/Smart_Metering_Benerfits_Summary_ENASEDGImperial_100409.pdf
Tecnalia (2014a) Business modelling analysis in the context of the European Clearing House mechanism, Interim Report 9.3.2, 28 Feb
Tecnalia (2014b) Envisaged EU mobility models, role of involved entities, and Cost Benefit Analysis in the context of the European Clearing House mechanism, Green eMotion Deliverable 9.4 (v1.3), 15 August
TRL (2013) Assessing the role of the Plug-in Car grant and Plugged-in Places scheme in electric vehicle take-up, PPR 668 available at http://www.trl.co.uk/trl-news-hub/transport-news/trl-press-releases/research_reveals_insights_into_the_take-up_of_electric_vehicles.htm
US DOE (2011) Potential of Technologies for Displacing Gasoline Consumption by Light-duty Vehicles Through 2045. US Department of Energy. Washington DC.
Weiller, C. & Neely, A. (2014a). Using electric vehicles for energy services: Industry perspectives. Energy (Under review)
Weiller, C. & Neely, A. (2014b). Business models for electric vehicles: Lessons from the Japanese EV ecosystem. In : Beeton, D & Meyer, G. (Eds.) Lecture Notes in Mobility. Springer (forthc.).
GA MOVE/FP7/265499/Green eMotion D9.6: Barriers, gaps, and commercial and regulatory framework for broad rollout of e-mobility
Winther, K and Holst, M, (2014) Report on mobile battery test platform and results of the measurements, D9.8 (DTI) December 18th, Version: 4.1
GA MOVE/FP7/265499/Green eMotion D9.6: Barriers, gaps, and commercial and regulatory framework for broad rollout of e-mobility
Page 65 of 80
Appendix A: Projecting the future prices of gasoline and diesel Figure A.1 shows the evolution of real futures oil prices from 1985 to 2014 and of the two road fuel products, gasoline and diesel (or heating oil, HO, which is very similarly priced, both measured in ‘000 litres, kL). The figure shows that the ratios of product to crude prices seem to fluctuate around a fairly stable average. The price of WTI crude oil reached $(2012) 918/kL in Feb 2012, higher than its value in 1980 and the highest in this period. Since early 2011 the price of WTI crude has diverged from the European market (Brent) price as shown by their difference (near the axis). The ratio of gasoline to crude oil is 1.28 (SD of annual moving averages is 0.12) and for heating oil (an excellent proxy for diesel) is 1.18 (SD 0.10), both for the period Jan 1985 – June 2014. Their evolution is shown on the right hand scale of Figure A.1. Note these are fob (free on board, i.e. export and hence wholesale prices and will need adjustment to give retail prices). For the arguably more relevant sub-period Jan 2000- Dec 2010 the figures are G: 1.24, D: 1.16. Gasoline and diesel are, however, joint products, and their relative price will reflect relative demand, which is quite different in Europe (where diesel is in strong demand compared to gasoline) than in the US where gasoline demand dominates. This can be seen from the evolution of different “crack spreads” shown in Figure A.3.
Source: US Energy Information Agency
Figure A.1 Evolution of real imported price of oil and products and margins, US, 1980-2010 The “3:2:1 crack spread” is the difference between the future value of 2 barrels (bbl) of unleaded gasoline plus 1 bbl of heating oil (essentially the same as transport diesel and almost the same price as jet fuel or kerosene) and 3 bbl of oil, and the fact that it is now a traded commodity suggests that the sum of the costs of producing light and middle distillates
Real oil and product NYMEX futures prices US $(2012)/kL
GA MOVE/FP7/265499/Green eMotion D9.6: Barriers, gaps, and commercial and regulatory framework for broad rollout of e-mobility
Page 66 of 80
from a barrel of crude is more stable than either one separately, as one might expect with joint products. Figure A.2 shows the evolution of the various US crack spreads shown as annual centred moving averages of 1 month Nymex futures prices (NY harbour for products, WTI for crude oil). The product crack spreads are the product price less the oil price, and these are compared with the 3:2:1 crack spread, up until the WTI price began to diverge from international oil prices. The gasoline spread fluctuates around $(2012)10/bbl (€¢5/L) while the diesel spread appears to be strongly upwards and was negative until 2005, but since then has been positive but volatile. The (averaged) US spot 3:2:1 crack spread has fluctuated between $5-10/bbl or roughly €¢5/litre since 2000 and in July 2014 was just under $8/bbl.
Source: EIA data
Figure A.2 Moving averages of US real crack spreads, 1985-2010 The European crack spreads are shown in Figure A.3 for the shorter time period for which data are available (2009-14). The 3:2:1 spread averaged $(2012) 11/bbl and the crack spreads for gasoline was $10/bbl (€¢5/L, similar to that in the US) and for gasoil was $14/bbl (€¢7/L). We also have more recent NW European import price data, which gives from 1990 the average monthly ratio (to crude imports in the Netherlands) for gasoil as 1.26 and from Jan 2009 for gasoil as 1.15 and for gasoline as 1.11, which are not so different (allowing for the higher gasoline to diesel price ratio in the US). These prices are wholesale (for the US export or FOB prices) and to this must be added the distribution margins to derive the pre-tax price to the motorist, and the carbon price to properly reflect the climate change damage, as explained in the text.
US real futures annual moving average crack spreads $(2012)/bbl
-$20
-$15
-$10
-$5
$0
$5
$10
$15
$20
Jun-8
5
Jun-8
6
Jun-8
7
Jun-8
8
Jun-8
9
Jun-9
0
Jun-9
1
Jun-9
2
Jun-9
3
Jun-9
4
Jun-9
5
Jun-9
6
Jun-9
7
Jun-9
8
Jun-9
9
Jun-0
0
Jun-0
1
Jun-0
2
Jun-0
3
Jun-0
4
Jun-0
5
Jun-0
6
Jun-0
7
Jun-0
8
Jun-0
9
Jun-1
0$(20
12)/b
bl
gasoline spread3:2:1 crack spreadsHO spread
GA MOVE/FP7/265499/Green eMotion D9.6: Barriers, gaps, and commercial and regulatory framework for broad rollout of e-mobility
Page 67 of 80
Source; IEA (2013)
Figure A.3 Crack spreads for European import prices
Real spot crack spreads ARA NW Europe
$0
$4
$8
$12
$16
$20
$24
Janu
ary 20
09
April 2
009
July
2009
Octobe
r 200
9
Janu
ary 20
10
April 2
010
July
2010
Octobe
r 201
0
Janu
ary 20
11
April 2
011
July
2011
Octobe
r 201
1
Janu
ary 20
12
April 2
012
July
2012
Octobe
r 201
2
Janu
ary 20
13
US$
(201
2)/b
bl
3:2:1 spot crack Spread ARAgasoline crack spreadgasoil crack spread3:2:1: MA spreadgasoline MA spreadgasoil MA spread
GA MOVE/FP7/265499/Green eMotion D9.6: Barriers, gaps, and commercial and regulatory framework for broad rollout of e-mobility
Page 68 of 80
Appendix B: Battery costs According to their study for the UK Committee on Climate Change, Element Energy (2012) gives cost data for 21 kWh batteries (suitable for compact cars types A&B) and 30 kWh batteries (suitable for C&D) under a conservative and optimistic scenario to 2030, shown in table A.6 and Figure B.2.
Table A.6. Battery cost data from Element Energy
car type & battery 2011 2015 2015 2020 2020 2030 2030 battery size cost Cons. Opt. Cons. Opt. Cons. Opt. A/B 21 kWh pack cost $17,499 $12,257 $10,002 $9,301 $6,082 $6,446 $4,687 pack cost/kWh $830 $580 $474 $440 $288 $305 $222 cell cost/kWh $473 $340 $250 $248 $152 $169 $128 C/D 30 kWh pack cost $21,944 $15,612 $12,609 $12,065 $7,394 $7,875 $5,806 pack cost/kWh $726 $517 $417 $399 $245 $261 $192 cell cost/kWh $454 $331 $245 $253 $142 $157 $121 reference 24 kWh pack cost $19,096 $13,421 $10,925 $10,235 $6,571 $6,972 $5,090 pack cost/kWh $796 $559 $455 $426 $274 $290 $212 cell cost/kWh $467 $337 $248 $250 $149 $165 $126 Source: Element Energy (2012, Tables 8-15, 8-16) For convenience the implied cost for a standard 24 kWh battery is also shown, for which the 2011 price is estimated at $19,096 with a range of 120 km. In 2030, under a baseline scenario, this is predicted to drop to between $5,000 and $7,000 for a BEV with a range of 200 km. The weight in 2011 for the battery pack was 285 kg but this might drop to 170 kg. The data in Figure B.2 are for the 30 kWh battery pack.
Figure B.1 Possible evolution of battery pack costs from Element Energy (2012, Fig. 6.1)
GA MOVE/FP7/265499/Green eMotion D9.6: Barriers, gaps, and commercial and regulatory framework for broad rollout of e-mobility
Page 69 of 80
Note: Usable energy is less than the nominal capacity as the battery should not be fully discharged.
Figure B.2 Battery characteristics from Element Energy (2012, Table 2.1) Note that the battery cost needs to be credited with the drive train cost saving compared to the reference gasoline vehicle of between €0 and €1,430. It should also be credited with its resale value, possibly for use as a static storage device to support Distribution Service Operators (DSOs) control their networks. However, its end-of-BEV-life value will be modest, as the following calculation shows. If the battery degrades to 70% of its nominal value, and if its remaining life is 5 years in alternative use compared to 15 years for a suitably designed device, then at best it would be worth 70%/3 = 23% of its value. But add to that the fact that it is not optimized for DSO use, that there will be transaction costs in transferring it from the BEV owner to the DSO, and adaptation costs, and it will then probably be only worth half its nominal value, or 12%. The discounting at 8% over 10 years its present value to deduct from the purchase price will be only 5%, or within the error margin of future battery cost uncertainty. Battery life is critical and depends on age and number of cycles. The US Advanced Battery Consortium goals (presumably not yet achieved) are for 10 years life and a number of cycles that depends on the Depth of Discharge (DoD) (Element Energy, 2012, p13). If the battery is only discharged 30% then the target life is 2670 cycles but it would only deliver 9 kWh/cycle or 64 km. The target for 50% DoD is 1600 cycles of 107 km and at 80% DoD only 1000 cycles, in all cases delivering the same total distance of 170,000 km. Car manufacturers are now willing to offer battery guarantees typically for eight years or 160,000 km, so these targets may be realistic for current BEVs. If the user drives the car at a (high) annual average of 17,000 km for 10 years, then the average cost per km can be determined. If these targets can be achieved then the 2011 cost of the 24 kWh battery is $19,000 (€15,200 at an exchange rate of $1.25 = €1) and net of the middle value of the drive train cost advantage of €750 would be €14,450. The net cost per km (over 17,000 kpy and an interest rate of 5%) is €¢11/km. If the battery had a residual value rather than a disposal cost that would reduce the cost slightly. At an interest rate of 10% and a shorter annual distance of 15,000 km the cost would be €¢15.7/km. In future with 80% DoD and 1500 cycles the achievable distance could be 250,000 km but if the lifetime of the battery is only 10 years then that may be the limiting factor. The 2030 potential battery cost is given as $6,400/pack (€5,120) and net of the higher drive train cost advantage of €1,430 the net cost would be €3,690. If annual distances driven by EV users were 15,000 km (as penetration increases average distances would likely fall) then over 10 year’s lifetime at 150,000 km the average battery cost would be €¢3.2/km (at an interest rate of 5%) (at 10% the figures would be €¢4/km). The nearer term target of 2020 might have the
GA MOVE/FP7/265499/Green eMotion D9.6: Barriers, gaps, and commercial and regulatory framework for broad rollout of e-mobility
Page 70 of 80
battery pack cost of $10,500 (€8,400) or net €7,650 and so over 10 years and 15,000 km/yr the cost might be €¢6.6/km (at 5%) or €¢8.3/km (at 10%). Element Energy (2012) is a useful reference as it is one of the more recent surveys of the state of knowledge, but there are other estimates available. Thus Ecologic Institute (2011) provides an earlier battery cost projection for the unsubsidised cost to the OEMs in Figure B.3. To summarise their findings: “we estimate battery cost in 2012 (unsubsidised) to be €620/kWh, but there are some small fixed costs for the battery like safety fuses and current leak detection that do not scale with battery size, so that an add on cost of € 200 per battery is utilised that is independent of kWh storage capacity.” That would imply that a 24 kWh battery would cost €15,080 or $18,850, almost the same as the Element Energy’s (2012) estimate (although these are stated to be costs, not retail prices, and so might need an additional margin added). They also concur in battery life estimates: “In the EU, the more moderate temperatures may allow real world battery life to be around ten years on average, and we anticipate continued improvement to 2020 by which time, expectations are that average life may be in the thirteen to fifteen year range.”
Figure B.3 Forecasts of evolution of battery costs from Ecologic Institute (2011, table 8)
Their projected cost in 2020 for a 24 kWh battery might therefore be €5,000 ($6,250) within the range of Element Energy’s projections. In addition there are costs for controllers of €150, for the harness of €150, €1,000 for a heat pump, and an extra €240 for regenerative braking. If we exclude the heat pump the addition to add would be €540 in 2012; falling to €400 in 2020, making a total cost of perhaps €9,000 ($11,250) in 2020, again within the Element Energy range. (These extra costs are included in the calculations based on Element Energy’s data.) Other estimates suggest a rapidly changing view even for current and near future costs. Thus “In April (2012), Bloomberg New Energy Finance estimated battery costs at $689 per kilowatt hour, down from $800 a year earlier.”47 But “It wasn’t clear from the report if that cost is for cells, all components and software—or a total installed cost. Any quoted price per kilowatt-hour can be partial and hide costs that produce a misleading figure in either direction.”48
However, the extent to which future cost may fall may depend on both the choice of chemistry and the future cost of material. To cite a recent comment:49 “Allan Paterson, electrochemical engineer at Axeon, says: “The battery is the biggest cost in a BEV. 60% of that cost is the cells; and 60% of cell cost is the materials needed for the cathode.” This means that although battery technology has halved in the past three years as cheaper elements have been utilised, even high volume production will not completely mitigate the price of the chemicals needed. “We will see cell costs halve in the next five to 10 years, but the price will struggle to come down further,” says Paterson. “Currently costs run to $600/kWh and the target is to bring them down to $300. But that will be a struggle.” The most recent data available (November 2013) is provided by PWC (2013) which reports on a battery cost study, looking forward to 2016 (i.e. the near future). They found reasonable consistency in the various bottom-up cost modelling and surveying OEMs with a target cell cost of $280/kWh, to which must be added other elements to give a target battery cost for a 24 kWh EV of $425/kWh (i.e. total cost $10,200 and the same as Element Energy’s optimistic 2015 cost) and $570/kWh for a 16 kWh PHEV (i.e. total cost of $9,120).50 These targets are roughly 70% of the 2012 costs of $15,000 for a BEV and $13,000 for the PHEV (of the same sizes). Their study concluded that the industry was on course for a $300/kWh battery pack by 2020, consistent with some of the estimates given above. For the smaller PHEV batteries Rempel et al (2013) estimate that at mass production scale battery costs might fall to $220 to $470/kWh depending on cell chemistry, design, and life with materials accounting for about 80% of the manufacturing cost.
49 At http://www.fleetnews.co.uk/fleet-management/electric-vehicles-battery-technology/41776/page/1/ accessed 2/5/13 50 Note that the battery of the PHEV is considerably larger than normal range of sizes of 5-12 kWh.
GA MOVE/FP7/265499/Green eMotion D9.6: Barriers, gaps, and commercial and regulatory framework for broad rollout of e-mobility
Appendix C: Electricity cost The social cost of electricity will depend critically on when and where the power for charging is taken. If power pricing is competitive and undistorted, and if electricity is nodally priced,51 the wholesale spot price (and particularly the intra-day and/or balancing price) should reflect this social cost. In the absence of full competitive nodal prices and efficient balancing and procurement of ancillary services (AS), it would be wise to check this assumption against an optimal dispatch model before accepting market data at face value – the two would coincide if prices were efficient but not otherwise. Large discrepancies could justify future market reforms and/or supplementary policy in pricing BEVs to offset such distortions before those electricity market reforms take effect. It would also be sensible to predict the likely future plant mix and degree of interconnection, storage and demand side management (DSM) likely on the future system, as this will affect the determination of the marginal plant on the system at any moment and location, and hence the system marginal cost (SMC), including any carbon price. To this must be added the cost of any locally delivered ancillary services (and all these should emerge as shadow prices in the optimal dispatch model program). In the event of supply inelasticity at any node, the relevant nodal price will be the marginal social value there, or in a competitive market, the market clearing price (MCP) which will be whatever is needed to match constrained supply with demand, up to the value of lost load. Smart metering of demand should deliver this price to the nodal spot market. As the share of low or zero marginal cost plant on the system rises (wind, PV, nuclear) so the SMC and nodal price at the export nodes could fall to near zero (never negative for controllable power such as wind, but possibly negative for plant with a high cost of ramp down and then ramp up). That does not imply zero nodal prices at all nodes, particularly if there is adequate transmission to points of higher scarcity value, but export constraints will surely bind in many periods (otherwise transmission has been over-built), and will affect some fraction of grid supply points (GSPs) and keep local prices low. Several consequences follow from such granular pricing (by moment and location). First, generation will become more like transmission and distribution in that its cost will be dominated by capital and fixed maintenance costs. The efficient recovery of such costs is to load them onto residual (i.e. net of intermittent generation like wind and PV) peak periods. Second, consequently wholesale nodal spot prices will become both very volatile (either near zero or at rationing levels) and unpredictable (as wind and solar PV are highly weather dependent and wind could be the marginal controllable plant some of the time in many future scenarios). Interconnection and storage will both become more valuable as a result and will mitigate both volatility and unpredictability, and will presumably be expanded in response, but transmission constraints will still be important in many places and for many hours, keeping prices either low or high depending on intermittent supply (high or low respectively). Third, in consequence, most consumers will be hedged with contracts that will offer various options (just as there are many plans for mobile phones). The simplest and least suitable for
51 The EU Target Electricity Model envisages zonal pricing, with quite large price zones to facilitate trading, although nodal pricing is the efficient solution and the US Standard Market Design now employed for more than half US electricity consumption. Nodal pricing gives potentially different spot prices at each node or Grid Supply Point.
GA MOVE/FP7/265499/Green eMotion D9.6: Barriers, gaps, and commercial and regulatory framework for broad rollout of e-mobility
Page 73 of 80
BEVs will be a flat tariff equal to the (consumer’s) demand-weighted average cost, but with smart metering some form of peak/off-peak pricing will surely become more prevalent, possibly with some super peak hours signalled in advance (as with some current French tariff plans). More likely is the option of controllable demand where the right to allow some control over some appliances, including BEVs, will lead to a discount on the standing charge and on the power taken by such controllable devices. Contracts will either be for a fixed number of kWh/month with variable charges applying to deviations from those, or for all consumption, or for variants (all consumption except in certain pre-announced conditions). As a result some fraction of total demand in any location will face time-of-use (ToU) prices and may have pre-programmed responses to such prices. Whether one describes these contracts as the standard electricity price with netting off for the benefits of controllability supplied, or just the relevant spot price, is primarily a matter of contract design and labelling. It seems reasonable to assume that EV charging points will be required to have smart metering and one or two-way communication facilities, and by the time BEVs have more than marginal penetration, that the distribution networks (DNs) will also be adequately instrumented to monitor power flows and voltages at a sufficiently granular level to assess the capability of the network to accommodate more power flows (and their attendant marginal losses). As with the transmission grid, efficient DN pricing requires that each connection pays variable charges equal to the marginal system losses, plus any local DN scarcity price, plus a fixed tariff (relating to peak demand or maximum load), that recovers any shortfall in allowed revenue. As a result EV charging points will offer two options – instantaneous charging at the appropriate locational spot price (nodal energy price at the GSP plus the spot DN charge) or managed charging at a substantially lower price (in which the EV will be delivered charged at some future time such as 7 a.m. that can be predetermined, or adjusted with some penalty). In the second option the DN element in the total charge might be near zero if charging is managed to avoid any constraints on the DN, and if as a result no extra DN investment specifically caused by the EV were precipitated. The social cost of delivering off-peak power may then be very low, while the cost of delivering power at the peak could be very high – as it might not only include the costs of reserve power (high reserve capacity costs plus high variable and carbon costs) but also the scarcity value of constraints on the grid (likely to be small) and the DN (possibly very high). Figure C.1 illustrates the source of the problem in the wholesale energy market. These earlier estimates have been updated in Deliverable 9.2 (Imperial College London, 2014), which forecasts additional system costs for varying levels of BEV penetration in 2030 for a number of countries. Figure C.2 (taken from Figure 3.18 in D9.2) illustrates incremental cost of BEVs in 2030 in the UK and Ireland (which are similar to Spain and Italy but lower than Germany and Denmark) allowing for the costs of expanding peak generation capacity and the capacity of the grid and DN. Figure C.2 shows that the cost of discretionary (convenience) charging for an extra vehicle is quite high at low levels of controllable charging, but tails off to a lower level as the share of the EV fleet that adopts such charging regimes increases (bearing in mind these are for a future in which EV penetration has reached 5%, 15% or 30%, the latter two of which are very high levels).
GA MOVE/FP7/265499/Green eMotion D9.6: Barriers, gaps, and commercial and regulatory framework for broad rollout of e-mobility
Page 74 of 80
a (top left) shows the impact on demand with BEVs charging at their most preferred time; b (top right) is the effect of shifting EV charging to off-(residual) peak demand periods while delivering a full charge by a pre-determined time; c shows that this would allow less wind to be spilled and hence lower C-emissions, that are demonstrated in d. Source: Green eMotion Review Meeting Bruxelles, May 23rd and 24th, 2012
Figure C.1 Effect of smart charging of BEVs
Source: Imperial College London (2014, fig 3.18)
Figure C.2 Additional system cost per EV in UK and Ireland in 2030 Note that the incremental generation, transmission and distribution CAPEX virtually vanish at high shares of smart charging. The total cost decreases even further if the BEV is entirely
OPEX Generation CAPEX Transmission CAPEX Distribution CAPEX Total
With 15% of EVs providing FR
GA MOVE/FP7/265499/Green eMotion D9.6: Barriers, gaps, and commercial and regulatory framework for broad rollout of e-mobility
Page 75 of 80
smart charged and also sells frequency regulation (FR) services to the system. Generation opex represents the major part (about €80/year for 100% smart charging), which will be included in the wholesale energy price. For the assumed distance driven in D9.2 of 12,300 km/yr (or 2,170 kWh), the energy component amounts to about 3.7 €¢/kWh, and the total delivered incremental cost with 75% smart charging is €105 or 4.8 €¢/kWh which can be compared with the bottom-up estimates given below, and which are valid for a nearer term electricity system. It has to be noted that the D9.2 cost estimates are based on a fundamental economic evaluation of electricity systems with smart or non-smart EV management. The report does not analyse how these would be reflected in retail electricity prices that normally include components such as taxes, incentives, profits margins etc. One might also imagine simpler ways of managing the DN problem, as once there are suitable smart meters the Distribution System Operator (DSO) might temporarily disconnect those EV owners who had not opted for priority rationing – and that might be almost as effective as complex communications between the DSO and other intermediaries supplying power to the charging point. If the smart meters and two-way communications are necessitated (by mandate or for other reasons) then the extra social cost of the EV under controlled charging could be very low, and well below the average tax and levy exclusive retail cost of electricity, shown in Figure C.3. Note that it is the pre-tax and levy price that is relevant for social cost benefit analysis, and this is particularly important in making comparisons across countries, as Figure C.6, which shows the relationship between pre- and post-tax electricity prices, clearly demonstrates. Thus Denmark, which is one of the cheaper countries pre-tax, has the highest post-tax price in the EU15, while the UK, which is one of the more expensive pre-tax countries, is one of the cheaper post-tax countries.
Source: Eurostat at http://appsso.eurostat.ec.europa.eu/nui/setupDownloads.do
Figure C.3 Average energy prices for medium-sized domestic customers excluding taxes and levies, Jan-June 2013
As a check on the estimates provided in D9.2 and shown in Figure C.2, and to start closer to the existing electricity system rather than one optimized for 2030, one can start from the wholesale energy prices and add transmission distribution charges, losses and margins, to build up the final cost from the elements.
0.00
0.05
0.10
0.15
0.20
0.25
Bulgari
a
Roman
ia
Estonia
Hunga
ry
Croatia
Lithu
ania
Latvi
a
Poland
Sloven
ia
Czech
Rep
ublic
Slovak
iaMalt
a
Cyprus
France
Finlan
d
Greece
Portug
al
Denmark
Netherl
ands
Sweden
Austria
Luxe
mbourg
German
y Ita
ly
Belgium
United
Kingdo
mSpa
in
Irelan
d
Euro
s/kW
h
GA MOVE/FP7/265499/Green eMotion D9.6: Barriers, gaps, and commercial and regulatory framework for broad rollout of e-mobility
In order to estimate the difference between average and off-peak prices one would need the price duration curve for the appropriate nodal price. Given the optimal dispatch model for future electricity scenarios that could be computed but in the absence of that we can look at the 2012 German wholesale price duration curve shown (with those of other countries) in Figure C.4. The reason for choosing German data is that Germany has a higher renewables penetration than most other large EU countries and is therefore better representative of the situation that will be more likely by 2020. Higher renewables penetration raises the spread between peak and off-peak prices. Thus in 2012 in the UK the 25% cheapest hours were 75% of the average price while the 25% most expensive hours were 128% of the average. In Germany in contrast the range was from 52% to 148%, a considerably wider spread.
Sources: EEX, APX, Powernext.
Figure C.4 Price duration curve for wholesale spot electricity in European power exchanges in 2012
The average wholesale price in the markets shown in Figure C.4 was €45/MWh (excluding GB, which was €55/MWh), of which perhaps €3/MWh could be attributed to the carbon cost. The UK is expecting wholesale prices to rise by 15% by 2020 reflecting the need for considerable new investment in generation. If that is more widely true then the average pre-carbon wholesale price might rise by 2020 to €48/MWh, so the 25% off-peak hours would then cost 52% of this or €25/MWh, assuming that in these hours electricity were essential carbon free. If in addition at these times there is no scarcity of, and therefore no need to charge for, transmission and distribution, the 2020 wholesale price might be €¢2.5/kWh. If we take the 25% most expensive hours, the average wholesale price might be 148% of this or €71/MWh, to which should be added a carbon price of €20/tonne (the high value in Table 3.1). With a carbon intensity of a peaking gas turbine for the top 10% and a coal-fired station for the remaining 15%, the average carbon intensity might be 800 g/kWh, adding €16/MWh to give €87/MWh.
European power exchanges 2012
-€ 200
-€ 150
-€ 100
-€ 50
€ 0
€ 50
€ 100
0% 10% 20% 30% 40% 50% 60% 70% 80% 90% 100%
percent time price higher than
Euro
s/M
Wh
UK MIP (Euros)Germany 2012NetherlandsFrance
€ 0€ 50
€ 100€ 150€ 200€ 250€ 300€ 350€ 400€ 450€ 500
0.0% 0.2% 0.4% 0.6% 0.8% 1.0% 1.2% 1.4% 1.6% 1.8%
GA MOVE/FP7/265499/Green eMotion D9.6: Barriers, gaps, and commercial and regulatory framework for broad rollout of e-mobility
Page 77 of 80
In Figure C.5, the energy cost (including losses, contracting, supply margin and profit) was €112/MWh, although the average December 2012 wholesale spot price was only €60/MWh. The efficient energy cost is therefore not simple to estimate, and should include all the contracting and transactions costs and losses to the final delivery to the charging point, taken here as the home. The delivered energy cost in Figure C.5 is 187% of the spot wholesale price, and the implied mark-up may be atypically high. Losses might be 10% (marginal losses are twice that), contracting costs might be 10%, and allowing a generous supplier margin might bring the efficient mark-up on the wholesale price to 50%. Taking the €87/MWh above for peak hours this would give a delivered final electricity efficient energy cost of €130/MWh or 13€¢/kWh. The average off-peak energy cost on the same basis might be 4€¢/kWh.
Source: Ofgem Updated Household energy bills explained (Feb 2013) at https://www.ofgem.gov.uk/ofgem-publications/64006/householdenergybillsexplainedudjuly2013web.pdf
Figure C.5 Breakdown of average household electricity bill (3,300 kWh costing £531) at Dec. 2012
In Figure C.5, the Transmission and Distribution costs (T&D) amounted to £112 (€134) in 2012. There will need to be considerable investment in transmission and distribution to 2020 and this might increase T&D by perhaps 50% to bring the fixed costs to recover in the 25% most expensive hours to €200/year. The household consumption in Figure C.5 was 3,300 kWh/yr, and if all the T&D fixed charges were levied on the top 25% of that demand the €200 would need to be recovered from 825 kWh at the rate of €¢24/kWh on top of the energy cost. The final delivered efficient cost at the peak would then by 13 + 24 = 37 €¢/kWh and off-peak 4 €¢/kWh, so the average peak cost would be over nine times the off-peak cost. This is considerably larger than the typical retail peak: off-peak price ratio, but it
GA MOVE/FP7/265499/Green eMotion D9.6: Barriers, gaps, and commercial and regulatory framework for broad rollout of e-mobility
shows the importance of considering the proper allocation of various fixed costs in estimating the social cost of electricity at various times of the day or hours of the year. Looking into the future is always difficult, but if Europe achieves higher levels of integration so that it can share balancing and reserves and even renewables and reduce the investment needed the cost burden on peak hours might fall (although the interconnection investment costs would rise and offset some of this gain). It is therefore difficult to be sure that electricity costs after 2020 should be much different apart from the higher carbon price. If by 2030 the peaking plant is efficient gas turbines with 450 g/kWh, the high CO2 price of €135/tonne would add €60/MWh and the peak wholesale cost might then be €130/MWh, giving an energy cost to households of 19.5€¢/kWh, and with T&D as before the final peak price might be 43€¢/kWh. The off-peak price is assumed to remain at 4€¢/kWh. The values for the cost of electricity in various years are collected together in Table C.1 and are somewhat higher than the incremental costs for 5% penetration in Figure C.2. In absolute terms, however, the difference is only a few €¢/kWh, and small compared to all the other uncertainties.
Table C.1 Projected peak and off-peak electricity costs, €¢/kWh
Taxes and levies on electricity Figure C.6 shows the relationship between the pre- and post-tax price of domestic electricity for the EU15 countries and demonstrates why it would be very misleading to use after-tax prices in any social cost benefit analysis. For example, UK had the fourth lowest post-tax price in 2012 (because of its reduced rate of VAT of 5% instead of the standard rate of 20%), although it had the fourth highest pre-tax price, while Denmark, which had the highest post-tax price had the fifth lowest pre-tax price. Germany has high retail prices because of the various charges and taxes to support renewable energy.
GA MOVE/FP7/265499/Green eMotion D9.6: Barriers, gaps, and commercial and regulatory framework for broad rollout of e-mobility
Page 79 of 80
Source: DECC 2013a at https://www.gov.uk/government/uploads/system/uploads/.../qep551.xls
Figure C.6 EU15 domestic electricity prices before and after tax 2012
EU15 Domestic electricity prices before and after tax 2012
0
5
10
15
20
25
30
35
France
Finlan
d
Greece
Sweden
Denmark
Luxe
mbourg
Austria
German
y
Belgium
Netherl
ands Ita
ly UK
Portug
alSpa
in
Irelan
d
Euro
cent
s/kW
h
taxesbefore tax
GA MOVE/FP7/265499/Green eMotion D9.6: Barriers, gaps, and commercial and regulatory framework for broad rollout of e-mobility