63
DAB coverage planning Report to Government Statement Publication date: 2 May 2012
DAB coverage planning
Report to Government
Statement
Publication date: 2 May 2012


Main Heading
Contents
Section Page 1 Executive summary 1
2 Background 9
3 Defining coverage using editorial areas 13
4 Defining FM coverage 18
5 Defining DAB coverage 23
6 DAB planning, national and local 38
7 DAB planning: a local case-study 42
8 Conclusions and recommendations 59

1
Section 1
1 Executive summary This report provides a technical feasibility study of a DAB coverage plan to support a potential future digital radio switchover
1.1 The Government published a Digital Radio Action Plan (DRAP) in 2010, the purpose of which is ‘to provide the information to allow for a well-informed decision by Government on whether to proceed with a radio switchover’. Ofcom was asked to chair a DAB coverage and spectrum planning group to ‘determine the current level of FM coverage and develop a range of options to increase DAB coverage to match FM’.
1.2 This report to Government sets out the approach and results of this planning exercise. In particular, it covers:
• The definition of the geographical areas, based on the editorial coverage areas of existing FM radio services, within which we would aim to replicate FM coverage as far as practicable with DAB coverage (we refer to these as ‘editorial areas’ in this report);
• The technical planning parameters used to predict acceptable levels of FM and DAB coverage for indoor portable and in-vehicle radio receivers;
• The extent of existing FM coverage within each editorial area, for both indoor portable radio reception and in-vehicle radio reception on major roads; and
• DAB transmitter network scenarios illustrating how increasing levels of DAB coverage can be achieved using increasing numbers of transmitters, replicating as far as practicable FM coverage within each editorial area.
1.3 Broadcast radio coverage is dependent on a range of different factors including the height of the transmitting antenna and the power of the transmitting station, the type of terrain and ground clutter, atmospheric weather conditions, receiver sensitivity (and aerial gain) and whether the receiver is used indoors or in vehicles.
1.4 There are also important differences between FM and DAB technologies. For FM the quality of the audio output progressively degrades with decreasing signal strength and greater interference, whilst the quality of DAB remains constant and then disappears abruptly. Therefore, comparing FM and DAB coverage requires some qualitative judgement to be exercised over when the level of user experience for FM and DAB is broadly equivalent.
1.5 The DAB network scenarios set out in this report do not constitute a definitive or final view on what the post-switchover DAB network should be, but seek to illustrate the technical feasibility of matching DAB and FM coverage to inform a Government’s decision on whether to proceed with switchover. Therefore, this document does not represent a regulatory decision by Ofcom.
1.6 If Government decides to proceed with digital radio switchover a more detailed planning exercise will be needed, in collaboration with multiplex operators and other stakeholders, to optimise the exact number, location and power of additional DAB

2
transmitters needed to replicate FM coverage in the most practical and cost effective way.
1.7 This report draws upon two previous Ofcom documents - a consultation published in July 2011 which set out our proposed approach to this radio coverage planning work, and an interim statement published in December 2011 which summarised consultation responses and set out the further work we were planning to undertake to improve the accuracy of our coverage planning predictions1.
Establishing local DAB multiplex coverage areas
1.8 There are two types of FM services whose coverage will need to be matched by DAB post digital radio switchover:
a) National FM radio services, which aim to provide coverage across the whole of the UK.
b) Local and regional FM services which serve a particular locality, and target their output accordingly.
1.9 A single DAB transmission collectively delivers a number of different radio stations in what is known as a ’multiplex’. Because many services are delivered together, the coverage of a local DAB multiplex needs to be sufficient to match a composite of the coverage currently provided by a number of local radio stations in its locality.
1.10 Because of this, we have defined a set of local DAB editorial areas, based on discussions with broadcasters on the geographical areas currently served by different local FM radio stations. These local DAB editorial areas are based on a composite of the target coverage areas of the largest local commercial service and the relevant BBC local or nations’ service, within which listeners could reasonably expect to be served by one or both of these services. We have not sought to replicate coverage outside the target editorial areas of FM services (e.g. BBC Radio Manchester can be heard clearly in parts of Liverpool but the service is not intended for those listeners) although some significant overlaps may remain.
1.11 Such local DAB editorial areas already form the basis of some of the existing local DAB multiplex areas. For local multiplexes already broadcasting, transmission infrastructure is in place, and we have sought to develop post switchover scenarios which minimise the need for changes to broadcasting infrastructure.
1.12 For planning purposes, we have either extended the existing local DAB coverage areas or created new ones where necessary, based on discussions with the BBC and larger commercial operators. These extensions take into account existing FM editorial areas as far as possible.
1.13 Every part of the UK will be served by at least one local DAB multiplex in the planning scenarios set out in this report2. In some places there are deliberate overlaps between different local DAB editorial areas, for example where a particular town may reasonably expect services from two adjacent areas (e.g. Warrington is
1 Available at: http://stakeholders.ofcom.org.uk/consultations/dab-coverage-planning/ 2 Although we have not planned in this document for local coverage of Orkney or Shetland, or the Channel Islands, the assumption is that these would be covered too. The Isle of Man local services are not regulated by Ofcom and it is for the Manx regulator to plan services on the island using the frequency allocated.

3
included in both the Liverpool and Manchester local DAB multiplex areas). It should be stressed that any changes to existing areas can only be made at the request of multiplex operators, and we would need to consult on any eventual changes.
1.14 The BBC’s nations services in Wales, Scotland and N. Ireland are expected to be carried on all of the local multiplexes in each relevant nation.
FM coverage is established based on actual listener experience
1.15 Defining FM coverage is not simple. FM radio signals degrade progressively with reducing signal strength and increasing levels of interference. It can be possible to receive a reduced quality but useable service over very wide coverage distances.
1.16 The current internationally-agreed method of predicting FM service coverage dates from the 1950s, and is based on an assumption that listeners receive their radio services using a directional rooftop aerial pointing towards the transmitter (as with television aerials). These aerials have the effect of boosting the reception of the wanted signal, whilst rejecting unwanted signals (interference) received from other directions.
1.17 Today, however, the vast majority of listeners instead receive their radio services on portable indoor and in-vehicle receivers. Receiver performance has also evolved and many modern FM receivers are more sensitive than receivers were 50 years ago. Many also include techniques which can conceal reception problems, enabling listeners to listen to weaker radio signals than used to be the case.
1.18 In developing a DAB coverage plan that reflects the level of FM coverage actually experienced by listeners, we need to know whether our computer predictions, which use a model based on dividing the whole UK into 100m squares, are representative of the FM coverage actually achieved on modern receivers.
1.19 We commissioned an expert review of the factors affecting reception of FM services3. This review considered reception on different types of receiver including in-vehicle and indoor portable receivers. It concluded that the current assumed level of rooftop field strength (54 dBμV/m) provides a good proxy for predicting good, indoor mono FM reception on modern portable receivers. However, it also found that many receivers could provide what some listeners may regard as an acceptable level of service at a lower field strength of 48 dBμV/m, delivering variable, indoor portable FM reception.
1.20 For in-vehicle reception, this review found that variable in-vehicle mono reception can be achieved using a lower field strength of 42 dBμV/m. This is because in-vehicle receivers use an external aerial rather than indoor aerial.
1.21 We believe that it is important that the consumer experience of DAB reception and coverage post-switchover should at least match that of FM. Therefore, if there is a legitimate expectation that listeners will be receiving and enjoying FM services even at lower field strengths, we should seek to match the coverage levels afforded by these field strengths wherever practicable. This will ensure that not only those who enjoy good clear stereo reception will be able to continue to receive radio services on DAB after any switchover, but also that those who have enjoyed less good reception on FM will also be able to receive good DAB reception after any switchover.
3 Available at: http://stakeholders.ofcom.org.uk/binaries/consultations/dab-coverage-planning/annexes/annex-f.pdf

4
1.22 To achieve this, we have used in this report the lower field strengths needed to provide variable mono reception as the basis for establishing FM coverage. This has the effect of extending the level of FM coverage we are aiming to match using DAB, providing a greater certainty for listeners that the services that they had access to in FM could be accessed in DAB post-switchover. It also has the effect of potentially increasing DAB transmission infrastructure requirements.
1.23 We have therefore adopted the following approach for the field strengths used to establish FM coverage:
• For indoor reception, we assume that a 48dBμV/m field strength will just provide a listenable service for consumers, even though this may result in an output that is only available in mono with some distortion.
• For in-vehicle reception, we estimate that a 42dBμV/m field strength will just provide a listenable service for consumers, even though this may result in an output that is only available in mono with some distortion.
1.24 A location is considered to have FM coverage if the required signal strengths set out above are available in 50% of locations within any 100m square under normal atmospheric propagation conditions.
1.25 Based on these field strength planning assumptions we have predicted FM coverage within each local editorial area for the existing BBC local station (e.g. BBC Radio Manchester); the largest commercial station (e.g. Key 103 in Manchester); and the combined composite coverage of these services for indoor portable and in vehicle reception. For UK-wide services, we have calculated the BBC and commercial coverage separately as these are carried by different national DAB multiplexes. For both local and UK-wide services, we have produced FM coverage maps and associated household and road coverage figures.
DAB coverage is defined and planned for on a robust basis
1.26 Defining DAB coverage also requires an assessment of the minimum field strength needed to provide reliable indoor portable and in-vehicle reception. Unlike FM, the DAB failure mode is abrupt and listeners usually find that either a good digital signal is received or none at all.
1.27 DAB coverage was originally established based on the field strength required to provide in-vehicle reception. We commissioned research to confirm the field strengths required to provide both reliable in-vehicle and indoor reception4.
1.28 This research suggested that we should plan for an increased level of field strength to provide reliable indoor portable DAB reception. Using this increased field strength will provide consumers with a better, more robust listening experience than that available at lower field strengths.
1.29 This research also identified that a critical parameter in predicting DAB coverage is the level of receiver performance. We commissioned tests of DAB receiver sensitivity and adjacent channel rejection in collaboration with DCMS which identified a large spread in the performances of DAB receivers available in the market.
4 Available at: http://stakeholders.ofcom.org.uk/binaries/consultations/dab-coverage-planning/annexes/annex-g.pdf

5
1.30 We used in our predictions of DAB coverage a level of receiver sensitivity which represents a reasonable target both in terms of the practical implementation margin normally associated with a theoretical receiver and that which was achieved by many of the receivers tested.
1.31 The level of receiver sensitivity assumed in the planning model forms part of the receiver specifications developed by the DRAP’s Technology and Equipment Group (TEG). If these specifications were to have an associated product mark, it would enable consumers to identify receivers that come with an assurance that they will reliably operate in the planned DAB coverage areas.
1.32 Since publishing our interim statement we have conducted a detailed campaign of DAB reception field tests which has identified that the level of DAB coverage achieved in practice is slightly greater than that predicted by the DAB coverage model. This difference arises from the actual field strength variations within each 100m square being lower than those originally assumed in the DAB coverage model.
1.33 As a consequence of the above research, the planning model has now been updated to more accurately account for the actual measured localised variations in field strength. As a result of this change, the level of predicted field strength required to provide reliable DAB reception is slightly lower than that previously assumed in last year’s consultation. It is important to note that these changes do not alter the robust planning targets previously set for DAB coverage, but improve the prediction accuracy of whether these targets are being met.
1.34 For in-vehicle DAB listening we have previously planned for reception in 99% of locations for 99% of the time (i.e. to ensure robust coverage even in times of unusual atmospheric propagation conditions). This is a much tighter set of planning criteria than for that used for FM which is only planned to provide reception in 50% of locations for 50% of the time. These differences in planning criteria reflect the more abrupt failure mode of DAB reception compared with FM.
1.35 However, these more stringent planning criteria for DAB could be potentially overly cautious when they are being used to compare DAB coverage with variable quality mono FM which is on the edge of reception (as opposed to good quality FM reception).
1.36 In practice, this means:
a) We are aiming to provide robust DAB coverage in areas with currently only marginal FM reception, meaning that many listeners are likely get a much better radio reception experience on DAB;
b) The additional field strength margin used ensure that DAB services are available for 99% of the time in 99% of locations means that for most of the time, under normal atmospheric propagation conditions, DAB coverage will generally extend well beyond the editorial areas of existing FM stations.
1.37 The robustness of our planning criteria for matching DAB to existing FM coverage has an associated cost in terms of the number of DAB transmitters that need to be built to match FM coverage. It will be for Government to make a decision as to the appropriate level of DAB transmitter build-out that will be required in the event of a digital radio switchover.

6
1.38 For the BBC national multiplex, the BBC has carried out its own planning exercise, based on the same planning criteria that we are proposing to predict local DAB coverage. This planning has so far focused on predicting existing levels of national DAB coverage and its extension to 97% of the UK population as agreed through the current licence fee settlement. Further transmitters may be required to fully match existing FM coverage in terms of both variable quality mono FM indoor and in-vehicle reception.
1.39 The operator of the national commercial multiplex, Digital One, has also provided a plan to match the coverage of Classic FM.
DAB transmitter network planning scenarios
1.40 The potential increase in DAB coverage within each local DAB multiplex editorial area to match FM coverage, has been considered in four stages:
• Stage 1: establish the existing levels of local FM and DAB coverage, using the planning criteria set out above;
• Stage 2: establish the improvements in DAB coverage that can be achieved by simply modifying the radiation patterns and/or powers in the existing DAB transmitter infrastructure;
• Stage 3: establish the incremental improvements in DAB coverage that can be achieved by progressively adding more DAB transmitter sites, to a level which approximates to existing variable mono FM coverage; and
• Stage 4: adding further DAB transmitters to attempt to provide as near universal coverage as possible within the editorial area, even if the additional coverage provided by each additional transmitter site becomes sufficiently negligible that it may become potentially unfeasible to build.
1.41 We set out these four planning stages for each local DAB editorial area in our July 2011 consultation. This staged approach provides Government and service providers with an illustration of a range of scenarios for extending DAB coverage, and enables a high level cost-benefit analysis to be performed on these to inform a Government decision on what level of DAB coverage to aim for post switchover.
1.42 For the purposes of this statement we are re-publishing the stage 3 scenario, based on the final set of technical planning assumptions set out above and in Sections 4 and 5.
1.43 The limited number of frequencies available for DAB means that they must be re-used in different local areas around the UK. Interference can be caused by the use of the same frequency in other distant areas.
1.44 The planning scenarios set out in this report require some limited changes to the DAB frequencies used in some local DAB areas where this will reduce interference between different local DAB multiplex areas. We have aimed to minimise these changes wherever feasible.
1.45 Any frequency change is subject to international agreement, which can only be negotiated following specific requests. Depending upon the outcome of these future negotiations it is possible that some of the DAB frequencies assumed in the current

7
planning scenarios might not be usable. This could constrain the actual extent of local DAB build-out.
Conclusions and recommendations
1.46 The DRAP asks Ofcom to ‘Determine the current level of FM; including defining what listeners determine is an appropriate signal quality on FM’ and ‘Make recommendations on the build-out of DAB coverage so that it is equivalent to existing FM coverage’.5
1.47 We believe that the current FM radio station editorial areas provide an appropriate target for post switchover DAB coverage. These editorial areas reflect that FM stations target specific areas and listeners with their output, and we recommend that a composite of these areas is used to determine the target level of DAB coverage to be achieved post digital switchover (where stations carried on the same DAB multiplex will have the same coverage).
1.48 In practice, the level of FM and DAB coverage is not directly comparable, because the quality of FM reception degrades gradually whilst DAB reception degrades much more abruptly.
1.49 To account for these differences we recommend the use of more demanding planning criteria for predicting DAB coverage than for predicting existing FM coverage. These include:
a) Establishing the extent of existing FM coverage based on variable quality mono reception as opposed to good quality stereo reception;
b) For in-vehicle reception, using planning criteria for DAB coverage that require that the service must be available in 99% locations for 99% of the time as opposed to only 50% of locations during normal propagation conditions for FM.
1.50 For indoor portable reception, our planning scenarios indicate that DAB indoor coverage can in principle be extended to match variable quality mono FM coverage, using the proposed demanding set of DAB planning assumptions.
1.51 For predictions of in-vehicle DAB coverage, our planning scenarios indicate that it may not be possible to perfectly match variable quality mono FM coverage on all roads, using the proposed demanding set of theoretical DAB planning assumptions. However, in practice our field tests suggest that in-vehicle DAB coverage can be provided to match FM coverage under normal propagation conditions.
1.52 We anticipate that both the BBC and Digital One will develop their national build-out plans further as these issues are examined; their plans included here are not final.
Next steps
1.53 The DRAP requires the Coverage and Spectrum Planning Group to produce a ‘switchover transition plan’ by Q2 of 20136. We propose to use DAB network planning scenarios outlined in this document as the starting point for developing a more detailed switchover transition plan.
5 Available at: http://www.culture.gov.uk/images/publications/Digital_Radio_Action_Plan_V3.pdf - p23 6 Digital Radio Action Plan, task 4.4

8
1.54 If requested to do so by Government, we will work with multiplex operators, broadcasters, Government and other relevant parties to create a full switchover implementation plan, which will set out, in a step-by-step approach, the necessary DAB transmitter build-out, for both national and local multiplexes.

9
Section 2
2 Background Context to this report
2.1 In July 2010, the Government published a Digital Radio Action Plan (DRAP) the purpose of which is ‘to provide the information to allow for a well-informed decision by Government on whether to proceed with a radio switchover’.
2.2 The DRAP states that ‘a decision on a Digital Radio Switchover can only be made once: 50 per cent of all listening is to digital; and National DAB coverage is comparable to FM, and local DAB reaches 90 per cent of the population and all major roads.’7
2.3 As part of the DRAP, Government set up four working groups to report via a Steering Board to Ministers. One of these groups is a Coverage and Spectrum Planning Group [CSPG], which is chaired by Ofcom, and includes advisory and working groups comprising transmission providers, multiplex operators and broadcasters.
2.4 A key task of the CSPG is to advise Government on DAB and FM coverage. The group is specifically asked to ‘Determine the current level of FM; including defining what listeners determine is an appropriate signal quality on FM’ and ‘Make recommendations on the build-out of DAB coverage so that it is equivalent to existing FM coverage’.8
2.5 The DRAP sets out a number of objectives for the CSPG in relation to these tasks:
• Determine the current level of FM; including defining what listeners determine is an appropriate signal quality on FM;
• For national and large local services define usable coverage of households and roads and publish the results for consultation;
• Define appropriate field strengths and other parameters necessary to deliver robust DAB coverage;
• Identify the achievable coverage from selected sites for DAB services using the latest agreed coverage prediction model, including specifying the geographical and terrain constraints which must be considered in DAB planning;
• For BBC network services and Classic FM, develop options for transmitter plans to match existing FM coverage of households and roads as far as practicable;
• For large local services (BBC and commercial), develop options for transmitter plans to match existing FM coverage of households and roads within agreed editorial areas as far as practicable.
2.6 In June 2011, Ofcom published ‘An approach to DAB coverage planning’, a consultation which set out our approach to these tasks. In particular, the document outlined:
7 Available at: http://www.culture.gov.uk/images/publications/Digital_Radio_Action_Plan_V3.pdf - p2 8 Available at: http://www.culture.gov.uk/images/publications/Digital_Radio_Action_Plan_V3.pdf - p23

10
• Our approach to defining the areas within which we aim to replicate on DAB, as far as practicable, the editorial coverage of existing FM radio services (we labelled these ‘editorial areas’);
• The underlying technical assumptions used to predict acceptable levels of FM and DAB coverage for indoor portable and in-vehicle radio reception;
• The extent of existing FM coverage within each editorial area, for indoor portable radios and for in-vehicle radios on major roads; and
• A study investigating the feasibility of different radio switchover scenarios illustrating, from a broadcast network perspective, how increasing levels of coverage can be achieved using increasing numbers of transmitters.
2.7 This document was not a policy consultation on a regulatory decision by Ofcom, given that the decisions that follow this work would be taken by multiplex operators and by Government. Rather, we were consulting to give a wider public and stakeholder audience the opportunity to express any views on the issues in this document, before we submitted a final report to Government.
2.8 We invited responses on consultation questions that we set out, particularly from a technical perspective or with a focus on the consumer experience. We also noted that further technical work on network planning, and public policy decisions by Government on the issues raised, would be necessary.
2.9 In December 2011, Ofcom published An approach to DAB coverage planning – interim statement. This summarised responses to our July consultation and provided Ofcom’s considerations of the issues raised by the submissions.
2.10 In total, we received 35 consultation responses – 22 from individuals from organisations and 13 from organisations including broadcasters, transmission providers, consumer groups and others. In general, respondents agreed with our proposed overarching approach to coverage planning, although there were differing views on many of the details.
2.11 We also outlined the additional work undertaken by members of CSPG following the July consultation, including in-car driving tests of DAB field strength and reception and tests of our planning assumptions for indoor reception. We highlighted that initial findings from these tests indicated that DAB coverage appears more extensive than had been predicted – in particular, that results indicated that the variability of signals is considerably lower than had been assumed, and as a result that the coverage shown in our consultation documents may therefore have been underestimated.
Purpose and structure of this report
2.12 In line with the obligations set out in the revised DRAP, we are now presenting our final report to Government. The overall purposes of the report are those objectives defined in the DRAP – namely to determine the current level of FM coverage and to make recommendations on the build-out of DAB coverage so that it is equivalent to existing FM coverage.
2.13 To do this, we have structured this report so as to display the logic flow behind our approach.
11
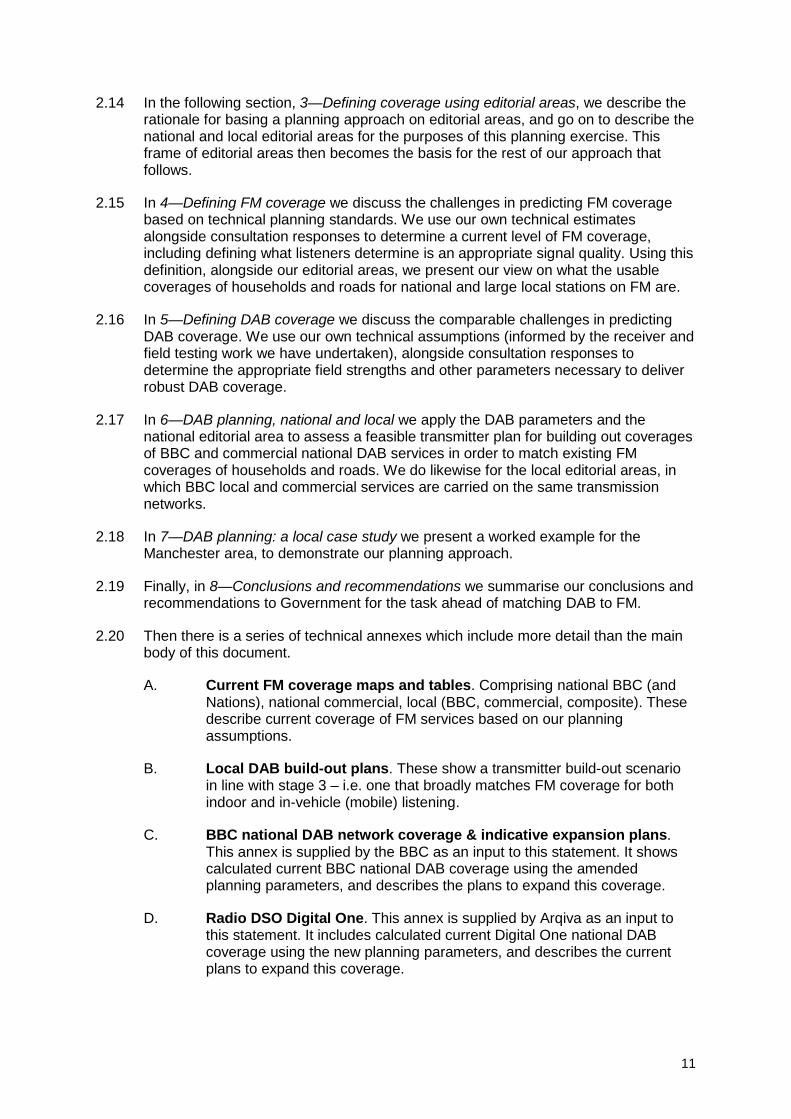
2.14 In the following section, 3—Defining coverage using editorial areas, we describe the rationale for basing a planning approach on editorial areas, and go on to describe the national and local editorial areas for the purposes of this planning exercise. This frame of editorial areas then becomes the basis for the rest of our approach that follows.
2.15 In 4—Defining FM coverage we discuss the challenges in predicting FM coverage based on technical planning standards. We use our own technical estimates alongside consultation responses to determine a current level of FM coverage, including defining what listeners determine is an appropriate signal quality. Using this definition, alongside our editorial areas, we present our view on what the usable coverages of households and roads for national and large local stations on FM are.
2.16 In 5—Defining DAB coverage we discuss the comparable challenges in predicting DAB coverage. We use our own technical assumptions (informed by the receiver and field testing work we have undertaken), alongside consultation responses to determine the appropriate field strengths and other parameters necessary to deliver robust DAB coverage.
2.17 In 6—DAB planning, national and local we apply the DAB parameters and the national editorial area to assess a feasible transmitter plan for building out coverages of BBC and commercial national DAB services in order to match existing FM coverages of households and roads. We do likewise for the local editorial areas, in which BBC local and commercial services are carried on the same transmission networks.
2.18 In 7—DAB planning: a local case study we present a worked example for the Manchester area, to demonstrate our planning approach.
2.19 Finally, in 8—Conclusions and recommendations we summarise our conclusions and recommendations to Government for the task ahead of matching DAB to FM.
2.20 Then there is a series of technical annexes which include more detail than the main body of this document.
A. Current FM coverage maps and tables. Comprising national BBC (and Nations), national commercial, local (BBC, commercial, composite). These describe current coverage of FM services based on our planning assumptions.
B. Local DAB build-out plans. These show a transmitter build-out scenario in line with stage 3 – i.e. one that broadly matches FM coverage for both indoor and in-vehicle (mobile) listening.
C. BBC national DAB network coverage & indicative expansion plans. This annex is supplied by the BBC as an input to this statement. It shows calculated current BBC national DAB coverage using the amended planning parameters, and describes the plans to expand this coverage.
D. Radio DSO Digital One. This annex is supplied by Arqiva as an input to this statement. It includes calculated current Digital One national DAB coverage using the new planning parameters, and describes the current plans to expand this coverage.

12
E. Location Variation for a T-DAB Signal in Band III. This paper proposes that previous assumptions of the variability of DAB signals, and therefore the planning algorithm, should be amended in light of in-car drive tests.
F. Technical parameters and planning algorithms for T-DAB coverage calculations. A report summarising the planning parameters and algorithms that are being used by the BBC, Arqiva and Ofcom in the joint frequency planning work for terrestrial digital radio. This updated version incorporates the correction to location variability.
2.21 These annexes complement the extensive technical work we undertook for our July consultation, all of which remains valid, aside from any references to the earlier value for location variation. These are available at http://stakeholders.ofcom.org.uk/consultations/dab-coverage-planning/, and include:
• Radio DSO initial investigations into optimisation of the frequency plan. This paper discusses options for multiplex mergers as a way of improving coverage in some areas.
• Prediction of the ‘useable’ coverage of FM radio services. A research report by Ægis Systems Limited that examines the basis for the FM planning assumptions, an FM link budget and a summary of some FM receiver testing.
• DAB coverage planning. A research report by Ægis Systems Limited that examines the basis for the DAB planning assumptions used in defining DAB coverage. This report also includes an examination of the DAB link budget and some example receiver testing.
• FM coverage prediction definitions. A report summarising the planning parameters and assumptions made in predicting FM coverage.
• Digital radio receiver sensitivity testing. This is a summary of DAB receiver testing by ERA technology, commissioned by DCMS and Ofcom.
2.22 The plan we outline in this report does not constitute a definitive or final view on any post-switchover DAB network but in effect represents a technical feasibility study which will inform the Government’s decision about whether to proceed with digital radio switchover.

13
Section 3
3 Defining coverage using editorial areas The relationship between services and areas
3.1 The UK radio sector consists of services of many different sizes in many different locations. On FM there are four BBC UK-wide services (BBC Radios 1 to 4) and one national commercial station (Classic FM). On AM there are two national commercial stations (TalkSport and Absolute Radio) and BBC Radio Five Live. There are over 300 local commercial stations on FM or AM, ranging in size of population coverage from Capital FM in London (which serves 4.1m households) to Lochbroom FM in Scotland (covering fewer than 1,000 households). The BBC operates 40 local stations in England as well as nations stations for Scotland, Wales and Northern Ireland. There are over 200 community radio stations, each operating with a coverage area radius of around 5km.
3.2 The Government’s proposed policy for radio switchover is to migrate all national and larger local services currently broadcasting on AM and FM to digital-only broadcasting. The vast majority of large stations are already broadcasting on DAB, but their coverage is not always the same on DAB as on FM or AM. A key step in facilitating a successful radio switchover is therefore to improve DAB coverage so that these stations can continue to reach all of the households that they wish to serve after any switchover.
3.3 Every radio station has a target editorial area - i.e. the area within which it targets its listeners and for which it tailors its content.
3.4 For UK-wide services, both BBC and commercial, the editorial areas are by definition the same – the whole of the UK.
3.5 At a local level, each service tends to have a unique local editorial area for which it is tailoring its output. This is not the same as its actual coverage. There may be holes in coverage within the area the station would like to serve. On the other hand, stations can often be heard beyond their editorial area – for example it is possible to hear BBC Radio Manchester in parts of Liverpool – but the station’s content is not aimed at listeners in Liverpool. Given this, our approach is not intended to plan to replicate this ‘overspill’ in an exact manner. Although some significant overlaps may remain, we are instead focused on providing FM-equivalent coverage for the editorial area of each station
3.6 For the BBC local services in England, the editorial area is often a county or major conurbation and there are very few overlaps between editorial areas. In Scotland, Wales and Northern Ireland the editorial area for the BBC services is the whole nation (although there are some more locally targeted programmes in parts of Scotland and in Northern Ireland, Radio Foyle is targeted at the Londonderry/Derry area).
3.7 For commercial radio, the editorial area is often different from station to station, even where two or more stations nominally cover the same area, such as Greater Manchester. This is because each station may use a different transmitter site or broadcast at a different power. Because there is often more than one FM local commercial service in a local area, we have selected the one with the largest coverage in each area for this planning exercise.

14
3.8 Given this, and as the Government has not yet defined which services are ‘large local’ and so will become digital-only at switchover, we have for the purposes of this plan taken the largest local commercial station plus the relevant local BBC service in each area as the basis for our planning approach.
3.9 In Scotland, Wales and Northern Ireland the relevant BBC station is the nations service (BBC Radio Scotland & nan Gaidheal, BBC Radio Wales & Radio Cymru and BBC Radio Ulster). We have planned these in individual local areas which together cover the whole of each relevant nation.
3.10 The assumptions we have made about stations should not be taken as an indication that any individual station will become digital-only at switchover or that stations not listed here will remain on FM. The decision as to the criteria regarding which stations would switch is a matter for the Secretary of State at the appropriate time.
3.11 On FM, because each station has its own transmission network, it is possible for each station to have its own unique editorial area. But on DAB, the signals of all stations are combined into what is known as a ‘multiplex’. All of the stations that are carried on a single DAB multiplex therefore have the same coverage area.
3.12 Because of this we need to define a set of editorial areas for local DAB which take account of the different stations’ existing editorial areas. So in discussion with broadcasters and multiplex operators, we have defined a set of editorial areas which aim to cater for the needs of both the BBC and commercial radio.
3.13 Thus the DAB editorial areas form a ‘superset’ of FM coverage areas. Listeners able to receive just one of the services via FM should be able to receive all of the local services via DAB.
3.14 Such editorial areas already form the basis of some of the existing local DAB multiplex areas. These DAB licences are already broadcasting – the transmission infrastructure for these services is already in place, and the limited number of DAB frequencies available restricts the opportunities for wholesale change.
3.15 For the purposes of this plan, we have either extended existing areas or created new ones where necessary, based on discussions we have held with the BBC and the large commercial operators, taking into account existing FM editorial areas as far as possible.
3.16 We have drawn up local editorial areas to cover the UK9. Scotland and Wales are divided into local areas, while Northern Ireland is served as a single editorial area. The BBC’s nations services are expected to be carried on all of the local multiplexes in each nation, together covering the whole of the relevant nation. In some places there are deliberate overlaps between two editorial areas, such as where a particular town may reasonably expect services from two adjacent areas. For example, Warrington is included in both the Liverpool and Manchester editorial areas, as stations in both those locations seek to serve the households with their output.
3.17 It should be noted that there are also a number of regional DAB multiplexes, which cover several local areas (for example the West Midlands multiplex). We have excluded these services for our planning exercise, as these generally represent an additional layer on top of local services. BBC services are not carried on regional
9 Although we have not planned in this document for local coverage of Orkney or Shetland, the assumption is that these would be covered too.

15
multiplexes (with one exception) and so there is no universal service commitment; the further build-out of coverage of regional multiplexes is purely a commercial decision for their operators. Regional FM commercial services may choose to be carried on either regional multiplexes, local multiplexes or on a national multiplex.
3.18 We have not yet planned coverage for the Channel Islands (where services are licensed by Ofcom). The Isle of Man has its own regulator, which licenses radio services on the Island, and so it is beyond Ofcom’s remit to plan for local switch-over on the Isle of Man.
3.19 The specific boundaries of each local editorial area we detail in this report are working hypotheses only. Any changes to existing licensed boundaries can only be made at the request of multiplex operators and following a separate consultation.
3.20 The local areas are shown in Figure 3.1 and the areas are shown in detail in the FM and DAB maps (Annexes A and B).
3.21 Our July consultation asked whether respondents agreed with our approach of matching DAB to FM within defined editorial areas. The vast majority of respondents (23) expressed broad support, while three submissions disagreed with our approach. Several respondents who expressed agreement with our approach nevertheless raised additional points about the matter.
3.22 There were two main objections to an approach based on editorial areas:
• Firstly, there was a concern that there could be negative implications for commercial broadcasters of moving from their current unique editorial area, to a larger composite area that they are not geared to serve either in terms of their broadcast content or their sales operation.
• Secondly, there was a view that listeners should not be denied access to ‘out-of-area’ stations which they nevertheless enjoy and derive benefits from (through, for instance, discovering travel information ahead of a daily commute).
3.23 These are legitimate concerns, which we sought to address in our interim statement. In relation to the first issue, most large commercial stations areas are similar to the areas of the relevant local BBC service and so these stations will not have significantly increased coverage areas. For smaller commercial stations, Government policy is that these will remain on FM and so their coverage will not be affected. Finally, any change in the area of DAB multiplexes is subject to a statutory consultation, and therefore the views of broadcasters will be an important component in determining future roll-out.

16
Figure 3.1: Map of coverage planning areas

17
3.24 We also believe that there are good reasons for adopting an editorial areas based approach even though this may, for some listeners, reduce the opportunity to listen to out-of-area stations.
• Firstly, the network design concept behind DAB is simply different to that for FM. On a local scale, most listeners will have access to a wider range of stations that are explicitly targeting their area. In many cases these will include existing local FM stations from within the editorial area which are currently out of range.
• In addition, an attempt to replicate the farthest extent of FM overspill coverage is unlikely to be practicable or cost effective. Such an approach would probably result in particularly large multiplex areas with significant overlaps. Rolling-out to these levels would require a substantial increase in the number of transmitters required, and the larger multiplex areas may reduce the number of frequencies which could be re-used around the country (potentially creating problems for multiplexes which have not yet launched).
• Radio is also increasingly becoming a sector with a mixed ecology of platforms. Most stations now deliver their services by means of a number of different routes, including online, via mobile or through Freeview, and this means that listeners are increasingly likely to be able to access stations from nearby regions (along with many others) even after the implementation of any digital switchover.
• Nevertheless, as with FM, in practice it is not possible to make radio signals stop at administrative boundaries. Consequently there will still be some overspill of DAB signals beyond the editorial area (particularly so in normal propagation conditions given our robust approach to planning). However, such overspill may not be identical to FM overspill.
Conclusion
3.25 All radio stations have an editorial area to which they target and tailor content / output. It is appropriate to take this as a basis for DAB coverage planning. Using a combination of coverage areas of large commercial stations, local BBC stations and existing multiplex areas, we have suggested defined editorial areas which cover the whole of the country.

18
Section 4
4 Defining FM coverage FM coverage within each area
4.1 Having defined the editorial areas which we are using as the basis for our DAB coverage panning, the next task is to define the FM coverage within each editorial area that we are trying to match.
National (UK-wide) services’ coverage
4.2 At a national level, there is an important distinction between the BBC and commercial services. The BBC has a universal service requirement10 while commercial services do not. In addition, the BBC and commercial DAB multiplexes are separate and so their coverages can be designed independently. Consequently, we can treat these two networks separately for planning purposes.
4.3 For the BBC, the task is to match its national digital multiplex coverage to a level equivalent to its national FM services (we have chosen to use BBC Radio 2 coverage as a proxy for this). For commercial national DAB, the challenge is how to match the coverage of the Digital One national digital multiplex to a level equivalent to the single national commercial FM service, Classic FM.
4.4 Classic FM has lower coverage than the BBC’s national networks as it uses fewer transmitters. Classic FM is currently carried throughout Great Britain on DAB by Digital One and in Northern Ireland by the local DAB multiplex. Following the passing of the Digital Economy Act, it is open to Digital One to request to extend its licence to cover Northern Ireland. Digital One also carries the AM national services Absolute Radio and TalkSport. We will aim to match the current FM coverage of Classic FM in both Great Britain and Northern Ireland.
Local services’ coverage
4.5 Just as the local editorial areas of BBC and individual commercial services differ, so do their existing FM coverages. For the purposes of this report we have defined the FM coverage of the BBC service and the largest commercial service within each editorial area, and taken the composite of the two coverage areas as the basis on which to match DAB. This means that a particular location is regarded as being covered by local FM radio if it is predicted that it can receive either the local BBC service or the local commercial service or both.
4.6 However, we have only considered this coverage within the editorial areas we have defined, for the reasons outlined in section 3. It would not be sensible or practicable to plan for DAB coverage to match existing FM overspill, although inevitably there will be some DAB overspill beyond the editorial areas.
4.7 This report does not consider DAB planning scenarios aimed at matching the coverage of AM stations, either BBC or commercial, as this is outside the remit of the Coverage and Spectrum Planning Working Group. However, we note that the Government is planning to switch-off AM services at the same time as FM and there
10 For the nations’ services in Scotland, Wales and Nortern Ireland, the BBC also aims for universal coverage to match the BBC’s UK networks in each nation.

19
are some areas, such as eastern Gloucestershire, where local services are only available on AM. Although we have not been asked specifically to plan for this, we acknowledge that it would be necessary to consider the impact in any subsequent DAB coverage plans. In practice, almost all AM stations are also carried on DAB and so the majority of their listeners would remain served at any future digital radio switchover.
4.8 Prior to determining what the coverage within each editorial area is, we need to define how we measure it and what constitutes an acceptable level of service.
Modelling FM coverage
4.9 FM radio coverage is usually modelled rather than measured: the technology is sufficiently well understood to enable sufficiently accurate computer simulations of coverage. Coverage predictions have been checked with field measurements of received signal strength over a number of years, giving a good degree of confidence in their accuracy.
4.10 The internationally-agreed method of predicting FM service coverage is based on an assumption that listeners receive their radio services using a directional rooftop aerial pointed at transmitter site (in the same way that television aerials do). These directional aerials have the effect of boosting the reception of the wanted signal, whilst rejecting unwanted signals (interference) received from other directions. The assumption that listeners use a directional roof top aerial dates back to the 1950s, when this type of reception was common.
4.11 Today the vast majority of listeners do not use a directional roof top aerial connected by a downlead to an indoor receiver to listen to radio services, and instead receive their radio services on portable indoor and in-vehicle receivers. There have also been a number of other significant changes, including a major reduction in the amount of impulsive noise (ignition interference) generated by motor vehicles (although other sources of impulsive noise have increased somewhat).
4.12 In order to develop a post switchover digital coverage plan that appropriately accounts for the current level of FM service coverage actually experienced by listeners, it is important to determine the extent to which computer simulations of FM coverage, based on the rooftop reception assumption, are representative of the coverage actually achieved on modern portable indoor and in-vehicle receivers.
4.13 To achieve this, Ofcom commissioned an independent review of the assumptions made in predicting FM coverage ahead of our July consultation11. These assumptions include propagation and receiver factors impacting on the portable reception of FM services, reductions in signal strength resulting from in-building penetration losses and reduced aerial height, as well as modern FM receiver sensitivity and co- and adjacent channel rejection performance (i.e. interference from transmitters using the same or adjacent frequencies).
4.14 The minimum quality level which listeners find acceptable is context-dependent. Some listeners will retune if stereo reception, which is less robust than mono reception, is not possible. Vehicle radios may automatically switch away to another station before reception is lost. Conversely someone listening to the news or sports results may use a signal on the edge of failure if it is the only reception possible.
11 Available at: http://stakeholders.ofcom.org.uk/binaries/consultations/dab-coverage-planning/annexes/annex-f.pdf

20
4.15 The independent study concluded that the current assumed level of roof-top FM field strength, 54 dBμV/m, provides an acceptable proxy for predicting robust mono indoor FM coverage on modern portable indoor receivers.
4.16 This study also found that some receivers can work indoors with a roof top field strength of only 48 dBμV/m. Here, indoor FM reception may be susceptible to some background hiss or distortion, or may require the listener to try different receiver or aerial positions to obtain a useable signal. This lower field strength could be potentially used, therefore, to predict the useable but variable extent of indoor FM reception.
4.17 In-vehicle reception can also be achieved at field strengths below 54 dBμV/m. The study identified that a field strength of 48 dBμV/m was capable of providing good robust in-vehicle coverage, whilst a field strength 42 dBμV/m was capable of providing variable mono in-vehicle reception.
4.18 Whilst FM generally degrades less rapidly than DAB there comes a point, known as the FM ‘knee’, where hissy mono reception deteriorates rapidly to the point where reception is lost.
4.19 If the lower field strength figures of 48 dBμV/m are used to define indoor portable coverage and 42 dBμV/m to define in-vehicle coverage, this will:
• have the effect of extending the FM station coverage currently defined using a field strength of 54 dBμV/m;
• ensure that listeners with a useable, but variable quality mono FM service, will be included in the post switchover DAB planned coverage areas. These listeners should experience a significant improvement in the quality in radio reception post switchover.
4.20 The study concluded by setting out a range of field strengths (detailed at figure 4.1) which could be used to define FM coverage in different situations, rather than settling on one approach.

21
Figure 4.1: Options for field strength definitions for FM
Minimum field strength[1]
Environment FM coverage type
Assumptions
54 dBµV/m
Rooftop aerial Stereo
Receiver antenna directivity (as per ITU Rec. BS 599) Protected from interference for both 50% and 5% time conditions
Indoor portable
Robust mono
No antenna directivity Protected from interference for both 50% and 5% time conditions
48 dBµV/m
Indoor portable
Variable mono
No antenna directivity Protected from interference for both 50% and 5% time conditions
In-vehicle Robust mono
No antenna directivity Protected from interference for both 50% and 5% time conditions
42 dBµV/m In-vehicle Variable mono
No antenna directivity Protected from interference for both 50% and 5% time conditions
4.21 We sought views in our July consultation on which of these field strengths would be most appropriate for predicting FM coverage in order to build-out DAB networks to equivalent levels.
4.22 While all respondents to our consultation agreed with our overall approach to defining FM, there were a variety of views as to which field strength levels should be used to define the FM coverage that DAB should match within editorial areas.
4.23 The majority of submissions expressed support for a conservative approach, defining FM coverage using either 48 dBµV/m or 42 dBµV/m, in some cases depending on circumstance.
4.24 Several respondents were of the view that the key issue was that the consumer experience of DAB matched that of FM. Since FM radio signals degrade ‘gracefully’ (i.e. the quality of the signal deteriorates incrementally as the field strength decreases), it is still possible to receive some kind of signal that some listeners may regard as acceptable over longer distances and with lower field strengths. Given this, some respondents argued for the broadest interpretation of ‘usable’ FM to be matched as it would probably reflect listener habits.
4.25 In settling on our preferred approach to defining FM coverage, we have taken account of both the conclusions of the independent study and responses to our consultation.
4.26 We believe that it is important that the consumer experience of DAB should match that of FM. Therefore, if there is a legitimate expectation that listeners will be
[1] At 10m above ground level in the absence of interference and calculated for 50% time propagation conditions.

22
receiving and enjoying FM services even at lower field strengths, we should seek to match the coverage afforded by these field strengths wherever practicable.
4.27 We are therefore adopting a dual approach to defining FM and matching coverage within editorial areas. For indoor reception, 48dBμV/m field strength may provide a listenable signal for consumers, even if there is distortion or the output is only available in mono, and therefore we should seek to match the level of indoor coverage afforded by this field strength. For in-vehicle reception, 42dBμV/m field strength may provide a listenable signal for consumers, even if there is distortion or the output is only available in mono, and therefore we should seek to match the level of in-vehicle coverage afforded by this field strength.
4.28 Annex A shows detailed maps of existing FM coverage for national and local services on this basis.
Conclusion
4.29 For indoor reception, we estimate that 48 dBμV/m field strength measured (or predicted) at 10m above ground level will just provide a listenable service for consumers, even though this may result in distortion or an output that is only available in mono.
4.30 For in-vehicle reception, we estimate that 42 dBμV/m measured (or predicted) at 10m above ground level will just provide a listenable service for consumers, even though this may result in distortion or an output that is only available in mono.
4.31 The coverage given by these field strengths within the editorial areas is the level which we believe should be sought to match DAB coverage. There are real listener benefits to this conclusion as relatively poor quality mono FM reception should be replaced for many listeners by good quality DAB post switchover

23
Section 5
5 Defining DAB coverage How DAB operates
5.1 DAB operates differently to FM. On FM, each frequency can only carry a single service. Each new transmitter added to a network needs to operate on a different frequency from other transmitters in the same region to prevent interference. To achieve near-universal coverage, 2.2 MHz of spectrum is currently needed for each national FM radio service: meaning that at the moment, a total of 11 MHz is used to deliver just five stations.
5.2 DAB makes more efficient use of spectrum than FM. On DAB, a number of services can be carried on a single frequency using a technology known as multiplexing. For any given multiplex, the DAB transmitters operate in a network in which all share a common frequency (what is known as a Single Frequency Network, or SFN). This enables the efficient extension of network coverage, by simply adding more transmitters on the same frequency and not using up further spectrum.
5.3 A national DAB multiplex operating with an SFN occupies 1.75 MHz of spectrum including the necessary guard bands (this is known as a ‘frequency block’) and can deliver over ten radio stations and additional data services. So DAB makes more efficient use of spectrum than FM to deliver a large number of services.
5.4 DAB receivers constructively add together signals arriving from different transmitters operating within the same SFN, rather than treating them as interference as an FM network would do. This provides improved reception as a DAB transmitter signal which is obscured at a particular location can be compensated for by a stronger signal arriving from another transmitter.
5.5 However, signals arriving from distant transmitters within the same SFN, can cause interference if they arrive significantly later than signals from nearby transmitters. These signals can then fall outside what is known as the ‘guard interval’ which cannot be compensated for in the receiver. This can be a particular problem at times of enhanced propagation when the more distant signals are carried across sea paths (for example between north east England and Norfolk).
5.6 All of the transmitters in an SFN must carry exactly the same services if they are not to cause interference to one another. For example if the BBC were to add BBC Radio Scotland to its national DAB multiplex it would have to do so across the whole of the UK unless it was prepared for interference to occur across large areas either side of the border.
UK DAB frequency allocations
5.7 To deliver relevant local radio services in all parts of the UK a different DAB frequency block needs to be allocated to each adjacent local DAB multiplex to prevent inference between two different sets of services. ‘Co-channel’ interference causes an effective reduction in the DAB coverage area, with listeners at the fringes of the coverage area being unable to receive a usable signal. In order to prevent this, a number of different DAB frequency blocks are required across the UK.

24
5.8 In the UK, DAB currently operates using frequency blocks which have been allocated for this use – DAB blocks 10B to 12D, and block 5A (which is not currently used, but is proposed as part of this plan)12.
5.9 In order to provide local DAB coverage across the UK after a digital radio switchover, we need to make sure there is an available DAB frequency block in each local area, and that this is not being used for an SFN in an adjacent or nearby area. So we need a post-switchover plan which coordinates the frequencies of all of the local multiplexes in this manner (even in areas where a local DAB multiplex is yet to launch).
5.10 The national commercial multiplex, Digital One, uses block 11D in England and Wales and block 12A in Scotland (it does not currently broadcast in Northern Ireland). The BBC’s national services are delivered across the United Kingdom using block 12B. These frequencies are therefore unavailable for local DAB multiplexes.
5.11 The 11A block frequency is allocated to the UK but is currently unused, so could be used to provide an additional national DAB multiplex. This block has been set aside, to maintain this opportunity to expand the national DAB service offer in the future. Consequently this frequency block is also not available for local DAB multiplex use.
5.12 The remaining blocks are available for use by local and regional multiplexes. Because there are a limited number of DAB frequency blocks available, the blocks must be re-used around the UK. The aim is to make the distance between areas using the same block sufficiently far apart so as to minimise the interference between the areas.
5.13 In our July consultation, we detailed how local DAB services might be re-planned so as to improve coverage, using this proposal as the basis of our network planning. The frequency plan is shown at figure 5.1.
5.14 Our proposed re-plan aimed to minimise the need to change the frequencies of existing local DAB multiplexes, because this requires transmission equipment to be replaced and listeners to re-scan their radios.
5.15 Our re-plan did not specifically seek to take international interference into account, as the internationally-agreed DAB blocks were planned to avoid international interference as much as possible. To date, few DAB networks have been built abroad.
5.16 In our proposed re-plan, we suggested that some local DAB multiplexes could make use of the frequency block 5A. Although this block is allocated to DAB use, non-broadcast use is currently being made of part of it. An assessment of the impact of new DAB use of 5A is currently being made, and will inform a decision on whether DAB multiplexes can broadcast on this frequency block in the future. If this is not possible, then other multiplexes may need to be extended or merged in order to provide the necessary coverage.
12 Each numbered block corresponds to a specific frequency, e.g. 10B = 211.648 MHz

25
Figure 5.1: Proposed local DAB frequency block allocations
5.17 We also proposed ways that we could amend this coverage re-plan and further increase coverage:
• We raised the possibility of merging of local multiplexes in some areas to create a larger area using a single frequency rather than smaller areas using two separate frequencies, which would relax the pressure on the re-use of frequencies. It would not mean merging services, merely carrying a larger number of local

26
services over a greater area, but there would be commercial implications for stations (e.g. possibly increased transmission costs, and loss of local granularity for advertising sales).
• Although the re-plan attempted to minimise the need to change the frequencies of existing DAB services, we highlighted that it may be possible to consider further frequency changes to increase the level of coverage that may be achieved (although this is likely to be more expensive and require much more international re-negotiation).
5.18 DAB multiplexes can only be merged or have their frequency changed if the multiplex operator asks for a variation of their licence. So both of these methods would require commercial operators to make requests to Ofcom (and have them approved) for the changes to be implemented. We are required by legislation to consult on any requests we receive from operators to merge multiplexes; the views of listeners, broadcasters and other interested parties would all be taken into account in making a decision.
5.19 We received a mixed response in relation to possible multiplex mergers. Many submissions suggested that such decisions would essentially be commercial ones for operators to take a view on, and that in doing so they would have to consider whether larger areas would lead to less ‘local’ services being carried, with reduced benefits for listeners in the areas.
5.20 Since our July consultation, we have had no requests from multiplex operators to merge areas, although we did consult on and allow the Exeter and Torbay multiplex to be extended to cover North Devon. This service is now on air. In light of the mixed responses to the proposals in our July consultation, we have not amended our re-plan to include larger merged local multiplex areas.
5.21 In contrast, most respondents to our July consultation supported further exploring whether additional frequency changes to existing local DAB multiplexes could improve coverage overall.
5.22 We have not made amendments to our re-plan in relation to this option, as our proposal allocates a frequency to every local editorial area across the UK. However, if going forward we encounter barriers to implementing this proposed plan (such as, for example, an inability to agree international coordination for a particular frequency block), then investigation of frequency changes will be our first recourse in trying to address these issues.
Conclusion on our proposed frequency plan
5.23 Figure 5.1 details the frequency plan that we are planning for as part of this report. This plan allocates a frequency for local DAB use in every editorial area across the UK.
5.24 The plans to re-allocate frequencies are subject to international agreement, and can only be implemented following requests from multiplex operators. Ultimately, interference considerations and frequency availability may constrain the extent of localisation of DAB build-out.

27
5.25 The DRAP requires the Coverage and Spectrum Planning Group to produce a ‘switchover transition plan’ by Q2 of 201313. Our frequency plan will be used as the starting point for creating this more detailed transition plan.
DAB planning parameters
5.26 In predicting and planning for DAB coverage, we need to make a set of technical estimates of the characteristics of signals required to provide acceptable reception. These include parameters for field strength, the variability of signals, the amount of time that a signal experiences interference and the number of locations in any given area that a signal needs to be received.
5.27 We explain the assumptions that we have made in the sections below. We also detail the further work we have undertaken since our July consultation, and the effect that this has had on the planning parameters we are using.
Field strength
5.28 We adopted a similar methodology for defining usable field strength as was used for FM. Based on research and testing, we created ‘link budgets’ for indoor and outdoor DAB reception. To determine the levels of field strength that were required, we first needed to know what field strength a receiver needed at its aerial for it to work effectively. Adjustments were then made to compensate for height loss, building loss (for indoor reception only) and how the signal varies across different locations to calculate the field strengths that, if delivered at 10m above ground level, will deliver the appropriate signal levels to in-vehicle and indoor portable receivers.
5.29 If listeners are to achieve good reception over the whole planned coverage area it is important that their receivers are operating at the levels our planning model assumes. So, working with the Technology and Equipment Group (TEG), DCMS and Ofcom jointly commissioned independent research on the performance of DAB receivers currently available in the market. We published the results of these tests in Annex J of our July consultation. These show that whilst there is a large spread in the levels of receiver sensitivity achieved by receivers (in part because receiver manufacturers have not had a realistic target to aim for) the performance level assumed in the planning model is met by many of the receivers, and so represents a realistic figure.
5.30 The required field-strength at the receiver’s antenna is 39.9dBµV/m14 for indoor reception and 34.7dBµV/m for in-vehicle reception. A higher field strength is required for reception indoors as portable radio antennas are relatively inefficient. The requirement to meet the receiver sensitivity performance assumed in the planning model has been incorporated into the minimum receiver specifications issued by TEG. We expect that these specifications will have a an associated Government-backed product mark, enabling consumers to identify receiver equipment that provides them with a level of assurance that it will reliably operate in their planned DAB coverage area.
5.31 When the strength of a DAB signal falls below the level required for robust reception, the receiver will typically emit a burbling, scrambled audio sound for a short period before muting entirely. This may give listeners the impression that DAB reception is
13 Digital Radio Action Plan, task 4.4 14 At a frequency of 220 MHz. Values vary somewhat across the band, as detailed in Annex F

28
more ‘critical’ than FM, which tends to degrade more gracefully, including the switching from to stereo to mono reception.
5.32 Because of this difference in the way FM and DAB receivers behave, when planning DAB services, we have required a higher DAB signal strength so that audibly error-free reception is possible in a greater percentage of locations and for a greater percentage of time than for FM. These factors are explained in more detail in subsequent sections of this chapter.
5.33 For both in-vehicle and indoor portable coverage planning, the required field strength is defined in a standardised way, as it is for FM planning. This is specified as the field strength required at 10m above ground level. The field strength figures are based on the field strength required at the radio antenna and adjustments are made for the variability of signals, reduced height and, for indoor reception, building penetration.
5.34 Due to the different ways in which DAB services are listened to on indoor portable receivers and in-vehicle receivers, and in different building types, a number of different outdoor field strength targets are therefore required to predict service coverage.
5.35 DAB networks were originally planned to provide mobile reception in vehicles. In practice a large amount of DAB listening is to portable radios used in the home. To deliver services to these receivers, a higher signal strength is generally required to overcome the loss of signal inside buildings, so in 2006 planning assumptions for 'indoor portable' receivers were agreed (the details of these can be found in Annex G of our July consultation).
5.36 Ofcom commissioned an independent assessment of the appropriateness of using these field strength values for predicting DAB coverage. The study concluded that these field strengths are valid for DAB service planning (Annexes G and I of our July consultation).
Figure 5.2: Previously proposed field strength definitions for DAB
Environment Coverage type
Equivalent field strength dB(µV/m) measured at 10m above
ground level
Rural & suburban Dense urban
Indoor portable Robust service 69 77
Useable service 64 71
In-vehicle Robust Service 58
5.37 Our July consultation asked whether respondents agreed with this approach to determining the extent of existing DAB coverage, and its relation to the approach we take for FM.
5.38 The vast majority of submissions expressed agreement with our overall approach to planning DAB, and were also in agreement that we should plan on the basis of higher suggested field strengths than previously used for DAB. We view this as confirmation that a cautious approach to defining indoor and in-vehicle DAB reception is appropriate.

29
5.39 Since publishing our interim statement, we have continued with additional field testing work to better inform this final report. A key objective of this work was to better understand the consumer experience for listeners to both FM and DAB services.
5.40 In order to test more robustly our in-vehicle coverage planning assumptions we have undertaken a significant amount of in-car drive tests in different locations to compare actual DAB reception and signal strength with our predictions.
5.41 These tests included:
• Objective measurements of the received mean field strength and its standard deviation at regular intervals.
• Subjective measurements of whether the commercially available in-car radio provides a useable service at regular intervals.
A full summary of the conclusions from this work is available at Annex E.
5.42 These tests identified that DAB coverage was in general more extensive than predicted. The tests also revealed that the likely reason for this difference was that the localised variation in field strength measured was considerably lower than had been assumed in the DAB coverage planning model.
5.43 When predicting the coverage of DAB networks, the variation of signal level within a 100 metre square (known as a prediction pixel) is of key importance. As discussed, the signal strength within each pixel will always vary to some extent due to changes in terrain and obstructions within the pixel. For our coverage model to make accurate predictions, we need to make an allowance for how much the signal is likely to vary (e.g. whether the majority of field strengths are close to the overall average, or whether there is a wide range of different field strengths across the prediction area). We do this by using the standard deviation of the signal variation, which is a measure of the “location variation”.
5.44 Many measurements of this variation have been made over the years, but these were historically made for pixels sizes of 500m or even 1km squared which were used in older prediction models or in international planning. DAB coverage planning predictions are now being carried out at a pixel resolution of 100m (and with a discussion of moving to 50m in future) and use ground cover or clutter data too15. It is reasonable to expect that in a smaller prediction area, the location variation will be lower, as the extent of terrain and local obstructions differences are likely to be lower over these reduced distances.
5.45 Our drive tests have indicated that the location variation is indeed dependent on pixel size as well as local ground cover. Measurement indicate that the appropriate value to use in 100 m pixels is less than that previously used in prediction models with a greater pixel size. This enables us to improve the accuracy of our predictions, and update the coverage estimates contained in our July consultation.
15 Present planning tools use terrain data with a resolution of 50m and ground clutter data with a resolution of 100m in most areas but with 25m resolution in dense urban area. Clutter data is broken down into 16 different ground cover types varying from water through various types of open landscape to woodland, sub-urban, urban to high city. In contrast international planning models will just use an average terrain roughness or sea and no clutter.

30
Figure 5.4: Map of outdoor coverage for Kent with original location variation
Figure 5.5: Map of outdoor coverage for Kent with revised location variation

31
5.46 The effect of adopting a lower location variation is that the predicted coverage area increases – in some cases quite significantly. This is because more of the locations within a prediction pixel are assumed to be of the average field strength or above, and therefore areas that were previously not predicted to receive sufficient location coverage are now predicted to benefit from DAB reception. The change is illustrated in the maps above (figures 5.4 and 5.5).
5.47 Changing the location variation in this way improves the accuracy of our predictions but, perhaps counter-intuitively, reduces the 10m field strengths we will be planning for – the revised values are listed at figure 5.5.
5.48 It is important to note that there is no change in the field strength we aim to deliver to vehicle and indoor portable antennas. The required field-strength at the receiver’s antenna remains at 39.9dBµV/m16 for indoor reception and 34.7dBµV/m for in-vehicle reception. Instead the reduction in 10m field strengths reflect the fact that the required signal levels at the antenna can be attained with a lower level of signal 10m above ground than previously understood. This change results in an improvement in predicted coverage compared to our original estimates.
Figure 5.5: Minimum field strength definitions for DAB using revised location variation figures
Environment Coverage type
Equivalent field strength dB(µV/m) measured at 10m above
ground level
Rural & suburban Dense urban
Indoor portable Robust service 68 75
Useable service 62 70
In-vehicle Robust Service 54
Percentage of locations
5.49 Like FM, DAB coverage is predicted using a software planning model. This uses a detailed terrain database so that the impact of hills and valleys on coverage can be taken into account. In producing a DAB coverage plan, Ofcom, the BBC and Arqiva have agreed a model for predicting coverage.
5.50 Location availability is a measure, generally given as a percentage, of how much of an area will receive a service. For example if a 100 by 100 metre square (a ‘prediction pixel’) is predicted to have 50% location availability a listener’s receiver should provide a good service in 50 out of 100 randomly chosen places in that pixel.
5.51 The signal throughout a pixel will always vary to some extent due to:
• changes in ground height over the prediction area;
• fixed physical objects such as buildings and trees (also called ground cover or clutter) and terrain that obstructs the direct signal from the wanted transmitters;
16 At a frequency of 220 MHz. Values vary somewhat across the band, as detailed in Annex F

32
• moving objects such as vehicles and people;
5.52 Set against this natural variability, within a DAB single frequency network (SFN), where multiple transmitters are used to provide the signal on the same frequency, there is also a reduction in signal variation across a pixel, and hence an increase in the location availability. SFNs help in two ways. Firstly the signals of all of the contributing transmitters combine to increase the overall signal and, secondly, if the path from one transmitter to a receiver is blocked by an obstruction, such as a building, it is possible that another transmitter might have a clear path.
5.53 Computer predictions of FM coverage are carried out on the basis that a standard receiver will provide a service in 50% of the locations within the prediction pixel. For FM radio, 50% location availability is sufficient to provide a service although at lower levels positioning of the radio and its antenna may be critical, but this may still be considered an acceptable service by the listener.
5.54 However, due to the fact that DAB receivers tend to either provide excellent service or none at all, depending on their exact location, a level of 50% for the DAB location availability would not be acceptable in defining a match with the FM experience. In practical terms, achieving a greater location availability is achieved by increasing the predicted signal level at the centre of the pixel.
5.55 For DAB we have previously used three different location availability figures:
• 99% is used for mobile services. A high requirement is necessary due to the need to deliver coverage to vehicles which can only follow a set route and to ensure that the signal remains sufficiently strong as the receiver moves to ensure that reception does not drop out. For example, a stationary vehicle held up at traffic lights or in congestion might become ‘trapped’ in a reception not spot if DAB coverage is not planned to available in a high percentage of locations.
• 95% is used to indicate robust indoor coverage. This value is considered acceptable on the basis that the position of a static portable receiver and the orientation of its antenna can be adjusted in a way that is not possible for a vehicle receiver. Reception will be useable in virtually all locations within a property based on this location availability target
• 80% is used to indicate a useful indoor service. This lower threshold indicates that a service should be available to most receivers if well positioned.
5.56 In terms of calculating overall household coverage, we will use a ‘proportional method’ for indoor coverage. This means that for a 100m square pixel within which at least 95% of locations are predicted to be covered, we will assume that all of the households within that pixel are covered. Where between 80% and 95% of locations within a pixel are predicted to be covered, we will assume the same proportion of those households are covered as the percentage of locations. Where fewer than 80% of locations within a pixel are predicted to be covered, we will assume that none of the households are covered.
5.57 In our July consultation, we suggested that for in-vehicle reception, achieving coverage in 99% of locations may not be required during times of ‘normal’ propagation conditions. This is because a moving DAB receiver is capable of providing a good quality audio signal even if there is insufficient signal in some locations.

33
5.58 In practice, three conditions would need to be simultaneously met for the audio signal to be lost:
• The receiver would need to be in the 1% of locations with insufficient field strength;
• The receiver would need to be static (e.g. stationary in traffic) or moving slowly;
• There would need to be significantly enhanced radio propagation (an atmospheric ‘lift’ which occurs during periods of sustained high pressure) creating interference from distant DAB transmitters. These conditions occur for 1% of time (i.e. for only a few of days a year).
5.59 Most respondents to our consultation urged that we adopt a cautious approach when choosing the percentage of locations parameter for in-vehicle reception. The majority view was that 99% location availability should be adopted for mobile services to ensure that coverage was as robust as possible. We have therefore adopted this as our planning criterion. However, we recognise that in some cases reception may be acceptable using a lower location availability measure.
5.60 For indoor reception, the choice of the appropriate percentage location parameters is a subjective one – some listeners may find indoor service acceptable so long as the receiver produces a listenable output in the majority of locations that they wish to use it (i.e. greater than 50%). For this reason, although we have looked to plan on the basis of robust coverage wherever practicable, we have also included population figures for lower percentages of locations (such as 50% and 70%).
5.61 We have also conducted additional field testing work to further validate our planning assumptions for indoor reception. We have taken a series of subjective measurements (i.e. noting whether there is adequate reception) using DAB radios of known ‘calibrated’ performance at a number of locations in a variety of homes.
5.62 More detail of this work is provided below. In summary, the results indicate a good degree of consistency between our predicted coverage and the reception that listeners are actually able to achieve.
Why did we undertake measurements? We devised a simple experiment to measure the listener experience – and therefore the level of coverage – experienced by DAB radio listeners within their homes. Comparing this data against predicted levels allows us to determine how accurately predictions of coverage match the experiences of listeners. What did we intend to measure? One common way to predict the level of radio coverage is based on the percentage of locations at a particular postcode or address at which reception is likely to be considered acceptable. For example, at a given address the level of coverage could be predicted as 90% locations, meaning that if the radio were moved around the property at that address, there should be coverage at 9 out of 10 locations in which it is placed. How did we go about measuring it?

34
Our approach required participants to take one of six identical DAB radios of known performance and measure the degree of coverage by listening to preset stations at a number of locations within their home. Each participant was provided with an identical set of instructions, advising them to tune to each station with the aerial fully extended and make a note of the quality of reception. We intended to measure the reception of all multiplexes available at each participant’s home. The majority of participants live in the London area and are served by the BBC and commercial national multiplexes and the three London multiplexes. Those participants living outside the London area were asked to measure the reception of the two national multiplexes plus any local multiplex(es) available at their address. Each participant was requested to listen to one preset radio station per multiplex. The stations were chosen on the basis that they broadcast broadly similar content (i.e. popular music), to facilitate the detection of interference across all stations. Participants were asked listen to each station for between 10 and 30 seconds and rate the reception quality with one of three scores; 1) good with no interference, 2) audible but with perceivable interference (occasional burbling) or 3) unlistenable (frequent burbling or muted). After noting the reception quality of the designated stations on each of the available multiplexes, the participant moves to another location in their property and starts the process again. This is repeated until the coverage quality for each preset station at a number of locations has been measured; the target number was between 15 and 20 locations per property. What did we learn from the results? Approximately 60 participants took part in the measurement campaign over the course of two months, with the majority of results collected within the Greater London and Home Counties area. It is important to note that the study was purely intended to provide a comparison between predicted and actual coverage, not to measure coverage in a particular area, so the geographic bias is relatively unimportant. Each participant submitted an assessment of reception quality for each of the available stations at a number of locations within their property. From this we determined the percentage of locations at that property at which reception, and therefore coverage, for each station was considered acceptable. This figure was then compared with the predicted level of coverage at that address. Broadly, three outcomes are possible: • Measured coverage is the same as predicted coverage, i.e. the approach to
predicting levels of coverage accurately reflects the levels of coverage actually experienced by listeners in their homes;
• Measured coverage is better than predicted coverage, i.e. the approach to predicting coverage underestimates the coverage actually experienced by listeners;
• Measured coverage is worse than predicted coverage, i.e. the approach to predicting coverage overestimates the coverage actually experienced by listeners.

35
The results showed that the level of coverage actually experienced by listeners was, in the majority of cases, as good as predicted or better. This is especially the case for the higher power, national multiplexes. Further work These initial results provide a useful indication of the accuracy of the way in which DAB coverage is predicted. However, the study would benefit from additional measurements, especially taken in areas outside of London and the Home Counties. We are working with partners to roll out the measurement campaign to more participants.
5.63 We will continue to undertake ongoing tests to ensure that the consumer experience of DAB reception is accurately reflected by the planning parameters we are adopting for our coverage modelling.
Percentage time availability
5.64 The level of co-channel interference between areas is not constant. During limited periods of the year, as noted above, atmospheric conditions can be such that signals from distant transmitters (even those in other countries) cause more interference than normal. Because of this, the amount of time that the services should be reliably receivable in the coverage area is another important consideration in the coverage planning process.
5.65 Local DAB services in some areas of the country, in particular those with flat terrain or a coastal location, such as Lincolnshire and Norfolk, are particularly susceptible to these problems, and residents of these areas may be familiar with similar problems occurring with TV and FM radio reception.
5.66 In planning DAB coverage, we have taken a cautious view, planning for 99% time availability (i.e. for reception which can be maintained at all times except during infrequent atmospheric lifts). This is the same availability target used for planning the BBC’s national FM services but is more demanding than that used for planning commercial national and local FM stations, where normal propagation conditions are assumed.
5.67 A consequence of using this cautious approach is either to reduce the effective coverage area or potentially to require significant numbers of additional transmitter sites. This might mean that in exceptional circumstances – areas where there is particularly marginal FM coverage, for instance – it might prove challenging to provide a similar level of DAB coverage when planned using these robust parameters.
5.68 However, in these situations we can adopt a more nuanced approach to meeting DAB coverage targets. It may be appropriate to make trade-offs in the planning parameters in order to provide coverage, by reducing either the time availability or location availability target to a level of availability that is representative of ‘normal conditions’ but not so robust as to render it impractical.
5.69 Short term additional incoming interference from other transmissions using the same block of DAB frequencies does not typically occur to any great degree for more than a few days a year in total. It follows that the difference between DAB coverage predicted to be available for 50% of the time and, say, 95% of time, is likely to be low as the following diagram (Figure 5.3) illustrates. To predict coverage under normal

36
propagation conditions therefore, it is appropriate to use 50% time availability as a proxy for this.
Figure 5.3: Illustrative diagram showing the relationship between coverage and interference
5.70 Therefore within our planning we have considered both 99% time availability and normal propagation conditions, clearly indicating the effect of varying this parameter on the coverage achieved with a given transmitter network.
5.71 We will continue to collate evidence in relation to the differences between 99% time availability and normal propagation conditions.
Conclusion on appropriate DAB parameters
5.72 We confirm that the required field-strength at the receiver’s antenna is 39.9dBµV/m for indoor reception and 34.7dBµV/m for in-vehicle reception
5.73 However, following detailed testing, we have concluded that it is appropriate to use a lower location variation value than previously adopted (with a standard deviation of 4dB rather than 5.5dB, as outlined in Annex F), given that location variation is dependent on pixel size and that pixels are now 100m rather than 500m or 1km as in previous models.
5.74 Given this, the relevant field strengths for planning robust indoor DAB reception are 68dBµV/m (for rural and suburban areas) and 75dBµV/m (for dense urban areas).The correct field strength for planning robust mobile DAB reception is 54dBµV/m. It should be noted that these field strengths are all as predicted at 10m and there has been no change in the field strength delivered to the radio antenna.
5.75 Wherever practicable, we will continue to plan mobile coverage on the basis of 99% location availability.

37
5.76 We will continue to define indoor household coverage on a proportional basis derived from 80% (usable) and 95% (robust) location availability.
5.77 For planning both indoor and mobile coverage, we will continue to plan for a robust level of time availability (99%) but we will also note coverage under normal propagation conditions.
5.78 In exceptional circumstance, it may be appropriate to adopt a more flexible approach to meeting DAB coverage targets. Where FM coverage may prove challenging to match using robust DAB planning parameters, we may need to make trade-offs in those parameters in order to provide coverage, by reducing either the time availability or location availability target to a level of availability that is representative of ‘normal conditions’ but not so robust as to render it impractical.
5.79 Even in these limited number of situations where we consider trade-offs in location or time availability, we expect that listeners will experience a useable DAB service which will be broadly comparable or better than FM.
5.80 The consideration of where and when to apply these trade-offs is necessarily one that needs to be made on a case by case basis, taking into account the number of households affected and the costs of the additional transmitters that would be required under the robust planning parameters.
Comparing FM and DAB coverage prediction
5.81 It is difficult to compare FM and DAB coverage on a like-for-like basis, because of the differences between the two technologies, as previously described.
5.82 One particular difference from the listener’s point of view is the property of graceful degradation of FM: reception deteriorates gradually as the listener moves out of a coverage area, whereas DAB is either receivable at high quality or not at all.
5.83 These differences underlie but are compounded by differences in the planning and prediction models we use for FM and DAB. With DAB we have to plan for perfect reception; with FM we can plan for acceptable reception. FM is not planned to the same -technical definitions of coverage as DAB.
5.84 From the listener’s point of view, our approaches to DAB and FM planning should result in a superior experience when substituting DAB for FM, at the margins of FM reception. Some listeners who presently get a poor level of FM service will get good DAB reception.
5.85 In addition the fact that we are matching the superset of combined local FM coverages means that listeners who currently only receive either their local BBC station or their local commercial station are likely to receive not only both stations via DAB but a range of additional services too.

38
Section 6
6 DAB planning, national and local Planning the build-out of DAB coverage
6.1 Having outlined in the previous sections the steps taken to establish our approach to FM and DAB coverage planning, this section considers the build out of DAB coverage to FM equivalence, within the editorial areas proposed in Section 3.
6.2 This section discusses a range of options for Government to consider for building out DAB coverage. This is because of:
• The difficulties (discussed in section 4) associated with establishing a direct comparison between FM and DAB coverage;
• The commercial and operational decisions that will need to follow this theoretical exercise, when the actual service and transmission providers make plans in the light of their businesses and local realities. It is likely to be more useful to have a theoretical model which includes a range of options in terms of transmitter sites, and specific details for each, than to have a single answer at this stage of planning for DAB equivalence.
• The different coverage objectives of commercial operators, who seek a commercially viable transmission infrastructure, and the BBC, which has a mandate for near-universal provision of its services; it is not within the scope of this planning exercise to broker a deal between those different parties.
• The decision to build out DAB coverage to a certain level before switching off FM services requires an evaluation of costs and benefits that can only be made as a matter of public policy. The DRAP outlines the process that will lead to these further decisions being taken, and DCMS will take this process forwards.
6.3 So to enable future decisions to be made by Government on DAB switchover, we propose an approach of planning up to near-universal DAB coverage within the agreed editorial areas. This technical exercise will create a set of options for decision makers.
6.4 The methodology we set out below is the same as that outlined in our July consultation. Responses to that consultation did not suggest an alternative approach, and our further research has not indicated a need to deviate from this approach. However, our amendments to the DAB planning parameters mean that the level of coverage (including the population and roads covered) is now different. Some of the specific area plans may need to be amended in light of this, and we will consider this carefully as we take our more detailed planning work forward.
A staged approach to local coverage build-out
6.5 Coverage build-out is an inherently incremental process. From the baseline of current multiplex coverage (planned coverage, in the case of multiplexes licensed but yet to launch), the obvious way to increase coverage is the addition of further transmitters to the single frequency networks.

39
6.6 However, before making any such additions, it may be economically more effective to upgrade the capabilities of individual transmitters already operating within the SFN.
6.7 A typical local DAB SFN consists of a small number of high-power transmitters to which various smaller transmitters are added to serve those areas not already covered by signals from the larger transmitters that form the core of the network.
6.8 As the coverage of a broadcast transmission network is rolled-out to cover a greater percentage of the desired service area, there is a case of diminishing returns. The first transmitters built into the network will tend to achieve the greatest coverage in terms of both area and population served. As additional transmitters are added to the SFN, each will tend to increase the total network coverage achieved by a lesser amount than each of those which are already broadcasting.
6.9 It follows from the above that the marginal cost of providing coverage for additional listeners increases as total coverage expands. A list can be derived, with transmitters arranged in diminishing order of coverage added. For commercial broadcasters there would be a cut-off point on this table below which increasing coverage ceases to be economically viable (i.e. the cost of the additional transmitter is greater than the incremental income which would be generated by that addition). For the BBC, there would be a lower cut-off point on this table, at which the competing demands of universal service and value for money would be reconciled. Therefore in creating a list, the approach taken here is to keep adding transmitters until the final transmitter adds a magnitude of incremental coverage benefit that is just on the borderline of being viewed as providing value for money.
6.10 Economic modelling and discussions of value for money are beyond the scope of this report. Therefore, the planning process used for local multiplexes has deliberately sought to identify the maximum extent of transmitter build that is likely to be required. It is not possible to guarantee that specific sites identified will be available or ultimately needed to complete coverage.
6.11 Because the process of modelling road coverage (outdoor) is different to the process of modelling population coverage (indoor; households), separate lists of incremental coverage added by transmitters need to be created for both reception scenarios.
6.12 Drawing up incremental transmitter coverage lists for roads and indoor coverage, up to near universal coverage, provides an effective continuum along which a build-out point can be selected. However, it is possible to identify discrete stages along this continuum, and for the purposes of informing a Government decision about the viability of DAB switchover, we consider that it would be helpful to identify build-out scenarios associated with these stages, to simplify the information that this modelling will provide.
6.13 Stage 1. The baseline we are working to is either current coverage provided (for launched multiplexes), or current coverage based on the technical plans in licence awards (for un-launched multiplexes). It should be noted that in this document and accompanying annexes we calculate current coverage with the revised coverage prediction parameters that this document introduces. This means that further planning done from this point onwards can result in a greater consumer confidence around the reception of DAB services. This does mean, however, that existing coverage predictions will not be comparable with the new ones. In particular, until it is updated, the current post code database used by Digital Radio UK for consumers to predict DAB coverage may not be comparable. Digital Radio UK is working to update this and expect to do so shortly.

40
6.14 Stage 2. The logical first step of any upgrade is to make various improvements to existing transmission infrastructure. Existing DAB transmission facilities can be upgraded in various ways. For example, the power of transmissions can be increased, the effective antenna height can be increased (thereby improving coverage) and, in some cases, existing directional restrictions in the antenna’s radiation pattern can be modified or removed.
6.15 Stage 3. The next step is to add additional transmitters targeted at geographical areas where FM coverage is robust, but which are not well served by DAB yet. In this stage of DAB network upgrading, it makes sense where possible to add other transmitter sites which are already used for broadcasting (especially other DAB networks) and which therefore have much of the required background technical infrastructure (power supplies, data links etc.) already in place. This stage of network expansion could include one or more additional high-power transmitters as well as further smaller-fill-in transmitters.
6.16 Stage 4. The final stage of DAB network expansion involves providing coverage to any remaining centres of population which have not been reached as a result of measures taken in the preceding two stages of expansion. At this point it is likely that many of the sites involved may not previously have been used for broadcasting and that infrastructure costs per listener served will increase as a result. Furthermore, the number of additional listeners served and additional road mileage covered for each new transmitter will begin to decline. It is probable that at some point during this final stage of network expansion the threshold of value-for-money in universal build-out would be passed, as the majority of the sites identified will need to be built from scratch and at potentially high costs per additional listener served.
6.17 These stages are not so easily applicable to the national multiplexes, where coverage is already at a higher level than most local multiplexes, but for the bulk of the planning exercise – the local layer – they provide a helpful way of understanding the magnitude of the build-out tasks.
National DAB planning
The BBC national multiplex
6.18 The BBC has given a commitment as part of the last licence fee settlement to ‘enhance its national DAB coverage in the period of this agreement, and to match its national FM coverage as a switchover date draws near’17.
6.19 The first stage is to establish the base-case, our current coverage scenario, but calculated using our new planning parameters. At the date of publication, 230 transmitters are on-air. The base-case is described in full in Annex C.
6.20 The BBC plans to improve its DAB coverage further to reach around 97% of the UK population. This involves a process of looking at transmitter sites used in the local DAB planning, assessing whether there is merit in using them to extend the national network, and, where no suitable site exists in the local plans, identifying new ones; a process that is underway but not concluded. The latest - but not the definitive - version of this plan is also in Annex C.
17 Available at: http://www.culture.gov.uk/images/publications/Lyons_BBC.pdf

41
The national commercial multiplex
6.21 Digital One has provided a possible scenario which sets out a series of improvements and additional sites. It aims to identify what developments of the existing Digital One network are needed to deliver reception which is comparable to Classic FM’s analogue transmitter network.
6.22 Wherever possible, Digital One has sought to deliver contiguous digital radio coverage for both mobile and in-building reception. The work has not been commercially driven – neither by Arqiva as a transmission provider nor by the commercial criteria of Digital One’s customers. Digital One says that several of its customers believe the current network of 133 transmitters includes sites which, according to the radio station’s business criteria, are already non-economic. However, Digital One believes that the improvements proposed should be economically sustainable as the route and timetable to switchover continues to be clarified.
6.23 In its planning work, Digital One has not sought to ensure that each and every house or road which the model suggests has FM reception will also receive DAB reception, as they believe this would have been wasteful and simply uneconomic for Digital One’s customers. By way of example, in some cases the nature of FM propagation means that in order to deliver robust coverage in a densely populated area, a particular site is used at a particular power and as an unintended consequence the FM signal also reaches very sparsely populated hillsides which Classic FM was never seeking to cover. At the same time, the limited FM spectrum available to Classic FM means that some towns have poor coverage, or no coverage. In this process Digital One has not sought to bring DAB coverage to every sparsely populated hillside but has sought, where possible, to reach towns and major roads where Classic FM does have coverage and in addition to some areas where Classic FM's analogue coverage is poor or inadequate. Their broad aim has been to match or exceed overall existing coverage levels without seeking to ensure that every existing home served for FM will be fully served for DAB.
6.24 The proposed improvements and additional sites include several sites in Northern Ireland. As yet, Digital One has not applied to extend its licence to Northern Ireland or discussed the detail of the sites in Northern Ireland with service providers (i.e. the owners of stations and services on Digital One).

42
Section 7
7 DAB planning: a local case-study 7.1 This chapter provides an example of how DAB coverage could be built to match
existing FM coverage for the Manchester local editorial area.
Stage 1: Existing coverage
Current FM coverage of Manchester
7.2 Analogue FM local radio services for the Manchester area are currently delivered using high-power transmitters on high ground to the north-east of the city. BBC Radio Manchester is broadcast from two transmitters (Holme Moss and Saddleworth) with the largest local commercial service, Key103, using one (Saddleworth).
7.3 The following table sets out the population and road coverage achieved by each of these two FM local radio services. It then sets out the composite coverage achieved both services taken together; that is to say taking into account all locations served by one, other or both stations.
Figure 7.1: Current Manchester local FM coverage Manchester
Households Major roads
No. % Km % Total in editorial area 1,422,055
1,591
BBC 54dBµV/m 1,221,650
85.9%
1,286
80.8%
48dBµV/m 1,355,349
95.3%
1,462
91.9% 42dBµV/m 1,505
94.6%
Key 103 54dBµV/m 1,020,625
71.8%
897
56.4%
48dBµV/m 1,259,325
88.6%
1,228
77.2% 42dBµV/m 1,273
80.0%
Composite 54dBµV/m 1,272,889
89.5%
1,335 83.9%
48dBµV/m 1,367,556
96.2%
1,477
92.9% 42dBµV/m 1,518
95.4%
See figure 4.1 for definitions of coverage
7.4 The following three maps show the FM coverage of each service, then the composite coverage18.
• FM coverage at signal strengths equal or greater than 54dBµV/m is shown in green;
• coverage at between 48dBµV/m and 54dBµV/m is in blue;
• coverage at between 42dBµV/m and 48dBµV/m is shown in yellow. 18 Larger versions of these maps, and more detail about the Manchester plan, can be found in Annexes A and B

43
7.5 As set out in our conclusions to section 4, we will seek to match DAB indoor reception to FM coverage provided by 48dBµV/m and DAB in-vehicle reception to FM coverage provided by 42dBµV/m
Figure 7.2: BBC Radio Manchester FM coverage
Figure 7.3: Key 103 FM coverage

44
Figure 7.4: BBC Manchester plus Key 103, composite FM coverage
7.6 These maps represent coverage for 95% time, taking into account the occasional effects of short-term interference from distant stations which can occur under particular weather conditions for a few days each year.
7.7 As can be seen from the preceding table and maps, existing FM local radio coverage in the Manchester area is better for the BBC than for Key 103. Composite coverage is good, focused on serving populated areas well and only substantially absent from sparsely populated areas, particularly in the foothills of the Pennine Range to the south-east of the city.
7.8 The absence of substantial areas of coverage at signal strengths of between 42dBµV/m and 48dBµV/m (shown in yellow) is due to the presence of incoming interference on the frequencies involved which, in many instances, is sufficiently strong to prevent adequate reception of wanted signals at these levels.
Current DAB coverage of Manchester
7.9 Local DAB services in the Manchester area are currently delivered using frequency block 11C, by two transmitters, Winter Hill and one at City Tower. As a result of the renewal of the licence, a further transmitter will come on air at Sutton Common in May 2012, and as such is included in our ‘current coverage’ predictions.
7.10 The current network achieves a lower level of coverage than the composite existing FM coverage. Figure 7.6 below shows the existing coverage of Manchester DAB services operating on the 11C DAB frequency block, at both 99% time availability and under normal propagation conditions.

45
Figure 7.5: Current Manchester local DAB coverage 99% time availability
Type DAB Coverage (households)/km Indoor 1,237,812
84.81%
Road 1,367 85.94%
Normal propagation conditions
Type DAB Coverage (households)/km Indoor 1,257,933
86.19%
Road 1,436 90.26%

46
Figure 7.6: Current block 11C Manchester coverage

47
Figure 7.7: Current block 11C Manchester coverage normal propagation conditions

48
Changing the Manchester local DAB frequency
7.11 The 11C DAB frequency block is also currently used in the North East of England (Tyne & Wear), in Birmingham and, critically, in the adjacent South Yorkshire area. It is also internationally allocated for use on the Isle of Man.
Figure 7.8: Current block 11C allocations
7.12 The geography of the Pennine Ridge helps minimise unwanted co-block interference between the Manchester and South Yorkshire local DAB areas. However, despite taking advantage of this terrain blocking, the current DAB transmissions from Winter Hill still have to be constrained, both in terms of antenna height and transmitter radiated power. Without such constraints, signals from Winter Hill would cause interference to local DAB coverage in both South Yorkshire and Birmingham.
7.13 Our first stage of improving local DAB coverage is to look at options for improving the performance of existing transmitters. However in Manchester (and for some other local DAB editorial areas), because of outgoing interference issues it is not possible to improve the performance of existing transmission infrastructure without first changing the frequency of the network.
7.14 It is therefore necessary to find an alternative DAB frequency block for this service, to ensure that co-block interference between it and other areas operating on the same frequency block are minimised.
7.15 Our proposed frequency re-plan allocates block 10B for future use in Manchester, Lincolnshire, Herefordshire & Worcestershire, West Wiltshire, and Greater London.

49
Figure 7.9: Proposed block 10B allocations
7.16 Predictions indicate that if they all use the same 10B block, Greater London and West Wiltshire would be largely unaffected by Manchester, and that there would be only minor adverse impacts to parts of Hereford & Worcestershire.
7.17 The coverage of local DAB services in the Lincolnshire area would suffer interference from Manchester, but most of the interference would be in the north of the Lincolnshire area, which is also served by the local DAB multiplex for Humberside.
Stage 2: improving existing infrastructure
7.18 With a DAB block frequency change identified, it is then possible to begin to look at ways in which the existing infrastructure can be enhanced to improve coverage.
7.19 Notable improvements to coverage can be achieved by modifying the Winter Hill site. This site can accommodate both a higher antenna, and an increase in radiated power output from 750W to 2kW ERP. (Because it is a city-centre installation already running at 500W ERP, it is not possible to modify City Tower). It is also proposed to increase the ERP of Sutton Common from 500W to 1kW. The coverage resulting from these technical improvements and the frequency change is shown at Figures 7.10 and 7.11.
Figure 7.10: Modified Winter Hill at 99% time availability Type DAB Coverage (households)/km Indoor 1,309,405
89.72%
Road 1,346 84.58%

50
Figure 7.11: Predicted block 10B Manchester coverage (modified Winter Hill site)

51
7.20 In the preceding map, coverage is only shown where it is predicted to be available for 99% of the time. Most of the time, the coverage will be considerably better than this. Figure 7.12 shows the coverage predicted for at least 50% of the time. (See discussion of time availability in section 5)
Figure 7.12: Predicted block 10B Manchester, normal propagation conditions (modified Winter Hill site)

52
7.21 But even when coverage is predicted for normal propagation conditions, rather than for 99% of the time, some gaps in coverage remain at particular locations. Terrain blocking and signal reductions caused by building obstructions are the primary causes of such coverage gaps, which can only be overcome by the installation of additional transmitters at different locations.
Figure 7.13: Modified Winter Hill normal propagation conditions Type DAB Coverage (households)/km Indoor 1,337,266
91.63%
Road 1,457 91.60%
Stage 3: additional transmitters
7.22 The next stage of improving DAB coverage is to add further transmitters to provide in-fill coverage, focused on areas where existing FM coverage is robust.
7.23 In the case of local DAB services for Manchester ten additional sites were added as shown in the table below:
Figure 7.14: Manchester expanded DAB transmitter network (stage 3)
Transmitter site Incremental increase in households
Incremental increase in households (%)
% of Editorial Area
Winter Hill (modified) Sunley building and Sutton Common (licence renewal site)
89.72
Crompton Moor 51,886 3.56 93.27 Saddleworth 22,274 1.53 94.80 Glossop 20,022 1.37 96.17 Beech Hill 9,472 0.65 96.82 Romiley 3,880 0.27 97.09 Warrington 4,873 0.33 97.42 Littleborough 3,712 0.25 97.67 Torhead reservoir 22 0.00 97.68 Woodhead reservoir 4 0.00 97.68
Total population in boundary: 1,459,479
7.24 These sites increase the coverage of the Manchester editorial area to 97.68%. Figure 7.16 shows the coverage map.
7.25 Because there are various overlaps of signals from the different transmitters, the order in which new sites are added to the network influences the amount of additional coverage each will achieve.
7.26 Two of the new sites – Torhead Reservoir and Woodhead Reservoir – serve an insignificant number of additional households, but were added because of the extra in-vehicle coverage they achieve. The road coverage achieved is as follows:

53
Figure 7.15: Manchester expanded DAB road coverage (stage 3)
Transmitter site Increase in road length (km)
Incremental % increase in road length
% of roads within Editorial Area
Winter Hill (modified) Sunley building and Sutton Common (licence renewal site)
84.58
Crompton Moor 68.6 4.31 88.90 Saddleworth 32.9 2.07 90.97 Glossop 25.8 1.62 92.59 Beech Hill 23.8 1.50 94.09 Romiley 4.1 0.26 94.34 Warrington 4.0 0.25 94.59 Littleborough 3.6 0.23 94.82 Torhead reservoir 4.6 0.29 95.11 Woodhead reservoir 7.1 0.45 95.56
Total roads in boundary: 1,591.0

54
Figure 7.16: Predicted block 10B Manchester coverage (stage 3)

55
Stage 4: near-universal coverage
7.27 The final stage of the planning exercise examines what additional transmitters might be required to achieve near-universal coverage.
7.28 In the case of the Manchester editorial area, the addition of three further sites, highlighted in the table below, increased coverage by a relatively small amount.
Figure 7.17: Manchester expanded DAB population coverage (stage 4)
Transmitter site Incremental increase in households
Incremental increase in households (%)
% of Editorial Area
Winter Hill (modified) Sunley building and Sutton Common (licence renewal site)
89.72
Crompton Moor 51,886 3.56 93.27
Saddleworth 22,274 1.53 94.80
Glossop 20,022 1.37 96.17
Ladder Hill 16,495 1.13 97.30
Beech Hill 7,073 0.48 97.79
Romiley 3,166 0.22 98.00
Warrington 4,213 0.29 98.29
Littleborough 3,787 0.26 98.55
Birch Vale 3,752 0.26 98.81 Whitworth 2,992 0.21 99.01
Torhead reservoir 23 0.00 99.01
Woodhead reservoir 4 0.00 99.01 Total population in boundary: 1,459,479
7.29 Between them, these three additional sites provide coverage for just over an additional 19,500 households (approximately 1.3% of the total population within the Manchester editorial area), taking the total to 99.01% of the editorial area.
7.30 The road coverage achieved by this complete 15 transmitter network is set out in the table below:

56
Figure 7.18: Manchester expanded DAB road coverage (stage 4)
Transmitter site Increase in road length (km)
Incremental % increase in road
length
% of roads within Editorial Area
Winter Hill (modified) Sunley building and Sutton Common (licence renewal site)
1,345.7 84.58
Crompton Moor 1,414.4 4.31 88.90
Saddleworth 1,447.3 2.07 90.97
Glossop 1,473.1 1.62 92.59
Ladder Hill 1,501.8 1.80 94.39
Beech Hill 1,520.8 1.19 95.58
Romiley 1,524.0 0.20 95.78
Warrington 1,525.8 0.12 95.90
Littleborough 1,529.4 0.22 96.12
Birch Vale 1,536.2 0.43 96.55 Whitworth 1,539.5 0.21 96.76
Torhead reservoir 1,544.0 0.28 97.04
Woodhead reservoir 1,551.1 0.45 97.49 Total roads in boundary: 1,591.0 7.31 This coverage achieved by this complete 15 transmitter network is shown in the
following map.
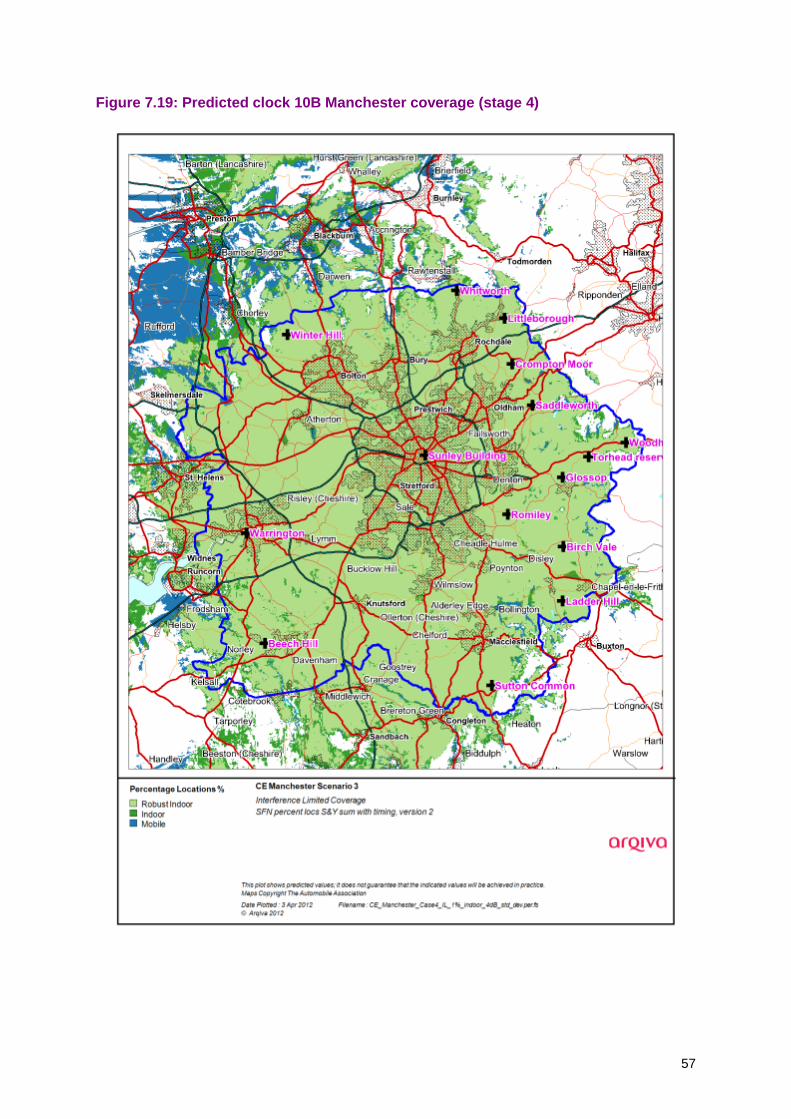
57
Figure 7.19: Predicted clock 10B Manchester coverage (stage 4)

58
7.32 The following table summarises the coverage achieved in the four stages.
Table 7.20 Summary of coverage within editorial area for each stage
Stage Indoor (households) Indoor (%) Mobile (km) Mobile (%) 1 1,237,812 84.8 1,367 85.9 2 1,309,405 89.7 1,346 84.6 3 1,425,551 97.7 1,520 95.6 4 1,445,093 99.0 1,551 97.5
7.33 It is beyond the scope of this report to consider the costs of network roll-out, but it may be the case that some of the transmitters in this example (and in other local DAB areas) may not be considered by multiplex operators to be economically viable to implement.
7.34 Because of the number of variables involved, when developing coverage proposals for local DAB editorial areas, it is sometimes that case that additional implementation options become apparent during the planning process. These would be fully examined during detailed planning work, and the relative merits of any such options would be a matter for multiplex operators to decide upon.

59
Section 8
8 Conclusions and recommendations 8.1 Editorial areas represent an appropriate basis for planning DAB build-out. This
reflects the fact that FM stations target specific areas and listeners with their output, and this allows an easy transition to a DAB world (where stations on the same multiplex will have the same coverage).
8.2 The approach set out in this report is to match the FM radio listener experience with DAB, but the different reception failure characteristics of FM and DAB services complicate this task.
8.3 We have used a conservative DAB planning approach to provide a high level of certainty that FM listeners can enjoy access to DAB services. This includes:
• Using variable quality mono reception as opposed to high quality stereo as the benchmark for defining the extent of FM coverage to be matched by DAB;
• Using a lower target of reception being available at 50% of locations during normal propagation conditions for defining FM coverage, as opposed to 99% of locations for 99% of the time for DAB coverage.
8.4 These assumptions have the effect of expanding the extent of FM coverage to be matched by DAB, making it more certain that listeners with marginal FM reception will receive good quality DAB services post switchover.
8.5 Our plans suggest that good DAB indoor coverage can be achieved to match FM coverage, even using this conservative planning approach.
8.6 For predictions of in-vehicle DAB coverage, our planning scenarios indicate that it may not be possible to perfectly match variable quality mono FM coverage on all roads, using the proposed demanding set of DAB planning assumptions. However, in practice our field tests suggest that in-vehicle DAB coverage can be provided to match FM coverage under normal propagation conditions. By building to a higher planning standard, listeners will enjoy better in-vehicle coverage on DAB than achieved on FM for the vast majority of the time and will have access to a wider range of stations.
8.7 In exceptional circumstances in some locations, it may be appropriate to adopt a more flexible approach to meeting DAB coverage targets. Where variable quality FM coverage may prove challenging to match using robust DAB planning parameters, we may need to make trade-offs in those parameters in order to provide coverage, either by reducing either the time availability or location availability target to a level of availability that is representative of ‘normal conditions’ but not so robust as to render it impractical to achieve.
8.8 Even in this limited number of situations where we consider trade-offs in location or time availability, we expect that listeners will experience a useable DAB service which will be broadly comparable or better than FM.
8.9 The consideration of where and when to apply these trade-offs is necessarily one that needs to be made on a case by case basis, taking into account the number of

60
households affected and the costs of the additional transmitters that would be required under the robust planning parameters.
8.10 We anticipate both the BBC and Digital One will develop their national build-out plans further, as these issues are examined; their plans included here are not final.
8.11 The DRAP asks Ofcom to ‘Determine the current level of FM; including defining what listeners determine is an appropriate signal quality on FM’ and ‘Make recommendations on the build-out of DAB coverage so that it is equivalent to existing FM coverage’.19
8.12 In relation to the first of these tasks, this report sets out what we believe to be appropriate FM parameters and uses these to define FM coverage. In relation to the second of these tasks, we have outlined our methodology for the build-out of DAB coverage, basing our approach on editorial areas and then using appropriate planning parameters to calculate the number of transmitters needed to replicate FM coverage in that area. We therefore recommend to Government:
• an editorial area approach that serves as the best basis for planning local DAB coverage
• a set of planning parameters for DAB designed to provide an equivalent level of coverage to FM
• provisional frequency plans and first step build-out plans for a possible digital radio switchover.
19Available at: http://www.culture.gov.uk/images/publications/Digital_Radio_Action_Plan_V3.pdf - p23


