25
Dabur India Limited Investor Communication Quarter and Nine Months ended 31 st December 2017
Dabur India Limited
Investor Communication
Quarter and Nine Months ended 31st December 2017

2
Contents
1. Q3 FY18 – Overview
2. Category Highlights
3. Business Initiatives
4. Recent Launches
5. International Business – Overview
6. Profit and Loss Statements
3 1. Not comparable due to GST
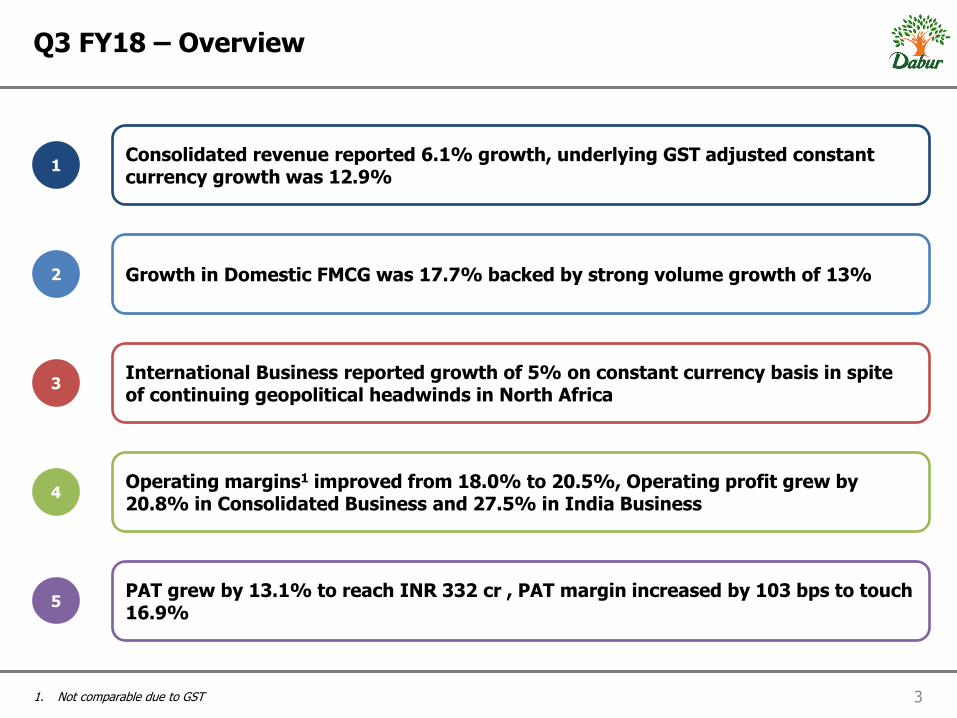
Q3 FY18 – Overview
1 Consolidated revenue reported 6.1% growth, underlying GST adjusted constant currency growth was 12.9%
2 Growth in Domestic FMCG was 17.7% backed by strong volume growth of 13%
3 International Business reported growth of 5% on constant currency basis in spite of continuing geopolitical headwinds in North Africa
Operating margins1 improved from 18.0% to 20.5%, Operating profit grew by 20.8% in Consolidated Business and 27.5% in India Business
4
PAT grew by 13.1% to reach INR 332 cr , PAT margin increased by 103 bps to touch 16.9%
5
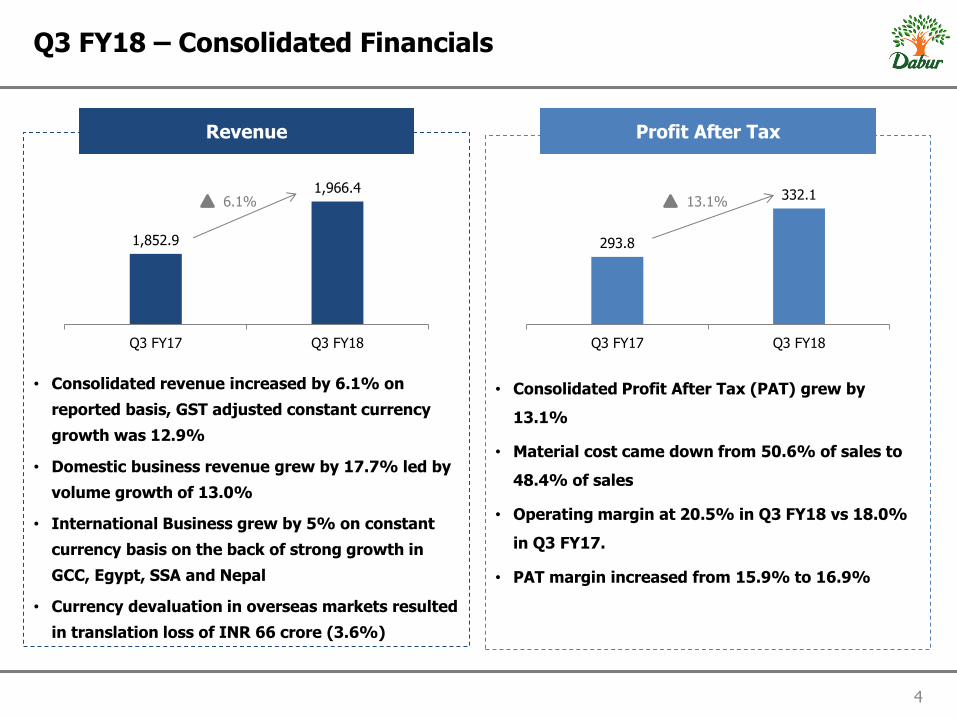
• Consolidated Profit After Tax (PAT) grew by
13.1%
• Material cost came down from 50.6% of sales to
48.4% of sales
• Operating margin at 20.5% in Q3 FY18 vs 18.0%
in Q3 FY17.
• PAT margin increased from 15.9% to 16.9%
332.1
293.8
Q3 FY18Q3 FY17
4
Q3 FY18 – Consolidated Financials
• Consolidated revenue increased by 6.1% on
reported basis, GST adjusted constant currency
growth was 12.9%
• Domestic business revenue grew by 17.7% led by
volume growth of 13.0%
• International Business grew by 5% on constant
currency basis on the back of strong growth in
GCC, Egypt, SSA and Nepal
• Currency devaluation in overseas markets resulted
in translation loss of INR 66 crore (3.6%)
Revenue Profit After Tax
1,966.4
1,852.9
Q3 FY18Q3 FY17
6.1% 13.1%
5
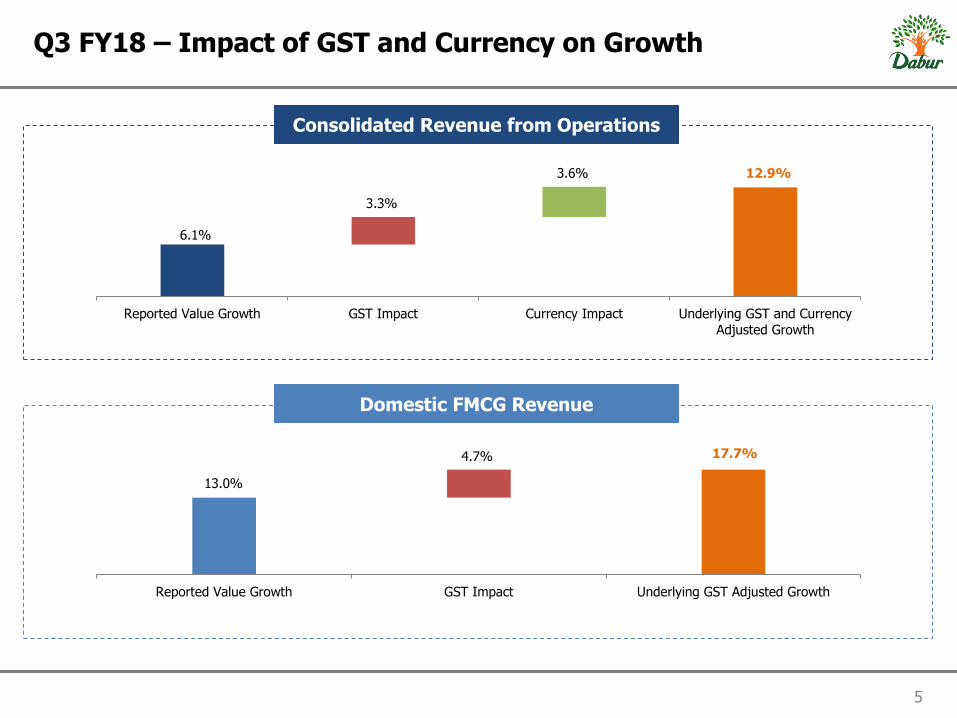
Q3 FY18 – Impact of GST and Currency on Growth
Consolidated Revenue from Operations
6.1%
12.9%
3.3%
3.6%
Reported Value Growth GST Impact Currency Impact Underlying GST and Currency
Adjusted Growth
Domestic FMCG Revenue
13.0%
17.7% 4.7%
Reported Value Growth GST Impact Underlying GST Adjusted Growth
6
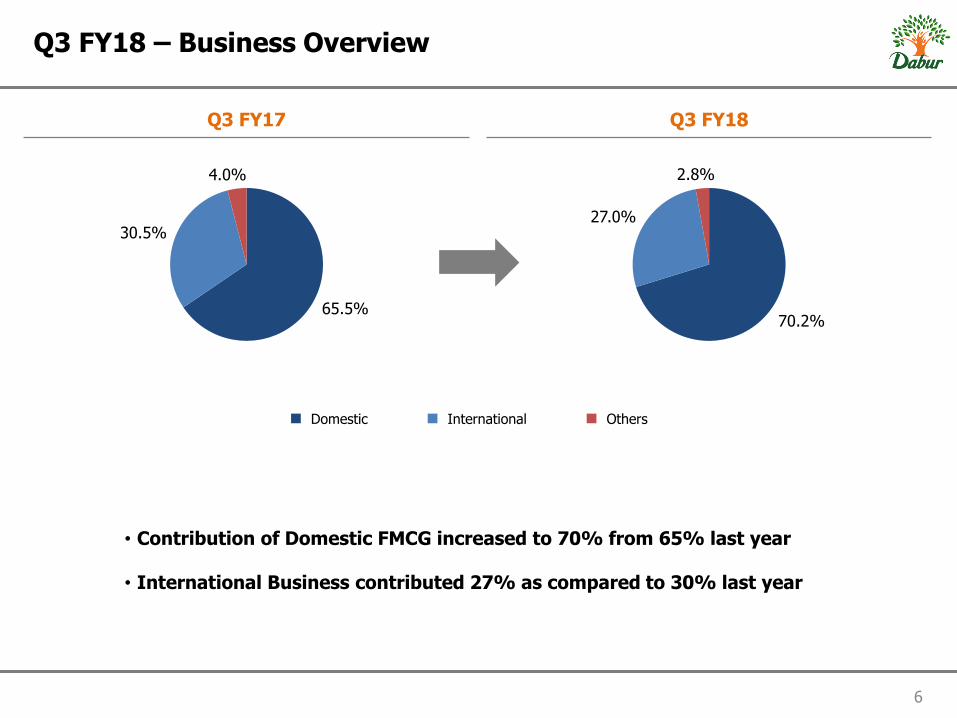
Q3 FY18 – Business Overview
Q3 FY17 Q3 FY18
70.2%
27.0%
2.8%
65.5%
30.5%
4.0%
Domestic International Others
• Contribution of Domestic FMCG increased to 70% from 65% last year
• International Business contributed 27% as compared to 30% last year
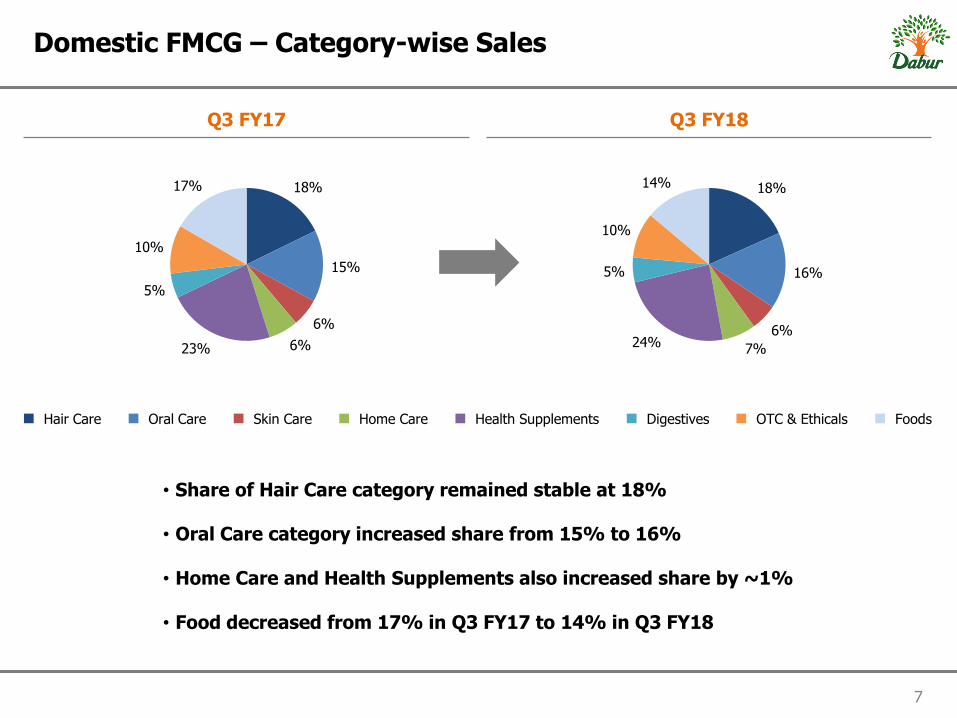
18%
16%
6%
7% 24%
5%
10%
14% 18%
15%
6%
6% 23%
5%
10%
17%
7
Domestic FMCG – Category-wise Sales
Q3 FY17 Q3 FY18
• Share of Hair Care category remained stable at 18%
• Oral Care category increased share from 15% to 16%
• Home Care and Health Supplements also increased share by ~1%
• Food decreased from 17% in Q3 FY17 to 14% in Q3 FY18
Hair Care Oral Care Skin Care Home Care Health Supplements Digestives Foods OTC & Ethicals
8
Contents
1. Q3 FY18 – Overview
2. Category Highlights
3. Business Initiatives
4. Recent Launches
5. International Business – Overview
6. Profit and Loss Statements
9 Note: Growth figures refer to Like-to-like growth (adjusted for GST)
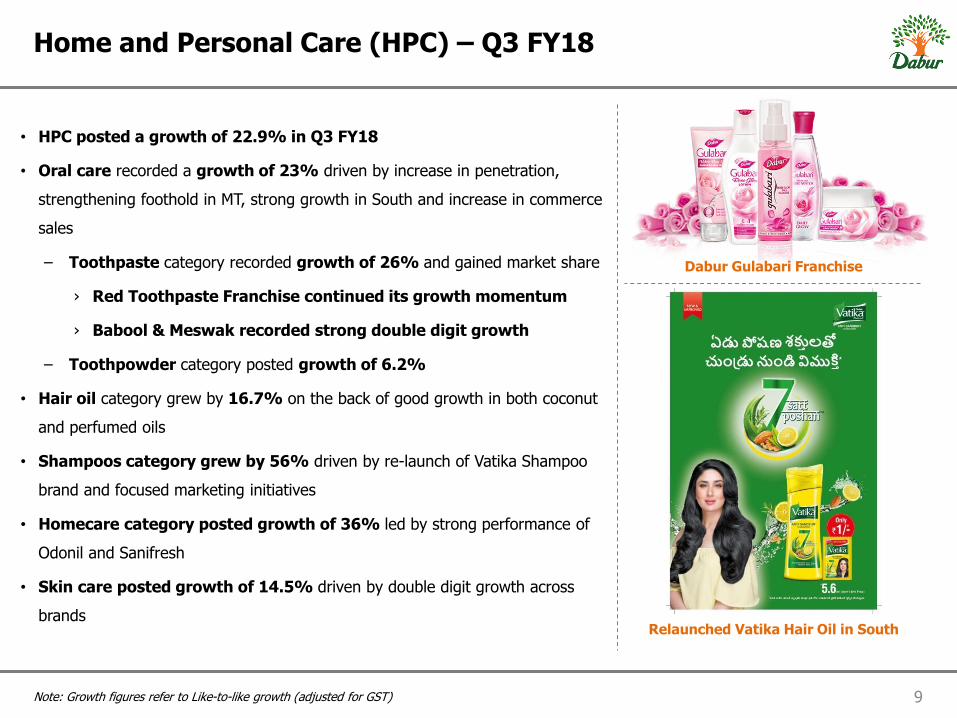
Home and Personal Care (HPC) – Q3 FY18
• HPC posted a growth of 22.9% in Q3 FY18
• Oral care recorded a growth of 23% driven by increase in penetration,
strengthening foothold in MT, strong growth in South and increase in commerce
sales
– Toothpaste category recorded growth of 26% and gained market share
› Red Toothpaste Franchise continued its growth momentum
› Babool & Meswak recorded strong double digit growth
– Toothpowder category posted growth of 6.2%
• Hair oil category grew by 16.7% on the back of good growth in both coconut
and perfumed oils
• Shampoos category grew by 56% driven by re-launch of Vatika Shampoo
brand and focused marketing initiatives
• Homecare category posted growth of 36% led by strong performance of
Odonil and Sanifresh
• Skin care posted growth of 14.5% driven by double digit growth across
brands
Dabur Gulabari Franchise
Relaunched Vatika Hair Oil in South

• Healthcare vertical posted growth of 16.6% in Q3 FY18
• Health Supplements grew by 19.5% on the back of strong growth of Chyawanprash and Honey
• Dabur Honey reported a strong recovery growing by 33.2% and gaining market share
• Digestives posted growth of 19.3% led by strong performance of Hajmola tablets and Pudin Hara group
• OTC & Ethicals category grew by 8.7% led by good growth in Lal Tail, Honitus, Ashokarishta and Dashmularishta
Asavs
10 Note: Growth figures refer to Like-to-like growth (adjusted for GST)
Healthcare (HC) – Q3 FY18
Hajmola – New TVC Ayurvedic Health Tonic for Women:
Dabur Ashokarishta Dabur Honitus Hot Sip

11 Note: Growth figures refer to Like-to-like growth (adjusted for GST)
Foods – Q3 FY18
• Foods category remained flat during Q3 primarily on account of high
base as Foods had grown at 52% in Q3FY17.
• Shifting of Diwali season & proliferation of value players also impacted sales in
the quarter
• Culinary business impacted by supply issues for some of the key SKUs
• Launched India’s first range of packaged fruit-based Mocktails in a
ready-to-drink format under the Réal brand
• Activ Coconut Water continued to post good sales
• Continued A&P support to increase frequency of consumption
• Focus on innovation and penetration led growth
First Ever TVC For Real Pomegranate
Real Mocktails
Dabur Hommade range with new packaging
12
Contents
1. Q3 FY18 – Overview
2. Category Highlights
3. Business Initiatives
4. Recent Launches
5. International Business – Overview
6. Profit and Loss Statements

13
Consumer/ Marketing Initiatives (1 of 2)
School Contact Programs (Oral Care)
Winter Special Offers on Gulabari
Festive TV Campaign
Generating Trials for Bleach through
Workshops and Seminars
Odonil Zipper – Title Sponsor of ITA Awards
2017
Odonil Zipper - Khushboo on Wheels
Odomos – Associating with Government of Uttar
Pradesh Defeating Diabetes
14
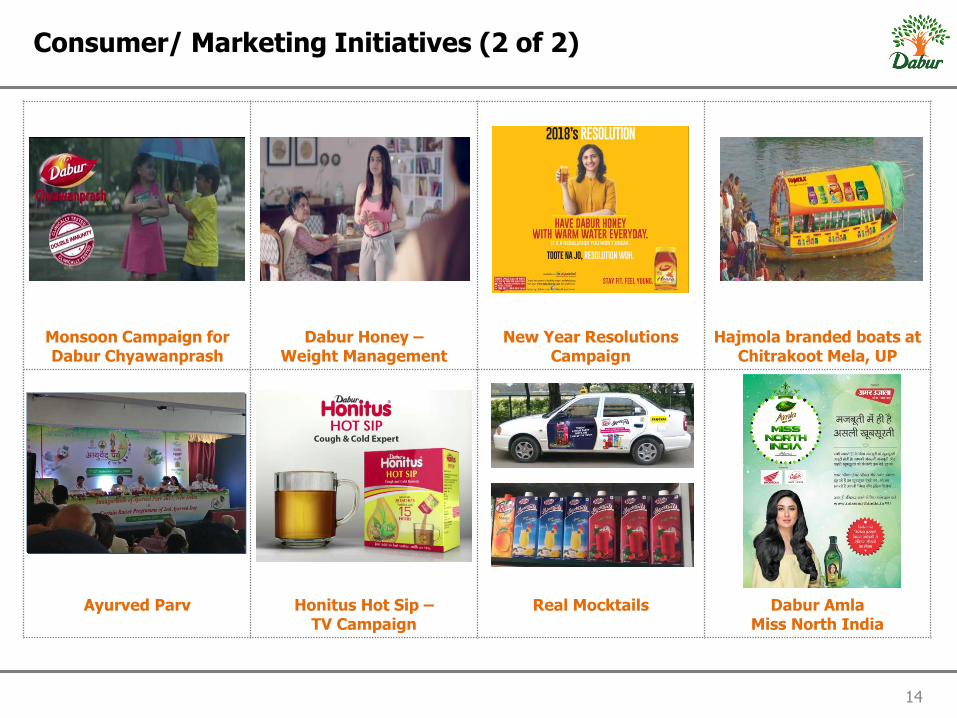
Consumer/ Marketing Initiatives (2 of 2)
Monsoon Campaign for Dabur Chyawanprash
Dabur Honey – Weight Management
New Year Resolutions Campaign
Hajmola branded boats at Chitrakoot Mela, UP
Ayurved Parv
Honitus Hot Sip – TV Campaign
Real Mocktails
Dabur Amla Miss North India
15
Contents
1. Q3 FY18 – Overview
2. Category Highlights
3. Business Initiatives
4. Recent Launches
5. International Business – Overview
6. Profit and Loss Statements
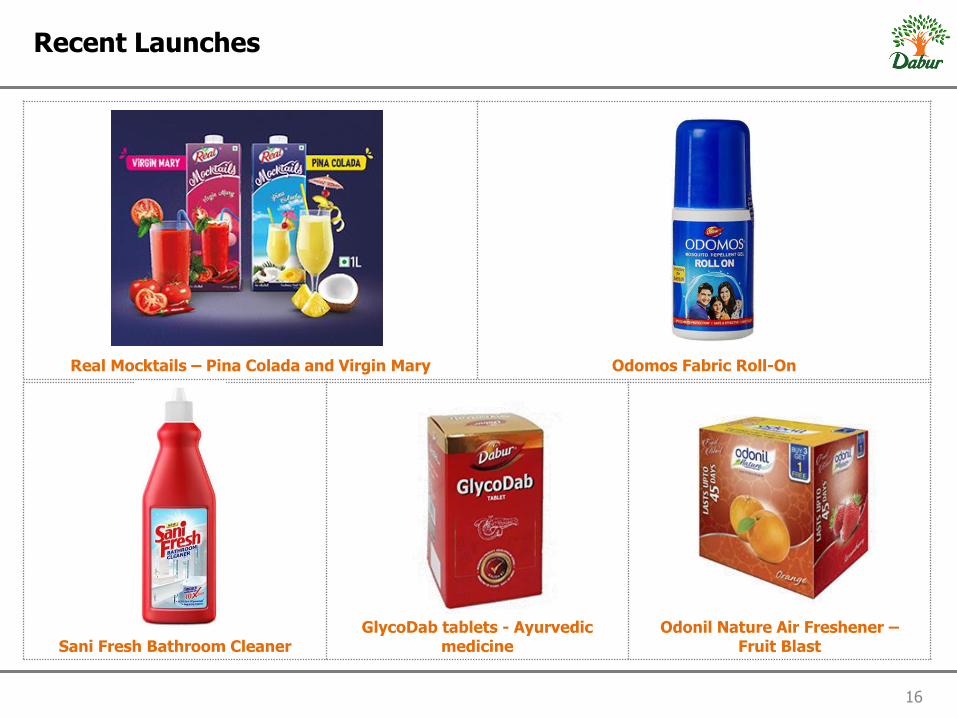
Sani Fresh Bathroom Cleaner GlycoDab tablets - Ayurvedic
medicine Odonil Nature Air Freshener –
Fruit Blast
16
Recent Launches
Real Mocktails – Pina Colada and Virgin Mary Odomos Fabric Roll-On

17
Contents
1. Q3 FY18 – Overview
2. Category Highlights
3. Business Initiatives
4. Recent Launches
5. International Business – Overview
6. Profit and Loss Statements
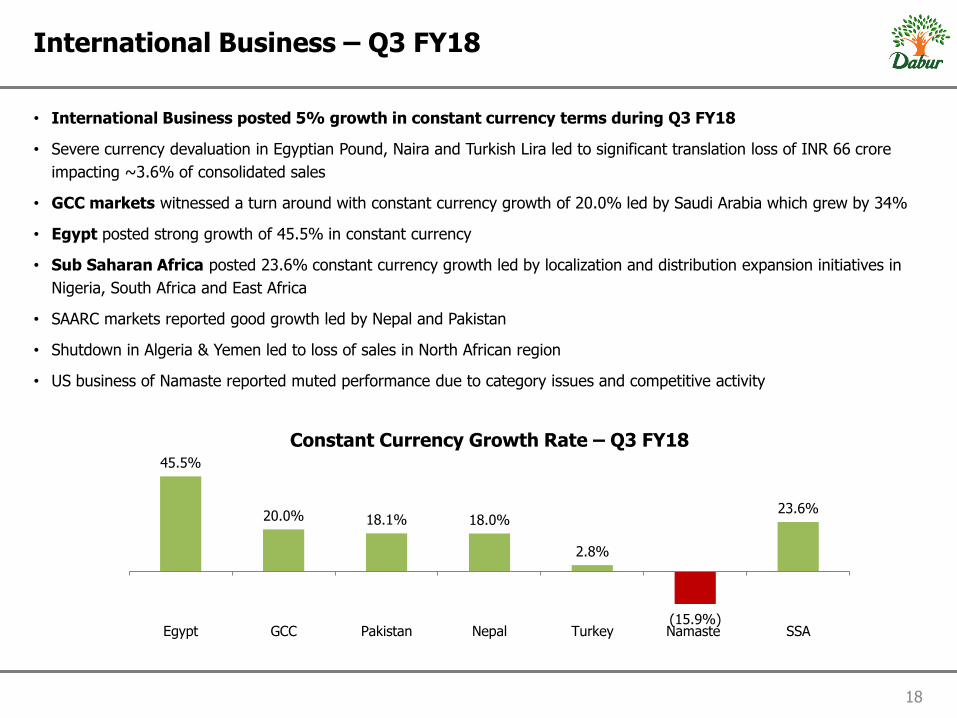
• International Business posted 5% growth in constant currency terms during Q3 FY18
• Severe currency devaluation in Egyptian Pound, Naira and Turkish Lira led to significant translation loss of INR 66 crore
impacting ~3.6% of consolidated sales
• GCC markets witnessed a turn around with constant currency growth of 20.0% led by Saudi Arabia which grew by 34%
• Egypt posted strong growth of 45.5% in constant currency
• Sub Saharan Africa posted 23.6% constant currency growth led by localization and distribution expansion initiatives in
Nigeria, South Africa and East Africa
• SAARC markets reported good growth led by Nepal and Pakistan
• Shutdown in Algeria & Yemen led to loss of sales in North African region
• US business of Namaste reported muted performance due to category issues and competitive activity
18
International Business – Q3 FY18
45.5%
20.0% 18.1% 18.0%
2.8%
(15.9%)
23.6%
Egypt GCC Pakistan Nepal Turkey Namaste SSA
Constant Currency Growth Rate – Q3 FY18
19
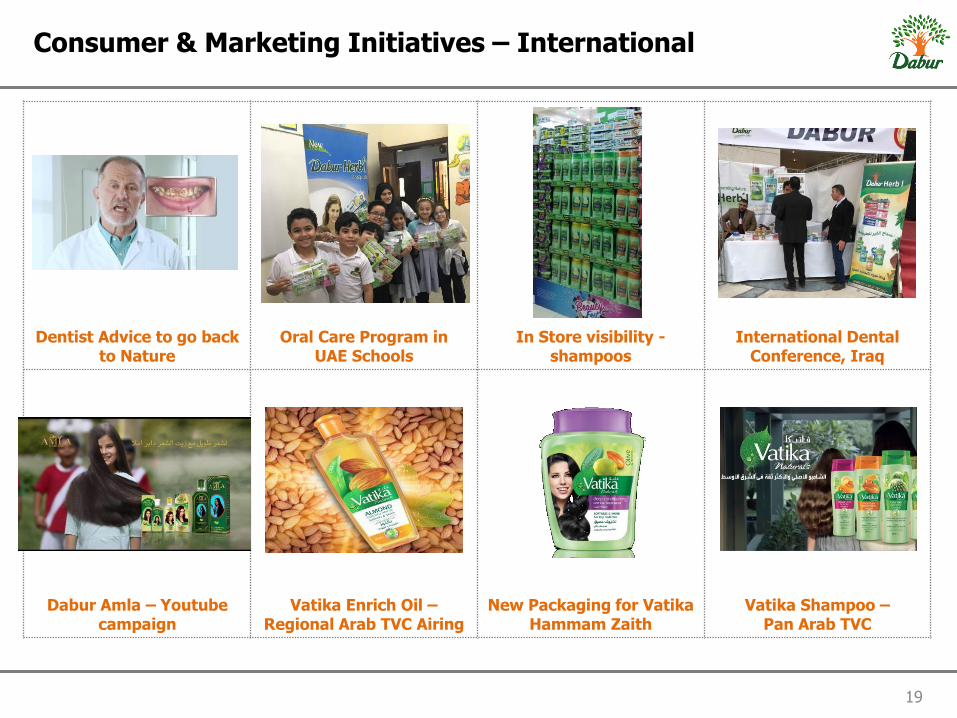
Consumer & Marketing Initiatives – International
Dentist Advice to go back to Nature
Oral Care Program in UAE Schools
In Store visibility - shampoos
International Dental Conference, Iraq
Dabur Amla – Youtube campaign
Vatika Enrich Oil –Regional Arab TVC Airing
New Packaging for Vatika Hammam Zaith
Vatika Shampoo – Pan Arab TVC
20
Contents
1. Q3 FY18 – Overview
2. Category Highlights
3. Business Initiatives
4. Recent Launches
5. International Business – Overview
6. Profit and Loss Statements
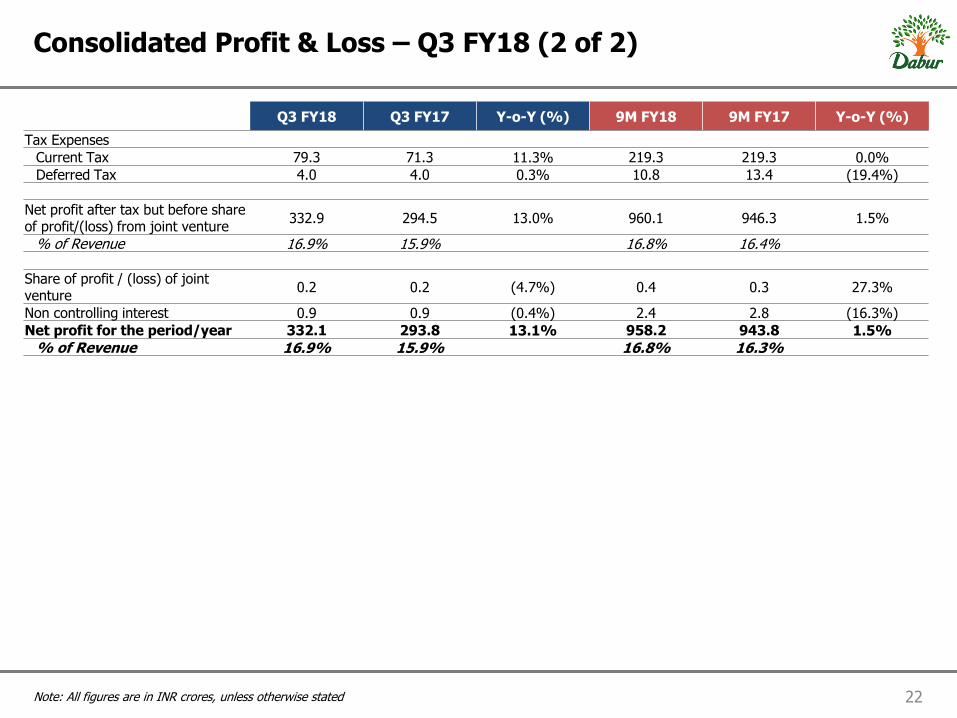
21 Note: All figures are in INR crores, unless otherwise stated
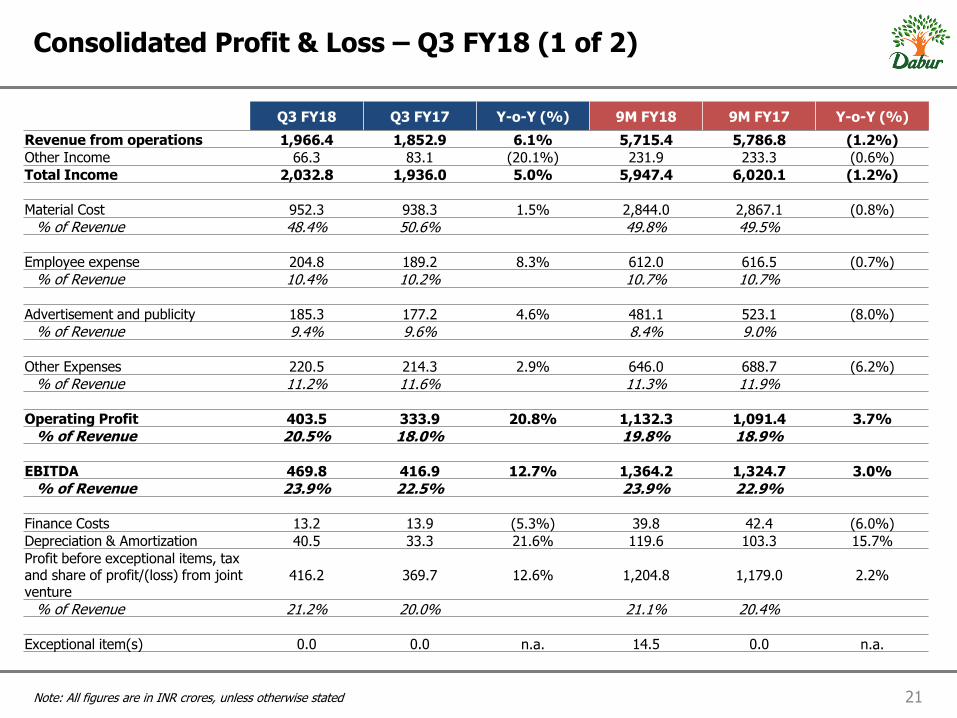
Consolidated Profit & Loss – Q3 FY18 (1 of 2)
Q3 FY18 Q3 FY17 Y-o-Y (%) 9M FY18 9M FY17 Y-o-Y (%)
Revenue from operations 1,966.4 1,852.9 6.1% 5,715.4 5,786.8 (1.2%)
Other Income 66.3 83.1 (20.1%) 231.9 233.3 (0.6%)
Total Income 2,032.8 1,936.0 5.0% 5,947.4 6,020.1 (1.2%)
Material Cost 952.3 938.3 1.5% 2,844.0 2,867.1 (0.8%)
% of Revenue 48.4% 50.6% 49.8% 49.5%
Employee expense 204.8 189.2 8.3% 612.0 616.5 (0.7%)
% of Revenue 10.4% 10.2% 10.7% 10.7%
Advertisement and publicity 185.3 177.2 4.6% 481.1 523.1 (8.0%)
% of Revenue 9.4% 9.6% 8.4% 9.0%
Other Expenses 220.5 214.3 2.9% 646.0 688.7 (6.2%)
% of Revenue 11.2% 11.6% 11.3% 11.9%
Operating Profit 403.5 333.9 20.8% 1,132.3 1,091.4 3.7%
% of Revenue 20.5% 18.0% 19.8% 18.9%
EBITDA 469.8 416.9 12.7% 1,364.2 1,324.7 3.0%
% of Revenue 23.9% 22.5% 23.9% 22.9%
Finance Costs 13.2 13.9 (5.3%) 39.8 42.4 (6.0%)
Depreciation & Amortization 40.5 33.3 21.6% 119.6 103.3 15.7%
Profit before exceptional items, tax and share of profit/(loss) from joint venture
416.2 369.7 12.6% 1,204.8 1,179.0 2.2%
% of Revenue 21.2% 20.0% 21.1% 20.4%
Exceptional item(s) 0.0 0.0 n.a. 14.5 0.0 n.a.
22 Note: All figures are in INR crores, unless otherwise stated
Consolidated Profit & Loss – Q3 FY18 (2 of 2)
Q3 FY18 Q3 FY17 Y-o-Y (%) 9M FY18 9M FY17 Y-o-Y (%)
Tax Expenses
Current Tax 79.3 71.3 11.3% 219.3 219.3 0.0%
Deferred Tax 4.0 4.0 0.3% 10.8 13.4 (19.4%)
Net profit after tax but before share of profit/(loss) from joint venture
332.9 294.5 13.0% 960.1 946.3 1.5%
% of Revenue 16.9% 15.9% 16.8% 16.4%
Share of profit / (loss) of joint venture
0.2 0.2 (4.7%) 0.4 0.3 27.3%
Non controlling interest 0.9 0.9 (0.4%) 2.4 2.8 (16.3%)
Net profit for the period/year 332.1 293.8 13.1% 958.2 943.8 1.5%
% of Revenue 16.9% 15.9% 16.8% 16.3%
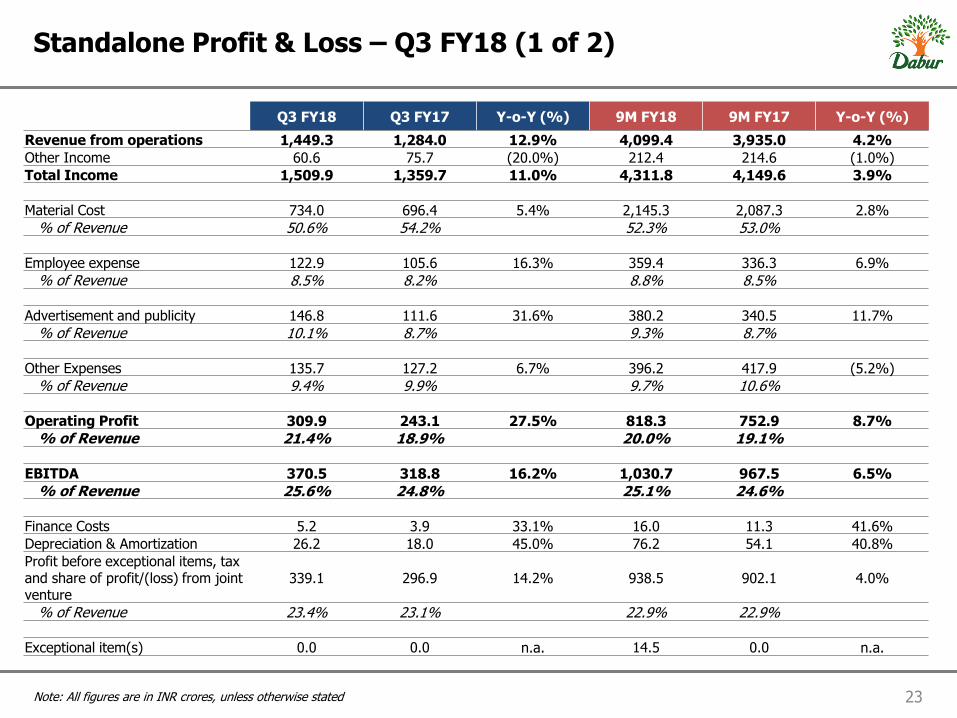
23 Note: All figures are in INR crores, unless otherwise stated
Standalone Profit & Loss – Q3 FY18 (1 of 2)
Q3 FY18 Q3 FY17 Y-o-Y (%) 9M FY18 9M FY17 Y-o-Y (%)
Revenue from operations 1,449.3 1,284.0 12.9% 4,099.4 3,935.0 4.2%
Other Income 60.6 75.7 (20.0%) 212.4 214.6 (1.0%)
Total Income 1,509.9 1,359.7 11.0% 4,311.8 4,149.6 3.9%
Material Cost 734.0 696.4 5.4% 2,145.3 2,087.3 2.8%
% of Revenue 50.6% 54.2% 52.3% 53.0%
Employee expense 122.9 105.6 16.3% 359.4 336.3 6.9%
% of Revenue 8.5% 8.2% 8.8% 8.5%
Advertisement and publicity 146.8 111.6 31.6% 380.2 340.5 11.7%
% of Revenue 10.1% 8.7% 9.3% 8.7%
Other Expenses 135.7 127.2 6.7% 396.2 417.9 (5.2%)
% of Revenue 9.4% 9.9% 9.7% 10.6%
Operating Profit 309.9 243.1 27.5% 818.3 752.9 8.7%
% of Revenue 21.4% 18.9% 20.0% 19.1%
EBITDA 370.5 318.8 16.2% 1,030.7 967.5 6.5%
% of Revenue 25.6% 24.8% 25.1% 24.6%
Finance Costs 5.2 3.9 33.1% 16.0 11.3 41.6%
Depreciation & Amortization 26.2 18.0 45.0% 76.2 54.1 40.8%
Profit before exceptional items, tax and share of profit/(loss) from joint venture
339.1 296.9 14.2% 938.5 902.1 4.0%
% of Revenue 23.4% 23.1% 22.9% 22.9%
Exceptional item(s) 0.0 0.0 n.a. 14.5 0.0 n.a.
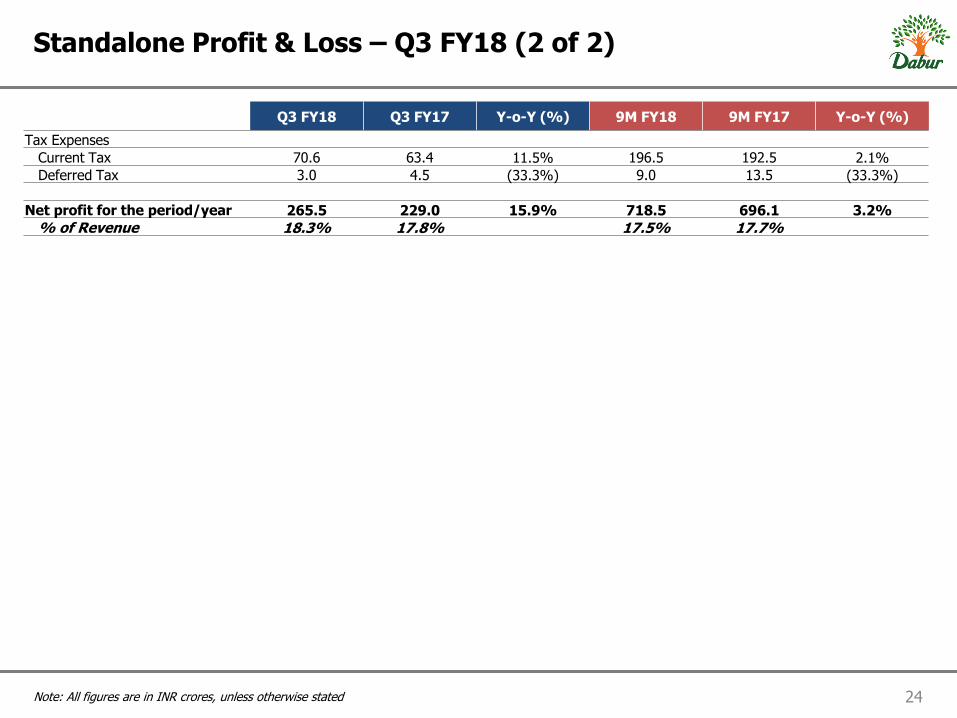
24 Note: All figures are in INR crores, unless otherwise stated
Standalone Profit & Loss – Q3 FY18 (2 of 2)
Q3 FY18 Q3 FY17 Y-o-Y (%) 9M FY18 9M FY17 Y-o-Y (%)
Tax Expenses
Current Tax 70.6 63.4 11.5% 196.5 192.5 2.1%
Deferred Tax 3.0 4.5 (33.3%) 9.0 13.5 (33.3%)
Net profit for the period/year 265.5 229.0 15.9% 718.5 696.1 3.2%
% of Revenue 18.3% 17.8% 17.5% 17.7%
25
Thank You


