41
Dabur India Limited Investor Presentation February 2019 1

Dabur India Limited
Investor Presentation
February 2019 1

2
Agenda
1. Dabur – Overview
2. Business Structure
3. India Business
4. International Business
5. The Way Forward
6. Our Value Creators
7. Annexure

3
Dabur is the largest science-based Ayurveda company
Overview Awards
Established in 1884 – 135 years of trust and
excellence
One of the world’s largest in Ayurveda and natural healthcare
Having one of the largest distribution network in India, covering ~6.7 mn outlets
20 world class manufacturing facilities catering to needs of diverse markets
Strong overseas presence with ~28% contribution to consolidated sales
Market cap: US$ 11bn
Dabur wins ICSI National Award for Excellence in Corporate Governance 2019
Dabur ranked in the India’s Top 50 Valuable Companies by Business Today
Dabur Red Paste rated as 2nd most trusted brand by the consumers in the Oral Care category by the Brand Equity India’s Most Trust Brands 2017
Dabur moves up 4 Places in Fortune India 500 List; ranked 163 in the list for 2015
Dabur ranked 25 in the list of Best Companies for CSR in India, according to the Economic Times

4
Manufacturing facilities located across the globe
12 manufacturing locations in India
8 international manufacturing locations
`
Jammu Baddi
Pantnagar
Sahibabad
Tezpur
Nasik
Silvasa
Pithampur
Narendrapur
Katni
Alwar
Newai
Egypt
Nigeria
Turkey
Sri Lanka
Bangladesh
Nepal
South Africa
UAE

5
One of the largest distribution network in India
Urban
Rural
Insti Stockist
Wholesaler
GT Stockist
Retailer Retailer
Consumer Consumer Consumer
Factory
C&F
MT Stockist
Retailer
Consumer
Factory
C&F
Super Stockist
Sub Stockist
Distribution reach of 6.7 mn retail outlets with direct reach of 1.1 mn+
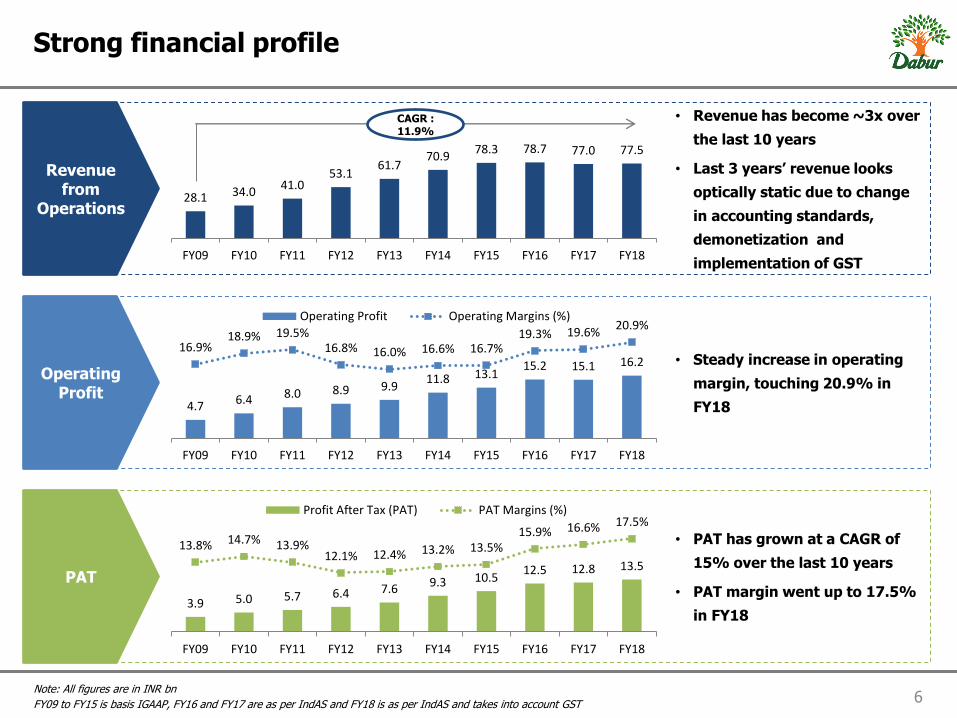
6 Note: All figures are in INR bn
FY09 to FY15 is basis IGAAP, FY16 and FY17 are as per IndAS and FY18 is as per IndAS and takes into account GST
Strong financial profile
• PAT has grown at a CAGR of
15% over the last 10 years
• PAT margin went up to 17.5%
in FY18
• Steady increase in operating
margin, touching 20.9% in
FY18
• Revenue has become ~3x over
the last 10 years
• Last 3 years’ revenue looks
optically static due to change
in accounting standards,
demonetization and
implementation of GST
Revenue from
Operations
Operating Profit
PAT
28.1 34.0 41.0
53.1 61.7
70.9 78.3 78.7 77.0 77.5
FY09 FY10 FY11 FY12 FY13 FY14 FY15 FY16 FY17 FY18
4.7 6.4 8.0 8.9 9.9 11.8 13.1
15.2 15.1 16.2 16.9%
18.9% 19.5% 16.8% 16.0% 16.6% 16.7%
19.3% 19.6% 20.9%
FY09 FY10 FY11 FY12 FY13 FY14 FY15 FY16 FY17 FY18
Operating Profit Operating Margins (%)
CAGR : 11.9%
3.9 5.0 5.7 6.4 7.6 9.3 10.5 12.5 12.8 13.5
13.8% 14.7% 13.9% 12.1% 12.4% 13.2% 13.5%
15.9% 16.6% 17.5%
FY09 FY10 FY11 FY12 FY13 FY14 FY15 FY16 FY17 FY18
Profit After Tax (PAT) PAT Margins (%)

• Standalone PAT increased by 18.3%
• Consolidated Profit After Tax grew by 11.9%
• Profitability in International Business impacted due to
sluggish sales in MENA, higher promotional costs and
currency devaluation in some markets
958
1,072
9M FY18 9M FY19
1,132
1,282
9M FY18 9M FY19
• Media spends were 8.0% of revenue
• Other expenditure was at 9.0% vs 9.7% in 9M FY18 on
account of cost savings and efficiencies
• Consolidated Operating Margin at 20.0% as compared to
19.8% in 9M FY18
• Domestic business revenue grew by 15.5% led by volume
growth of 14.1%
• Growth in International Business was impacted by
continued under performance of MENA markets and adverse
currency movement
5,715
6,405
9M FY18 9M FY19
7
9M FY19 – Consolidated Financials
Revenue
Operating Profit
PAT
13.3%
11.9%
GST adjusted growth of 13.2%

8
Agenda
1. Dabur – Overview
2. Business Structure
3. India Business
4. International Business
5. The Way Forward
6. Our Value Creators
7. Annexure
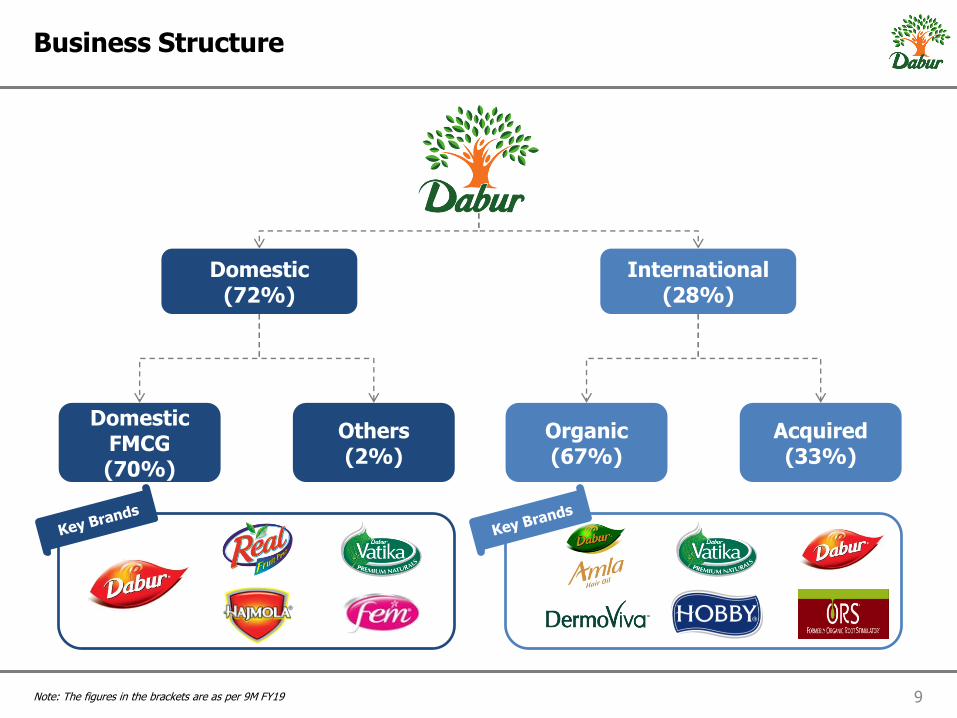
9 Note: The figures in the brackets are as per 9M FY19
Business Structure
Domestic (72%)
International (28%)
Domestic FMCG (70%)
Others (2%)
Organic (67%)
Acquired (33%)

10
Agenda
1. Dabur – Overview
2. Business Structure
3. India Business
4. International Business
5. The Way Forward
6. Our Value Creators
7. Annexure

16.2%
18.2%
14.0%
19.9%
10.0%
12.1%
19.2%
13.2%
11 Note: Numbers in the charts represent GST adjusted growth (like-to-like)
India Business – Category-wise
Category Key
Brands
Revenue Contribution
(FY18)
FY18 Growth
9M FY19 Growth
Health Supplements
17%
Digestives 6%
OTC & Ethicals
9%
Hair Care 21%
Oral Care 17%
Home Care 7%
Skin Care 5%
Foods 18%
9.4%
10.2%
3.8%
4.1%
14.4%
13.0%
11.0%
0.7%
Healthcare (32%)
HPC (50%)
Foods (18%)
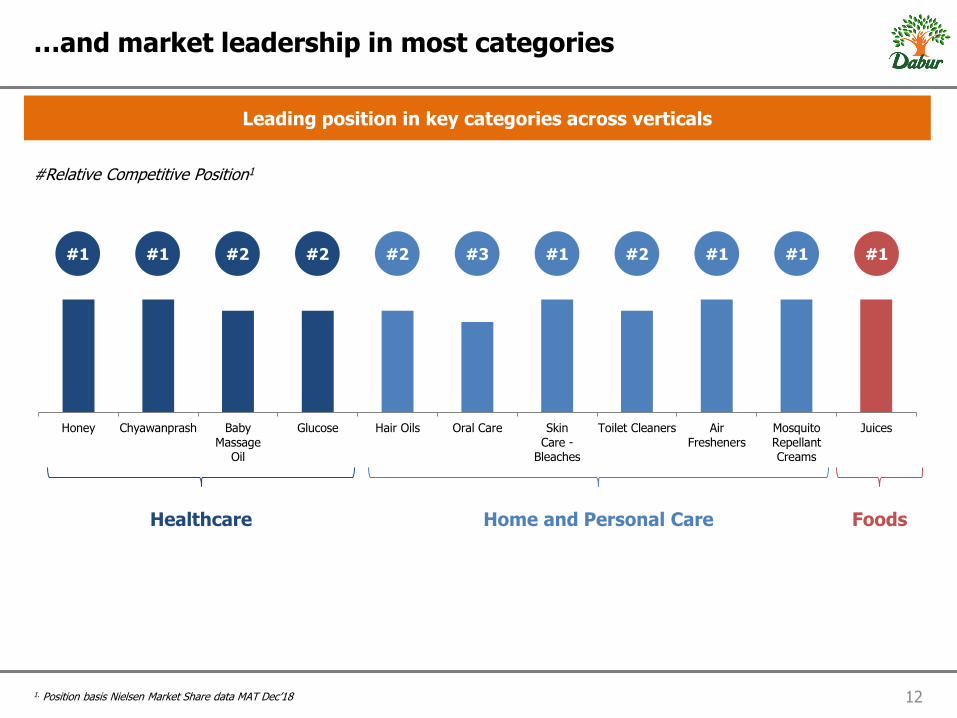
12 1. Position basis Nielsen Market Share data MAT Dec’18
…and market leadership in most categories
Leading position in key categories across verticals
Honey Chyawanprash BabyMassage
Oil
Glucose Hair Oils Oral Care SkinCare -
Bleaches
Toilet Cleaners AirFresheners
MosquitoRepellantCreams
Juices
Healthcare Home and Personal Care Foods
#1 #1 #2 #2 #2 #3 #1 #2 #1 #1 #1
#Relative Competitive Position1

916,869 910,095 912,332
1,022,974
1,090,408
Mar-15 Mar-16 Mar-17 Mar-18 Dec-18
Direct Reach – No. of Outlets
13
Project Buniyaad
Urban Strategy
Leveraging potential through Channel based approach
Enabling Technology
Using technology to track and improve performance and automate processes
Portfolio Focus
Leveraging split teams for focused portfolio building
Rural Strategy
Split the front line teams into two to increase reach and frequency – Showing significant positive gains
New Avenues of Growth
Leveraging the alternate channels of MT and E-comm to grow at a rapid pace
Continue Engagement
Using initiatives and technology to build and continuously motivate the trade and front line teams
Under Project Buniyaad , direct reach has touched ~1.1mn outlets and total reach (direct + indirect) increased to ~6.7 mn oulets

31.5%
24.5%
21.7%
11.6%
0.6%
10.1%
31.5%
23.5% 23.0%
12.5%
0.8%
8.7%
32.9%
22.6% 23.1%
13.8%
1.4%
6.2%
GT Retail Wholesale Superstockist MT E-comm Enterprise*
Evolution of Channel Saliency
FY17 FY18 9M FY19
14 *Enterprise includes Institution, Para Military, CSD and Food Services
Channel Changes
Superstockist, MT and E-comm gaining saliency; Wholesale and Enterprise continues to shrink

15
Recent Product Launches
Real Ethnic Range Honey Squeezy –
225 gm Real Mocktails Hajmola Chat Cola Vatika Enriched Coconut Hair Oil
Vatika Shampoo with Satt Poshan
Anmol Jasmine HO
Odonil Zipper
Honitus Hotsip
Fem De-Tan Bleach
Dabur Red Gel
Oxy Pro Clear Facial Kit
Odonil – Fruit Blast
Odomos Fabric Roll On
Glycodab Tablets

16
Agenda
1. Dabur – Overview
2. Business Structure
3. India Business
4. International Business
5. The Way Forward
6. Our Value Creators
7. Annexure

17
International Business – Financial Profile
Sales (INR bn)
Region-wise Sales (FY18) Performance of Key Markets (9M FY19)
• International Business comprises the Organic and Acquired business
• Organic business (67% of international) is an extension of Indian
portfolio with the same personal care brands operating internationally
• Acquired business (32% of international) comprises Hobi and
Namaste
• FY17 and FY18 were impacted due to geopolitical headwinds and
severe currency devaluation in our key markets
8.9
16.2 18.3
23.1 24.2 27.1
23.2 21.8
FY11 FY12 FY13 FY14 FY15 FY16 FY17 FY18
CAGR: 14%
Middle East 34.0%
Africa 18.8%
Asia 22.4%
Europe 10.8%
Americas 14.0%
14.0%
(1.0%)
4.0%
33.0%
8.0% 13.0%
32.0%
3.0%
10.0%
Constant Currency Sales Growth Rate 9M FY19

18
Organic International Business
FY06 FY18
Organic International Business has evolved from being just a Hair Oil business to a diversified personal care entity
Hair Oil 93%
Oral Care 2%
Others 5%
Hair Oil 34%
Hair Cream 11%
Shampoo 17%
Hamamzaith & Styling
9%
Oral Care 12%
Skin Care 7%
Others 10%
c
Key Brands

19
International Business – Strategic Levers
Innovation
GTM
Cost Management
- Capitalize on global Back to Nature trend - Drive penetration through value offerings
- Distributor restructuring - Real-time analytics - JBP (Joint Business Planning) with Key Accounts
- Saving initiatives - Manufacturing efficiencies

20
Agenda
1. Dabur – Overview
2. Business Structure
3. India Business
4. International Business
5. The Way Forward
6. Our Value Creators
7. Annexure

21
Key Elements
Driving Innovation and Renovation for Market Leadership
1
Regionalization 2
Channel Focus Strategy
Cost Optimisation and Improving Service Levels
Capability Improvement
5
4
3

22
Driving Innovation and Renovation for Market Leadership
(a) Focus on Core and Scalable Brands
1
Enhanced Investments in Core Brands
Accelerated Growth from Scalable Brands

23
Driving Innovation and Renovation for Market Leadership
(b) Creating Competitive Leverage
1
Superior Claims
Superior Formulation Superior Packaging
Superiority over mineral oils
Superiority over other Almond HO
2x stronger hair vs
Other Amla HO

24
Driving Innovation and Renovation for Market Leadership
(c) Driving NPDs
1
9M FY19
Strengthening our
Ayurvedic/ Natural
Offerings
Products for
Gen Y and Z
Premiumization
The Way Ahead

25
Driving Innovation and Renovation for Market Leadership
(d) Media Strategy for Driving Brand Preference
1
Key Shift in
Approach
Fragmented Brand Buys
CPRP Focus
Consolidated Buys with Impact Value Ads
Impact Lead Core Prime Time Focus
High on Saliency
Core Prime Time Focus
Network Deals
Reduction in Long Tail / Optimising
Channel Mix
Focus on
Top Programs
Brand Integrations
Sponsorships and
Impact

26
Regionalization 2
RI : Regional Insights (Long Term Strategic)
SE : Speed of Execution (Quick Wins, Low Investment)
• Capture Consumer, Packaging and Media Insights
• Use Analytics for Specific meaningful actions
• Dive into new adjacent categories
• Regions to provide new growth opportunities
• Trade interventions
• Activations and visibility drives
• Distribution initiatives
• Consumer promotions
RISE Regional Insights
And Speed of Execution
12 geographical clusters +
3 channel clusters
Pilot started in North East – Growth of 30%+

27
Channel Focus Strategy 3
Increasing Direct Distribution
• E-commerce and MT saliency
going up
– Strong growth across
platforms
• Backed by media activation,
visibility and consumer
promotions
Rural Focus E-commerce/ MT Focus
One of the largest distribution network in FMCG in India covering
6.4 mn+ outlets
0.91
1.02
1.20
FY17
FY18
FY19E
Aim to increase direct reach to 1.2 mn outlets
by end of FY19
Range Expansion
Drive Sell Out
1. Increase lines sold in
rural
2. Conversion of bigger
substockist to direct
1. Activations involving RSP
2. Involvement of
Substockist
3. Activation and sell out at
Wholesale
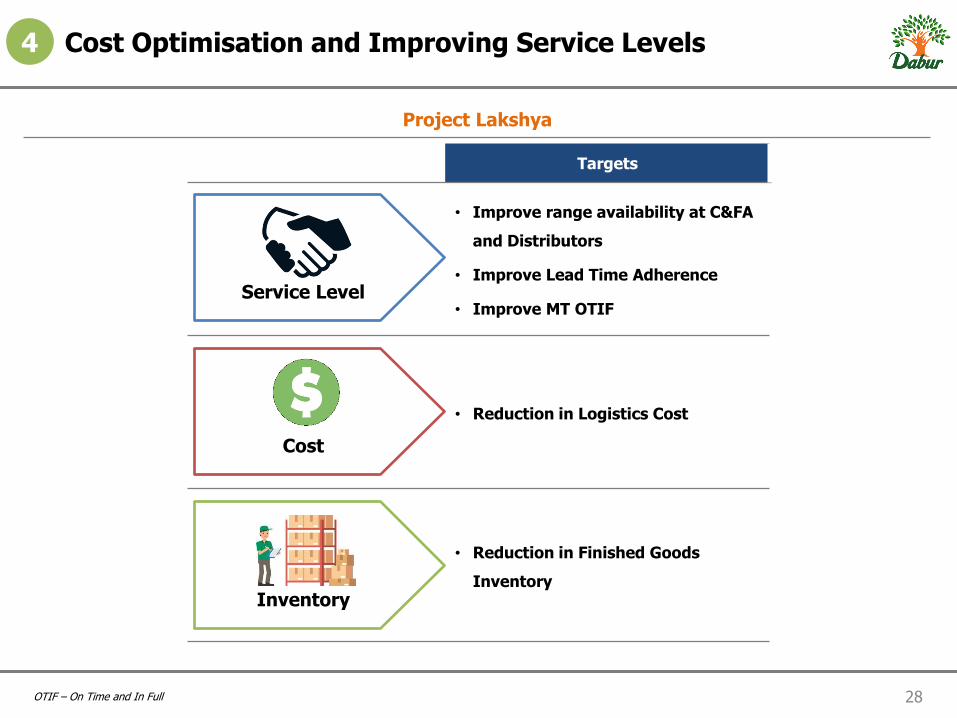
28 OTIF – On Time and In Full
Cost Optimisation and Improving Service Levels
Project Lakshya
4
Targets
• Improve range availability at C&FA
and Distributors
• Improve Lead Time Adherence
• Improve MT OTIF
• Reduction in Logistics Cost
• Reduction in Finished Goods
Inventory
Service Level
Cost
Inventory

29 DRDC – Dabur Research and Development Centre
Capability Improvement
Matrix Organisation Strengthening the Team
5
Sales
Marketing
Trade Marketing
DRDC
Marketing Services
Operations
Shared Goals across Functions
E-Comm Team
Parlor Channel Head
Healthcare Head
OTC Head
Digital Head
Ayurveda Head

30
The next growth wave
Build bigger brands
More than 15 brands in the range of INR >0.1 to 1 bn which can grow to INR 1bn+
Geographical expansion
Expand into overseas focus markets where our brands are relevant – MENA, Africa, SAARC
Consumer Health Strong core competence, low competitive intensity, strong profitability, low penetration
Driving distribution expansion
Direct reach of ~1.2 mn, increasing the no. of SKUs, rural potential, IT enablement, data analytics and e-commerce
Continued Innovation and Renovation for Younger Consumers
NPD pipeline primed to deliver new products in key categories – 4-5 new products every year

31
Agenda
1. Dabur – Overview
2. Business Structure
3. India Business
4. International Business
5. The Way Forward
6. Our Value Creators
7. Annexure

32 As on 31st March 2018
Intellectual Capital
126 scientists
are part of the strong in-house research wing
5 Research Papers Published
In FY18,
R&D team developed 16 new products
for India and International markets
11 Patent Applications
3 Patents where final specifications were filed
Our Herbal Garden
• Use 249 medicinal and aromatic plants (MAPs)
for our various Ayurvedic and natural preparations
• Put in place direct interventions for either cultivating
or sustainably collecting 58 of the 100 identified
critical MAPs
• In 17 species of MAPs, Dabur is 100% self-
sufficient
• Engage with marginal farmers in cultivation of
these herbs and MAPs, providing them visible
economic opportunities and supplementing
their income
• Also undertake special training programmes for
farmers, villagers and tribal communities to train
them on sustainable and environment-friendly
cultivation processes
• At end of March 2018, Dabur has 5,250 acres of
land under cultivation of these rare herbs and
MAPs in India
• Some Himalayan herbs are being
cultivated in 400 acres of land in Nepal
• 2,400 farmer families in India and 1,500 farmer
families in Nepal are benefiting from this
initiative

33 As on 31st March 2018
Human Capital
`
`

34 As on 31st March 2018
Social & Relationship Capital
“What is that life Worth which cannot bring comfort to others.” – Dr. S.K. Burman, Founder of Dabur
CSR Policy
35 As on 31st March 2018
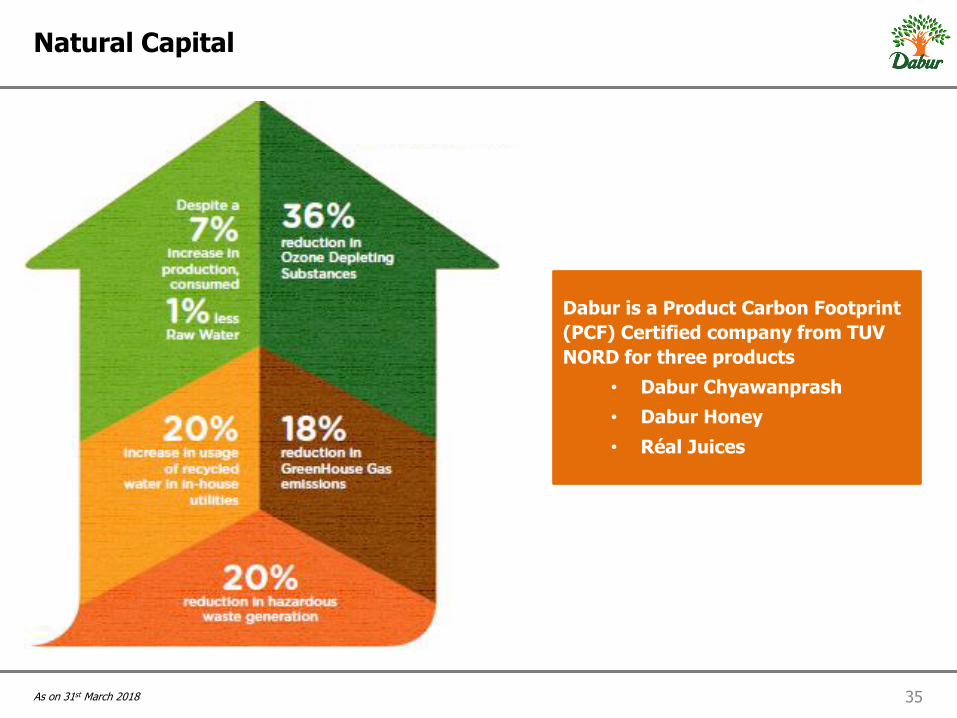
Natural Capital
`
Dabur is a Product Carbon Footprint
(PCF) Certified company from TUV
NORD for three products
• Dabur Chyawanprash
• Dabur Honey
• Réal Juices

36
Agenda
1. Dabur – Overview
2. Business Structure
3. India Business
4. International Business
5. The Way Forward
6. Our Value Creators
7. Annexure
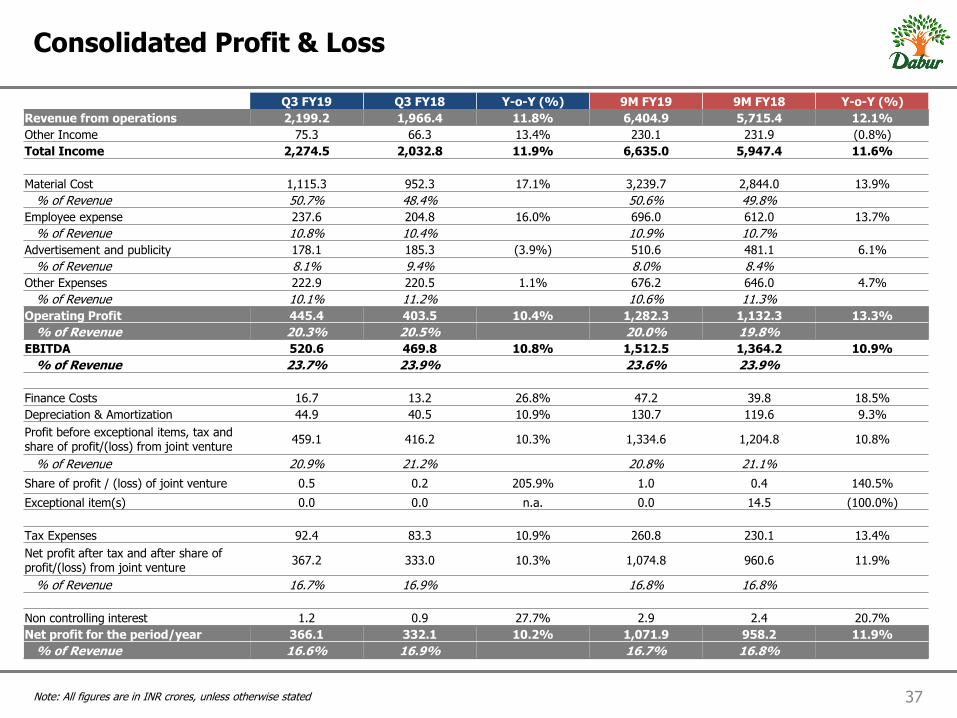
37 Note: All figures are in INR crores, unless otherwise stated
Consolidated Profit & Loss
Q3 FY19 Q3 FY18 Y-o-Y (%) 9M FY19 9M FY18 Y-o-Y (%)
Revenue from operations 2,199.2 1,966.4 11.8% 6,404.9 5,715.4 12.1%
Other Income 75.3 66.3 13.4% 230.1 231.9 (0.8%)
Total Income 2,274.5 2,032.8 11.9% 6,635.0 5,947.4 11.6%
Material Cost 1,115.3 952.3 17.1% 3,239.7 2,844.0 13.9%
% of Revenue 50.7% 48.4% 50.6% 49.8%
Employee expense 237.6 204.8 16.0% 696.0 612.0 13.7%
% of Revenue 10.8% 10.4% 10.9% 10.7%
Advertisement and publicity 178.1 185.3 (3.9%) 510.6 481.1 6.1%
% of Revenue 8.1% 9.4% 8.0% 8.4%
Other Expenses 222.9 220.5 1.1% 676.2 646.0 4.7%
% of Revenue 10.1% 11.2% 10.6% 11.3%
Operating Profit 445.4 403.5 10.4% 1,282.3 1,132.3 13.3%
% of Revenue 20.3% 20.5% 20.0% 19.8%
EBITDA 520.6 469.8 10.8% 1,512.5 1,364.2 10.9%
% of Revenue 23.7% 23.9% 23.6% 23.9%
Finance Costs 16.7 13.2 26.8% 47.2 39.8 18.5%
Depreciation & Amortization 44.9 40.5 10.9% 130.7 119.6 9.3%
Profit before exceptional items, tax and share of profit/(loss) from joint venture
459.1 416.2 10.3% 1,334.6 1,204.8 10.8%
% of Revenue 20.9% 21.2% 20.8% 21.1%
Share of profit / (loss) of joint venture 0.5 0.2 205.9% 1.0 0.4 140.5%
Exceptional item(s) 0.0 0.0 n.a. 0.0 14.5 (100.0%)
Tax Expenses 92.4 83.3 10.9% 260.8 230.1 13.4%
Net profit after tax and after share of profit/(loss) from joint venture
367.2 333.0 10.3% 1,074.8 960.6 11.9%
% of Revenue 16.7% 16.9% 16.8% 16.8%
Non controlling interest 1.2 0.9 27.7% 2.9 2.4 20.7%
Net profit for the period/year 366.1 332.1 10.2% 1,071.9 958.2 11.9%
% of Revenue 16.6% 16.9% 16.7% 16.8%

38 Note: All figures are in INR crores, unless otherwise stated
Standalone Profit & Loss
Q3 FY19 Q3 FY18 Y-o-Y (%) 9M FY19 9M FY18 Y-o-Y (%)
Revenue from operations 1,664.5 1,449.3 14.8% 4,674.8 4,099.4 14.0%
Other Income 67.4 60.6 11.2% 211.7 212.4 (0.3%)
Total Income 1,731.8 1,509.9 14.7% 4,886.4 4,311.8 13.3%
Material Cost 863.9 734.0 17.7% 2,437.0 2,145.3 13.6%
% of Revenue 51.9% 50.6% 52.1% 52.3%
Employee expense 147.9 122.9 20.3% 429.1 359.4 19.4%
% of Revenue 8.9% 8.5% 9.2% 8.8%
Advertisement and publicity 147.0 146.8 0.1% 413.8 380.2 8.8%
% of Revenue 8.8% 10.1% 8.9% 9.3%
Other Expenses 140.2 135.7 3.3% 421.3 396.2 6.3%
% of Revenue 8.4% 9.4% 9.0% 9.7%
Operating Profit 365.5 309.9 18.0% 973.5 818.3 19.0%
% of Revenue 22.0% 21.4% 20.8% 20.0%
EBITDA 432.9 370.5 16.9% 1,185.2 1,030.7 15.0%
% of Revenue 26.0% 25.6% 25.4% 25.1%
Finance Costs 9.5 5.2 82.8% 23.5 16.0 47.0%
Depreciation & Amortization 28.0 26.2 6.9% 80.2 76.2 5.3%
Profit before exceptional items, tax and share of profit/(loss) from joint venture
395.4 339.1 16.6% 1,081.5 938.5 15.2%
% of Revenue 23.8% 23.4% 23.1% 22.9%
Exceptional item(s) 0.0 0.0 n.a. 0.0 14.5 (100.0%)
Tax Expenses 83.2 73.6 13.1% 231.5 205.5 12.7%
Net profit for the period/year 312.1 265.5 17.6% 850.0 718.5 18.3%
% of Revenue 18.8% 18.3% 18.2% 17.5%

39 Note: All figures are in INR crores, unless otherwise stated
Consolidated Balance Sheet
Particulars
As at 30/09/2018 (Unaudited)
As at 31/03/2018
(Audited)
A Assets
1 Non-current assets
(a) Property, plant and equipment 1,552 1,552
(b) Capital work-in-progress 39 42
(c) Investment property 54 54
(d) Goodwill 411 412
(e) Other Intangible assets 35 10
(f) Financial assets
(i) Investments 3,042 3,092
(ii) Loans 15 13
(iii) Others 7 4
(g) Non-current tax assets (net) 3 3
(h) Other non-current assets 79 80
Total Non-current assets 5,237 5,262
2 Current assets
(a) Inventories 1,282 1,256
(b) Financial assets
(i) Investments 271 713
(ii) Trade receivables 772 706
(iii) Cash and cash equivalents 96 154
(iv) Bank Balances other than (iii) above
96 152
(v) Loans 8 35
(vi) Others 3 28
(c) Current tax asset(net) 2 2
(d) Other current assets 373 391
(e) Assets held for sale 2 2
Total current assets 2,906 3,440
Total Assets 8,143 8,702
Particulars As at
30/09/2018 (Unaudited)
As at 31/03/2018
(Audited)
B Equity and Liabilities
1 Equity
(a) Equity share capital 177 176
(b) Other Equity 4,956 5,530
Equity attributable to shareholders of the Company
5,133 5,707
Non Controlling Interest 31 27
Total equity 5,163 5,733
2 Non-current liabilities
(a) Financial liabilities
(i) Borrowings 42 364
(ii) Other financial liabilities 4 4
(b) Provisions 58 57
(c) Deferred tax liabilities (Net) 99 109
Total Non-current liabilities 203 534
3 Current liabilities
(a) Financial liabilities
(i) Borrowings 671 464
(ii) Trade payables 1,343 1,410
(iii) Other financial liabilities 349 238
(b) Other current liabilities 223 173
(c) Provisions 139 107
(d) Current tax Liabilities (Net) 50 41
Total Current liabilities 2,776 2,434
Total Equity and Liabilities 8,143 8,702
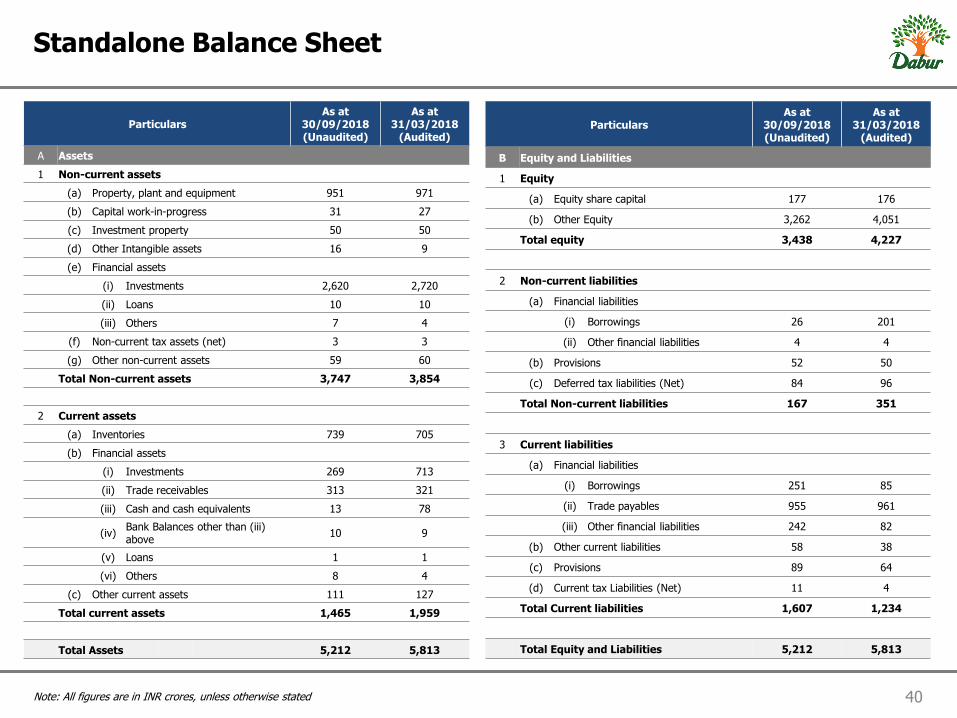
40 Note: All figures are in INR crores, unless otherwise stated
Standalone Balance Sheet
Particulars
As at 30/09/2018 (Unaudited)
As at 31/03/2018
(Audited)
A Assets
1 Non-current assets
(a) Property, plant and equipment 951 971
(b) Capital work-in-progress 31 27
(c) Investment property 50 50
(d) Other Intangible assets 16 9
(e) Financial assets
(i) Investments 2,620 2,720
(ii) Loans 10 10
(iii) Others 7 4
(f) Non-current tax assets (net) 3 3
(g) Other non-current assets 59 60
Total Non-current assets 3,747 3,854
2 Current assets
(a) Inventories 739 705
(b) Financial assets
(i) Investments 269 713
(ii) Trade receivables 313 321
(iii) Cash and cash equivalents 13 78
(iv) Bank Balances other than (iii) above
10 9
(v) Loans 1 1
(vi) Others 8 4
(c) Other current assets 111 127
Total current assets 1,465 1,959
Total Assets 5,212 5,813
Particulars As at
30/09/2018 (Unaudited)
As at 31/03/2018
(Audited)
B Equity and Liabilities
1 Equity
(a) Equity share capital 177 176
(b) Other Equity 3,262 4,051
Total equity 3,438 4,227
2 Non-current liabilities
(a) Financial liabilities
(i) Borrowings 26 201
(ii) Other financial liabilities 4 4
(b) Provisions 52 50
(c) Deferred tax liabilities (Net) 84 96
Total Non-current liabilities 167 351
3 Current liabilities
(a) Financial liabilities
(i) Borrowings 251 85
(ii) Trade payables 955 961
(iii) Other financial liabilities 242 82
(b) Other current liabilities 58 38
(c) Provisions 89 64
(d) Current tax Liabilities (Net) 11 4
Total Current liabilities 1,607 1,234
Total Equity and Liabilities 5,212 5,813

For more information & updates,
Contact:
Gagan Ahluwalia ([email protected])
Ankit Joshi ([email protected])


