32
Dabur India Limited Investor Communication Quarter and Year ended 31 st March 2018
Dabur India Limited
Investor Communication
Quarter and Year ended 31st March 2018
2
Contents
1. Q4 FY18 and FY18 – Overview
2. Category Highlights
3. Business Initiatives
4. FY18 - Product Launches
5. International Business – Overview
6. Final Dividend
7. Profit and Loss Statements and Balance Sheets
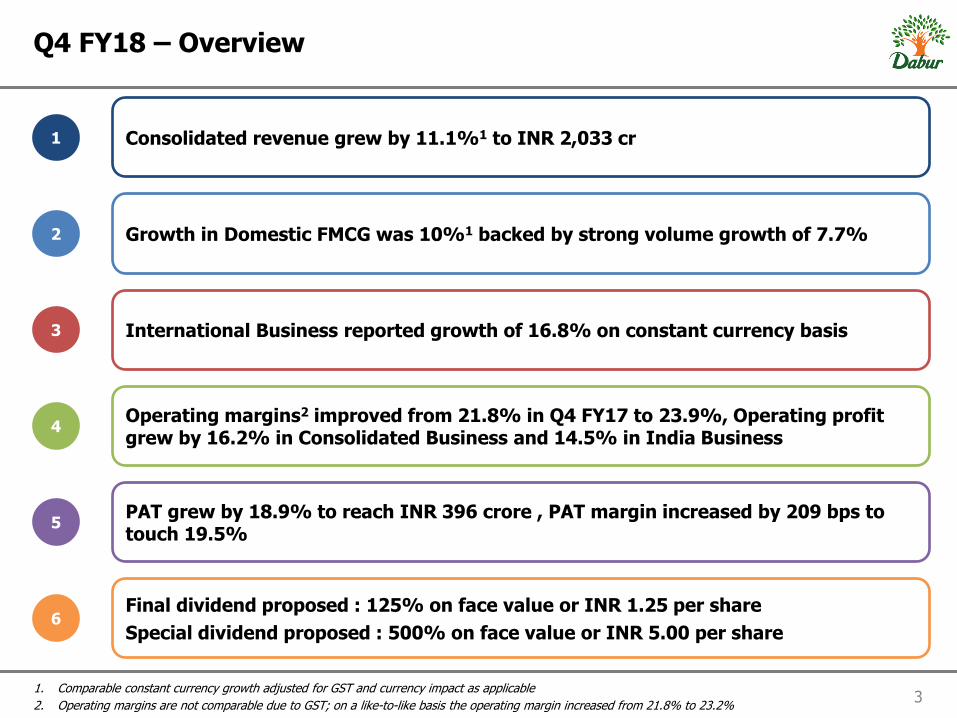
3 1. Comparable constant currency growth adjusted for GST and currency impact as applicable
2. Operating margins are not comparable due to GST; on a like-to-like basis the operating margin increased from 21.8% to 23.2%
Q4 FY18 – Overview
1 Consolidated revenue grew by 11.1%1 to INR 2,033 cr
2 Growth in Domestic FMCG was 10%1 backed by strong volume growth of 7.7%
3 International Business reported growth of 16.8% on constant currency basis
Operating margins2 improved from 21.8% in Q4 FY17 to 23.9%, Operating profit grew by 16.2% in Consolidated Business and 14.5% in India Business
4
PAT grew by 18.9% to reach INR 396 crore , PAT margin increased by 209 bps to touch 19.5%
5
Final dividend proposed : 125% on face value or INR 1.25 per share
Special dividend proposed : 500% on face value or INR 5.00 per share 6

4 1. Comparable constant currency growth adjusted for GST and currency impact as applicable
FY2017-18 – Overview
2 Growth in Domestic FMCG was 8.0%1 backed by volume growth of 6%
3 International Business reported growth of 5.3% on constant currency basis in spite of geopolitical headwinds and currency devaluation
Operating margins improved from 19.6% in FY17 to 20.9%, Operating profit grew by 7.2% in Consolidated Business and 10.6% in India Business
4
PAT grew by 6.1% to reach INR 1,354 crore , PAT margin increased by 90 bps to touch 17.5%
5
1 Consolidated revenue growth of 6.9%1 in FY2017-18
Total dividend for FY18 : 750% on face value or INR 7.50 per share 6

• Material cost came down from 51.0% of sales to 49.3% of
sales driven by lower promotional cost and favourable
product mix
• Operating margin increased to 23.9% in Q4 FY18 vs 21.8%
in Q4 FY17 on account of cost efficiencies and operating
leverage
418
485
Q4 FY17 Q4 FY18
• GST adjusted constant currency growth in Revenue was
11.1%
• Domestic business revenue grew by ~10% led by volume
growth of 7.7%
• International Business grew by 16.8% on the back of
recovery in the GCC region
1,915
2,033
Q4 FY17 Q4 FY18
5
Q4 FY18 – Consolidated Financials
Revenue
EBITDA
PAT • Consolidated Profit After Tax (PAT) grew by 18.9%
• PAT margin increased by 209 bps to reach 19.5% 333
396
Q4 FY17 Q4 FY18
GST adjusted constant current growth of 11.1%
16.2%
18.9%

6
Q4 FY18 and FY18 – Impact of GST and Currency on Growth
Consolidated Revenue from Operations
Domestic FMCG Revenue
6.2%
11.1% 3.6%
1.3%
Reported Value
Growth
GST Impact Currency Impact Underlying GST
and CurrencyAdjusted Growth
4.7%
~10% 5.0%
Reported Value Growth GST Impact Underlying GST
Adjusted Growth
0.6%
6.9%
2.8%
3.6%
Reported Value
Growth
GST Impact Currency Impact Underlying GST
and CurrencyAdjusted Growth
3.9%
8.0% 4.0%
Reported Value Growth GST Impact Underlying GST
Adjusted Growth
Q4 FY18 FY18
Q4 FY18 FY18
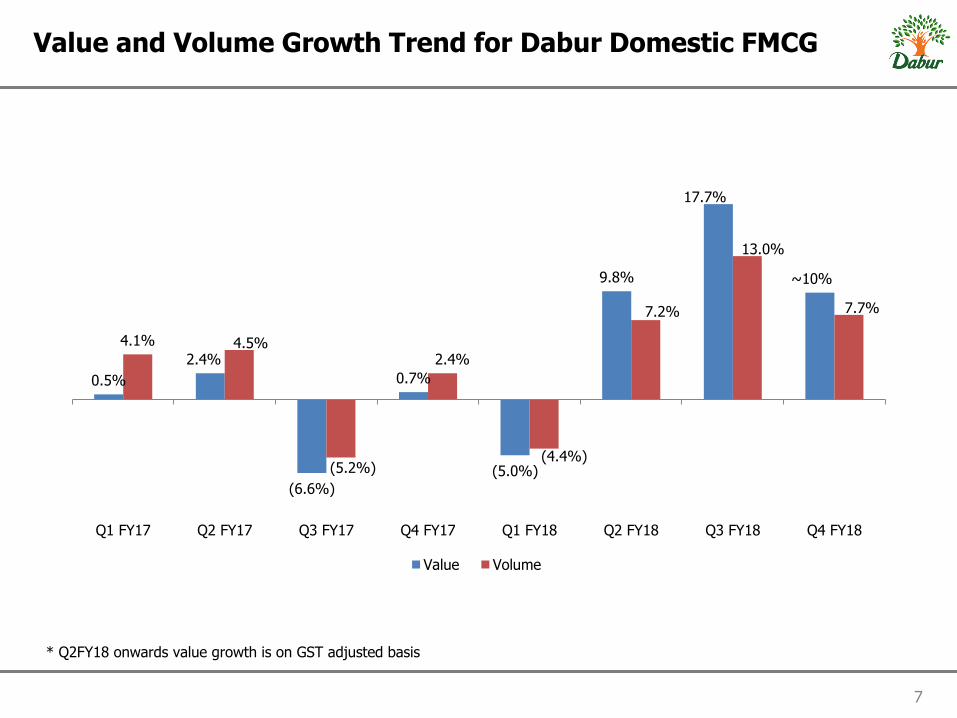
0.5%
2.4%
(6.6%)
0.7%
(5.0%)
9.8%
17.7%
~10%
4.1% 4.5%
(5.2%)
2.4%
(4.4%)
7.2%
13.0%
7.7%
Q1 FY17 Q2 FY17 Q3 FY17 Q4 FY17 Q1 FY18 Q2 FY18 Q3 FY18 Q4 FY18
Value Volume
7
Value and Volume Growth Trend for Dabur Domestic FMCG
* Q2FY18 onwards value growth is on GST adjusted basis
8
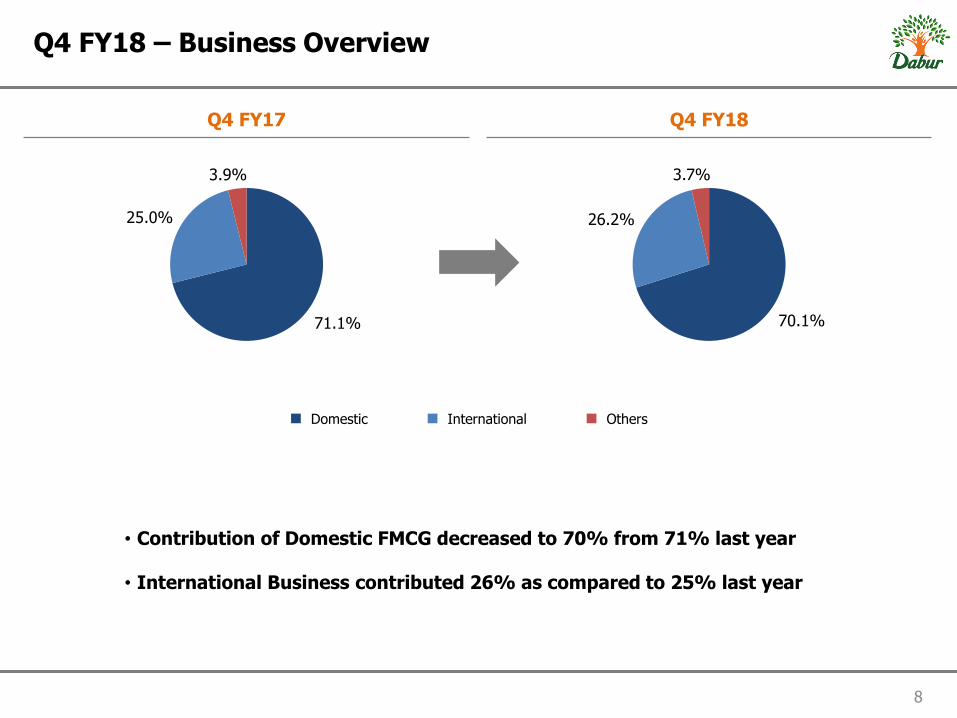
Q4 FY18 – Business Overview
Q4 FY17 Q4 FY18
70.1%
26.2%
3.7%
71.1%
25.0%
3.9%
Domestic International Others
• Contribution of Domestic FMCG decreased to 70% from 71% last year
• International Business contributed 26% as compared to 25% last year

9
FY 2017-18 – Business Overview
FY17 FY18
68.5%
27.9%
3.6%
66.2%
30.1%
3.7%
Domestic International Others
• Contribution of Domestic FMCG increased from 66% to 69%
• International Business contribution came down from 30% to 28%
23%
17%
5% 5%
17%
6%
9%
18% 22%
16%
5% 6% 17%
6%
9%
19%
10
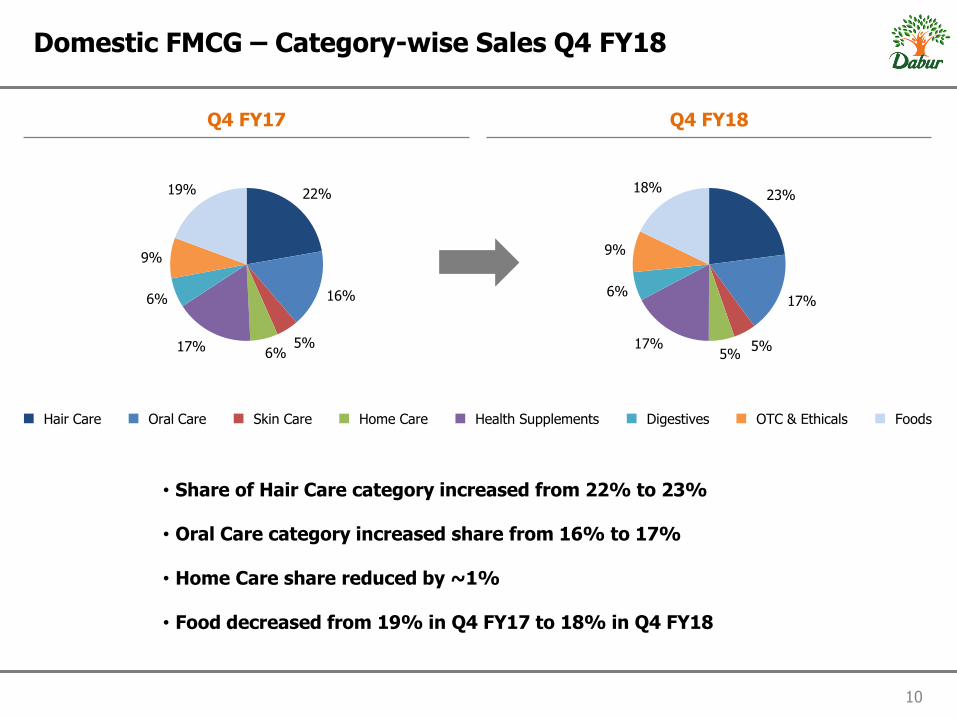
Domestic FMCG – Category-wise Sales Q4 FY18
Q4 FY17 Q4 FY18
• Share of Hair Care category increased from 22% to 23%
• Oral Care category increased share from 16% to 17%
• Home Care share reduced by ~1%
• Food decreased from 19% in Q4 FY17 to 18% in Q4 FY18
Hair Care Oral Care Skin Care Home Care Health Supplements Digestives Foods OTC & Ethicals

21%
17%
5% 7%
17%
6%
9%
18% 22%
16%
5% 7%
17%
6%
9%
19%
11
Domestic FMCG – Category-wise Sales FY2017-18
FY17 FY18
• Share of Hair Care category decreased from 22% to 21%
• Oral Care category increased share from 16% to 17%
• Food decreased from 19% in FY17 to 18% in FY18
Hair Care Oral Care Skin Care Home Care Health Supplements Digestives Foods OTC & Ethicals

12
Contents
1. Q4 FY18 and FY18 – Overview
2. Category Highlights
3. Business Initiatives
4. FY18 - Product Launches
5. International Business – Overview
6. Final Dividend
7. Profit and Loss Statements and Balance Sheets
13 Note: Growth figures refer to Like-to-like growth (adjusted for GST)
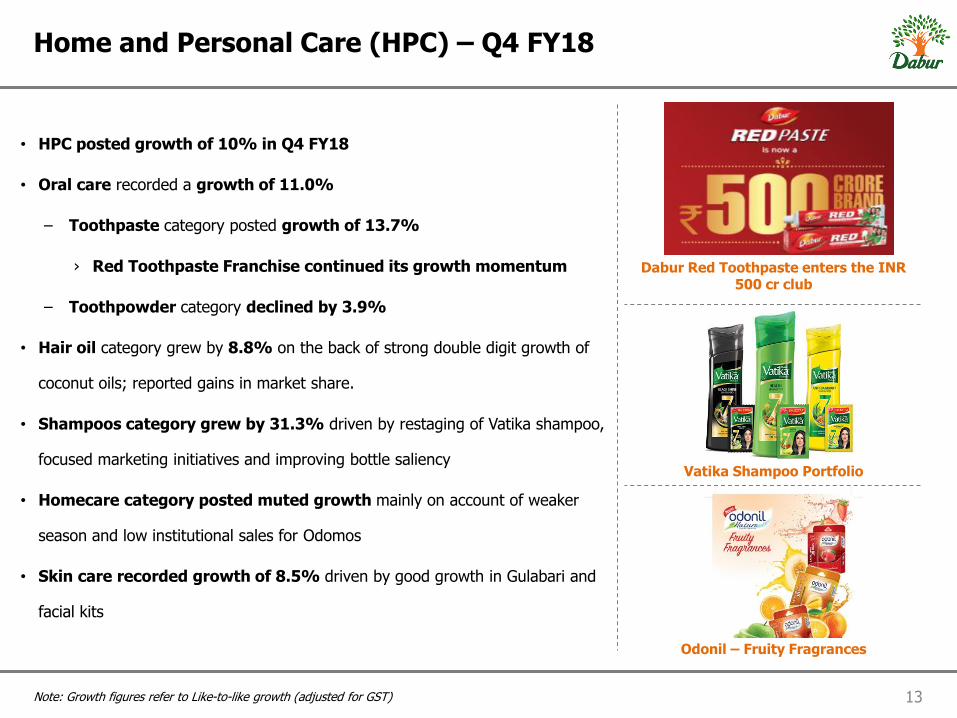
Home and Personal Care (HPC) – Q4 FY18
• HPC posted growth of 10% in Q4 FY18
• Oral care recorded a growth of 11.0%
– Toothpaste category posted growth of 13.7%
› Red Toothpaste Franchise continued its growth momentum
– Toothpowder category declined by 3.9%
• Hair oil category grew by 8.8% on the back of strong double digit growth of
coconut oils; reported gains in market share.
• Shampoos category grew by 31.3% driven by restaging of Vatika shampoo,
focused marketing initiatives and improving bottle saliency
• Homecare category posted muted growth mainly on account of weaker
season and low institutional sales for Odomos
• Skin care recorded growth of 8.5% driven by good growth in Gulabari and
facial kits
Dabur Red Toothpaste enters the INR 500 cr club
Odonil – Fruity Fragrances
Vatika Shampoo Portfolio
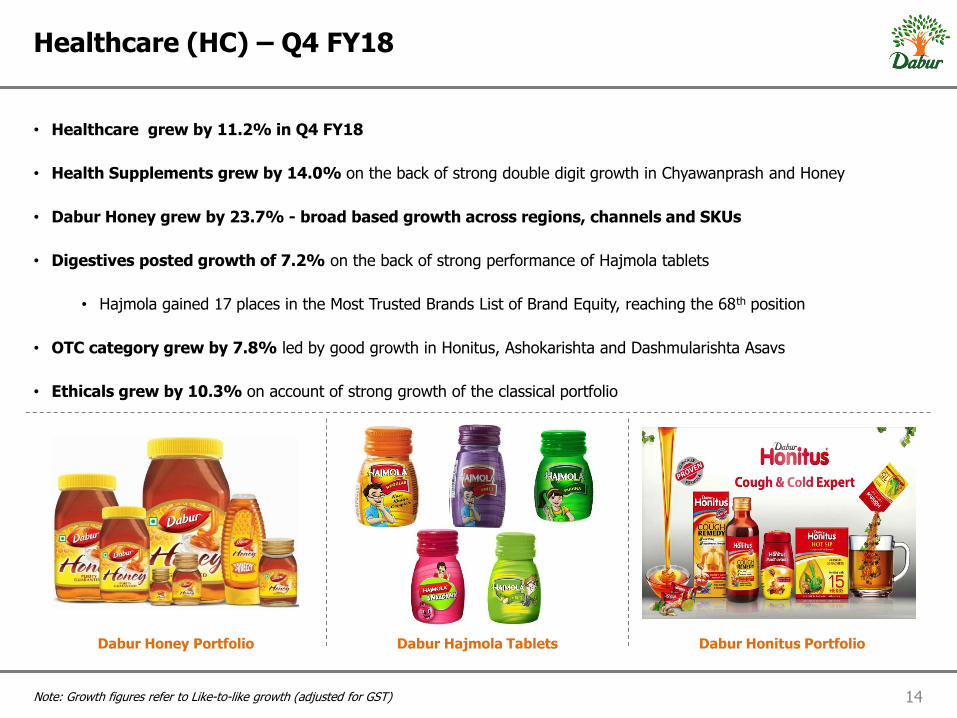
• Healthcare grew by 11.2% in Q4 FY18
• Health Supplements grew by 14.0% on the back of strong double digit growth in Chyawanprash and Honey
• Dabur Honey grew by 23.7% - broad based growth across regions, channels and SKUs
• Digestives posted growth of 7.2% on the back of strong performance of Hajmola tablets
• Hajmola gained 17 places in the Most Trusted Brands List of Brand Equity, reaching the 68th position
• OTC category grew by 7.8% led by good growth in Honitus, Ashokarishta and Dashmularishta Asavs
• Ethicals grew by 10.3% on account of strong growth of the classical portfolio
14 Note: Growth figures refer to Like-to-like growth (adjusted for GST)
Healthcare (HC) – Q4 FY18
Dabur Honey Portfolio Dabur Hajmola Tablets Dabur Honitus Portfolio
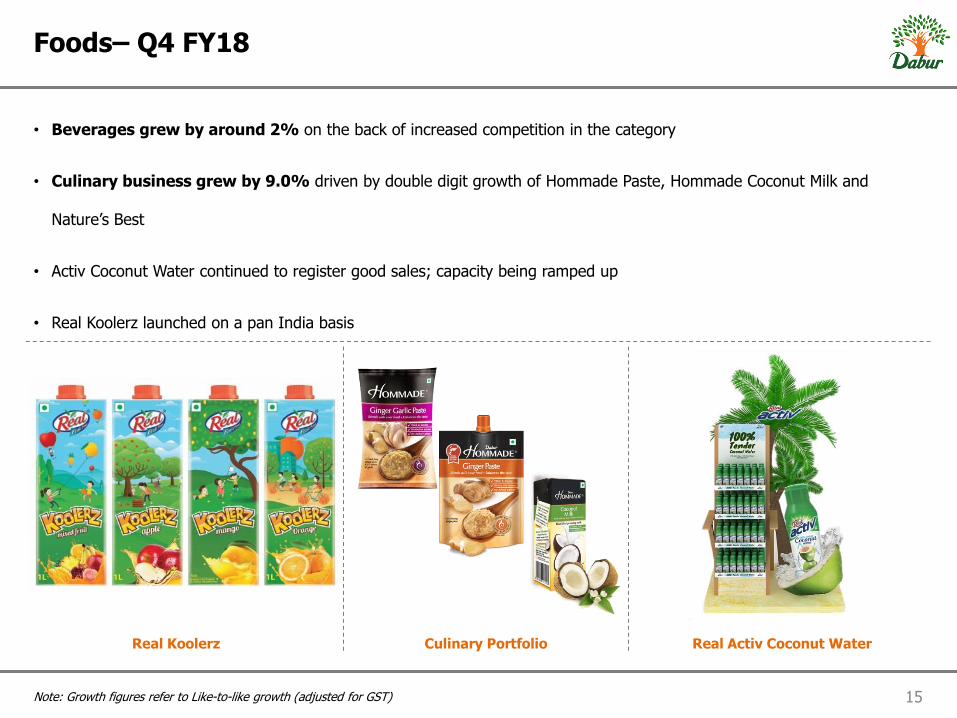
• Beverages grew by around 2% on the back of increased competition in the category
• Culinary business grew by 9.0% driven by double digit growth of Hommade Paste, Hommade Coconut Milk and
Nature’s Best
• Activ Coconut Water continued to register good sales; capacity being ramped up
• Real Koolerz launched on a pan India basis
15 Note: Growth figures refer to Like-to-like growth (adjusted for GST)
Foods– Q4 FY18
Real Koolerz Culinary Portfolio Real Activ Coconut Water
16
Contents
1. Q4 FY18 and FY18 – Overview
2. Category Highlights
3. Business Initiatives
4. FY18 - Product Launches
5. International Business – Overview
6. Final Dividend
7. Profit and Loss Statements and Balance Sheets

17
Consumer/ Marketing Initiatives
DRTP Dental Brigade with Dainik Jagran
Dabur Red Dant Snan at Magh Mela
Dabur Red Guinness Record for Largest Oral Hygiene Session
Dabur Hajmola at Magh Mela
Dabur Amla Miss North India Princess
National Workshop on Panch Karma at Rajasthan Ayurved
University

18
Contents
1. Q4 FY18 and FY18 – Overview
2. Category Highlights
3. Business Initiatives
4. FY18 - Product Launches
5. International Business – Overview
6. Final Dividend
7. Profit and Loss Statements and Balance Sheets

Fem De-Tan Bleach (10 gm)
Oxy Pro Clear Facial Kit
Odonil Zipper
19
Products Launched in FY18 (1/2)
Vatika Shampoo with Satt Poshan
Vatika Enriched Coconut Hair Oil
Anmol Jasmine Hair Oil
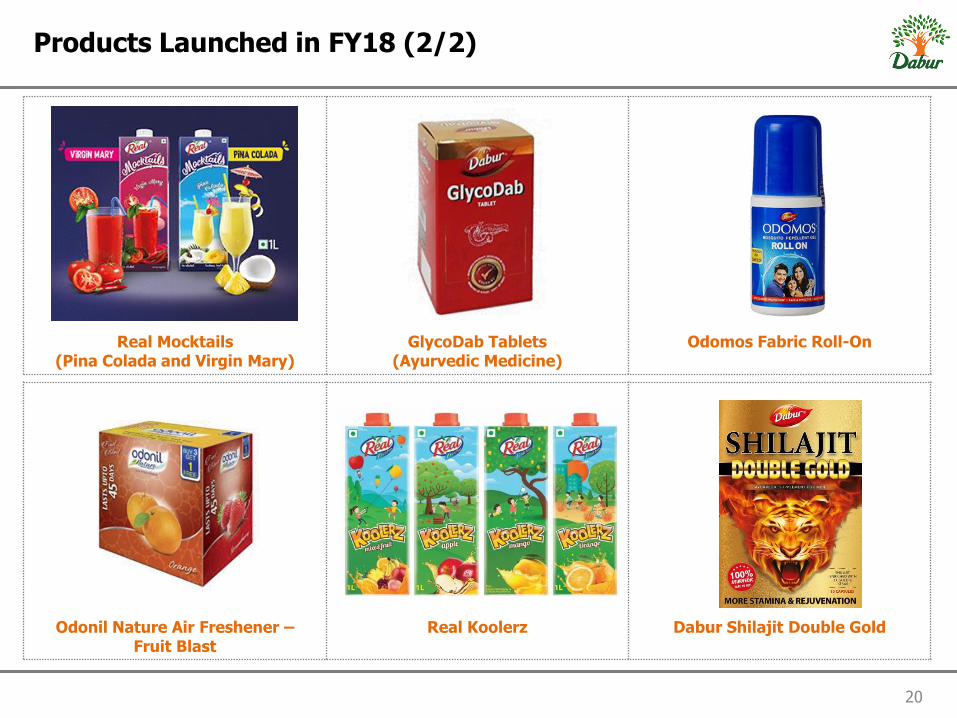
Real Mocktails (Pina Colada and Virgin Mary)
GlycoDab Tablets (Ayurvedic Medicine)
Odomos Fabric Roll-On
20
Products Launched in FY18 (2/2)
Odonil Nature Air Freshener – Fruit Blast
Real Koolerz
Dabur Shilajit Double Gold

21
Contents
1. Q4 FY18 and FY18 – Overview
2. Category Highlights
3. Business Initiatives
4. FY18 - Product Launches
5. International Business – Overview
6. Final Dividend
7. Profit and Loss Statements and Balance Sheets

• International Business posted 16.8% growth in constant currency terms during Q4 FY18
• GCC markets witnessed a strong turn around with constant currency growth of 50.7% led by Saudi Arabia which grew
by 81.9%
• Egypt posted strong growth of 38.0% in constant currency
• SAARC markets performed well led by strong growth in Nepal and Pakistan
• Shutdown in Algeria & Yemen led to loss of sales in North African region
• US business of Namaste reported muted performance due to category issues. However the Sub Saharan region posted
strong growth of 23% on constant currency basis.
22
International Business – Q4 FY18
38.0%
50.7%
81.9%
40.0%
18.7% 8.3%
(6.0%)
22.8%
Egypt GCC Saudi Arabia Pakistan Nepal Turkey Namaste SSA
Constant Currency Growth Rate – Q4 FY18

23
Contents
1. Q4 FY18 and FY18 – Overview
2. Category Highlights
3. Business Initiatives
4. FY18 - Product Launches
5. International Business – Overview
6. Final Dividend
7. Profit and Loss Statements and Balance Sheets

24
Final Dividend
Final Dividend proposed
Special Dividend proposed
Total Dividend for FY18
Dividend per share (INR) 1.25 5.00 7.50
Dividend % 125% 500% 750%
Total dividend (INR cr)* 265.45 1,061.80 1,592.27
* Includes dividend tax

1. Q4 FY18 and FY18 – Overview
2. Category Highlights
3. Business Initiatives
4. FY18 - Product Launches
5. International Business – Overview
6. Final Dividend
7. Profit and Loss Statements and Balance Sheets
25
Contents
26 Note: All figures are in INR crores, unless otherwise stated
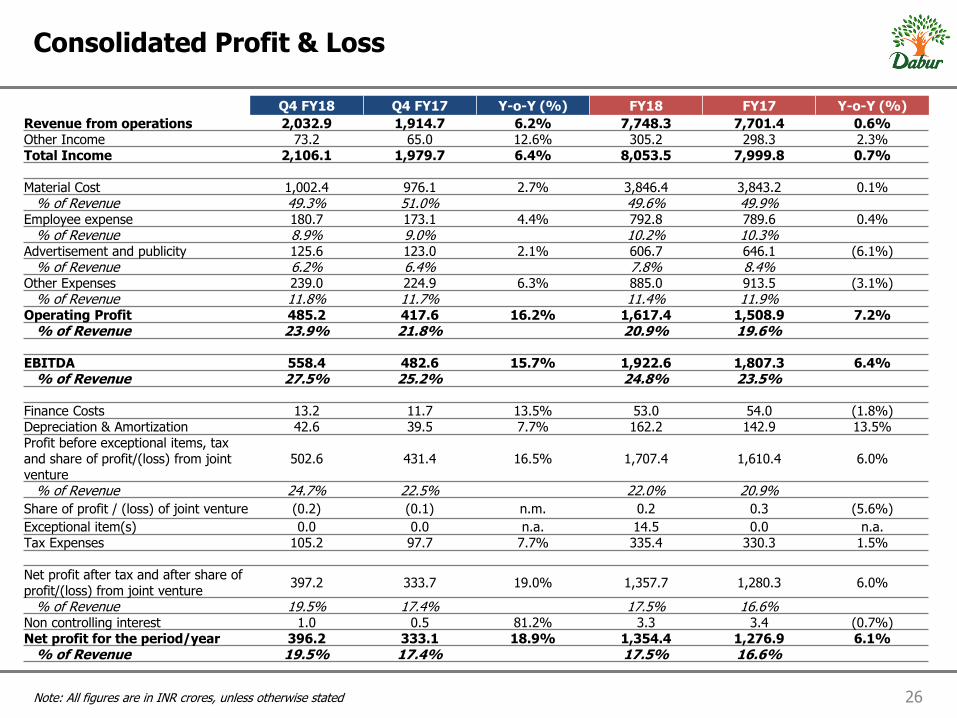
Consolidated Profit & Loss
Q4 FY18 Q4 FY17 Y-o-Y (%) FY18 FY17 Y-o-Y (%)
Revenue from operations 2,032.9 1,914.7 6.2% 7,748.3 7,701.4 0.6% Other Income 73.2 65.0 12.6% 305.2 298.3 2.3% Total Income 2,106.1 1,979.7 6.4% 8,053.5 7,999.8 0.7%
Material Cost 1,002.4 976.1 2.7% 3,846.4 3,843.2 0.1% % of Revenue 49.3% 51.0% 49.6% 49.9%
Employee expense 180.7 173.1 4.4% 792.8 789.6 0.4% % of Revenue 8.9% 9.0% 10.2% 10.3%
Advertisement and publicity 125.6 123.0 2.1% 606.7 646.1 (6.1%) % of Revenue 6.2% 6.4% 7.8% 8.4%
Other Expenses 239.0 224.9 6.3% 885.0 913.5 (3.1%) % of Revenue 11.8% 11.7% 11.4% 11.9%
Operating Profit 485.2 417.6 16.2% 1,617.4 1,508.9 7.2% % of Revenue 23.9% 21.8% 20.9% 19.6%
EBITDA 558.4 482.6 15.7% 1,922.6 1,807.3 6.4% % of Revenue 27.5% 25.2% 24.8% 23.5%
Finance Costs 13.2 11.7 13.5% 53.0 54.0 (1.8%) Depreciation & Amortization 42.6 39.5 7.7% 162.2 142.9 13.5% Profit before exceptional items, tax and share of profit/(loss) from joint venture
502.6 431.4 16.5% 1,707.4 1,610.4 6.0%
% of Revenue 24.7% 22.5% 22.0% 20.9%
Share of profit / (loss) of joint venture (0.2) (0.1) n.m. 0.2 0.3 (5.6%)
Exceptional item(s) 0.0 0.0 n.a. 14.5 0.0 n.a. Tax Expenses 105.2 97.7 7.7% 335.4 330.3 1.5%
Net profit after tax and after share of profit/(loss) from joint venture
397.2 333.7 19.0% 1,357.7 1,280.3 6.0%
% of Revenue 19.5% 17.4% 17.5% 16.6% Non controlling interest 1.0 0.5 81.2% 3.3 3.4 (0.7%) Net profit for the period/year 396.2 333.1 18.9% 1,354.4 1,276.9 6.1%
% of Revenue 19.5% 17.4% 17.5% 16.6%

27 Note: All figures are in INR crores, unless otherwise stated
Standalone Profit & Loss
Q4 FY18 Q4 FY17 Y-o-Y (%) FY18 FY17 Y-o-Y (%)
Revenue from operations 1,509.6 1,434.8 5.2% 5,609.1 5,369.8 4.5% Other Income 70.8 60.0 18.0% 283.2 274.6 3.1% Total Income 1,580.5 1,494.8 5.7% 5,892.3 5,644.5 4.4%
Material Cost 774.2 771.4 0.4% 2,919.5 2,858.8 2.1% % of Revenue 51.3% 53.8% 52.0% 53.2%
Employee expense 101.8 89.0 14.4% 461.1 425.3 8.4% % of Revenue 6.7% 6.2% 8.2% 7.9%
Advertisement and publicity 81.7 77.5 5.5% 462.0 418.0 10.5% % of Revenue 5.4% 5.4% 8.2% 7.8%
Other Expenses 141.4 138.4 2.2% 537.7 556.4 (3.4%) % of Revenue 9.4% 9.6% 9.6% 10.4%
Operating Profit 410.5 358.5 14.5% 1,228.8 1,111.4 10.6% % of Revenue 27.2% 25.0% 21.9% 20.7%
EBITDA 481.4 418.5 15.0% 1,512.1 1,386.0 9.1% % of Revenue 31.9% 29.2% 27.0% 25.8%
Finance Costs 5.9 4.9 19.7% 21.9 16.2 34.9% Depreciation & Amortization 26.3 21.3 23.5% 102.5 75.4 35.9% Profit before exceptional items, tax and share of profit/(loss) from joint venture
449.1 392.3 14.5% 1,387.7 1,294.4 7.2%
% of Revenue 29.8% 27.3% 24.7% 24.1% Exceptional item(s) 0.0 0.0 n.a. 14.5 0.0 n.a. Tax Expenses 95.6 90.0 6.2% 301.1 296.0 1.7%
Net profit for the period/year 353.6 302.3 17.0% 1,072.0 998.4 7.4% % of Revenue 23.4% 21.1% 19.1% 18.6%
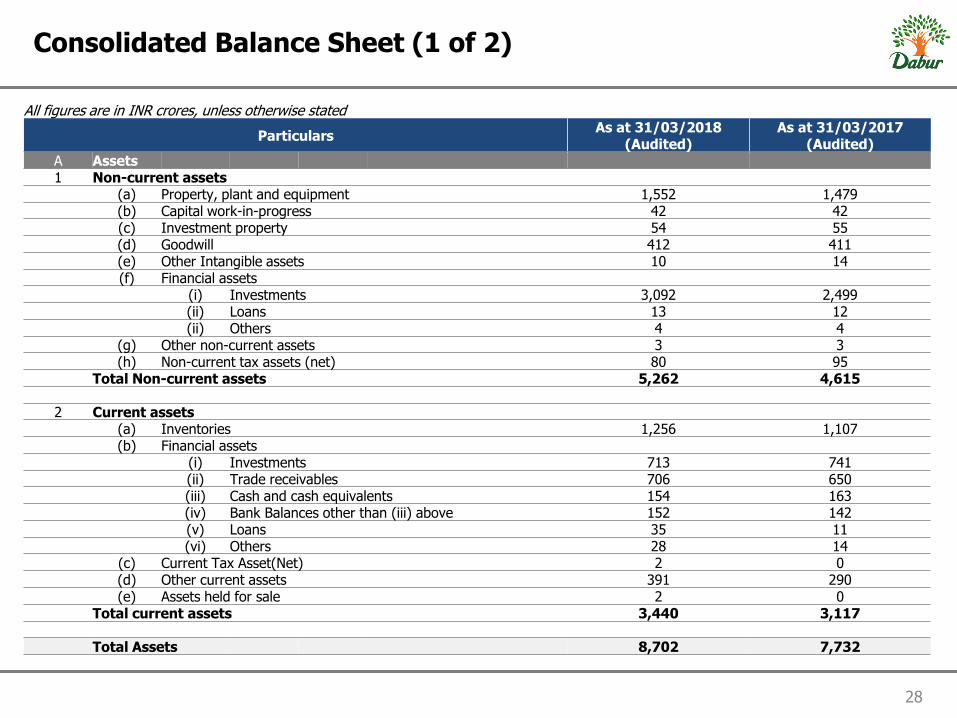
All figures are in INR crores, unless otherwise stated
Particulars As at 31/03/2018
(Audited) As at 31/03/2017
(Audited) A Assets 1 Non-current assets (a) Property, plant and equipment 1,552 1,479 (b) Capital work-in-progress 42 42 (c) Investment property 54 55 (d) Goodwill 412 411 (e) Other Intangible assets 10 14 (f) Financial assets (i) Investments 3,092 2,499 (ii) Loans 13 12 (ii) Others 4 4 (g) Other non-current assets 3 3 (h) Non-current tax assets (net) 80 95 Total Non-current assets 5,262 4,615 2 Current assets (a) Inventories 1,256 1,107 (b) Financial assets (i) Investments 713 741 (ii) Trade receivables 706 650 (iii) Cash and cash equivalents 154 163 (iv) Bank Balances other than (iii) above 152 142
(v) Loans 35 11 (vi) Others 28 14 (c) Current Tax Asset(Net) 2 0 (d) Other current assets 391 290 (e) Assets held for sale 2 0 Total current assets 3,440 3,117 Total Assets 8,702 7,732
28
Consolidated Balance Sheet (1 of 2)

29
Consolidated Balance Sheet (2 of 2)
All figures are in INR crores, unless otherwise stated
Particulars As at 31/03/2018
(Audited) As at 31/03/2017
(Audited)
B Equity and Liabilities
1 Equity
(a) Equity share capital 176 176
(b) Other Equity 5,530 4,671
Equity attributable to shareholders of the Company 5,707 4,847
Non Controlling Interest 27 25
Total equity 5,733 4,872
2 Non-current liabilities
(a) Financial liabilities
(i) Borrowings 364 471
(ii) Other financial liabilities 4 4
(b) Provisions 56 53
(c) Deferred tax liabilities (Net) 109 108
Total Non-current liabilities 534 636
3 Current liabilities
(a) Financial liabilities
(i) Borrowings 464 440
(ii) Trade payables 1,410 1,309
(iii) Other financial liabilities 238 174
(b) Other current liabilities 173 169
(c) Provisions 107 93
(d) Current tax Liabilities (Net) 41 38
Total Current liabilities 2,434 2,224
Total Equity and Liabilities 8,702 7,732

30
Standalone Balance Sheet (1 of 2)
All figures are in INR crores, unless otherwise stated
Particulars As at 31/03/2018
(Audited) As at 31/03/2017
(Audited) A Assets 1 Non-current assets (a) Property, plant and equipment 971 929 (b) Capital work-in-progress 27 28 (c) Investment property 50 51 (d) Other Intangible assets 9 13 (e) Biological assets other than bearer plants 1 0 (f) Financial assets (i) Investments 2,720 2,319 (ii) Loans 10 9 (iii) Others 4 4 (g) Other non-current assets 60 75 (h) Non-current tax assets (net) 3 3 Total Non-current assets 3,854 3,431 2 Current assets (a) Inventories 705 599 (b) Financial assets (i) Investments 713 735 (ii) Trade receivables 321 333 (iii) Cash and cash equivalents 78 17 (iv) Bank Balances other than (iii) above 9 9 (v) Loans 1 3 (vi) Others 4 7 (c) Other current assets 127 87 Total current assets 1,959 1,792 Total Assets 5,813 5,223

31
Standalone Balance Sheet (2 of 2)
All figures are in INR crores, unless otherwise stated
Particulars As at 31/03/2018
(Audited) As at 31/03/2017
(Audited)
B Equity and Liabilities
1 Equity
(a) Equity share capital 176 176
(b) Other Equity 4,051 3,482
Total equity 4,227 3,658
2 Non-current liabilities
(a) Financial liabilities
(i) Borrowings 201 201
(ii) Other financial liabilities 4 4
(b) Provisions 50 48
(c) Deferred tax liabilities (Net) 96 98
Total Non-current liabilities 351 350
3 Current liabilities
(a) Financial liabilities
(i) Borrowings 85 83
(ii) Trade payables 961 915
(iii) Other financial liabilities 82 77
(b) Other current liabilities 38 77
(c) Provisions 64 54
(d) Current tax Liabilities (Net) 4 10
Total Current liabilities 1,234 1,215
Total Equity and Liabilities 5,813 5,223

32
Thank You


![Time : 3 hrs. Max. Marks: 180 Answers & Solutions for JEE ... · (D) 50.7 cm ij l u st ku sokyk vuuqkn] ey x.kkofÙk (fundamental harmonic) gS mÙkj (A, B, C) gy (2n–1) 50.7 e 4](https://static.documents.pub/doc/80x56/5ec40fd79579f031121ddfe3/time-3-hrs-max-marks-180-answers-solutions-for-jee-d-507-cm-ij.jpg)