Page 1
3/11/13
1
© 2013 FARIN & Associates Inc.
Liquidity Risk Basics Measuring and Managing Liquidity
David Koch Chief Operating Officer
FARIN & Associates, Inc. [email protected]
608-661-4217
1
© 2013 FARIN & Associates Inc.
Dad, What is Liquidity & Where Does it Come From?
2
Page 2
3/11/13
2
© 2013 FARIN & Associates Inc.
Our Session Goals… • Liquidity Defined
– Regulatory Actions and Expectations
• Measurement systems – What to measure – Defining Triggers vs. Limits
• Measuring Liquidity – Static vs. Dynamic Measures – Net Stable Funding Ratio (NSFR) – Liquidity Coverage Ratio (LCR) – Liquidity Gap (Sources & Uses)
• Role of the Contingency Funding Plan (CFP)
3
© 2013 FARIN & Associates Inc.
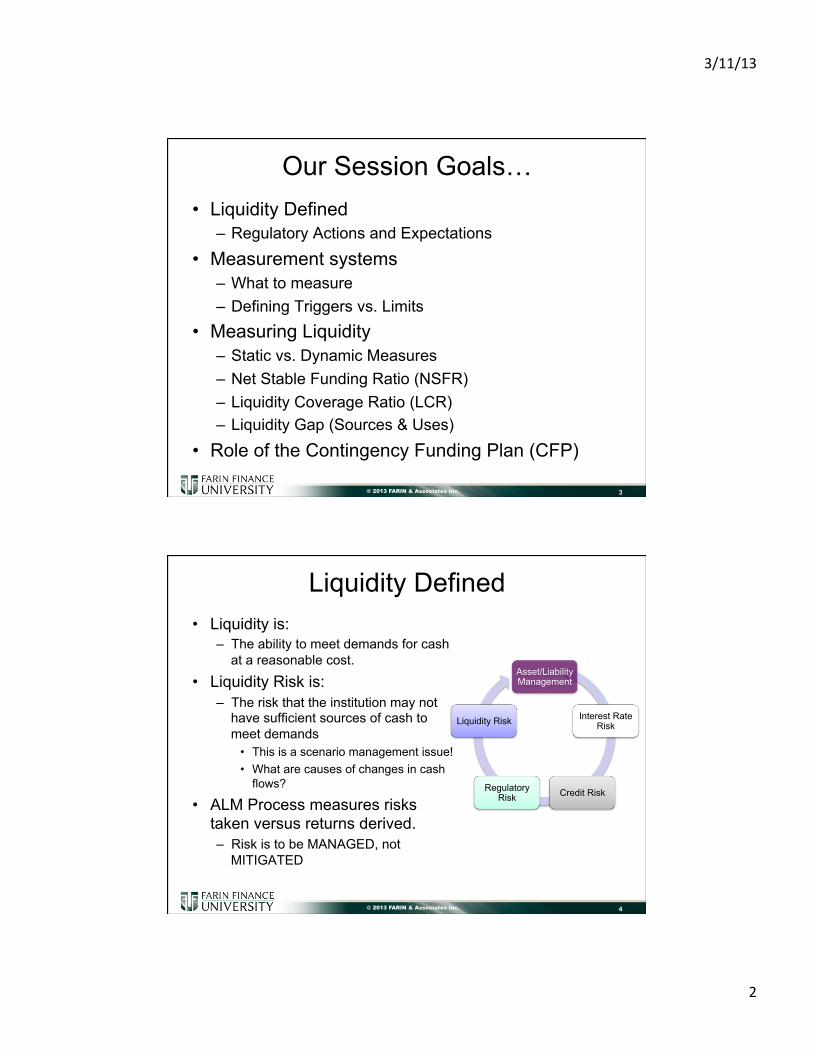
Liquidity Defined • Liquidity is:
– The ability to meet demands for cash at a reasonable cost.
• Liquidity Risk is: – The risk that the institution may not
have sufficient sources of cash to meet demands
• This is a scenario management issue! • What are causes of changes in cash
flows?
• ALM Process measures risks taken versus returns derived. – Risk is to be MANAGED, not
MITIGATED
4
Asset/Liability Management
Interest Rate Risk
Credit Risk Regulatory Risk
Liquidity Risk
Page 3
3/11/13
3
© 2013 FARIN & Associates Inc.
• Maintaining balance between available sources vs. needs while meeting capital planning goals for: – Earnings – Growth – Capital
• Expected & potential scenarios • Effective liquidity management helps
produce maximum levels of earnings – by investing excess funds – While maintaining sufficient flows
and sources of funds
Liquidity Risk Management
5
© 2013 FARIN & Associates Inc.
Recent Regulatory Initiatives
• Fall 2012 – Basel III Capital Proposal update proposed – Final Liquidity rules to follow capital standards – Functionally, 2010 Guidance is ‘in place’
• 2010 - “Interagency Policy Statement – Funding and Liquidity Risk Management” – Issued 4/5/10 – FRB, OCC, FDIC, OTS, NCUA
• 2009 - Basel Committee issues “International framework for liquidity risk measurement, standards, and monitoring” – AKA Basel III
6
Page 4
3/11/13
4
© 2013 FARIN & Associates Inc.
Impact of 2010 Liquidity Guidance Liquidity Requirements • More asset based liquidity (cash & securities)
– No guidance on how much is enough! – Why: It is the only form of liquidity you can absolutely count on
being there during a liquidity stress event
• Less reliance on wholesale funding for core growth – What is your core funding plan? – Where will you raise the funding needed to:
• Increase investments? • Reduce non-core funding?
7
© 2013 FARIN & Associates Inc.
Impact of 2010 Liquidity Guidance Liquidity Requirements • Cash Flow Based Liquidity Measurement
– How do we to integrate with IRR measurements • Stress Tests
– Like Rate Shocks in IRR? – What kinds of stress tests do we have to run? – How frequently do we run them?
8
Page 5
3/11/13
5
© 2013 FARIN & Associates Inc.
Historical Measures of Liquidity • Measurements Based on Balance Sheet Levels
– Static Measurements – Historically Based
• Examples: – Short Term Assets / Short Term Liabilities
• Measures coverage of possible loss of funding with assets – Volatile Funds Ratio – Borrowings / Total Assets
• Measures the level of non-market funding sources used to build the balances sheet
• Total Loans / Total Assets – Basic Surplus Ratio
• All Sources minus Uses within 30 days / Total Assets • Target Ratio = 3-5% minimum
9
© 2013 FARIN & Associates Inc.
Static Measure Evolution • Old approach
– Policy limits built around these measures
– Monitoring systems focused primarily on these measures.
• Primary weakness – Measure liquidity at a point
in time (old balance sheet) – Fail to consider business
plan or strategy – May be outdated measures
of liquidity – Fail to consider potential
stress events
• Current Trends Show Movement toward use as Triggers – Green light, yellow light,
red light – Example Loan/Deposit
Ratio • Green – L/D < 80%
(normal heartbeat) • Yellow – L/D 80-90%
(heart arrhythmia) • Red – L/D >90%
(heart attack)
– Define actions taken in response to triggers
10
Page 6
3/11/13
6
© 2013 FARIN & Associates Inc.
What are Triggers • Definition – Ratios or events being monitored to
assess trends in performance • Used as early warning indicators • Allows for historical liquidity or call report ratios in
policy without them becoming primary measures.
11
© 2013 FARIN & Associates Inc.
Common Trends Monitored • Earnings ratios • Credit agency
downgrades • Growth in volatile liabilities • Negative publicity • Declines in asset quality • Loan offers not renewing • Higher collateral
requirements • Loss or restricted
correspondent credit lines
• Inability to secure long-term debt
• Loss of brokered CD buyers
• Loss of rate sensitive buyers
• Increase in early withdrawals
• Decreasing transaction sizes
• Need to increase spread to competition on deposits
12
Page 7
3/11/13
7
© 2013 FARIN & Associates Inc.
Common Trigger Ratios • Non-core funding dependence – Call report • Loan/deposits ratio – Call report • Brokered deposits/assets – Call report • Borrowings/assets – Call Report • Non-current loan ratios – Call report • Return on assets – Call report
13
Note: Some of these ratios have multiple flavors – flavors and definitions in source indicated.
How do you think regulators will assess your liquidity levels? All Exams review Levels and Trends…
© 2013 FARIN & Associates Inc.
Performance Issues • ROE (Net Income/Avg.
Capital) • Net Income
• Charge-Offs & ALL • Lower Yields on AA • Cost of Funds • Deferred FDIC Insurance • Potential Loss of ODP • Increasing Efficiency Ratios
• / Average Capital
Balance Sheet Structure & Liquidity • Asset Quality Problems
• Non-Earning Assets • More Investments, Less
Loans • Decrease Non-Core
Reliance • Higher Capital
Requirements
14
Note all changes in balance sheet composition have potential impact on earnings, growth and capital formation
Page 8
3/11/13
8
© 2013 FARIN & Associates Inc.
Minimizing Cost of Liquidity • Goal of Liquidity Management:
– Ensure sufficient available funds at the lowest possible cost.
• Requirements of Liquidity Risk Management Program – Set objectives around funding costs, funding
concentrations, and other financial ratios – Establish Cash Flow Forecasting Model to measure
sources & uses in business plan – Run Scenarios on various funding source cost/benefit
15
© 2013 FARIN & Associates Inc.
Liquidity - Framework • Movement away from
– Static measures – Balance sheet liquidity
measures • Loans/Deposits • Loans/Assets • Investments/Assets • Non-Core Funding
Dependence • Borrowings/Assets • Volatile Funds Ratio
• Movement toward – Dynamic measures
• Current balance sheet • Business strategy or plan • Unexpected triggering
(stress) events – Fail well capitalized
status – Securitization markets
freeze up – Corporate CU or bankers
bank placed into receivership
• Requires contingency funding plans
16
Page 9
3/11/13
9
© 2013 FARIN & Associates Inc.
Liquidity Sources & Uses • Asset Sources
– Cash and Cash Equivalents – Securities or Loans
available for sale – Maturing Loans &Securities – Loan & Security repayments
• Liability Sources – New Deposit Growth – Borrowing Sources
• Asset Uses – Loan Originations – Investment Purchases – Fixed Asset Purchases – Draws on Lines of Credit
• Liability Uses – Deposit Outflows – Maturing Borrowings
17
Note: Majority of Sources and Uses are based on Cash Flows associated with assets & liabilities
© 2013 FARIN & Associates Inc.
Major Cash Flow Assumptions • Option Risk:
– The risk that the expected cash flows change due to contract options
• Call Options • Put Options • Prepayment Options • Bump Rate CD/Early Withdrawal Options
– Changes in Cash Flows Impact • Liquidity Levels • Income Levels • Potentially Credit Risk Levels
– Lower repayment of loans an indicator of credit problems?
18
Page 10
3/11/13
10
© 2013 FARIN & Associates Inc.
Major Cash Flow Assumptions • Prepayment Speeds on Loans & Securities
– Determining Prepayment Levels • Schedule Contractual Repayments • Observe Actual Repayments • Subtract Actual from Scheduled to arrive at prepayment $ • Convert to annual % prepayment by dividing by average
balance • Compare to National Prepayment speeds to develop factor
– Example: • National Bloomberg Prepayment Speeds = 12% CPR • Calculated Speeds = 8% CPR • Factor for ALM Model = Bloomberg speeds * 67%
– Use Bloomberg speeds for all changing rates
19
© 2013 FARIN & Associates Inc.
Control of Liquidity Sources Sources Uses
Estimated Loan Repayments Investment Purchase
Term Borrowing Sources Advance Repayments
Investment Maturities Loan Originations
Overnight Borrowings Public Fund CDs
National CDs Overnight Borrowings
Local Deposit Growth Local Deposits
Brokered CDs Brokered CDs
20
High
Low
Many liquidity reports group sources and uses in order of ALCO/Institution Control How do we control sources & uses?
Page 11
3/11/13
11
© 2013 FARIN & Associates Inc.
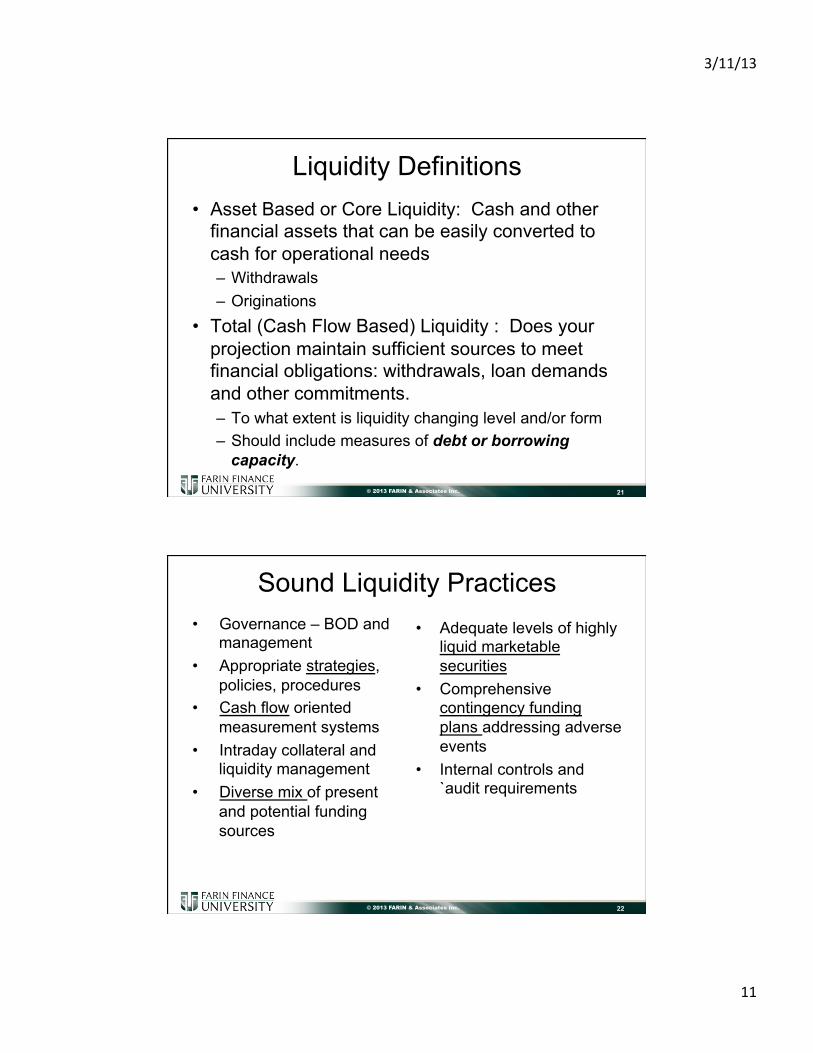
Liquidity Definitions • Asset Based or Core Liquidity: Cash and other
financial assets that can be easily converted to cash for operational needs – Withdrawals – Originations
• Total (Cash Flow Based) Liquidity : Does your projection maintain sufficient sources to meet financial obligations: withdrawals, loan demands and other commitments. – To what extent is liquidity changing level and/or form – Should include measures of debt or borrowing
capacity.
21
© 2013 FARIN & Associates Inc.
Sound Liquidity Practices • Governance – BOD and
management • Appropriate strategies,
policies, procedures • Cash flow oriented
measurement systems • Intraday collateral and
liquidity management • Diverse mix of present
and potential funding sources
• Adequate levels of highly liquid marketable securities
• Comprehensive contingency funding plans addressing adverse events
• Internal controls and `audit requirements
22
Page 12
3/11/13
12
© 2013 FARIN & Associates Inc.
MEASURING ASSET BASED LIQUIDITY
A Practical Approach to Liquidity
23
© 2013 FARIN & Associates Inc.
Asset Based Liquidity • Considered most reliable source of liquidity
– Many failed institutions had high levels of borrowings and low levels of asset based liquidity, therefore…more is better.
• But, How Much is Enough? – Answering the question “How long can you survive a
‘crisis’ without having access to wholesale funding?” • Requires:
– An understanding of the sources of asset based liquidity
– An estimation of the sensitivity of liabilities “at risk” – A method for calculation
24
Page 13
3/11/13
13
© 2013 FARIN & Associates Inc.
US Bank Data
25
MMDA = 21% in 2006 MMDA = 27.8% in 2011
Total NMD funding up from 36% in ‘06 to 46% in ‘11
© 2013 FARIN & Associates Inc.
US Credit Union Data
26
MMDA = 14% in 2006 MMDA = 19.5% in 2011
Total NMD funding up from 49.6% in ‘06 to 55% in ‘11
Page 14
3/11/13
14
© 2013 FARIN & Associates Inc.
Calculating Asset Based Liquidity • Sources of Asset Based Liquidity
– Cash & Cash Equivalents (FF, MMA, etc.) – Unpledged Securities (at market value or deeper discounts) – Scheduled Investment cash flows and maturities – Scheduled Loan cash flows and maturities
• Uses that you have to cover – Firm Loan commitments – Maturing Borrowings/Non-Core funding – Maturing CDs – Some amount of Non-maturity balances considered “at risk” – Potential draw down on lines of credit
27
© 2013 FARIN & Associates Inc.
Basic Surplus
28
• Long time measure of 30 day need
Page 15
3/11/13
15
© 2013 FARIN & Associates Inc.
Basic Surplus
29
• Add to the basic measure in step 2 – FHLB availability
© 2013 FARIN & Associates Inc.
Basic Surplus
30
• Add in other non-core funding sources in Step 3
Page 16
3/11/13
16
© 2013 FARIN & Associates Inc.
Basic Surplus Advantages • Easy measure of real
sources • Quantifies level of sources
by type • Provides a measure
consistent with policy control limits
Disadvantages • Usually used on historical
balance sheet • Ignores primary source of
most community FI liquidity – Loan Repayments!
• Ignores Off Balance Sheet Risks – Lines of Credit – Firm Commitments to
Originate
31
Compare Basic Surplus to New Liquidity Coverage Ratio
© 2013 FARIN & Associates Inc.
Asset Based Liquidity: LCR Ratio
• Basel Liquidity Coverage Ratio (LCR) – Test – Can you survive a 30 day stress event with assets only? – Numerator
• Cash & Due From • Highly Liquid Unencumbered Marketable Securities
– Denominator • Projected Deposit Runoff • Loss of all Non-Core Funding renewing in time horizon • Projected Increased Line Draw Downs • Less Cash Inflows from loans (& securities?) - Limited amounts
included
– Note that this is the first Liquidity rate to consider loan cash flows as a source!
32
Page 17
3/11/13
17
© 2013 FARIN & Associates Inc.
Deposit Definitions – Stable/Less Stable • Basel Says…Stable is
– Fully insured – Meaningful business
relationship – Applies to retail, small
business, large business – Penalties adequate on CDs
– just count 30 day maturities
– Penalties inadequate – count all the balances
• Less Stable – Deposits not meeting the
above definition
• Bank Regulators (Likely) – Fully Insured – Call Reports – Internal systems? – Not sure how bank
regulators will deal with penalty issue
33
© 2013 FARIN & Associates Inc.
Liquidity Coverage Ratio Numerator (Basel Approach)
34
Available liquid assets in 30 days
We would add stressed cash flows coming off loans and non-highly liquid securities.
Page 18
3/11/13
18
© 2013 FARIN & Associates Inc.
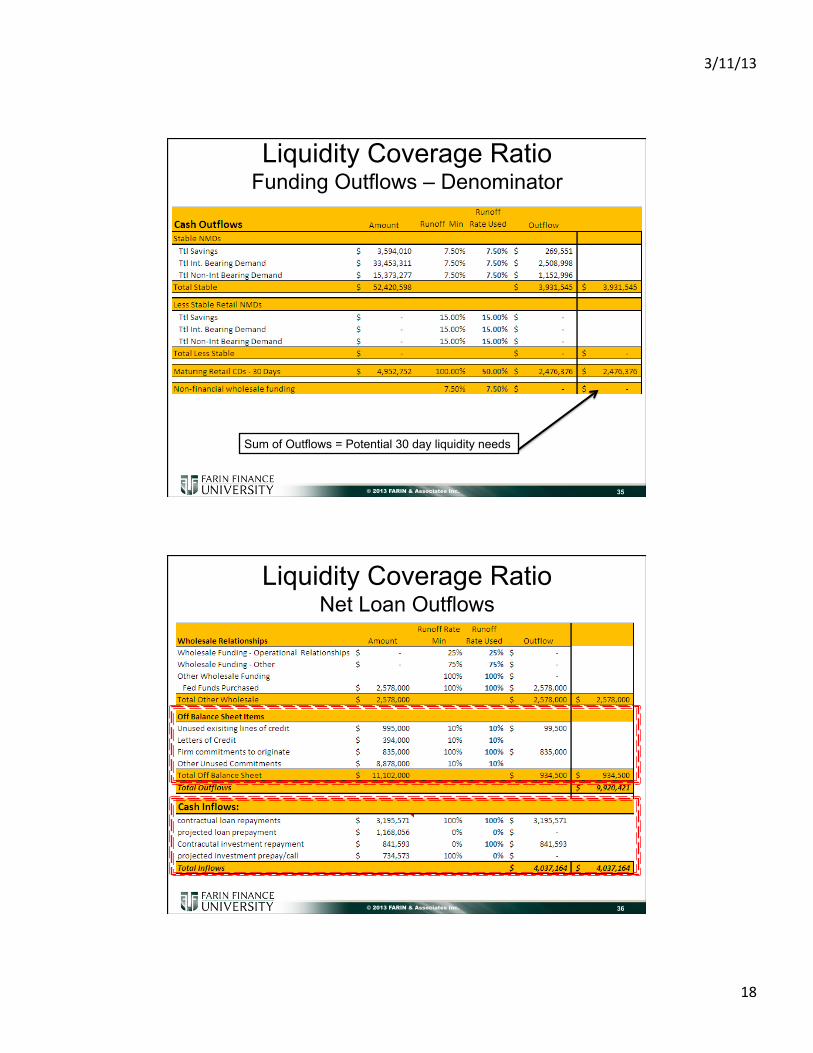
Liquidity Coverage Ratio Funding Outflows – Denominator
35
Sum of Outflows = Potential 30 day liquidity needs
© 2013 FARIN & Associates Inc.
Liquidity Coverage Ratio Net Loan Outflows
36
Page 19
3/11/13
19
© 2013 FARIN & Associates Inc.
Liquidity Coverage Ratio
37
Available Needs
FARIN Suggested LCR Changes: • Move Loan Cash Flows to the Numerator to track all Sources together • Establish consistency on deposit outflow assumptions with core deposit study
info used in IRR Calculations • Remove limit on amount of total loan flows counted (Move to numerator
eliminates negative denominator • Remove prepayment limitation assumptions on loan flows • Consider calculating how much runoff would be necessary to “fail” assuming
sources are solid.
© 2013 FARIN & Associates Inc.
Net Stable Funding Ratio • Ratio Introduced in
Original Basel III Proposal • Designed to look at 1 Year
Potential Funding Needs – Numerator – stable funding – Denominator – assets
needing stable funding – Guideline - >=100%
• Not planned to phase-in until 2019
• Why we choose not incorporate into Liquidity Calculations – Static ratio – Lots of clarification needed – Late phase-in – Unsure how US regulators
will interpret
• Adopting internal sources and uses provides more meaningful measurement
38
Regulatory Attempt at Sources & Uses – But Static!
Page 20
3/11/13
20
© 2013 FARIN & Associates Inc.
Net Stable Funding Ratio • Compares
Available Liquidity Sources
• To Known
maturities & loan renewal/payoffs
• Plus OBS exposures
39
© 2013 FARIN & Associates Inc.
Net Stable Funding Ratio Example shows institution short $34 million • Options for Correcting?
– Lower reliance on assets with higher funding needs • Fixed assets require $1 for every $1 • How fast can this be changed?
– Lower off balance sheet exposures • Firm commitments • Reduce outstanding lines of credit
– Change mix in deposit funding or terms or both • High concentration of brokered deposits < 1 Yr which are not
given full credit
– Rely on Wholesale Funding
40
Page 21
3/11/13
21
© 2013 FARIN & Associates Inc.
Net Stable Funding Ratio Advantages • Can be easily captured
from call report data – Requires minimal new
changes
• Eliminates Assumption Risk from Analysis
Disadvantages • Removes all unused
wholesale sourcing from calculation
• Not Effective in Examining the Cost/Benefit of various alternative strategies – Rewards long-term
borrowing position without regard to cost
41
© 2013 FARIN & Associates Inc.
LIQUIDITY GAP ANALYTICS Measuring Cash Flow Bases Liquidity
42
Page 22
3/11/13
22
© 2013 FARIN & Associates Inc.
Liquidity Gap Report • Pro forma cash flow analysis:
– Projected sources and uses of funds over various scenarios • Like rate movements or what-if plans
– Show exposures to variables and report to board and establish contingencies
• What sources change and why (optionality, credit risk, performance risk)
• What uses change and why (loan demand, potential deposit outflow, etc.)
– Assumptions should be reasonable and appropriate. – Institutions with reliance on securitization and sale for cash should
consider impact of conditions that may effect availability of funds.
43
© 2013 FARIN & Associates Inc.
Liquidity Gap Report • Liquidity Gap Report
– Summary of Cash Flow sources and uses impact on liquidity
• Use a forecast (Plan) for growth assumptions • Use starting cash flows to project inflows and outflows
– Allows for Assessment of Contingency Funding Plan Stress Tests to Determine Liquidity needs
• Impact of missing deposit growth by 10% • What if loan repayments accelerate or slow? • What happens to total ratio if access to key funding sources is
gone? – Brokered CDs – FHLB
44
Page 23
3/11/13
23
© 2013 FARIN & Associates Inc.
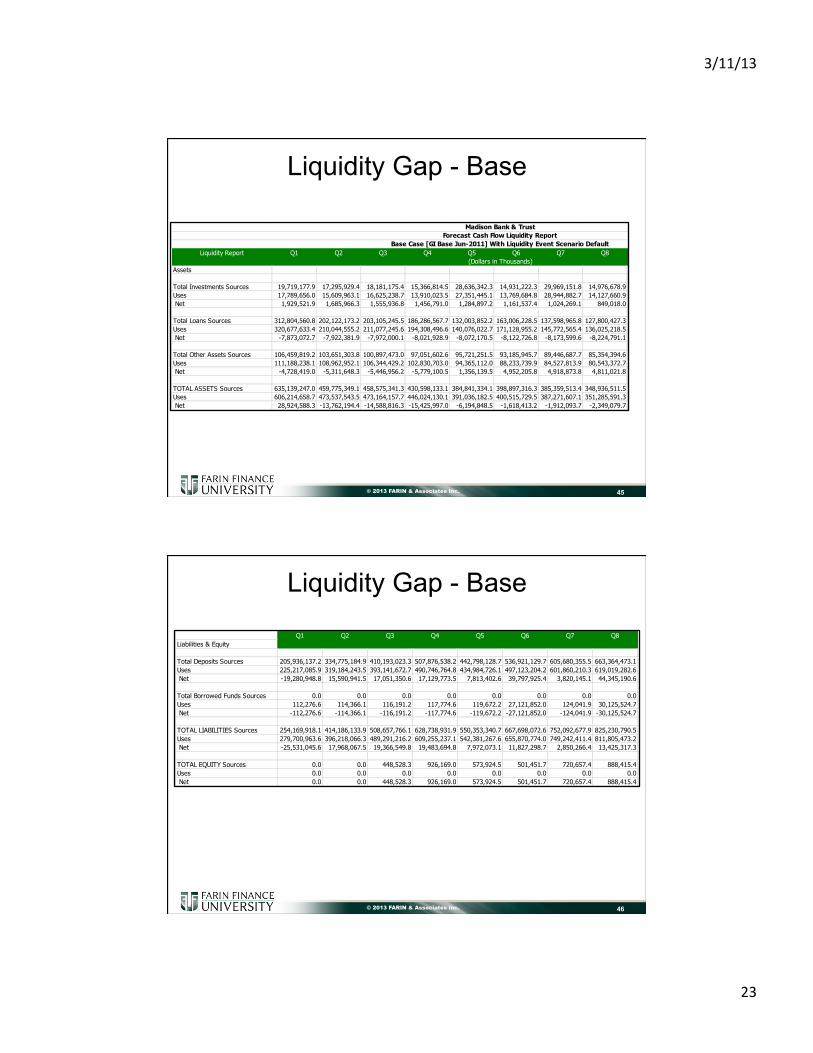
Liquidity Gap - Base
45
Liquidity Report Q1 Q2 Q3 Q4 Q5 Q6 Q7 Q8 Q9 Q10 Q11 Q12(Dollars in Thousands)
Assets
Total Investments Sources 19,719,177.9 17,295,929.4 18,181,175.4 15,366,814.5 28,636,342.3 14,931,222.3 29,969,151.8 14,976,678.9 14,400,989.8 14,118,043.9 29,123,373.8 14,149,790.8Uses 17,789,656.0 15,609,963.1 16,625,238.7 13,910,023.5 27,351,445.1 13,769,684.8 28,944,882.7 14,127,660.9 13,626,077.6 13,398,830.8 28,499,639.1 13,593,923.0 Net 1,929,521.9 1,685,966.3 1,555,936.8 1,456,791.0 1,284,897.2 1,161,537.4 1,024,269.1 849,018.0 774,912.3 719,213.1 623,734.6 555,867.8
Total Loans Sources 312,804,560.8 202,122,173.2 203,105,245.5 186,286,567.7 132,003,852.2 163,006,228.5 137,598,965.8 127,800,427.3 127,595,530.6 139,505,730.8 128,205,958.4 139,843,451.8Uses 320,677,633.4 210,044,555.2 211,077,245.6 194,308,496.6 140,076,022.7 171,128,955.2 145,772,565.4 136,025,218.5 135,871,833.9 147,833,868.7 136,586,255.8 148,276,235.2 Net -7,873,072.7 -7,922,381.9 -7,972,000.1 -8,021,928.9 -8,072,170.5 -8,122,726.8 -8,173,599.6 -8,224,791.1 -8,276,303.3 -8,328,138.0 -8,380,297.4 -8,432,783.4
Total Other Assets Sources 106,459,819.2 103,651,303.8 100,897,473.0 97,051,602.6 95,721,251.5 93,185,945.7 89,446,687.7 85,354,394.6 81,181,340.6 77,294,774.6 73,671,416.6 70,120,596.7Uses 111,188,238.1 108,962,952.1 106,344,429.2 102,830,703.0 94,365,112.0 88,233,739.9 84,527,813.9 80,543,372.7 76,739,253.6 73,115,466.4 69,621,239.3 66,211,072.4 Net -4,728,419.0 -5,311,648.3 -5,446,956.2 -5,779,100.5 1,356,139.5 4,952,205.8 4,918,873.8 4,811,021.8 4,442,087.0 4,179,308.1 4,050,177.3 3,909,524.4
TOTAL ASSETS Sources 635,139,247.0 459,775,349.1 458,575,341.3 430,598,133.1 384,841,334.1 398,897,316.3 385,359,513.4 348,936,511.5 342,720,231.8 351,054,697.9 353,694,661.3 342,490,856.8Uses 606,214,658.7 473,537,543.5 473,164,157.7 446,024,130.1 391,036,182.5 400,515,729.5 387,271,607.1 351,285,591.3 345,713,969.6 354,527,617.7 357,274,514.4 346,280,346.0 Net 28,924,588.3 -13,762,194.4 -14,588,816.3 -15,425,997.0 -6,194,848.5 -1,618,413.2 -1,912,093.7 -2,349,079.7 -2,993,737.8 -3,472,919.8 -3,579,853.0 -3,789,489.1
Madison Bank & TrustForecast Cash Flow Liquidity Report
Base Case [GI Base Jun-2011] With Liquidity Event Scenario Default
© 2013 FARIN & Associates Inc.
Liquidity Gap - Base
46
Q1 Q2 Q3 Q4 Q5 Q6 Q7 Q8 Q9 Q10 Q11 Q12Liabilities & Equity
Total Deposits Sources 205,936,137.2 334,775,184.9 410,193,023.3 507,876,538.2 442,798,128.7 536,921,129.7 605,680,355.5 663,364,473.1 625,303,955.3 629,529,719.0 628,461,715.3 673,706,966.6Uses 225,217,085.9 319,184,243.5 393,141,672.7 490,746,764.8 434,984,726.1 497,123,204.2 601,860,210.3 619,019,282.6 621,694,857.9 625,280,985.9 624,468,337.5 649,516,562.7 Net -19,280,948.8 15,590,941.5 17,051,350.6 17,129,773.5 7,813,402.6 39,797,925.4 3,820,145.1 44,345,190.6 3,609,097.5 4,248,733.1 3,993,377.8 24,190,403.9
Total Borrowed Funds Sources 0.0 0.0 0.0 0.0 0.0 0.0 0.0 0.0 0.0 0.0 0.0 0.0Uses 112,276.6 114,366.1 116,191.2 117,774.6 119,672.2 27,121,852.0 124,041.9 30,125,524.7 127,548.1 129,821.9 132,103.8 15,133,787.7 Net -112,276.6 -114,366.1 -116,191.2 -117,774.6 -119,672.2 -27,121,852.0 -124,041.9 -30,125,524.7 -127,548.1 -129,821.9 -132,103.8 -15,133,787.7
TOTAL LIABILITIES Sources 254,169,918.1 414,186,133.9 508,657,766.1 628,738,931.9 550,353,340.7 667,698,072.6 752,092,677.9 825,230,790.5 779,092,103.4 783,200,751.6 780,921,064.8 836,221,128.5Uses 279,700,963.6 396,218,066.3 489,291,216.2 609,255,237.1 542,381,267.6 655,870,774.0 749,242,411.4 811,805,473.2 776,199,591.7 779,502,379.8 777,545,414.5 827,640,932.2 Net -25,531,045.6 17,968,067.5 19,366,549.8 19,483,694.8 7,972,073.1 11,827,298.7 2,850,266.4 13,425,317.3 2,892,511.7 3,698,371.7 3,375,650.4 8,580,196.3
TOTAL EQUITY Sources 0.0 0.0 448,528.3 926,169.0 573,924.5 501,451.7 720,657.4 888,415.4 741,241.2 572,771.4 762,800.5 835,427.3Uses 0.0 0.0 0.0 0.0 0.0 0.0 0.0 0.0 0.0 0.0 0.0 0.0 Net 0.0 0.0 448,528.3 926,169.0 573,924.5 501,451.7 720,657.4 888,415.4 741,241.2 572,771.4 762,800.5 835,427.3
Page 24
3/11/13
24
© 2013 FARIN & Associates Inc.
Liquidity Report Q1 Q2 Q3 Q4 Q5 Q6 Q7 Q8 Q9 Q10 Q11 Q12(Dollars in Thousands)
Summary & Ratios
Total Net Sources 126,356,977.3 101,083,036.3 108,612,230.6 115,230,713.7 90,756,316.2 91,890,478.6 99,020,542.8 87,856,258.0 78,891,714.3 84,182,432.4 90,402,119.8 91,173,547.9Total Net Uses 140,151,343.7 105,850,881.7 112,276,782.0 119,079,094.9 92,271,498.8 104,046,013.5 97,081,653.8 95,957,297.4 77,185,207.5 82,634,279.2 88,780,738.5 94,552,958.9 Net Sources/Uses -13,794,366.4 -4,767,845.4 -3,664,551.4 -3,848,381.2 -1,515,182.6 -12,155,534.9 1,938,889.0 -8,101,039.4 1,706,506.8 1,548,153.3 1,621,381.4 -3,379,411.0
Cumulative Total Sources 126,356,977.3 227,440,013.6 336,052,244.2 451,282,957.9 542,039,274.1 633,929,752.7 732,950,295.5 820,806,553.4 899,698,267.7 983,880,700.1 1,074,282,820.0 1,165,456,367.9Cumulative Total Uses 140,151,343.7 246,002,225.3 358,279,007.4 477,358,102.3 569,629,601.1 673,675,614.6 770,757,268.3 866,714,565.7 943,899,773.2 1,026,534,052.4 1,115,314,790.8 1,209,867,749.7 Cumulative Sources/Uses -13,794,366.4 -18,562,211.7 -22,226,763.2 -26,075,144.4 -27,590,326.9 -39,745,861.8 -37,806,972.9 -45,908,012.3 -44,201,505.5 -42,653,352.2 -41,031,970.9 -44,411,381.9
Sources/Uses Ratio 90.158% 95.496% 96.736% 96.768% 98.358% 88.317% 101.997% 91.558% 102.211% 101.874% 101.826% 96.426%Cumulative Sources/Uses Ratio 90.158% 92.454% 93.796% 94.538% 95.156% 94.100% 95.095% 94.703% 95.317% 95.845% 96.321% 96.329%
Liquidity CF Gap/Assets -4.708% -1.624% -1.245% -1.304% -0.512% -4.097% 0.652% -2.716% 0.570% 0.516% 0.539% -1.119%Cumulative Liquidity CF Gap/Assets -4.708% -6.321% -7.550% -8.835% -9.325% -13.398% -12.710% -15.389% -14.773% -14.213% -13.631% -14.707%
AdjustmentsTotal Remaining Borrowing Capacity 39,674,367.2 39,712,489.2 39,751,219.6 39,790,477.8 39,830,368.5 48,870,985.9 48,912,333.2 58,954,174.7 58,996,690.7 59,039,964.7 59,083,999.3 64,128,595.2
Hiqh Quality Liquid Assets 46,152,877.8 45,915,999.3 45,616,702.4 45,378,287.9 45,161,314.3 44,957,297.1 44,717,590.7 44,498,283.8 44,320,675.3 44,154,047.5 43,929,856.2 43,662,097.4
Total Sources Adjustments 85,827,245.0 85,628,488.5 85,367,921.9 85,168,765.7 84,991,682.9 93,828,283.0 93,629,923.9 103,452,458.5 103,317,366.1 103,194,012.2 103,013,855.5 107,790,692.6
Total Uses Adjustments 0.0 0.0 0.0 0.0 0.0 0.0 0.0 0.0 0.0 0.0 0.0 0.0
Net Adjustments 85,827,245.0 85,628,488.5 85,367,921.9 85,168,765.7 84,991,682.9 93,828,283.0 93,629,923.9 103,452,458.5 103,317,366.1 103,194,012.2 103,013,855.5 107,790,692.6
Cumulative Total Sources w/Adjustments212,184,222.3 313,068,502.1 421,420,166.1 536,451,723.6 627,030,957.0 727,758,035.7 826,580,219.4 924,259,011.9 1,003,015,633.8 1,087,074,712.3 1,177,296,675.5 1,273,247,060.5Cumulative Total Uses w/Adjustments140,151,343.7 246,002,225.3 358,279,007.4 477,358,102.3 569,629,601.1 673,675,614.6 770,757,268.3 866,714,565.7 943,899,773.2 1,026,534,052.4 1,115,314,790.8 1,209,867,749.7 Cumulative Sources/Uses w/Adjustments72,032,878.6 67,066,276.8 63,141,158.8 59,093,621.3 57,401,355.9 54,082,421.2 55,822,951.1 57,544,446.2 59,115,860.6 60,540,659.9 61,981,884.6 63,379,310.8
Sources/Uses Ratio 151.396% 127.262% 117.623% 112.379% 110.077% 108.028% 107.243% 106.639% 106.263% 105.898% 105.557% 105.239%Cumulative Sources/Uses Ratio 151.396% 136.022% 127.167% 121.389% 117.792% 115.124% 113.247% 111.851% 110.806% 109.976% 109.290% 108.707%
Liquidity Gap/Assets 24.587% 27.534% 27.754% 27.555% 28.213% 27.530% 32.127% 31.962% 35.101% 34.902% 34.759% 34.576%Cumulative Liquidity Gap/Assets 24.587% 22.837% 21.448% 20.023% 19.400% 18.230% 18.766% 19.289% 19.758% 20.173% 20.590% 20.988%
Liquidity Coverage Ratio 3245.072% 3233.304% 3341.215% 3406.614% 3301.501% 3317.580% 3333.927% 3120.195% 3080.778% 3147.427% 3051.739% 3194.344% 3 Month Average 3273.197% 3327.044% 3349.777% 3341.898% 3317.670% 3257.234% 3178.300% 3116.133% 3093.315% 3131.170%
Liquidity Gap - Base
47
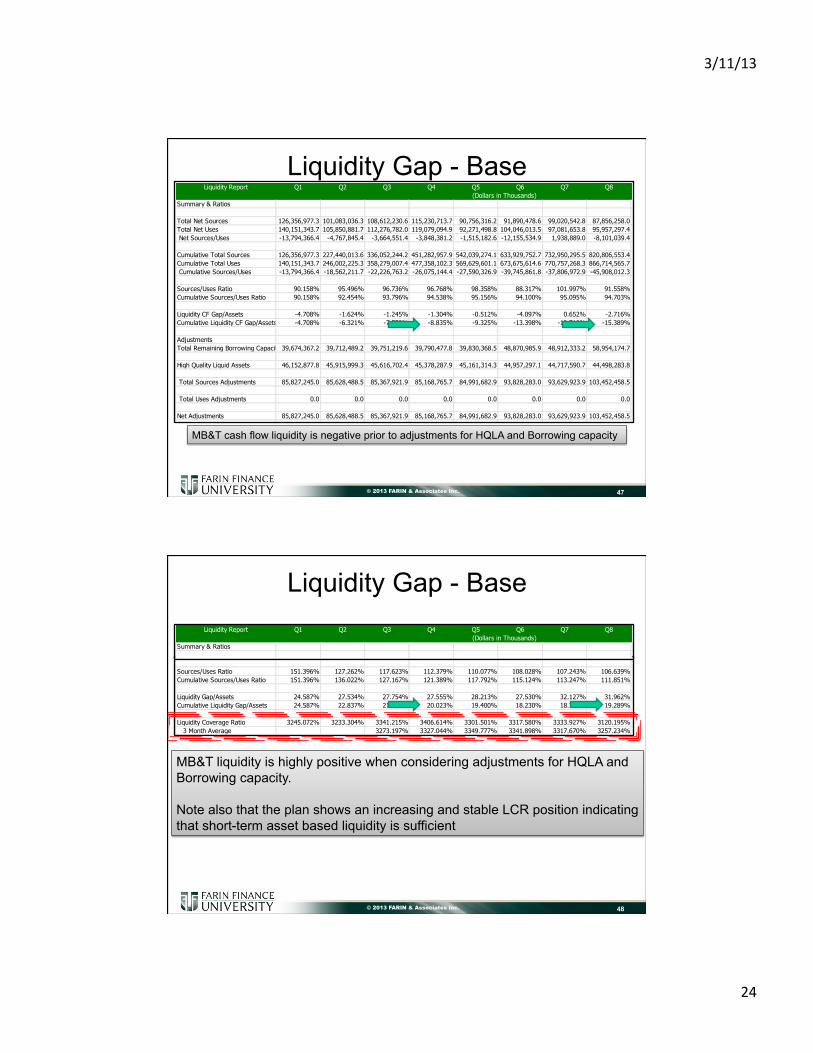
MB&T cash flow liquidity is negative prior to adjustments for HQLA and Borrowing capacity
© 2013 FARIN & Associates Inc.
Liquidity Report Q1 Q2 Q3 Q4 Q5 Q6 Q7 Q8 Q9 Q10 Q11 Q12(Dollars in Thousands)
Summary & Ratios
Total Net Sources 126,356,977.3 101,083,036.3 108,612,230.6 115,230,713.7 90,756,316.2 91,890,478.6 99,020,542.8 87,856,258.0 78,891,714.3 84,182,432.4 90,402,119.8 91,173,547.9Total Net Uses 140,151,343.7 105,850,881.7 112,276,782.0 119,079,094.9 92,271,498.8 104,046,013.5 97,081,653.8 95,957,297.4 77,185,207.5 82,634,279.2 88,780,738.5 94,552,958.9 Net Sources/Uses -13,794,366.4 -4,767,845.4 -3,664,551.4 -3,848,381.2 -1,515,182.6 -12,155,534.9 1,938,889.0 -8,101,039.4 1,706,506.8 1,548,153.3 1,621,381.4 -3,379,411.0
Cumulative Total Sources 126,356,977.3 227,440,013.6 336,052,244.2 451,282,957.9 542,039,274.1 633,929,752.7 732,950,295.5 820,806,553.4 899,698,267.7 983,880,700.1 1,074,282,820.0 1,165,456,367.9Cumulative Total Uses 140,151,343.7 246,002,225.3 358,279,007.4 477,358,102.3 569,629,601.1 673,675,614.6 770,757,268.3 866,714,565.7 943,899,773.2 1,026,534,052.4 1,115,314,790.8 1,209,867,749.7 Cumulative Sources/Uses -13,794,366.4 -18,562,211.7 -22,226,763.2 -26,075,144.4 -27,590,326.9 -39,745,861.8 -37,806,972.9 -45,908,012.3 -44,201,505.5 -42,653,352.2 -41,031,970.9 -44,411,381.9
Sources/Uses Ratio 90.158% 95.496% 96.736% 96.768% 98.358% 88.317% 101.997% 91.558% 102.211% 101.874% 101.826% 96.426%Cumulative Sources/Uses Ratio 90.158% 92.454% 93.796% 94.538% 95.156% 94.100% 95.095% 94.703% 95.317% 95.845% 96.321% 96.329%
Liquidity CF Gap/Assets -4.708% -1.624% -1.245% -1.304% -0.512% -4.097% 0.652% -2.716% 0.570% 0.516% 0.539% -1.119%Cumulative Liquidity CF Gap/Assets -4.708% -6.321% -7.550% -8.835% -9.325% -13.398% -12.710% -15.389% -14.773% -14.213% -13.631% -14.707%
AdjustmentsTotal Remaining Borrowing Capacity 39,674,367.2 39,712,489.2 39,751,219.6 39,790,477.8 39,830,368.5 48,870,985.9 48,912,333.2 58,954,174.7 58,996,690.7 59,039,964.7 59,083,999.3 64,128,595.2
Hiqh Quality Liquid Assets 46,152,877.8 45,915,999.3 45,616,702.4 45,378,287.9 45,161,314.3 44,957,297.1 44,717,590.7 44,498,283.8 44,320,675.3 44,154,047.5 43,929,856.2 43,662,097.4
Total Sources Adjustments 85,827,245.0 85,628,488.5 85,367,921.9 85,168,765.7 84,991,682.9 93,828,283.0 93,629,923.9 103,452,458.5 103,317,366.1 103,194,012.2 103,013,855.5 107,790,692.6
Total Uses Adjustments 0.0 0.0 0.0 0.0 0.0 0.0 0.0 0.0 0.0 0.0 0.0 0.0
Net Adjustments 85,827,245.0 85,628,488.5 85,367,921.9 85,168,765.7 84,991,682.9 93,828,283.0 93,629,923.9 103,452,458.5 103,317,366.1 103,194,012.2 103,013,855.5 107,790,692.6
Cumulative Total Sources w/Adjustments212,184,222.3 313,068,502.1 421,420,166.1 536,451,723.6 627,030,957.0 727,758,035.7 826,580,219.4 924,259,011.9 1,003,015,633.8 1,087,074,712.3 1,177,296,675.5 1,273,247,060.5Cumulative Total Uses w/Adjustments140,151,343.7 246,002,225.3 358,279,007.4 477,358,102.3 569,629,601.1 673,675,614.6 770,757,268.3 866,714,565.7 943,899,773.2 1,026,534,052.4 1,115,314,790.8 1,209,867,749.7 Cumulative Sources/Uses w/Adjustments72,032,878.6 67,066,276.8 63,141,158.8 59,093,621.3 57,401,355.9 54,082,421.2 55,822,951.1 57,544,446.2 59,115,860.6 60,540,659.9 61,981,884.6 63,379,310.8
Sources/Uses Ratio 151.396% 127.262% 117.623% 112.379% 110.077% 108.028% 107.243% 106.639% 106.263% 105.898% 105.557% 105.239%Cumulative Sources/Uses Ratio 151.396% 136.022% 127.167% 121.389% 117.792% 115.124% 113.247% 111.851% 110.806% 109.976% 109.290% 108.707%
Liquidity Gap/Assets 24.587% 27.534% 27.754% 27.555% 28.213% 27.530% 32.127% 31.962% 35.101% 34.902% 34.759% 34.576%Cumulative Liquidity Gap/Assets 24.587% 22.837% 21.448% 20.023% 19.400% 18.230% 18.766% 19.289% 19.758% 20.173% 20.590% 20.988%
Liquidity Coverage Ratio 3245.072% 3233.304% 3341.215% 3406.614% 3301.501% 3317.580% 3333.927% 3120.195% 3080.778% 3147.427% 3051.739% 3194.344% 3 Month Average 3273.197% 3327.044% 3349.777% 3341.898% 3317.670% 3257.234% 3178.300% 3116.133% 3093.315% 3131.170%
Liquidity Gap - Base
48
MB&T liquidity is highly positive when considering adjustments for HQLA and Borrowing capacity. Note also that the plan shows an increasing and stable LCR position indicating that short-term asset based liquidity is sufficient
Page 25
3/11/13
25
© 2013 FARIN & Associates Inc.
SETTING LIMITS & TRIGGERS Liquidity Policy Limits
49
© 2013 FARIN & Associates Inc.
Liquidity Policy Limits • Limits should indicate base plan levels of risk • As stress tests are added, a second level of limits
are required to – Reflect levels of sources required to survive liquidity
stress events – Outline likely actions
• In addition to limits, trigger ratio ranges set to act as early warning signals to plan goals
50
Page 26
3/11/13
26
© 2013 FARIN & Associates Inc.
Setting LCR Limits
51
© 2013 FARIN & Associates Inc.
Trigger Ratios • Trigger Ratios define key variables “early
warnings” of strategic goal issues – Examples
• Loan/Deposit Ratios • Non-Core Funding/Assets • Basic Surplus Ratio(s) • Brokered CD/Total Deposit Ratio • Borrowings/assets • Nonperforming Loans/Total Loans • Charge-offs/Recoveries
• ALCO reporting must include these key monitoring items in all scenario testing
52
Page 27
3/11/13
27
© 2013 FARIN & Associates Inc.
Liquidity Gap/Asset Limits
53
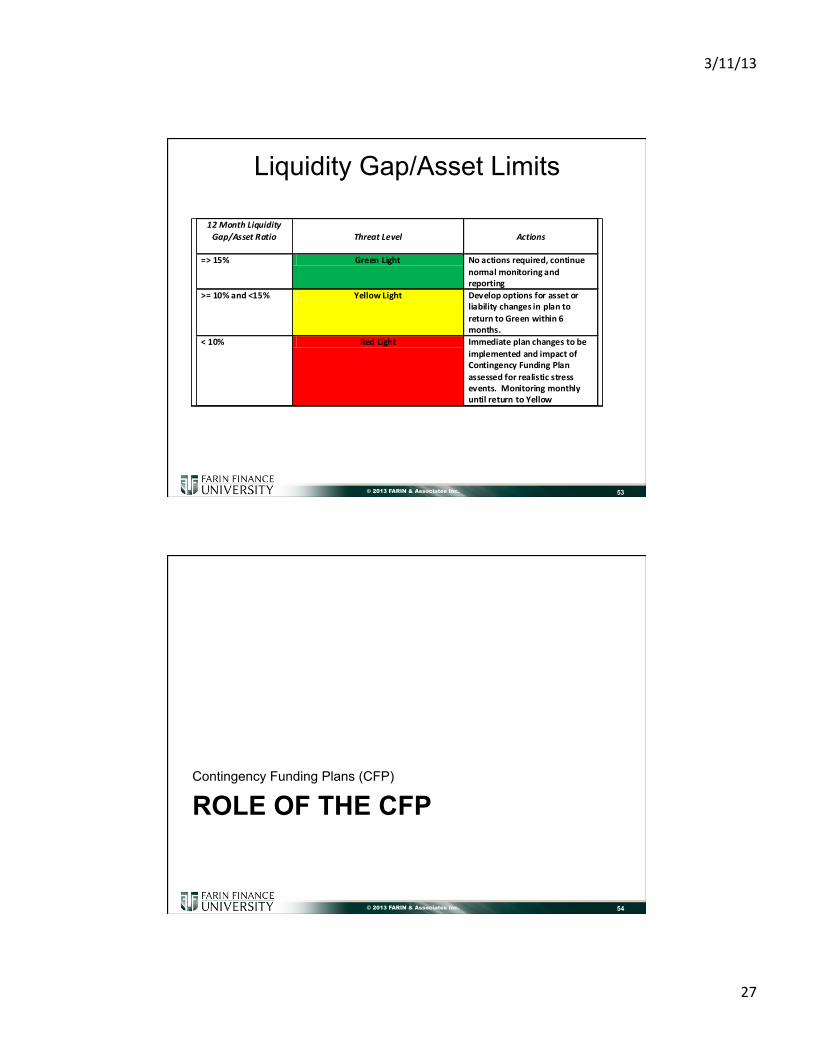
12 Month Liquidity Gap/Asset Ratio
Threat Level Actions
=> 15% Green Light No actions required, continue normal monitoring and reporting
>= 10% and <15% Yellow Light Develop options for asset or liability changes in plan to return to Green within 6 months.
< 10% Red Light Immediate plan changes to be implemented and impact of Contingency Funding Plan assessed for realistic stress events. Monitoring monthly until return to Yellow
© 2013 FARIN & Associates Inc.
ROLE OF THE CFP Contingency Funding Plans (CFP)
54
Page 28
3/11/13
28
© 2013 FARIN & Associates Inc.
Genesis of the CFP • Intended to set boundaries on various funding activities • Acting like a liability concentration policy • Outlines primary and secondary funding sources • Identifies when institution will use various sources • Assigns responsibilities for managing events • Defines “Crisis Events” and Stress Tests
– Short Term • 3 Month projection of cash flows
– Normal plan – 10% and 20% deposit runoff
– Long Term • 12 Month projections • Assumes cut off from many wholesale sources • How much would you have to raise to survive?
55
© 2013 FARIN & Associates Inc.
Genesis of CFP • Issues in initial approach
– Liquidity events are defined “in a vacuum” – No consideration for other impacts of the “stress test”
• Income • Capital
– Short term (< 12 months) • Current ALCO guidance looks at minimum of 24 months for earnings
at risk – Applies “big bank” approaches to community institutions
• Result: Institutions carry more assets to cover loss of wholesale funding that may or may not occur.
56
Page 29
3/11/13
29
© 2013 FARIN & Associates Inc.
Stress Tests • Midwest Ag Lender Scenario:
– Primary Clients:: farmers in grain markets and • corn has been at all-time highs. • Concern over future prices
– Risks to Cash Flow: • Grain price fluctuations, • Crop damage due to weather, • Spikes in production costs
– Potential Impacts: • Credit and Liquidity Risks if prices drop • Stress Tests:
– Loans for price changes – Balance sheet for cash flow and earnings implications
57
© 2013 FARIN & Associates Inc.
Stress Tests • Typical Community Bank Lender Scenario:
– Large balances in liquid assets • Excess cash invested into agency bonds and MBS in 2010-11 • Bonds purchased at 3-6% premiums
– Economy Forecasted to Recover early 2013 • Projecting increase in loan balances funded by excess cash and
investment repayment • Deposit costs rising and potential loss of deposits to higher rate
products (NOT STATIC) or disintermediation – Stress test:
• Deposits leave at faster rate or greater % move to higher rate sector • Bonds sold at discount (market value) and premium write-down to
fund loan commitments and fund withdrawals • Increased use of Wholesale funding to meet needs
58
Page 30
3/11/13
30
© 2013 FARIN & Associates Inc.
Scenario Management • Scenarios effect the entire institution not just one
risk area • Key Challenge: translating scenarios into
enterprise-wide measures – Balance sheet and income statement – Cash flow impact – Key ratio analysis – Individual risk limits
• Secondary Challenge: – How much insurance do you buy? – Based on likelihood of the scenario?
59
© 2013 FARIN & Associates Inc.
Sample Economic Scenarios • Base Case Key Forecast Assumptions (60%)
– Fiscal Policy: Automatic Spending Cuts and the Bush Tax Cuts.
• do not expect the automatic spending cuts now scheduled to begin in January 2013 to take effect
• assume new Congress and president will produce a package of spending cuts and tax increases including cuts in Medicare, Medicaid, and Social Security, and increases in income tax. Begin in January 2014; assume Bush tax cuts extended for 2013.
– Oil Prices Resilient. • Expect refiners’ acquisition cost for crude oil to average $113/
barrel in 2012. • Corresponds to average price for Brent oil $120/barrel in 2012.
60
Page 31
3/11/13
31
© 2013 FARIN & Associates Inc.
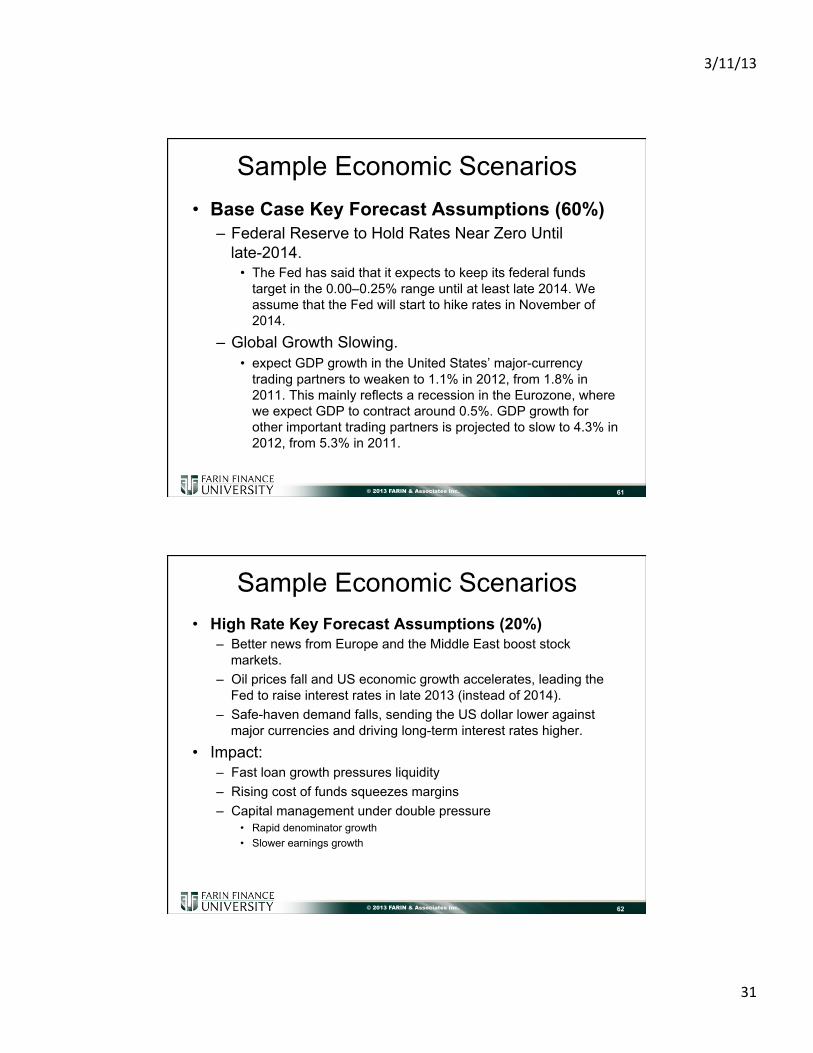
Sample Economic Scenarios • Base Case Key Forecast Assumptions (60%)
– Federal Reserve to Hold Rates Near Zero Until late-2014.
• The Fed has said that it expects to keep its federal funds target in the 0.00–0.25% range until at least late 2014. We assume that the Fed will start to hike rates in November of 2014.
– Global Growth Slowing. • expect GDP growth in the United States’ major-currency
trading partners to weaken to 1.1% in 2012, from 1.8% in 2011. This mainly reflects a recession in the Eurozone, where we expect GDP to contract around 0.5%. GDP growth for other important trading partners is projected to slow to 4.3% in 2012, from 5.3% in 2011.
61
© 2013 FARIN & Associates Inc.
Sample Economic Scenarios • High Rate Key Forecast Assumptions (20%)
– Better news from Europe and the Middle East boost stock markets.
– Oil prices fall and US economic growth accelerates, leading the Fed to raise interest rates in late 2013 (instead of 2014).
– Safe-haven demand falls, sending the US dollar lower against major currencies and driving long-term interest rates higher.
• Impact: – Fast loan growth pressures liquidity – Rising cost of funds squeezes margins – Capital management under double pressure
• Rapid denominator growth • Slower earnings growth
62
Page 32
3/11/13
32
© 2013 FARIN & Associates Inc.
Sample Economic Scenarios • Low Rate Key Forecast Assumptions (20%)
– Oil and Europe combine to tip the economy back into recession. – Spanish borrowing costs rise to unsustainable levels leading to a
default. – Credit markets freeze in Europe and lead to much tighter credit
conditions worldwide. – Panic settles upon financial markets as stock prices plummet and
investors race to the safety of US Treasuries. – Fading economic growth and disinflation push the Fed to keep
interest rates near zero through 2015 & expand balance sheet further.
– Long-term interest rates stay low for longer.
• Impact: – Slow loan growth, yield compression, credit risks rise, more
deposit growth (flight to safety)
63
© 2013 FARIN & Associates Inc.
LIQUIDITY – THE HOLY GRAIL Evaluating Your Liquidity Risk Management Process
64
Page 33
3/11/13
33
© 2013 FARIN & Associates Inc.
Step 1 • Describe key balance
sheet (static liquidity) ratios that management uses to measure and manage liquidity risk. Are they used as policy guidelines (limits) or as triggers? Discuss specific strengths and weaknesses of the ratios.
• Ratios Like – Loans/Deposits – Loans/Assets – Investments/Assets – Non-Core Funding
Dependence – Borrowings/Assets – Volatile Funds Ratio
65
Trigger Ratios: Measurement used to alert of problems Policy Ratios: Measures that define Risk and Action
© 2013 FARIN & Associates Inc.
Step 2 • Determine if you measure
liquidity risk using expected cash inflows and outflows (liquidity gap derived from sources and uses) – What time intervals? – How are the sources/uses
determined? Consistent with other ALCO measures?
– List key assumptions made in your analysis.
• Pay attention to: – Alternative ways of
evaluating sources. – Alternative ways of
evaluating uses – Use of these reports in
evaluating: • Base strategy • Stress events
66
Page 34
3/11/13
34
© 2013 FARIN & Associates Inc.
Step 3 • Outline your institution’s
approach to using non-core sources of funding (i.e., brokered CDs, internet CDs, public funds, repurchase agreements, FHLB borrowings, etc.).
• Review liquidity and ALM policy – Is this activity addressed within
the institution's policy(s)? – Are limits in place at the
individual source level? – Are there overall limits on the
use of non-core funding?
• With the changing regulatory view of wholesale and non-core funding you must establish your view of the use of such sources in your capital planning process.
67
© 2013 FARIN & Associates Inc.
Step 4 • Identify liquidity sources at
your institution and categorize them into timeframes of availability such as immediate (availability is daily), intermediate (availability in 1-2 weeks), other (availability in 2-4 weeks).
• Pay attention to: – How diversified are your
sources. – Have you tested their
availability and how quickly they cam be brought on line.
– Then categorize based on source and availability
– Consider both asset based sources and liability based sources.
68
Page 35
3/11/13
35
© 2013 FARIN & Associates Inc.
Step 5 • Indicate the kinds of
liquidity stress events identified by management as potential sources of liquidity stress. Does your policy incorporate stress tests in your analysis? Attach an example of any stress tests that have been performed. Discuss briefly what the stress tests indicate.
• Pay attention to: – My listing of stress events.
Has your institution identified yours? Is falling below PCA capital minimums one of them?
– Have stress tests been run on these events?
– What do you conclude from the tests
69
© 2013 FARIN & Associates Inc.
Step 6 • Briefly, describe the
institution’s contingency funding plan if one exists.
• Pay attention to: – Whether the CFP is broad
and general – Does the CFP deal
specifically with the stress events identified in Step 5
– Are the plans spelled out in detail including identifying those that are responsible for execution
70