35
DADDS/DAMS-NT Message Statistics Presented by Microcom Design, Inc. May 2011

DADDS/DAMS-NT
Message Statistics
Presented by Microcom Design, Inc.
May 2011

Microcom Design, Inc. 2
DADDS Message Data Tab

Microcom Design, Inc. 3
Message Stats – Who, What, Where & Why
� Why Are They Important� Message Data versus Message Quality� Proactive Monitoring versus Reactive Troubleshootin g
� Where Do They Come From� NOAA/NESDIS� Via the DADDS Website� Beginning with the DAMS-NT System
� What Are They� Time, Frequency, Amplitude, Phase� What do they mean?� What do they tell us?
� Who Needs to Know About Them and Can Access Them� DCS Users, Managers, etc.� Field Techs, Service Depot Techs, etc.

Message Statistics
Why Are They Important?

Microcom Design, Inc. 5
Message Data versus Message Quality
� Isn’t getting the Message Data is what is most important?� Certainly!� The environmental data being collected is often cri tical
and in some cases life-saving (e.g. flood, tsunami, etc.).
� However, these Data Collection Platforms (DCPs) are satellite based because …� The are in remote locations. � Often difficult to get to (some require a helicopte r trip).� Have no other communication option.
� For reliable message data reception it is important to know the quality of the “received” message.

Microcom Design, Inc. 6
Proactive versus Reactive
� Users should proactively monitor message quality.� Failure to do so could result in loss of data when it is needed it
most.� Data lost from a garbled or missed message typicall y cannot
be recovered in real time.
� Reactive troubleshooting is possible on a garbled m essage.� Message statistics are available and can usually ex plain why
message was received with errors.
� A “missed” message is not received at all.� No Data ⇒⇒⇒⇒ No site troubleshooting information is received,
e.g. battery voltage or transmitter power readings.� No Message Quality or Statistics are available.� Cannot troubleshoot a missed message.
� Proactive Monitoring of the Message Statistics is k ey to ensuring reliable message reception.

Message Statistics
Where Do The Come From?

Microcom Design, Inc. 8
GOES DCS Overview
� Geostationary Satellites: GOES East @ 75°W and GOE S West @ 135°W� WCDA – Primary Receive Site NSOF – Alternate Receive Site� DCPs Uplink in UHF Band (~402 MHz) & DCS Downlink in L Band (~1694 MHz)� Primary Pilot: Uplink = 401.850 MHz Downlink = 1694.450 MHz� Backup Pilot: Uplink = 401.700 MHz Downlink = 1694.300 MHz
GOES SPACECRAFTWEST (135° W)
GOESSPACECRAFTEAST (75° W)
NOAA/NESDIS WCDA
16 METERANTENNAS
Primary Pilot
REMOTE DCPs
Backup Pilot (WBU)GoddardNOAA/NESDIS NSOF
9 METER ANTENNAS

Microcom Design, Inc. 9
GOES DCS – A Shared Resource
� FDMA: Frequency Division Multiple Access� Each DCP is assigned a specific number channel.� Channel are shared by multiple DCPs and/or Users.
� TDMA: Time Division Multiple Access� On a given channel, each DCP is assigned a specific time window.� Time windows are typically 5-15 seconds.
� Power Sharing� All active DCP signals are received at the satellite, translated in
frequency, and retransmitted as a composite signal to the DirectReadout Ground Stations (DRGS).
� The composite signal’s downlink power is held constant, i.e. each active DCP shares a portion of the total power.
� GOES DCS Pilots� Provide an Amplitude and Frequency reference for all DCPs.
� Critical to system operation. No Pilot ⇒ No DCS.� Pilots have special frequency (channel) and share downlink power.

Microcom Design, Inc. 10
GOES DCS Rail at WCDA

Microcom Design, Inc. 11
DAMS-NT System – DigiTrak Demodulator
� Every GOES DCS Message is received by a DAMS-NT DigiTrak DSP based demodulator at WDCA and NSOF (and the USGS EDDN at EROS).
� As messages are received, the message data and message statistics are collected in real-time by the DAMS-NT Server application

Microcom Design, Inc. 12
DAMS-NT DigiTrak Message Statistics
Message Statistics
What Are They?

Microcom Design, Inc. 14
DADDS/DAMS-NT Message Statistics
Microcom Design, Inc. 15
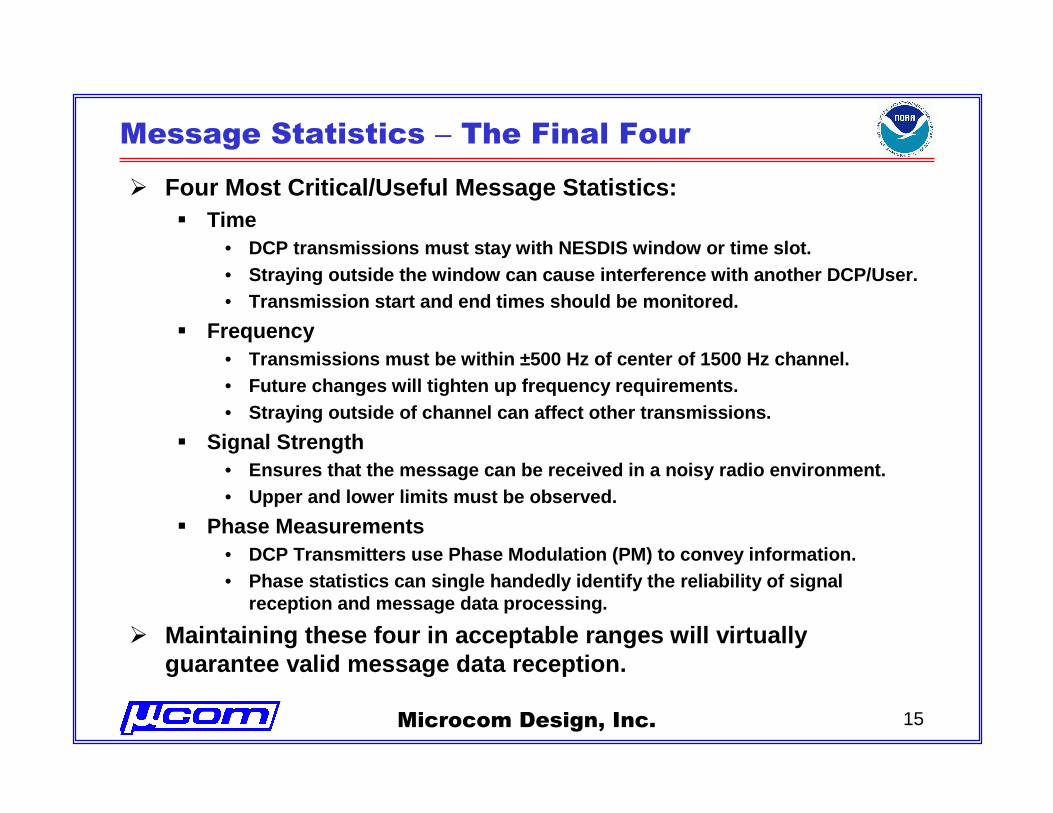
Message Statistics – The Final Four
� Four Most Critical/Useful Message Statistics: � Time
• DCP transmissions must stay with NESDIS window or t ime slot.• Straying outside the window can cause interference with another DCP/User.• Transmission start and end times should be monitore d.
� Frequency• Transmissions must be within ±500 Hz of center of 15 00 Hz channel. • Future changes will tighten up frequency requiremen ts.• Straying outside of channel can affect other transm issions.
� Signal Strength• Ensures that the message can be received in a noisy radio environment.• Upper and lower limits must be observed.
� Phase Measurements• DCP Transmitters use Phase Modulation (PM) to conve y information. • Phase statistics can single handedly identify the r eliability of signal
reception and message data processing.
� Maintaining these four in acceptable ranges will vi rtually guarantee valid message data reception.

Microcom Design, Inc. 16
Message Statistics – DADDS versus DAPS
� DAPS Legacy Stats Still Used by DDS
11083215414G48+2NNYYDDDHHMMSS Time: YYDDDHHMMSS (Frame Sync)
T Type: G = Good ? = Parity Errors (ARM)SS Signal Strength: dBm EIRP
±X Frequency: Sign & Digit (±F times 50 Hz)M Modulation Index (Phase): Normal, High, Low
D Data Quality (Phase): Normal, Fair, Poor

Microcom Design, Inc. 17
Message Statistics – DADDS versus DAPS
� Time: “Carrier Time” (Start) & “End Time” to 0.001 s econds“Msg Time” in seconds to 0.001 seconds
� Frequency: “Freq. Dev” from channel center to 0.1 Hz� Strength: “Signal” dBm EIRP to 0.1 dB� Phase: “Phase Noise” in degrees RMS to 0.1°
“Msg Quality” in percent to 0.1% (aka “Batting Averag e”)� Type: “ARM” is same as in DAPS legacy stats

Microcom Design, Inc. 18
Message Stats – Time – Relative or Absolute?
� Absolute� Each DCP has a defined Time Window.� Time windows and time stamps are in UTC (Universal Time
Coordinated), which is same as GMT (Greenwich Mean Time).� Time stamps down to the millisecond.
� Relative� ~0.24 second travel time (72,000 km / 300,000 km per sec)� How close are we to our neighbor?
� Message length versus window size.

Microcom Design, Inc. 19
Message Stats – Time – Keeping Synced
� Monitor for Time Syncs in Data Stream� Flag Byte or Character is a required part of certification.� All GOES transmitters must send this byte after GOES ID and before user’s
data.� Identifies:
• Message format - ASCII or Pseudo-Binary (Binary in future)• Whether or not there has been a GPS time sync since the last transmission.
� Deciphering the Flag Byte/Character: � ASCII Message:
• No Time Sync: Space (0x20)• GPS Time Sync: “ Double Quote (0x22)
� Pseudo-Binary:• No Time Sync: ` Tic Mark (0x60)• GPS Time Sync: b (0x62)

Microcom Design, Inc. 20
Message Stats – Time – Making Sure
� “To Center or Not to Center”� Until DADDS, message centering was not advisable due to latency
in DAPS time stamping.
� Centering ensures maximum time guard bands at start and end of transmission

Microcom Design, Inc. 21
Message Stats – Frequency – Where Are You?
� DigiTrak DSP Demods currently allow ±500 Hz error from channel center.� 300 BPS Channel is 1500 Hz.� 1200 BPS Channel is 3000 Hz.
� Outside this designed limit, messages will not be received.� Most transmitters today have little trouble meeting this limit.
� Loss of data due to frequency is usually the result of a faulty transmitter.
� Good idea to monitor “Freq. Dev.” for excessive deviation from channel center.
No Reception No Reception
Channel X-1 Channel X Channel X+1
0 +250 +500 ±750 -500 -250 0 +250 +500 ±750 -500 -250 0

Microcom Design, Inc. 22
Message Stats–Frequency–Today & Tomorrow
� Certification Standard 1 (CS1) versus Certification Standard 2 (CS2)
Current (CS1) Future (CS2)
Channel Capacity 220 440
Total Frequency Bandwidth 330 kHz 330 kHz
Basic Channel Bandwidth 1500 Hz 750 Hz
100 bps Bandwidth 1500 Hz N/A
300 bps Bandwidth 1500 Hz 750 Hz
1200 bps Bandwidth 3000 Hz 2250 Hz
Tx Allowed Uncertainty ±400 Hz ±125 Hz
Tx Frequency Stability ±1 ppm ±0.3 ppm
1 2 3 4 5 6 … OLD … 215 216 217 218 219 220
1 301 2 302 3 303 4 304 5 305 6 306 … NEW … 514 215 515 216 516 217 517 218 518 219 519 220 520
� Transition to CS2 will most likely require reducing demodulator acquisition range to ±150 Hz making frequency monitoring more critical in future.
� CS1 versus CS2 Channel Mapping

Microcom Design, Inc. 23
Message Stats – Signal Strength – Bad?
� Too Low� Missed messages - DigiTrak DSP Demods have
programmable reception threshold of 30 dBm EIRP.� Poor Signal-Noise-Ratio (SNR)
• Signal Strength relative to RF Noise. • Lower Signal Strength ⇒ Higher SNR ⇒ Increased Phase
Noise ⇒ Worse Performance
� Too High� Demod overload - DigiTrak DSP Demods have maximum
reception threshold of 56 dBm EIRP.� Violation of certification and use agreements.� Not being a good neighbor – excessive transmit powers
increases noise which lowers SNR for others.� Unnecessary battery discharge.

Microcom Design, Inc. 24
Message Stats – Signal Strength – Good?
� Measured in dBm EIRP (Equivalent Isotropic Radiated Power)� Three Components:
• Transmitter Power – Usually specified in Watts• Antenna Gain – Specified in dB (typical 3-11 dB)• Cable Loss – Between Transmitter & Antenna (0.5 – 1.0 dB)
� dBm = Decibel (logarithmic) scale relative to one milliwatt.
Watts 1 2 3 4 5 6 7 8 9 10 11 12 13 14 15 16 17 18 19 20
dBm 30.0 33.0 34.8 36.0 37.0 37.8 38.5 39.0 39.5 40.0 40.4 40.8 41.1 41.5 41.8 42.0 42.3 42.6 42.8 43.0
� Example: Microcom GTX (12 Watts) with Microcom UB8 (8 dB).� 40.8 dBm + 8 dB – 0.8 dB = 48.0 dBm EIRP
� Certification Levels:� CS1: CS2: GOES-13 and Higher (GOES-12)
300 BPS: 48 dBm EIRP 300 BPS: 39 dBm EIRP (44 dBm)1200 BPS: 51 dBm EIRP 1200 BPS: 45 dBm EIRP (50 dBm)
� Reported variations of ± 3 dB are normal since Signal Strength is measured relative to GOES DCS Pilot.

Microcom Design, Inc. 25
Message Stats – Phase – The Ultimate Telltale
� What Is Phase?� GOES DCS Transmitters use Phase Modulation, as opposed to
Amplitude Modulation (AM) or Frequency Modulation (FM).
� Modulation ⇒ Change in a Deterministic Pattern.� Phase is Measure in Degrees ⇒ Think of Position Around a Circle� Transmitters send one of Eight Phase Symbols to convey message
information (0°, 45°, 90°, 135°, 180°, 225°, 270°, 315°).
� Two Components Determine Quality of Phase Modulation� Absolute Phase – Average – How close is average to nominal?
� RMS Phase Noise – Standard Deviation – How much do the phase symbols vary around the average?
� Under Normal Circumstances …� Average Phase is strictly a function of the transmitter.� Phase Noise is a function of the Signal-to-Noise Ratio (SNR).

Microcom Design, Inc. 26
Message Stats – Phase – Average

Microcom Design, Inc. 27
Message Stats – Phase – Average

Microcom Design, Inc. 28
Message Stats – RMS Phase Noise
� Standard Deviation of Phase Symbols Relative to Average� Designated by Greek Symbol σ (sigma).� 68.3% of received symbols should be within ±1σ� 95.4% of received symbols should be within ±2σ� 99.7% of received symbols should be within ±3σ
� Good, Fair, and Poor …� 300 BPS: Good < 6.0°< Fair < 8.0°< Poor
� 1200BPS: Good < 5.5°< Fair < 7.5°< Poor
� Lower Limit� Can never be less than 0
� Typically, never less than 1.5°- 2.0°
� Upper Limit� Reception barely possible around 11°- 12°(short mess ages)
� Beyond 13°highly unlikely.
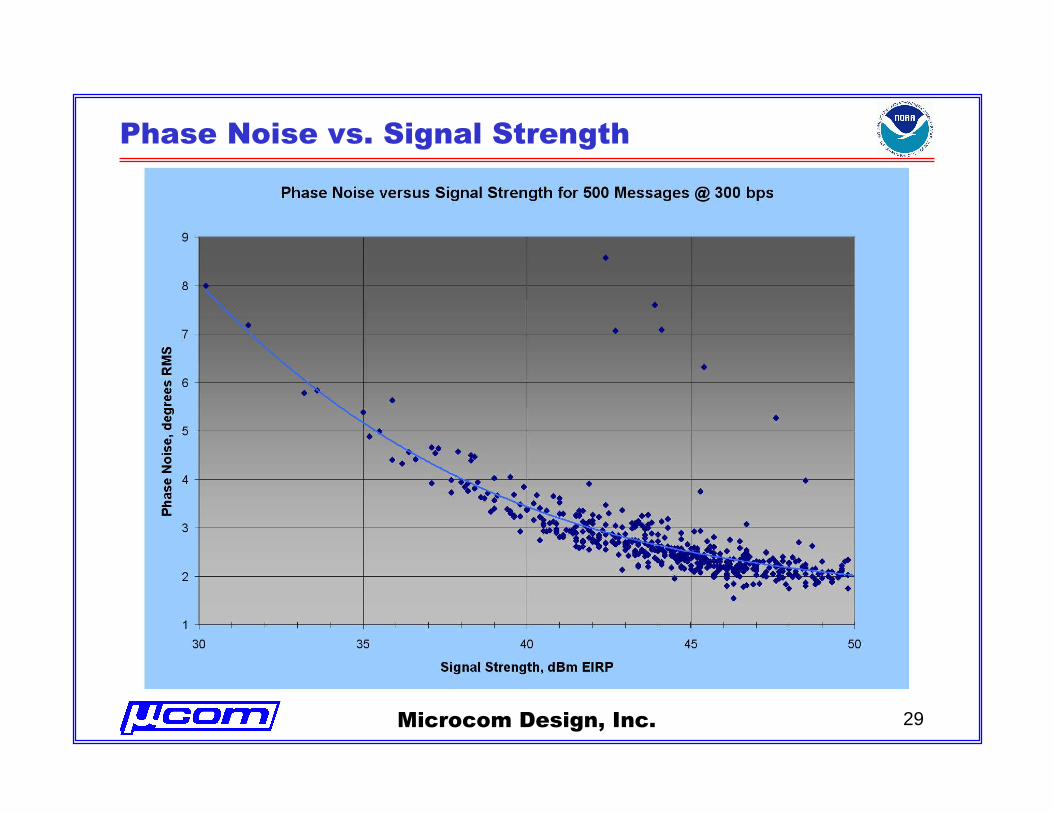
Microcom Design, Inc. 29
Phase Noise vs. Signal Strength

Microcom Design, Inc. 30
Message Stats – Phase – Batting Average
� Also Known As – “Good Phases”� Percentage of “Good” phase symbols relative to total.� Combines phase average and standard deviation into one metric.
� Used to determine DAPS Data Quality:• Good: 100%-85% Fair: 85%-70% Poor: Below 70%
� What is a “Good” Phase Symbol� Any symbol received within ~ ±8.4°of nominal phase (0°, 45°, etc.).
0° 45° 90° 135° 180° 225° 270° 315°
337.5° 22.5° 67.5° 112.5° 157.5° 202.5° 247.5° 292.5° 337.5 °
� “Good Phases” versus RMS Phase Noise with Perfect Average � 85% ⇒ ~1.44σ = 8.4° ⇒ σ ≈≈≈≈ 5.8°
� 70% ⇒ ~1.04σ = 8.4° ⇒ σ ≈≈≈≈ 8.1°

Microcom Design, Inc. 31
Good Phases vs. Phase Noise

Microcom Design, Inc. 32
Good Phases vs. Signal Strength

Microcom Design, Inc. 33
Message Stats – Signal Strength – Optimum?
� 300 bps� 38-42 dBmi yields consistent good phase percentage in
upper 90’s to 100%.� Optimum range is independent of CS1 or CS2.� Point of diminishing returns is ~42 dBmi
• Good Phases consistently at 100%.
• Phase Noise below 3 ° RMS.• Signal performance at peak ⇒ increasing signal strength
provides little benefit while negatively affecting battery drain.
� 1200 bps� ~44 – 48 dBmi should produce equivalent results to graphs
shown for 300 bps.
Microcom Design, Inc. 34
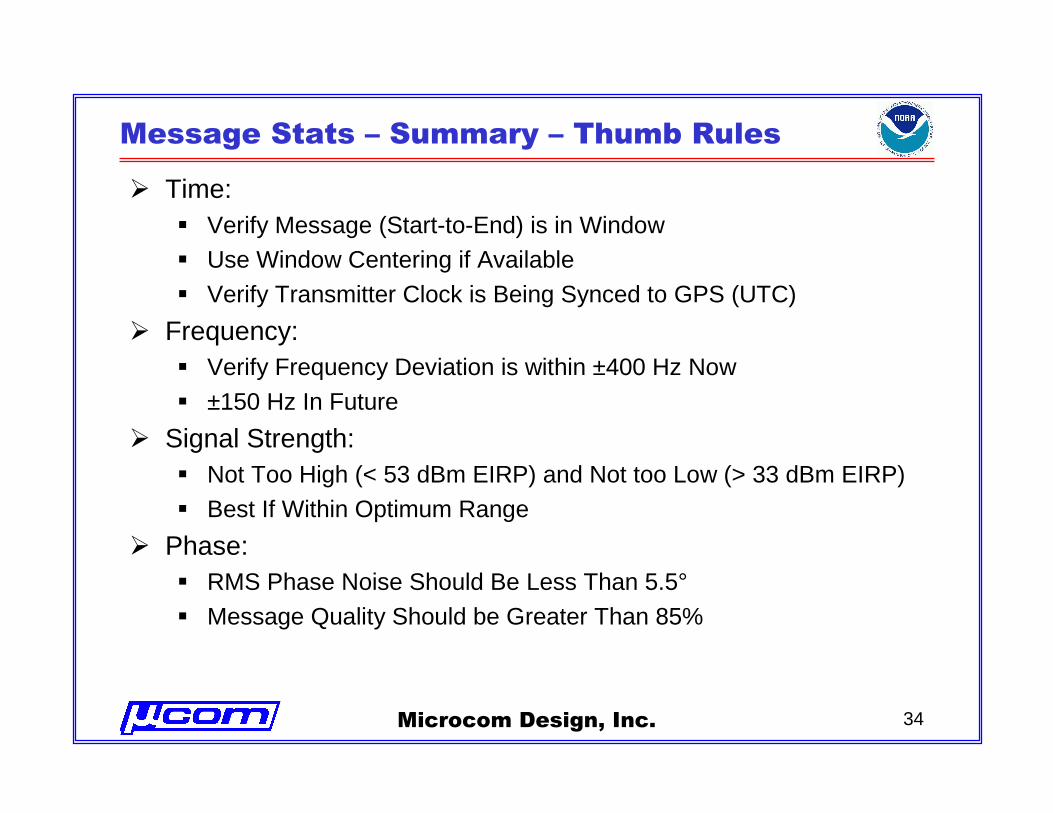
Message Stats – Summary – Thumb Rules
� Time: � Verify Message (Start-to-End) is in Window� Use Window Centering if Available
� Verify Transmitter Clock is Being Synced to GPS (UTC)
� Frequency: � Verify Frequency Deviation is within ±400 Hz Now
� ±150 Hz In Future
� Signal Strength:� Not Too High (< 53 dBm EIRP) and Not too Low (> 33 dBm EIRP)
� Best If Within Optimum Range
� Phase:� RMS Phase Noise Should Be Less Than 5.5°
� Message Quality Should be Greater Than 85%

END OF PRESENTATION
“THANK YOU” FOR YOUR ATTENTION


