GLOBAL MARKETS & ECONOMIES | WEEKLY ECONOMIC CALENDAR | ASIAN STOCK INDICATORS | CURRENCIES | PRECIOUS METAL | OIL Page | 1 Research Department 09 November 2018 DAILY OUTLOOK GLOBAL MARKETS & ECONOMIES | WEEKLY ECONOMIC INDICATORS | ASIAN STOCK INDICATORS | CURRENCIES | PRECIOUS METAL | O I L | GLOBAL MARKETS World equity markets declined on Thursday, snapping a seven-session winning streak, with U.S. stocks on the defensive and the dollar strengthening after the Federal Reserve kept interest rates unchanged. GLOBAL ECONOMIES Japan's core machinery orders tumbled by the most on record in September after a severe earthquake and typhoons disrupted business activity, with economists now also worried about a fall in overseas orders. China reported much stronger-than-expected exports for October as shippers rushed goods to the United States, its biggest trading partner, racing to beat higher tariff rates due to kick in at the start of next year. New Zealand's central bank struck a neutral tone as it marked two full years of steady policy on Thursday, saying its next move would depend on how the economy fared and cautioned of downside risks to growth from global trade frictions. German exports unexpectedly fell by more than imports in September, narrowing the trade surplus as trade friction with the United States slows the traditional growth engine in Europe's largest economy. Euro zone growth is expected to slow in the coming years as the bloc faces risks from U.S. economic policies, Britain's unclear divorce terms from the EU and free-spending plans in high-debt members, like Italy, the EU Commission said. New applications for U.S. unemployment fell slightly last week and the number of Americans receiving benefits remained at a 45-year low as strong labor market conditions continued. DISCLAIMER: The information contained above is intended to provide general information and does not constitute or purports to be a financial advice, investment advice, trading advice, or any other advice. Any strategies, views or opinions expressed above are not intended to be presented as an offer or solicitation for the purchase or sale of any financial instrument. Client should seek personal professional advice before making any decisions. The client should ensure that financial instruments are suitable for his/her own individual objectives, financial situation and investment needs. This report is prepared for the use of Alpha Gold Futures clients. The reproduction and redistribution of this material is strictly prohibited
Transcript
GLOBAL MARKETS & ECONOMIES | WEEKLY ECONOMIC CALENDAR | ASIAN STOCK INDICATORS | CURRENCIES | PRECIOUS METAL | OIL Page | 1
Research Department 09 November 2018
DAILY OUTLOOK GLOBAL MARKETS & ECONOMIES | WEEKLY ECONOMIC INDICATORS | ASIAN STOCK INDICATORS |
CURRENCIES | PRECIOUS METAL | O I L |
GLOBAL MARKETS World equity markets declined on Thursday, snapping a seven-session winning streak,
with U.S. stocks on the defensive and the dollar strengthening after the Federal Reserve kept interest rates unchanged.
GLOBAL ECONOMIES
Japan's core machinery orders tumbled by the most on record in September after a severe earthquake and typhoons disrupted business activity, with economists now also worried about a fall in overseas orders.
China reported much stronger-than-expected exports for October as shippers rushed goods to the United States, its biggest trading partner, racing to beat higher tariff rates due to kick in at the start of next year.
New Zealand's central bank struck a neutral tone as it marked two full years of steady policy on Thursday, saying its next move would depend on how the economy fared and cautioned of downside risks to growth from global trade frictions.
German exports unexpectedly fell by more than imports in September, narrowing the trade surplus as trade friction with the United States slows the traditional growth engine in Europe's largest economy.
Euro zone growth is expected to slow in the coming years as the bloc faces risks from U.S. economic policies, Britain's unclear divorce terms from the EU and free-spending plans in high-debt members, like Italy, the EU Commission said.
New applications for U.S. unemployment fell slightly last week and the number of Americans receiving benefits remained at a 45-year low as strong labor market conditions continued.
DISCLAIMER: The information contained above is intended to provide general information and does not constitute or purports to be a financial advice, investment advice, trading advice, or any other advice. Any strategies, views or opinions expressed above are not intended to be presented as an offer or solicitation for the purchase or sale of any financial instrument. Client should seek personal professional advice before making any decisions. The client should ensure that financial instruments are suitable for his/her own individual objectives, financial situation and investment needs. This report is prepared for the use of Alpha Gold Futures clients. The reproduction and redistribution of this material is strictly prohibited
GLOBAL MARKETS & ECONOMIES | WEEKLY ECONOMIC CALENDAR | ASIAN STOCK INDICATORS | CURRENCIES | PRECIOUS METAL | OIL Page | 2
Research Department 09 November 2018
GLOBAL MARKETS U.S. & Global Markets – World equity markets declined on Thursday, snapping a seven-session winning streak, with U.S. stocks on the defensive and the dollar strengthening after the Federal Reserve kept interest rates unchanged. The U.S. central bank held rates steady and said ongoing strong job gains and household spending had kept the economy on track. Its statement showed little change in the Fed's outlook for the economy since the Fed's previous meeting in September aside from noting that "business investment had moderated from its rapid pace earlier in the year." U.S. shares extended losses after the Fed statement, on the heels of Wednesday's post-election rally of more than 2 percent. Those gains came as investors celebrated political gridlock in the United States as Democrats took control of the House of Representatives after the midterm congressional vote, while Republicans maintained control of the Senate. A spate of weak earnings also gave investors reason for pause, with Qualcomm one of the biggest drags on the benchmark S&P 500 index, down 8.2 percent as the loss of chip sales to Apple caused the company to cut its fourth-quarter outlook. "There are those people who are unsatisfied by this statement because they were looking for a more dovish tone after last month’s market volatility," said Gene Tannuzzo, deputy global head of fixed income at Columbia Threadneedle In Minneapolis. "That’s why we see short-term yields ticked up and stocks down here. They are still on track." The Dow Jones Industrial Average rose 10.92 points, or 0.04 percent, to 26,191.22, the S&P 500 lost 7.05 points, or 0.25 percent, to 2,806.84 and the Nasdaq Composite dropped 39.87 points, or 0.53 percent, to 7,530.89. European shares closed higher, led by banking shares following results from names such as SocGen and Commerzbank The pan-European STOXX 600 index rose 0.19 percent and MSCI's gauge of stocks across the globe shed 0.28 percent. The dollar had advanced heading into the Fed statement and added to its gains after weakening in the prior session. Traders currently see a 71.4 percent chance the Fed will raise rates by a quarter percentage point at its December meeting, according to CME's FedWatch, up from 68.8 percent on Nov 1. The dollar index rose 0.71 percent, with the euro down 0.58 percent to $1.1358. Oil prices fell and WTI entered a bear market, down more than 20 percent from its Oct 3 high, as crude surrendered early gains as investors focused on swelling global supply, which is increasing faster than many had expected. U.S. crude settled down 1.62 percent at $60.67 a barrel and Brent last settled at $70.65, down 1.97 percent. Benchmark 10-year U.S. Treasury notes last fell in price to yield 3.241 percent, from 3.213 percent late on Wednesday. (Source Reuters, Research – Elli)
GLOBAL ECONOMIES Japan – Japan's core machinery orders tumbled by the most on record in September after a severe earthquake and typhoons disrupted business activity, with economists now also worried about a fall in overseas orders.
The 18.3 percent slump in machinery orders far outpaced the median market estimate for a 10.0 percent decline and follows a 6.8 percent increase in August. September's 12.5 percent decline in overseas machinery orders, the biggest such fall in more than two years, could signal sustained weakness in export demand. Japan's economy is forecast to contract in July-September, and the machinery orders slump suggests any rebound in the following quarters is likely to be weak if exports and business investment lose momentum. Manufacturers surveyed by the government expect core machinery orders to rise 3.6 percent in October-December after a 0.9 percent increase in July-September, but some economists worry this forecast is overly optimistic. "I was already expecting capital expenditure to be weak in July-September, but the fall in overseas orders makes me worried about demand from China," said Hiroaki Muto, economist at Tokai Tokyo Research Center. "Japan's economy will resume expansion from the fourth quarter, but I'm worried the pace of growth will wane." Orders from manufacturers fell 17.3 percent in September after a 6.6 percent in August, due to declining demand from makers of chemicals, electronics and vehicles, the data showed. Service-sector orders fell 17.1 percent, versus a 6.0 percent increase in the previous month, due to a decline in orders for railway cars, heavy machinery, and computers. "Core" machinery orders exclude those for ships and from electricity utilities. The government changed its assessment of machinery orders to say they are recovering but fell sharply in September. The northern island of Hokkaido lost power after a severe earthquake in September, which followed a series of typhoons and floods that damaged infrastructure in western Japan, although many businesses quickly resumed operations. Japan's index of coincident economic indicators, which is calculated from industrial output, jobs and retail sales data, fell a preliminary 2.1 points in September, concurrent with the natural disasters. The government cut its assessment of the coincident index for the first time since May 2015, saying it is stalling. Economic growth data due on Nov 14 is expected to show Japan's economy contracted an annualised 1.0 percent in July-September, a Reuters poll found, largely due to the natural disasters and slowdown in overseas demand. China – China reported much stronger-than-expected exports for October as shippers rushed goods to the United States, its biggest trading partner, racing to beat higher tariff rates due to kick in at the start of next year. Import growth also defied forecasts for a slowdown, suggesting Beijing's growth-boosting measures to support the cooling economy may be slowly starting to make themselves felt. The upbeat trade readings from China offer good news for both those worried about global demand and for the country's policymakers after the economy logged its weakest growth since the global financial crisis in the third quarter. October was the first full month after the latest U.S. tariffs on Chinese goods went into effect on Sept. 24, in a significant escalation in the tit-for-tat trade battle.
GLOBAL MARKETS & ECONOMIES
GLOBAL MARKETS & ECONOMIES | WEEKLY ECONOMIC CALENDAR | ASIAN STOCK INDICATORS | CURRENCIES | PRECIOUS METAL | OIL Page | 3
Research Department 09 November 2018
But analysts continue to warn of the risk of a sharp drop in U.S. demand for Chinese goods early in 2019, with all eyes now on whether presidents Donald Trump and Xi Jinping can make any breakthroughs on trade when they meet later this month. China's exports rose 15.6 percent last month from a year earlier, customs data showed on Thursday, picking up from September's 14.5 percent and beating analysts' forecasts for a modest slowdown to 11 percent. "The strong export growth in October was buoyed by front-loading activities by exporters...," said Iris Pang, Greater China Economist at ING in Hong Kong, noting the month is traditionally quieter due to long holidays. "We expect exports to remain strong towards the end of the year as businesses are afraid of a failure in the Trump-Xi meeting, which could lead to broader tariffs on more Chinese goods from the U.S.," Pang said. Washington has vowed to hike the tariff from 10 percent to 25 percent at the turn of the year, while Trump has warned that if talks with Xi are not productive, he could quickly slap tariffs on another $267 billion in Chinese imports. Despite several rounds of U.S. duties this year, China's exports have been surprisingly resilient as firms ramped up shipments before even tougher measures went into effect. Container ship rates from China to the U.S. West Coast remain near record highs, suggesting shipments will remain solid well into November and possibly early December. China's exports to the U.S. rose 13.2 percent from a year earlier in October. In another positive sign, China's exports by volume also showed solid growth, according to Oxford Economics, which estimated they rose "an impressive" 9.9 percent. But analysts say robust export readings won't last much longer, noting Chinese factory surveys have been showing contracting export orders for months. U.S. orders for Chinese goods at the latest Canton fair dropped 30.3 percent from a year earlier by value, as higher U.S. tariffs made goods from batteries to farm tractors more expensive. TRADE SURPLUS FUELING TENSIONS Trump has railed against China over intellectual property theft, entry barriers to U.S. businesses and its persistently large trade surplus with the United States. Several rounds of talks this year have appeared to yield little progress. For the first 10 months of the year, China's surplus with the United States, its largest export market, totalled $258.15 billion, widening sharply from $222.98 billion in the same period last year. While the monthly surplus has eased somewhat to $31.78 billion in October from a record $34.13 billion in September, it remains elevated by historical trends. For trade with all countries, China's surplus was around $34 billion for October, compared with forecasts of $35 billion and September's $31.69 billion. IMPORTS ALSO SURPRISINGLY SOLID While China's exports are expected to falter soon, its imports, especially commodities, could remain strong for months to come as Beijing rolls out more measures such as infrastructure spending to boost domestic demand, economists at ANZ said. Imports for October quickened to 21.4 percent from 14.3 percent in September, beating analysts' forecasts for a slight cooling to 14 percent. China's crude oil imports in October rose to all-time high as private refiners rushed to stock up ahead of winter, while demand for
copper and iron ore was also solid though down from September levels. China cut import taxes on more goods including machinery from Nov. 1, on top of reductions implemented earlier this year, to reduce costs for consumers and companies. "Import growth also overshot expectations quite a lot. Import growth actually reflects some front-loading in China as well - buying before Chinese tariffs come into effect," Chi Lo, greater China economist at BNP Paribas, told Reuters. "More importantly, it also reflects some of Beijing's promise to buy more - as a way to help soothe the trade conflict with the U.S." President Xi told a trade expo in Shanghai this week that he expects China to import $30 trillion worth of goods and $10 trillion worth of services in the next 15 years. Last year, Xi estimated that China would import $24 trillion worth of goods over the coming 15 years. New Zealand – New Zealand's central bank struck a neutral tone as it marked two full years of steady policy on Thursday, saying its next move would depend on how the economy fared and cautioned of downside risks to growth from global trade frictions. The local dollar rallied briefly and bonds sold off as the markets priced out any chance of a near term rate cut and instead focused on when New Zealand would join some of its global counterparts in raising rates. As widely expected, the Reserve Bank of New Zealand kept the official cash rate (OCR) at 1.75 percent, where it has remained since late 2016, and reiterated it expected to hold rates into 2020. "The timing and direction of any future OCR move remains data dependent," Governor Adrian Orr said in a statement, and in a press conference later in the day he refused to rule out a rate cut if economic conditions deteriorated. The central bank removed a line from its previous statements that its next rate move could be either up or down, but noted both upside and downside risks remained to growth and inflation projections. “We don’t agree that the RBNZ needs to maintain the fence-sitting dual approach to policy," said Citibank economist Paul Brennan. "While our own forecasts show a near-term moderation in GDP growth, we expect CPI inflation to exceed the RBNZ’s latest forecasts and maintain the view that the OCR will need to rise from Q3 next year.” A run of stellar economic data including a surprise drop in third-quarter jobless rate to 10-year lows, better-than-expected growth and inflation numbers over recent months, has given the RBNZ some breathing room. However, Orr pointed to temporary factors for the pick-up in second-quarter economic growth and cautioned of headwinds to growth. "Weak business sentiment could weigh on growth for longer. Trade tensions remain in some major economies, raising the risk that trade barriers increase and undermine global growth." The New Zealand dollar hit a fresh three-month high of $0.6820 immediately after the rate decision but quickly retreated from those levels to last hover around $0.6785. Government bonds were sold off for a second straight day as investors priced out the risk of a cut with yields on the long-end of the curve up about 5 basis points. NOT OFF TABLE While the central bank took a more dovish tilt at its August review and sparked speculation of a possible near term rate cut, it
GLOBAL MARKETS & ECONOMIES | WEEKLY ECONOMIC CALENDAR | ASIAN STOCK INDICATORS | CURRENCIES | PRECIOUS METAL | OIL Page | 4
Research Department 09 November 2018
changed tack in the last meeting in September with a slightly more upbeat statement on the economy. Orr said a rate cut is not off the table yet and the bank would consider a cut if the GDP fell short of its projections. "We are not taking the rate cut off the table. What we are saying is we are very data driven on how our predictions unfold," he said. Neighbouring Australia also held its rates at record lows on Tuesday as it awaited a pick up in inflation and wages growth.) "The RBNZ’s risk assessment has shifted back to a pigeon-like, look out for everything up and down," said Jarrod Kerr Chief Economist at Kiwibank. "The shift is a welcome move from the very dovish, more risks to the downside, commentary in August. But we must note, the bank is far from hawkish, as the risks from above need time to play out." German – German exports unexpectedly fell by more than imports in September, narrowing the trade surplus as trade friction with the United States slows the traditional growth engine in Europe's largest economy. The Federal Statistics Office said on Thursday that seasonally adjusted exports fell by 0.8 percent on the month in September, with imports down 0.4 percent. A Reuters poll of economists had pointed to a 0.3 percent rise in exports and a 0.8 percent increase in imports. Germany's trade surplus narrowed to 17.6 billion euros ($20.09 billion) from a revised 18.2 billion euros in August. "A combination of slowing world trade and temporary factors like the new emissions norms for autos hit the German export sector over the summer months," ING economist Carsten Brzeski wrote in a research note. The Federal Statistics Office will publish preliminary gross domestic product growth data for the third quarter next Wednesday. Trade disputes abroad and political tensions at home are both leaving their mark on a still exports-dependent economy which is now in its ninth year of expansion. Household spending has become an important growth driver for Germany as exports have weakened. Consumers are reaping the benefits of record employment levels, rising real wages, increased job security and cheap credit due to the euro zone's expansive monetary policy. Nonetheless, several economic institutes said last week the German economy probably shrank in the third quarter after posting quarterly growth rates of 0.4 percent in the January-March period and 0.5 percent in the second quarter. However, data released on Tuesday showed industrial orders rose unexpectedly in September, driven by bulk orders and higher demand from domestic and other euro zone clients, suggesting the economy ended the third quarter on a solid footing. Euro Zone – Euro zone growth is expected to slow in the coming years as the bloc faces risks from U.S. economic policies, Britain's unclear divorce terms from the EU and free-spending plans in high-debt members, like Italy, the EU Commission said. In its quarterly economic forecasts released on Thursday, the EU executive revised down its growth estimates for the euro zone next year and predicted a protracted slowdown until 2020, the last year for which forecasts are available. The revision, although expected, might complicate the European Central Bank's plans to wind down its stimulus programme this year, but in more positive news for the ECB the Commission
forecast higher inflation of 1.8 percent this year and next in the bloc. The ECB targets a rate close to 2 percent. Under the forecasts, the euro zone will grow 2.1 percent this year after a 2.4 percent expansion in 2017. The slowdown will continue next year when growth is expected at 1.9 percent, slightly below the previous estimate of 2.0 percent. Although all euro zone states are expected to continue growing, in 2020 the bloc's economy will further reduce the pace of its expansion to 1.7 percent, the Commission said in its first estimates for that year. Germany, the bloc's largest economy, is expected to expand by 1.7 percent this year after 2.2 percent growth in 2017, the Commission said, revising down its earlier estimate of 1.9 percent. Next year German growth will be 1.8 percent instead of 1.9 percent. It will go back to 1.7 percent in 2020. Growth forecasts were revised down also for France and Italy, the second- and third-largest economies in the euro zone, with Italy remaining the worst performer in the common currency area, with forecast growth of just 1.1 percent this year, 1.2 percent next year and 1.3 percent in 2020. Italy's weak growth is partially matched only by Britain, which is not a member of the euro zone and will leave the EU in March. The British economy is estimated to expand by 1.3 percent this year and by 1.2 percent next, in line with previous forecasts. In 2020 growth is expected to remain at 1.2 percent. RISKS Projections on British growth are based on "a purely technical assumption" given the uncertain outcome of the Brexit negotiations, the Commission said. The EU overall is forecast to grow 2.1 percent this year, 1.9 percent next, and 1.8 percent in 2020. Brexit is one of the risks for the euro zone and the EU economy that could worsen the forecasts. The other main sources of uncertainties come from the United States and Italy, according to the Commission's analysis. "The balance of risks to the growth outlook is clearly tilted to the downside," economic affairs commissioner Pierre Moscovici told a news conference saying that negative effects from external and domestic risks "cast shadows" on the European economy. Overheating of the U.S. economy fuelled by "pro-cyclical fiscal stimulus" could lead to interest rates rising faster than expected, which would have numerous negative "spillover effects" beyond the United States, the Commission said, also warning of risks from trade tensions caused by the policies of the Trump administration and China's large exports to the United States. The other risk is Italy, whose eurosceptic government is pursuing free-spending policies despite its high debt, which is estimated to remain stable at around 130 percent of gross domestic product until 2020, instead of significantly decreasing as required by EU fiscal rules. "Doubts about the quality and sustainability of public finances in highly indebted Member States could spill over to domestic banking sectors, raising financial stability concerns and weighing on economic activity," the Commission said. U.S. – New applications for U.S. unemployment fell slightly last week and the number of Americans receiving benefits remained at a 45-year low as strong labor market conditions continued. Initial claims for state unemployment benefits dropped by 1,000 to a seasonally adjusted 214,000 for the week ended Nov. 3, the Labor Department said on Thursday. Data for the prior week was
GLOBAL MARKETS & ECONOMIES | WEEKLY ECONOMIC CALENDAR | ASIAN STOCK INDICATORS | CURRENCIES | PRECIOUS METAL | OIL Page | 5
Research Department 09 November 2018
revised to show 215,000 claims received, which was 1,000 more than previously reported. The weekly claims were in line with predictions of economists polled by Reuters, who had forecast 214,000 people would file for benefits. The Labor Department said claims for North Carolina continued to be affected by Hurricane Florence, while Hurricane Michael impacted those for Florida and Georgia. Claims data for Massachusetts was estimated. The four-week moving average of initial claims, considered a better measure of labor market trends as it irons out week-to-week volatility, fell to 213,750 in the latest week, a decline of 250 from the prior week's upwardly revised reading of 214,000.
Thursday's claims report also showed the number of people receiving benefits after an initial week of aid fell 8,000 to 1.62 million for the week ended Oct. 27, the lowest level since July 28, 1973. The four-week moving average of the so-called continuing claims fell 7,500 to 1.63 million, the lowest level since Aug. 11, 1973. Ongoing strong job growth has led to a 3.7 percent unemployment rate, the lowest since the 1960s and a level below Federal Reserve policymakers' current median estimate of "full employment." (Source Reuters, Research – Elli)
ECONOMIC INDICATORS
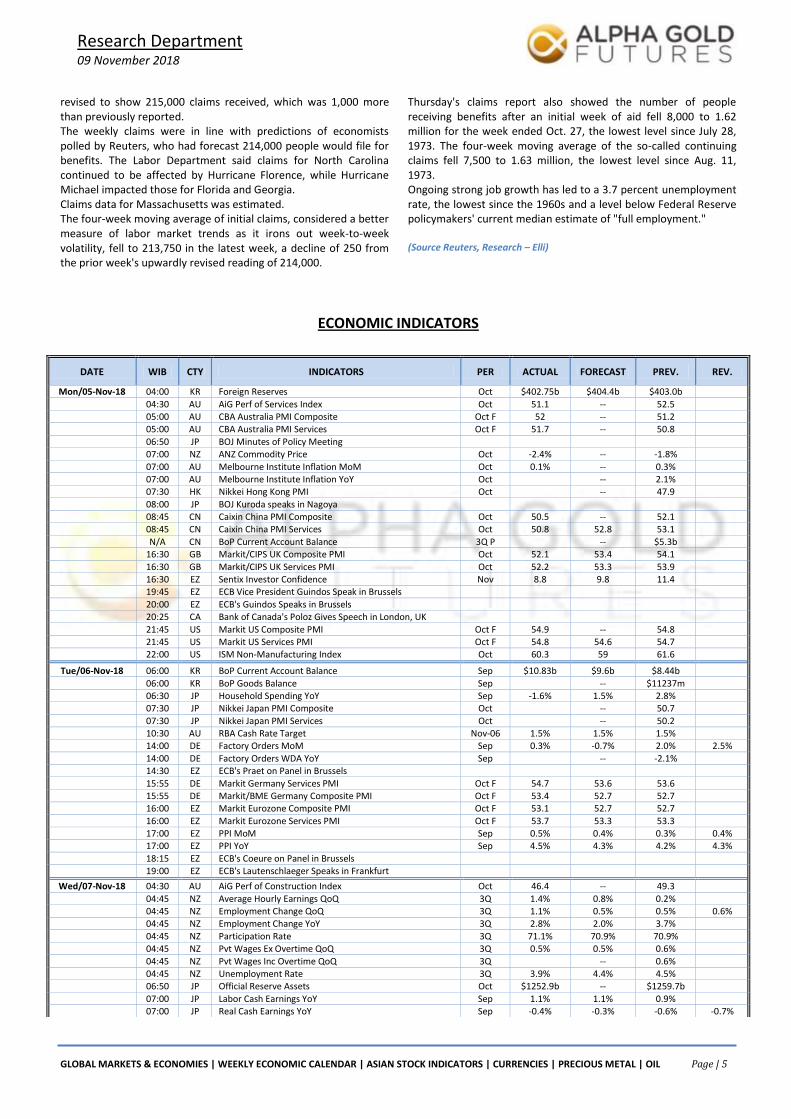
DATE WIB CTY INDICATORS PER ACTUAL FORECAST PREV. REV.
Mon/05-Nov-18 04:00 KR Foreign Reserves Oct $402.75b $404.4b $403.0b
04:30 AU AiG Perf of Services Index Oct 51.1 -- 52.5 05:00 AU CBA Australia PMI Composite Oct F 52 -- 51.2 05:00 AU CBA Australia PMI Services Oct F 51.7 -- 50.8
06:50 JP BOJ Minutes of Policy Meeting 07:00 NZ ANZ Commodity Price Oct -2.4% -- -1.8%
07:00 AU Melbourne Institute Inflation MoM Oct 0.1% -- 0.3% 07:00 AU Melbourne Institute Inflation YoY Oct -- 2.1% 07:30 HK Nikkei Hong Kong PMI Oct -- 47.9
08:00 JP BOJ Kuroda speaks in Nagoya 08:45 CN Caixin China PMI Composite Oct 50.5 -- 52.1 08:45 CN Caixin China PMI Services Oct 50.8 52.8 53.1
N/A CN BoP Current Account Balance 3Q P -- $5.3b 16:30 GB Markit/CIPS UK Composite PMI Oct 52.1 53.4 54.1
16:30 GB Markit/CIPS UK Services PMI Oct 52.2 53.3 53.9 16:30 EZ Sentix Investor Confidence Nov 8.8 9.8 11.4 19:45 EZ ECB Vice President Guindos Speak in Brussels
20:00 EZ ECB's Guindos Speaks in Brussels 20:25 CA Bank of Canada's Poloz Gives Speech in London, UK
21:45 US Markit US Composite PMI Oct F 54.9 -- 54.8 21:45 US Markit US Services PMI Oct F 54.8 54.6 54.7 22:00 US ISM Non-Manufacturing Index Oct 60.3 59 61.6
07:30 JP Nikkei Japan PMI Services Oct -- 50.2 10:30 AU RBA Cash Rate Target Nov-06 1.5% 1.5% 1.5% 14:00 DE Factory Orders MoM Sep 0.3% -0.7% 2.0% 2.5%
14:00 DE Factory Orders WDA YoY Sep -- -2.1% 14:30 EZ ECB's Praet on Panel in Brussels
15:55 DE Markit Germany Services PMI Oct F 54.7 53.6 53.6 15:55 DE Markit/BME Germany Composite PMI Oct F 53.4 52.7 52.7 16:00 EZ Markit Eurozone Composite PMI Oct F 53.1 52.7 52.7
16:00 EZ Markit Eurozone Services PMI Oct F 53.7 53.3 53.3 17:00 EZ PPI MoM Sep 0.5% 0.4% 0.3% 0.4% 17:00 EZ PPI YoY Sep 4.5% 4.3% 4.2% 4.3%
18:15 EZ ECB's Coeure on Panel in Brussels 19:00 EZ ECB's Lautenschlaeger Speaks in Frankfurt
Wed/07-Nov-18 04:30 AU AiG Perf of Construction Index Oct 46.4 -- 49.3
GLOBAL MARKETS & ECONOMIES | WEEKLY ECONOMIC CALENDAR | ASIAN STOCK INDICATORS | CURRENCIES | PRECIOUS METAL | OIL Page | 6
Research Department 09 November 2018
08:30 JP BOJ Funo speaks in Kochi 09:00 NZ 2Yr Inflation Expectation 4Q 2.03% -- 2.04%
N/A CN Foreign Reserves Oct $3.05t $3.07t $3087t $3.06t N/A HK Foreign Reserves Oct -- $426.4b
12:00 JP Coincident Index Sep P 114.6 114.6 116.7 12:00 JP Leading Index CI Sep P 103.9 103.9 104.5 12:30 AU Foreign Reserves Oct A$64.0b -- A$73.7b
14:00 DE Industrial Production SA MoM Sep 0.2% -0.1% -0.3% 14:00 DE Industrial Production WDA YoY Sep 0.8% 0.5% -0.1% 15:00 CH Foreign Currency Reserves Oct 753.3b -- 739.7b
15:30 GB Halifax House Price 3Mths/Year Oct 1.5% 1.3% 2.5% 15:30 GB Halifax House Prices MoM Oct 0.7% 0.3% -1.4% -1.3%
15:30 DE Markit Germany Construction PMI Oct 49.8 -- 50.2 17:00 EZ Retail Sales MoM Sep 0.0% 0.1% -0.2% 0.3% 17:00 EZ Retail Sales YoY Sep 0.8% 0.8% 1.8% 2.2%
22:00 CA Ivey Purchasing Managers Index SA Oct 61.8 -- 50.4 22:30 US DOE Cushing OK Crude Inventory Nov-02 2419k -- 1878k 22:30 US DOE U.S. Crude Oil Inventories Nov-02 5783k 2000k 3217k
22:30 US DOE U.S. Distillate Inventory Nov-02 -3465k -2000k -4054k 22:30 US DOE U.S. Gasoline Inventories Nov-02 1852k -1700k -3161k
Thu/08-Nov-18 03:00 US Consumer Credit Sep $10.923b $15.000b $20.078b $22.877b
03:00 NZ RBNZ Official Cash Rate Nov-08 1.75% 1.75% 1.75% 06:50 JP Bank Lending Ex-Trusts YoY Oct 2.2% -- 2.3% 06:50 JP Bank Lending Incl Trusts YoY Oct 2.2% -- 2.3%
06:50 JP BOJ Summary of Opinions 06:50 JP BoP Current Account Adjusted Sep ¥1334.0b ¥1349.9b ¥1428.8b
06:50 JP Trade Balance BoP Basis Sep ¥323.3b ¥334.2b -¥219.3b 07:01 GB RICS House Price Balance Oct -10.0% -2.0% -2.0% 10:00 CN Exports YoY Oct 15.6% 11.7% 14.5%
10:00 CN Exports YoY CNY Oct 20.1% 14.2% 17.0% 10:00 CN Imports YoY Oct 21.4% 14.5% 14.3%
10:00 CN Imports YoY CNY Oct 26.3% 27.7% 17.4% 10:00 CN Trade Balance Oct $34.01b $35.15b $31.69b 10:00 CN Trade Balance CNY Oct 233.63b 237.00b 213.23b
12:00 JP Eco Watchers Survey Current SA Oct 49.5 48.7 48.6 12:00 JP Eco Watchers Survey Outlook SA Oct 50.6 50.3 51.3
08-Nov - 18-Nov N/A CN Foreign Direct Investment YoY CNY Oct -- 8.0%
13:45 CH Unemployment Rate Oct 2.4% 2.4% 2.4% 13:45 CH Unemployment Rate SA Oct 2.5% 2.5% 2.5%
14:00 DE Current Account Balance Sep 21.1b 21.0b 15.3b 14:00 DE Exports SA MoM Sep -0.8% 0.3% -0.1% 0.1% 14:00 DE Imports SA MoM Sep -0.4% 0.8% -2.7% -2.7%
14:00 DE Trade Balance Sep 18.4b 20.0b 17.2b 17.1b 16:00 EZ ECB Publishes Economic Bulletin
17:00 EZ European Commission Updates Its Economic Forecasts
20:30 US Continuing Claims Oct-27 1623k 1635k 1631k 20:30 US Initial Jobless Claims Nov-03 214k 214k 215k
21:15 EZ ECB's Coeure Speaks in Berlin
Fri/09-Nov-18 02:00 US FOMC Rate Decision (Lower Bound) Nov-08 2.00% 2.00% 2.00% 02:00 US FOMC Rate Decision (Upper Bound) Nov-08 2.25% 2.25% 2.25% 07:30 AU Home Loans MoM Sep -- -2.1%
07:30 AU Investment Lending Sep -- -1.1% 07:30 AU Owner-Occupier Loan Value MoM Sep -- -2.7%
07:30 AU RBA Statement on Monetary Policy 08:30 CN CPI YoY Oct -- 2.5% 08:30 CN PPI YoY Oct -- 3.6%
16:30 GB Construction Output SA MoM Sep -- -0.7% 16:30 GB Construction Output SA YoY Sep -- 0.3% 16:30 GB Exports QoQ 3Q P -- -3.6%
16:30 GB GDP (MoM) Sep -- 0.0% 16:30 GB GDP QoQ 3Q P 0.60% 0.4%
16:30 GB GDP YoY 3Q P 1.50% 1.2% 16:30 GB Government Spending QoQ 3Q P -- 0.4% 16:30 GB Gross Fixed Capital Formation QoQ 3Q P -- 0.8%
16:30 GB Imports QoQ 3Q P -- -0.8% 16:30 GB Index of Services 3M/3M Sep 0.50% 0.5% 16:30 GB Index of Services MoM Sep -- 0.0%
16:30 GB Industrial Production MoM Sep 0.10% 0.2% 16:30 GB Industrial Production YoY Sep 0.50% 1.3%
16:30 GB Manufacturing Production MoM Sep 0.10% -0.2%
GLOBAL MARKETS & ECONOMIES | WEEKLY ECONOMIC CALENDAR | ASIAN STOCK INDICATORS | CURRENCIES | PRECIOUS METAL | OIL Page | 7
Japan's Nikkei surged on Thursday, tracking a rally in Wall Street after U.S. midterm elections produced no major surprises, while Toshiba was in the spotlight after it announced cost cuts and a major share buyback. The Nikkei share average ended 1.8 percent higher at a 2-1/2-week closing high of 22,486.92 points. The outcome of the U.S. midterm election matched market expectations, producing a split Congress with Democrats winning control of the House of Representatives and Republicans cementing their majority in the Senate. Analysts said investors were buying back stocks on optimism that U.S. President Donald Trump's planned measures to boost business growth would continue. "Hopes of further fiscal stimulus also faded (under the possibility that Republicans would win both houses) which could have fuelled inflation," said Yoshinori Shigemi, a global market strategist at JPMorgan Asset Management. "Those who were cautious before the election and waited to buy are now buying." He said the market was now focusing on a U.S. Federal Reserve rate decision later in the global day. The Fed is expected to keep rates on hold but raise them again in December, with more to come next year. All but one of the Topix's 33 subsectors were in positive territory. The broader Topix rose 1.7 percent to 1,681.25. Advancing issues outnumbered declining ones 1,733 to 324. Toshiba Corp jumped 13 percent to a near two-year high and posted the biggest daily gain since July 2017 after the company
said it is liquidating its British nuclear power unit and selling its U.S. liquefied natural gas (LNG) business. The company announced a plan to repurchase up to 40 percent of its own shares. "There had been reports about a possibility of selling non-performing business and job cuts so such moves had been expected at some point. But investors are taking heart," said Hiroyuki Fukunaga, chief executive of Investrust, a financial advice firm. "The share buyback announcement worth up to 40 percent of outstanding shares is definitely positive, too." Suruga Bank jumped 16 percent after Reuters reported that the bank is expected to post a net loss of around 50 billion yen ($440.02 million)for the first half, compared to a net profit of initially-expected 12 billion yen, citing a person with direct knowledge. Traders said that retail investors, who had sold the stock when they first speculated that the bank would post a loss, were covering their short positions after they got an indication about the size of the loss. South Korea's KOSPI stock index and the won rose on Thursday as uncertainties over the U.S. mid-term election ironed out, while Sino-U.S. trade concerns shrugged off as China's October exports beat analysts' expectations. Korean yields rose as well.
16:30 GB Manufacturing Production YoY Sep 0.40% 1.3% 16:30 GB Private Consumption QoQ 3Q P 0.40% 0.3%
16:30 GB Total Business Investment QoQ 3Q P -- -0.7% 16:30 GB Total Business Investment YoY 3Q P -- -0.2%
20:30 US PPI Ex Food and Energy MoM Oct 0.20% 0.2% 20:30 US PPI Ex Food and Energy YoY Oct 2.50% 2.5% 20:30 US PPI Ex Food, Energy, Trade MoM Oct 0.20% 0.4%
20:30 US PPI Ex Food, Energy, Trade YoY Oct -- 2.9% 20:30 US PPI Final Demand MoM Oct 0.20% 0.2%
20:30 US PPI Final Demand YoY Oct 2.70% 2.6% 21:00 US Fed's Quarles to Speak on Financial Regulation 22:00 US U. of Mich. 1 Yr Inflation Nov P -- 2.9%
22:00 US U. of Mich. 5-10 Yr Inflation Nov P -- 2.4% 22:00 US U. of Mich. Current Conditions Nov P -- 113.1 22:00 US U. of Mich. Expectations Nov P -- 89.3
22:00 US U. of Mich. Sentiment Nov P 97.9 98.6 22:00 US Wholesale Inventories MoM Sep F -- 0.3%
22:00 US Wholesale Trade Sales MoM Sep -- 0.8%
Sat/10-Nov-18 01:00 US Baker Hughes U.S. Rig Count Nov-09 -- --
ASIAN STOCK INDEX
GLOBAL MARKETS & ECONOMIES | WEEKLY ECONOMIC CALENDAR | ASIAN STOCK INDICATORS | CURRENCIES | PRECIOUS METAL | OIL Page | 8
Research Department 09 November 2018
China's October exports rose 15.6 percent from a year earlier, while imports expanded 21.4 percent, both handily beating analysts' expectations, official data showed on Thursday. At 06:32 GMT, the KOSPI ended up 13.94 points, or 0.67 percent, at 2,092.63. KOSPI rebounded as the U.S. mid-term election result appeared to be desirable, said Yoon Ji-sun, an analyst at BNK Securities. Some view that the Sino-U.S. trade damage is taking a slower-than-expected pace as China's October exports rose, Yoon added. South Korea's second-largest biopharma firm Samsung BioLogics Co Ltd closed down 3.9 percent on allegations of accounting violations. The won was quoted at 1,117.3 per dollar on the onshore settlement platform, 0.54 percent firmer than its previous close at 1,123.3. In offshore trading, the won was quoted at 1,116.83 per U.S. dollar, down 0.13 percent from the previous day, while in one-year non-deliverable forwards it was being asked at 1,098.7 per dollar. MSCI's broadest index of Asia-Pacific shares outside Japan was up 0.59 percent, after U.S. stocks ended the previous session with gains. Japanese stocks rose 1.82 percent. The KOSPI is down around 15.8 percent so far this year, and down by 9.95 percent in the previous 30 days. The current price-to-earnings ratio is 12.10, the dividend yield is 1.28 percent and the market capitalisation is 1,242.04 trillion won. The trading volume during the session on the KOSPI index was 322,591,000 shares and, of the total traded issues of 896, the number of advancing shares was 718. Foreigners were net buyers of 487,798 million won worth of shares. The U.S dollar has risen 4.73 percent against the won this year. The won's high for the year is 1,053.55 per dollar on April 2 2018 and low is 1,146.26 on October 11 2018. In money and debt markets, December futures on three-year treasury bonds fell 0.01 percent at 108.66. The Korean 3-month Certificate of Deposit benchmark rate was quoted at 1.7 percent, while the benchmark 3-year Korean treasury bond yielded 1.96 percent, lower than the previous day's 1.97 percent. Hong Kong shares edged higher on Thursday following a Wall Street rally driven by relief that U.S. midterm elections produced no major surprises, and as China's big three telecoms firms rose on new network deals. The Hang Seng index ended 0.3 percent higher at 26,227.72 points, while the China Enterprises Index gained 0.6 percent, to 10,703.59 points. The sub-index of the Hang Seng tracking energy shares rose 1.4 percent, while the IT sector dipped 0.31 percent, the financial sector ended 0.24 percent higher and the property sector rose 0.27 percent. China's three big telecoms firms posted strong gains for the day, boosted by deals with Finnish mobile telecom network maker Nokia and, for China Mobile, an infrastructure deal with a Guizhou-based big data company. A sub-index tracking the telecoms sector gained 2.27 percent. China reported stronger-than-expected exports for October as shippers rushed goods to the United States ahead of higher tariffs due to kick in at the start of next year. Import growth also came in above expectations, suggesting Beijing's efforts to cushion the cooling economy may be slowly starting to make themselves felt.
The top gainer on the Hang Seng was China Resources Power Holdings Co Ltd, up 3.53 percent, while the biggest loser was AAC Technologies Holdings Inc, which lost 7 percent. China's blue-chip CSI300 index ended down 0.3 percent at 3,212.77 points, while the Shanghai Composite Index lost 0.2 percent to 2,635.63 points. Around the region, MSCI's Asia ex-Japan stock index was firmer by 0.59 percent, while Japan's Nikkei index closed up 1.82 percent. The yuan was quoted at 6.9272 per U.S. dollar at 08:22 GMT, 0.08 percent weaker than the previous close of 6.9214. The top gainers among H-shares were Byd Co Ltd up 3.52 percent, followed by China Gas Holdings Ltd, gaining 2.76 percent and China Mobile Ltd, up by 2.68 percent. The three biggest H-shares percentage decliners were CSPC Pharmaceutical Group Ltd, down 2.13 percent, New China Life Insurance Co Ltd, 1.8 percent lower, and Dongfeng Motor Group Co Ltd, which fell by 1.4 percent. About 1.71 billion Hang Seng index shares were traded, roughly 90.4 percent of the market's 30-day moving average of 1.89 billion shares a day. The volume traded in the previous trading session was 1.78 billion. At close, China's A-shares were trading at a premium of 17.80 percent over the Hong Kong-listed H-shares. The price-to-earnings ratio of the Hang Seng index was 10.15 as of the last full trading day while the dividend yield was 3.6 percent. So far this week, the market capitalisation of the Hang Seng index has fallen by 1.55 percent to HK$16.93 trillion. The short and one-factor leveraged Hang Seng index, which is designed to replicate the payoff of a short or leveraged portfolio and is linked to the movements of the Hang Seng Index, was lower by 0.3 percent on the day at 5,300.83 points. Stocks in China gave up earlier gains and closed lower for a fourth straight session on Thursday, as investors remained concerned over the trade outlook and awaited concrete signs of policy support for a slowing economy and wobbly markets. At the close, the blue-chip CSI300 index was down 0.3 percent at 3,212.77 points, while the Shanghai Composite Index lost 0.2 percent to 2,635.63 points. The CSI financial sector sub-index ended 0.05 percent higher, the consumer staples sector finished up 0.32 percent, the real estate index lost 0.12 percent and the healthcare sub-index gained 0.15 percent. "The U.S. midterm elections are set and the Democratic Party has taken back control of the House, but this has not relieved market concerns over the Sino-U.S. trade conflict," Guosheng Securities analysts said in a note. They said domestic policy remains the deciding factor in the direction of A-shares at the moment, and that policy is at present in a "stabilising" phase. China reported stronger-than-expected exports for October as shippers rushed goods to the United States ahead of higher tariff rates due to kick in at the start of next year. Import growth also came in above expectations, suggesting Beijing's efforts to cushion the cooling economy may be slowly starting to make themselves felt. The smaller Shenzhen index ended down 0.48 percent and the start-up board ChiNext Composite index was weaker by 1.202 percent. Around the region, MSCI's Asia ex-Japan stock index was firmer by 0.47 percent, while Japan's Nikkei index closed up 1.82 percent.
GLOBAL MARKETS & ECONOMIES | WEEKLY ECONOMIC CALENDAR | ASIAN STOCK INDICATORS | CURRENCIES | PRECIOUS METAL | OIL Page | 9
Research Department 09 November 2018
At 07:23 GMT, the yuan was quoted at 6.928 per U.S. dollar, 0.1 percent weaker than the previous close of 6.9214. The largest percentage gainers on the main Shanghai Composite index were Founder Technology Group Co Ltd, up 10.08 percent, followed by Gansu Gangtai Holding Group Co Ltd, gaining 10.07 percent, and Tianjin Hi-Tech Development Co Ltd, up by 10.05 percent. The largest percentage losers on the Shanghai index were Eastern Gold Jade Co Ltd, down 10 percent, followed by China Hainan Rubber Industry Group Co Ltd, losing 9.97 percent, and DELIXI XINJIANG Transportation Co Ltd down by 8.81 percent. So far this year, the Shanghai stock index is down 20.3 percent, the CSI300 has fallen 20.3 percent, while China's H-share index listed in
Hong Kong is down 8.8 percent. Shanghai stocks have risen 1.26 percent this month. About 15.96 billion shares were traded on the Shanghai exchange, roughly 103.7 percent of the market's 30-day moving average of 15.39 billion shares a day. The volume in the previous trading session was 17.32 billion. As of 07:24 GMT, China's A-shares were trading at a premium of 18.12 percent over the Hong Kong-listed H-shares. The Shanghai stock index is below its 50-day moving average and below its 200-day moving average. The price-to-earnings ratio of the Shanghai index was 11.07 as of the last full trading day, while the dividend yield was 2.8 percent. So far this week, the market capitalisation of the Shanghai stock index has fallen by 1.31 percent to 28.25 trillion yuan. (Source:Reuters,Research:rizal)
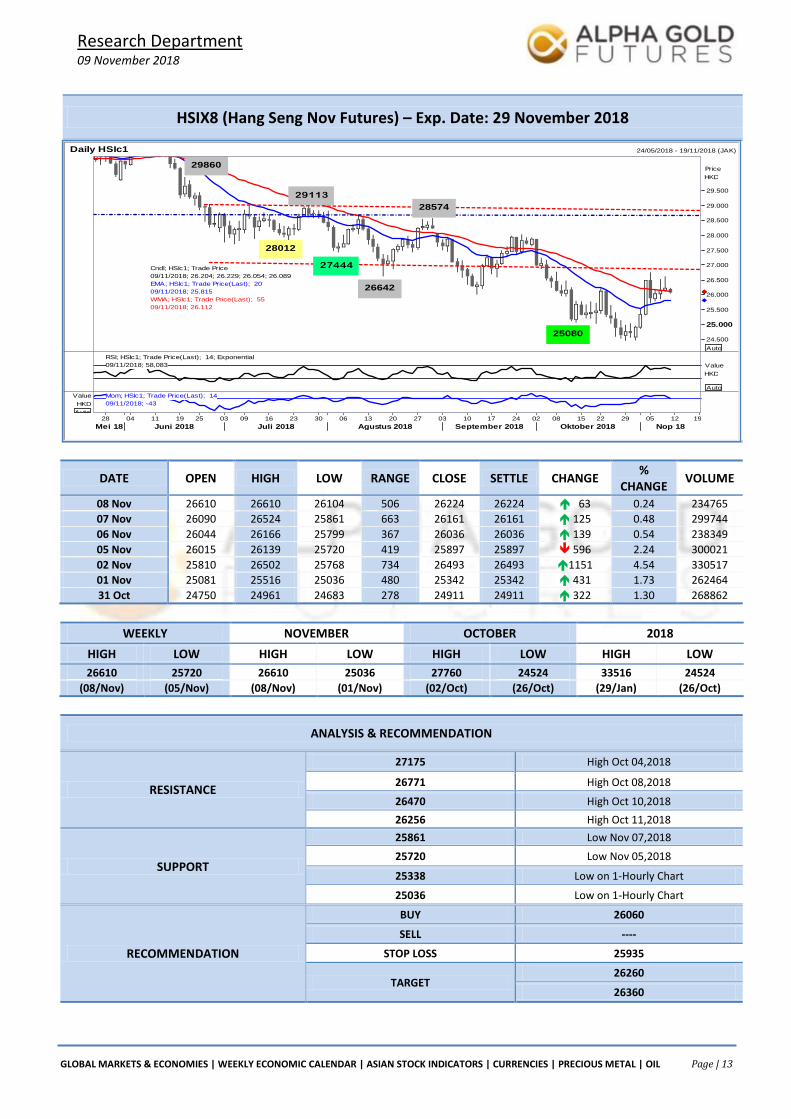
Mei 18 Juni 2018 Juli 2018 Agustus 2018 September 2018 Oktober 2018 Nop 18
GLOBAL MARKETS & ECONOMIES | WEEKLY ECONOMIC CALENDAR | ASIAN STOCK INDICATORS | CURRENCIES | PRECIOUS METAL | OIL Page | 14
Research Department 09 November 2018
Dollar jumps after strong economy keeps Fed on track for Dec hike - Reuters News
The U.S. dollar strengthened against the euro on Thursday after the Federal Reserve held rates steady as expected, and said strong jobs and spending kept the economy on track, setting up for a rate hike in December. The central bank's statement reflected little change in its outlook for the economy since the last policy
meeting in September, with inflation remaining near its 2 percent target, unemployment falling and risks to the economic outlook appearing to be "roughly balanced." The euro was down 0.46 percent on the day against the greenback, which had risen ahead of the announcement. "The dollar had rallied into the statement, so it’s not clear how much more juice it will get with the Fed coming in as expected," said Boris Schlossberg, managing director of foreign exchange strategy at BK Asset Management in New York. Against the euro, the dollar initially weakened as analysts said traders fixated on the slightly dovish comment that business investment had "moderated from its rapid pace earlier in the year," which could act as a possible drag on future economic growth. But it soon rebounded as "apart from that they have not signaled any warning signs at all," said Schlossberg. The gains against the yen were less notable, with the dollar at roughly the equivalent to 113.91 yen, down from the day's low, but still weaker than the peak hit earlier at 113.46. The dollar has gained over the past week against the yen due to divergence in the monetary policies of the U.S. Fed and the Bank of Japan. Against a basket of six rival currencies, the dollar index was up 0.6 percent from late Wednesday. The index had fallen in the wake of the U.S. midterm elections, which split power between the two houses of Congress. Democrats’ control of the House of Representatives suggests they will act as a check on President Donald Trump and could block further tax cuts and deregulation. The greenback has rallied this year since the president’s Republican Party pushed through significant tax cuts, and strong economic growth has prompted the Fed to steadily raise interest rates. Earlier on Thursday, the euro fell after the European Commission cut its forecasts for Italian growth, adding to investor concerns about Italy's debt and economic outlook. (Source Reuters, Research – Elli).
FOREX/CURRENCIES
GLOBAL MARKETS & ECONOMIES | WEEKLY ECONOMIC CALENDAR | ASIAN STOCK INDICATORS | CURRENCIES | PRECIOUS METAL | OIL Page | 15
Research Department 09 November 2018
EUR/USD
Interest Rate: 0.00% (EU)/ 2.00%-2.25% (US)
DATE OPEN HIGH LOW RANGE CLOSE CHANGE PREVIOUS
Nov 08 1.14289 1.14455 1.13504 95,1 1.13618 64,2 1.14260
Nov 07 1.14185 1.14985 1.13933 105,2 1.14260 3 1.14257
Nov 06 1.14074 1.14366 1.13903 46,3 1.14257 19,6 1.14061
Nov 05 1.13903 1.14227 1.13521 70,6 1.14061 12,8 1.13933
Nov 02 1.14012 1.14545 1.13710 83,5 1.13933 12,8 1.14061
GLOBAL MARKETS & ECONOMIES | WEEKLY ECONOMIC CALENDAR | ASIAN STOCK INDICATORS | CURRENCIES | PRECIOUS METAL | OIL Page | 23
Research Department 09 November 2018
Gold slips on strong dollar as Fed holds rates - Reuters News
Gold eased to a one-week low on Thursday on a stronger dollar, after the Federal Reserve held interest rates steady and was seen on track for further rate hikes. "The labor market has continued to strengthen and ... economic activity has been rising at a strong rate," the Fed said in its latest policy statement, leaving intact its plans to continue raising rates gradually. Spot gold fell 0.2 percent to $1,223.11 per ounce at 2:50
p.m. ET (1950 GMT), after touching its lowest since Nov. 1 at $1,219.59 earlier in the session. U.S. gold futures for December delivery settled down $3.60, or 0.29 percent, at $1,225.10 "The Fed gave no indication that they are changing their pace of rate hikes," said Michael Cuggino, portfolio manager at Permanent Portfolio Family of Funds. As a "knee-jerk reaction" to this, gold will not be favoured in the near-term, Cuggino said. Financial markets had expected the Fed to hold its benchmark overnight lending rate steady and the central bank's statement showed little change in its outlook for the economy since its previous meeting in September. The Fed has raised rates three times this year and is widely expected to do so again in December. Higher interest rates raise the opportunity costs of holding gold, which earns nothing and costs money to store and insure. "A failure to continue the momentum a little higher could see gold moving back to the psychologically (important) $1,200 level," said Ross Norman, chief executive officer of Sharps Pixley. The precious metal has fallen more than 10 percent from its April peak after investors preferred the dollar as the U.S.-China trade war unfolded against a background of higher U.S. interest rates. The dollar extended its recovery following a sigh of relief across markets after the U.S. congressional midterm election results, and as investors turned their attention toward the Fed. Gold is on track to post a fifth straight session of losses, hurt more broadly by a recovery in investor appetite for nominally higher-risk assets like stocks. "Risk appetite in the world marketplace is mostly upbeat following the U.S. mid-term elections that produced a divided Congress," Kitco Metals senior analyst Jim Wyckoff said in a note. "A rebound in the U.S. dollar index today, following selling pressure this week, is working against the precious metals market bulls." Silver fell 1.1 percent to $14.40 per ounce. Palladium fell 0.8 percent to $1,124.40 per ounce. It touched a two-week high of $1,139.50 an ounce in the previous session. Platinum was down 1.2 percent at $862 an ounce, after hitting its highest since June 25 at $877.50 an ounce on Wednesday.
(Source Reuters, Research – Elli)
PRECIOUS METAL
GLOBAL MARKETS & ECONOMIES | WEEKLY ECONOMIC CALENDAR | ASIAN STOCK INDICATORS | CURRENCIES | PRECIOUS METAL | OIL Page | 24
Research Department 09 November 2018
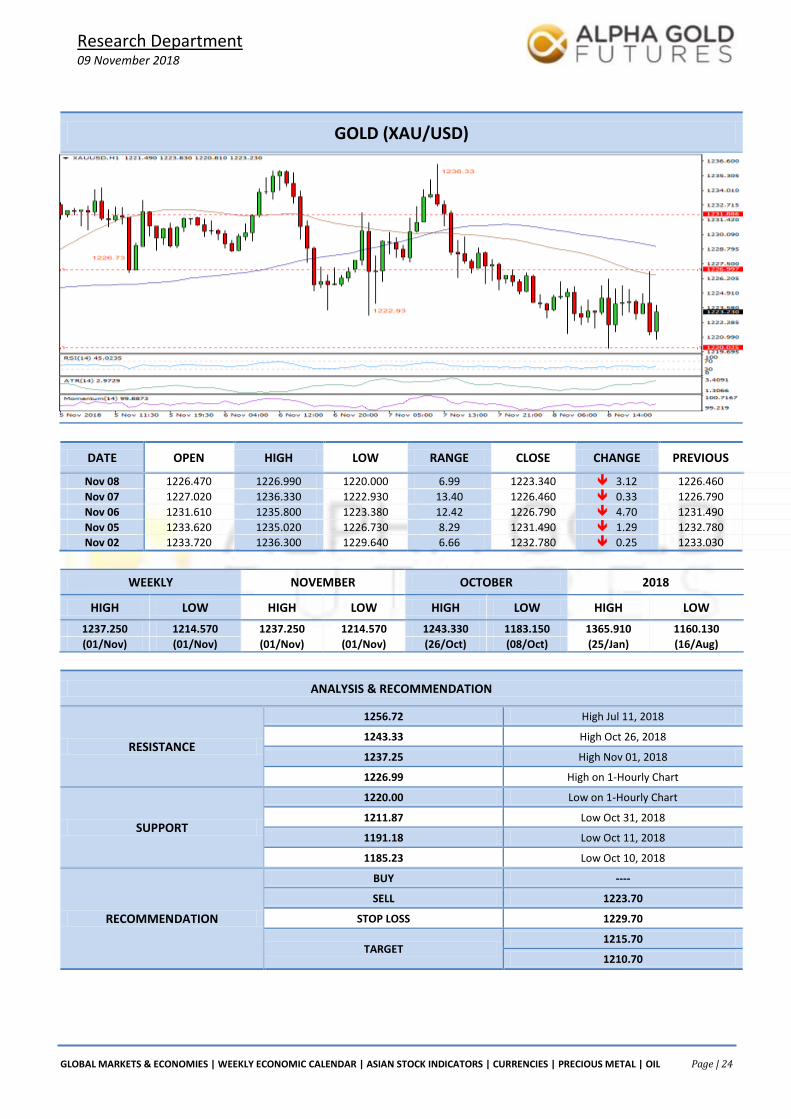
GOLD (XAU/USD)
DATE OPEN HIGH LOW RANGE CLOSE CHANGE PREVIOUS
Nov 08 1226.470 1226.990 1220.000 6.99 1223.340 3.12 1226.460 --
Nov 07 1227.020 1236.330 1222.930 13.40 1226.460 0.33 1226.790 --
Nov 06 1231.610 1235.800 1223.380 12.42 1226.790 4.70 1231.490 --
Nov 05 1233.620 1235.020 1226.730 8.29 1231.490 1.29 1232.780 --
Nov 02 1233.720 1236.300 1229.640 6.66 1232.780 0.25 1233.030 --
GLOBAL MARKETS & ECONOMIES | WEEKLY ECONOMIC CALENDAR | ASIAN STOCK INDICATORS | CURRENCIES | PRECIOUS METAL | OIL Page | 26
Research Department 09 November 2018
Oil prices drop as ‘trifecta of trouble’ may cause glut - Reuters News
Oil prices fell nearly 2 percent on Thursday as investors focused on swelling global crude supply, which is increasing more quickly than many had expected. The market focused on record U.S. crude production and signals from Iraq, Abu Dhabi and Indonesia that output will grow more quickly than expected in 2019. Fears of the potential supply glut dampened a rally early in the session driven by Chinese data that showed record oil imports.
“There’s a trifecta of trouble created by U.S. stockpile builds, OPEC overproduction and the watering down of Iran sanctions,” said Bob Yawger, director of futures at Mizuho in New York. Brent crude futures, the global benchmark, fell $1.42, or 1.97 percent, to settle at $70.65 a barrel, the lowest since mid-August. U.S. crude futures fell $1.00, or 1.6 percent, to $60.67 a barrel, the lowest since March 14. In post-settlement trade, both contracts extended losses. China's crude imports rose to 9.61 million barrels per day (bpd) in October, up 32 percent from a year earlier, customs data showed. China will still be allowed to import some Iranian crude under a waiver to U.S. sanctions that will enable it to purchase 360,000 bpd for 180 days, two sources familiar with the matter told Reuters on Tuesday. U.S. crude output reached a new record high of 11.6 million bpd in the latest week and the country has now overtaken Russia as the world's largest oil producer. The move higher in production was a large jump, “not just a tick,” Yawger said. The U.S. Energy Information Administration said this week it expects output to top 12 million bpd by the middle of 2019, thanks to shale oil. Even with U.S. sanctions on Iranian oil in place, investors believe there is more than enough supply to meet demand. Waivers granted to the sanctions intensify the market’s perception that sanctions may not limit crude supply as much as initially expected. This view is reflected in price charts showing the front-month January Brent futures contract trading at a discount to February. This price structure, known as contango, materializes when market players believe there is a supply glut and decide to store oil rather than sell it. This creates an even larger pool of unsold crude. Some market watchers believe the Organization of the Petroleum Exporting Countries and allies including Russia may take steps to reduce supply. "OPEC and Russia may use (production) cuts to support $70 per barrel," said Ole Hansen, head of commodity strategy at Saxo Bank. Saudi Arabia's top government-funded think-tank is studying the possible effects on oil markets of a breakup of OPEC, the Wall Street Journal reported on Thursday, citing people familiar with the matter. The research project does not reflect an active debate inside the government over whether to leave the Organization of the Petroleum Exporting Countries in the near term, the Journal reported. (Source Reuters, Research – Elli)
O I L
GLOBAL MARKETS & ECONOMIES | WEEKLY ECONOMIC CALENDAR | ASIAN STOCK INDICATORS | CURRENCIES | PRECIOUS METAL | OIL Page | 27