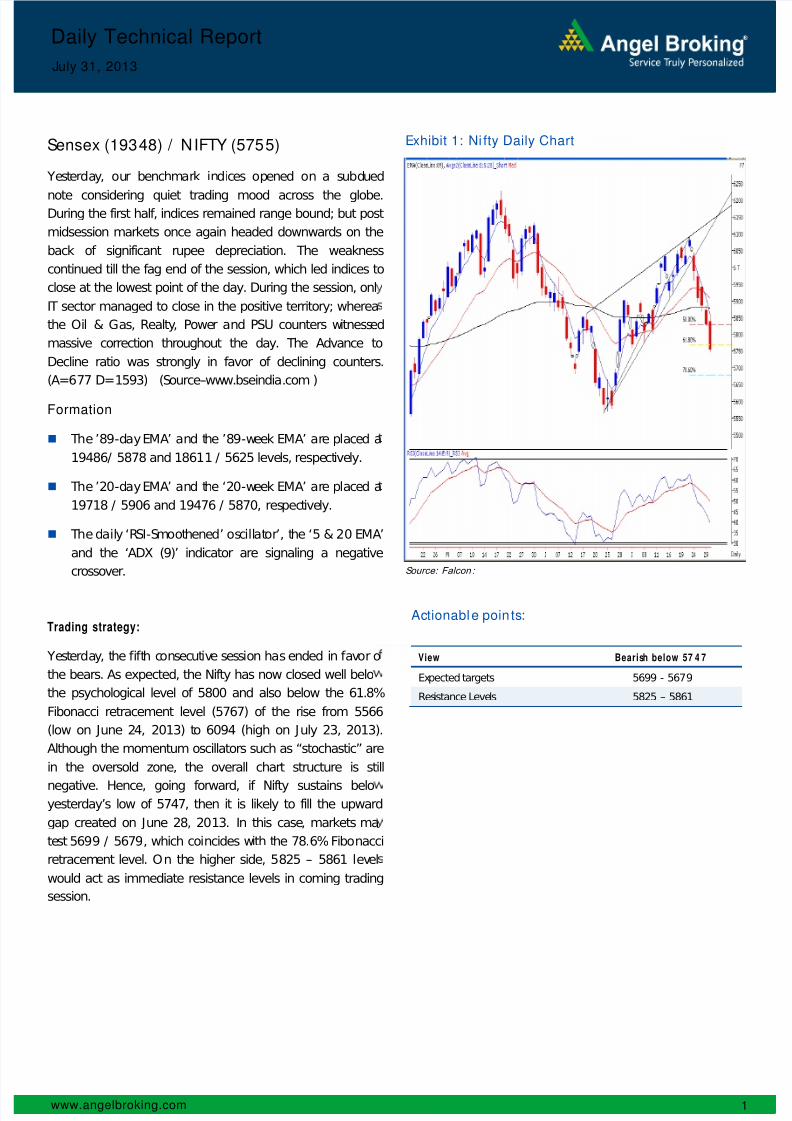
www.angelbroking.com 1 Daily Technical Report J uly 31, 2013Sensex (193 48) / NIFT Y (575 5) Ye ste r da y, our b enc h m ar k in di ces op ene d on a su bd ue d note considering quiet trading mood across the globe. During the first half, indices remained range bound; but post midsession markets once again headed downwards on the back of significant rupee depreciation. The weakness continued till the fag end of the session, which led indices to close at the lowest point of the day. During the session, onl IT sector managed to close in the positive territory; wherea the Oil & Gas, Realty , Powe r and PSU counters w itnessed massive correction throughout the day. The Advance to Decline ratio was strongly in favor of declining counters. (A=677 D=1593) (S ource–ww w.bseindia.com ) Formation T he ’89-d ay EMA’ and the ’89-we e k E MA ’ ar e p laced a 19486/ 5878 and 18611 / 5625 leve ls, respe ct ive ly. T he ’2 0-d ay EMA’ an d t h e ‘20-we e k E MA ’ ar e p la ce d a 19718 / 5906 and 19476 / 5870, res pec tive ly. T he d ail y ‘R S I-S moo t h en e d’ os c ill at or ’, t h e ‘5 & 20 EMA’ and the ‘ADX (9)’ indicator are signaling a negative crossover. Trading strategy: Ye ste r da y , t he fi ft h consecutive session has ended in fa v or o the bears. As expected, the Nifty has now closed well belo the psychological level of 5800 and also below the 61.8% Fibonacci retracement level (5767) of the rise from 5566 (low on June 2 4, 2013) t o 6094 (high on J uly 23, 2013). Although the momentum oscillators such as “stochastic” are in the oversold zone, the overall chart structure is still negative. Hence, going forward, if Nifty sustains belo yesterday’s low of 5747, then it is likely to fill the upward gap created on J une 28, 2013. In this case , markets ma te st 5699 / 5679, which coincides w ith t he 78.6% Fibonacci retracem ent level. O n th e higher side, 5825 – 5861 lev el would act as immediate resistance levels in coming trading session. E xhibit 1: Ni fty Daily Chart Source: Falcon :Actionabl e poin ts: View Bearish below 57 4 7 Ex pected targets 5699 - 5679 Res istance Leve ls 5825 – 5861
This document is solely for the personal information of the recipient, and must not be singularly used as the basis of any investment
decision. Nothing in this document should be construed as investment or financial advice. Each recipient of this document should make
such investigations as they deem necessary to arrive at an independent evaluation of an investment in the securities of the companiesreferred to in this document (including the merits and risks involved), and should consult their own advisors to determine the merits and
risks of such an investment.
Angel Broking Pvt. Limited, its affiliates, directors, its proprietary trading and investment businesses may, from time to time, make
investment decisions that are inconsistent with or contradictory to the recommendations expressed herein. The views contained in this
document are those of the analyst, and the company may or may not subscribe to all the views expressed within.
Reports based on technical and derivative analysis center on studying charts of a stock's price movement, outstanding positions and
trading volume, as opposed to focusing on a company's fundamentals and, as such, may not match with a report on a company's
fundamentals.
The information in this document has been printed on the basis of publicly available information, internal data and other reliablesources believed to be true, but we do not represent that it is accurate or complete and it should not be relied on as such, as this
document is for general guidance only. Angel Broking Pvt. Limited or any of its affiliates/ group companies shall not be in any wayresponsible for any loss or damage that may arise to any person from any inadvertent error in the information contained in this report .
Angel Broking Pvt. Limited has not independently verified all the information contained within this document. Accordingly, we cannottestify, nor make any representation or warranty, express or implied, to the accuracy, contents or data contained within this document.While Angel Broking Pvt. Limited endeavors to update on a reasonable basis the information discussed in this material, there may beregulatory, compliance, or other reasons that prevent us from doing so.
This document is being supplied to you solely for your information, and its contents, information or data may not be reproduced,
redistributed or passed on, directly or indirectly.
Angel Broking Pvt. Limited and its affiliates may seek to provide or have engaged in providing corporate finance, investment banking
or other advisory services in a merger or specific transaction to the companies referred to in this report, as on the date of this report or
in the past.
Neither Angel Broking Pvt. Limited, nor its directors, employees or affiliates shall be liable for any loss or damage that may arise from
or in connection with the use of this information.
N ote: Please refer to the im porta nt ` Stock H olding D isclosure' repo rt on the Ange l website (Research Section). Also, p lease refer to the
latest update on respective stocks for the disclosure status in respect of those stocks. Angel Broking Pvt. Limited and its affiliates may
ha ve investment po sitions in the stocks recom me nded in this repo rt.