Daily Total and Maximum Distances Flown by Great Egrets (Ardea alba ) 2018 Harbor Herons Meeting Ft. Wadsworth, NY 12 Dec John Brzorad Michael Allen Susan Elbin Roland Kays Alan Maccarone Sara Schweitzer Nellie Tsipoura Implications for Energetics & Conservation
Transcript
Daily Total and Maximum Distances Flown by Great Egrets (Ardea alba)
2018 Harbor Herons
Meeting
Ft. Wadsworth, NY
12 Dec
John Brzorad
Michael Allen
Susan Elbin
Roland Kays
Alan Maccarone
Sara Schweitzer
Nellie Tsipoura
Implications for
Energetics & Conservation
We have tantalizing evidence from individual birds
that:
1) the amount of energy expended varies considerably
by time of year (winter, breeding, post-breeding)
2) As chicks grow, adults expend more energy to keep up
with demand.
For example…………
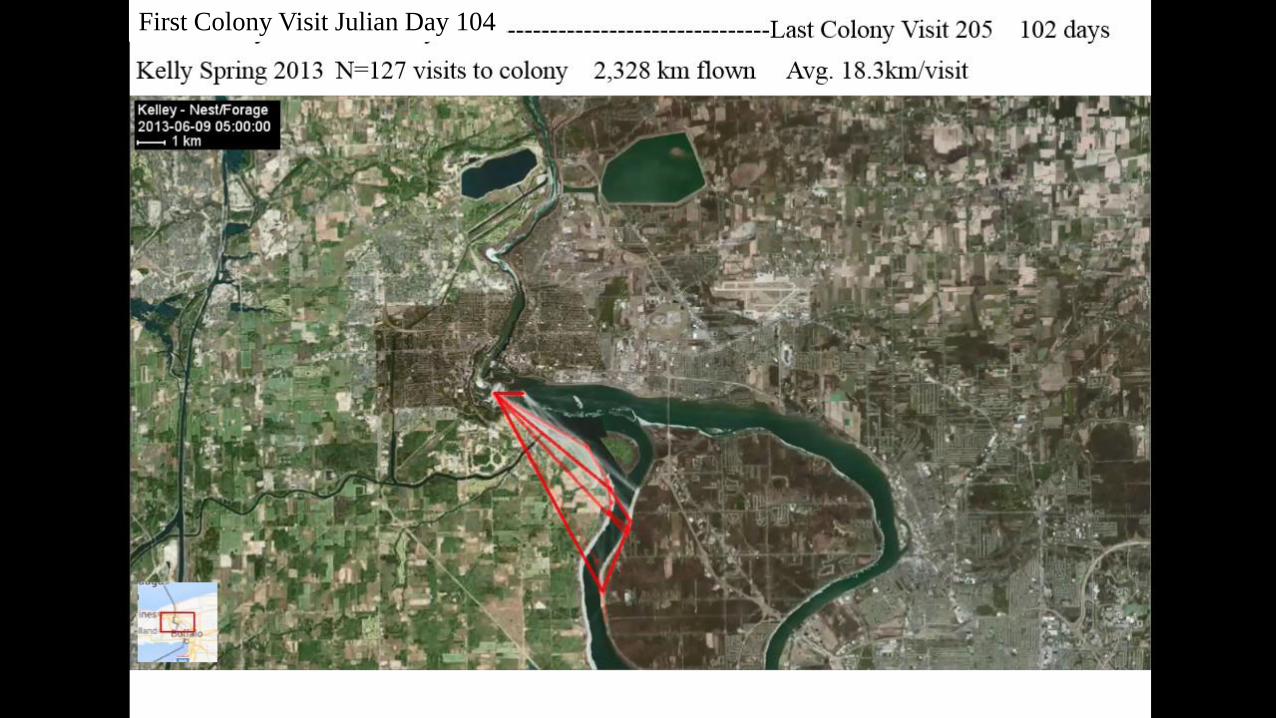
Mr. KellyMr. Kelley
Captured: Lake Mattamuskeet
Breeding: Niagara River
Winter: Lake Mattamuskeet
E-Obs 48g Solar
GPS
First Colony Visit Julian Day 104
Is this pattern applicable for the species?
Can we confirm a link in the rise over breeding season
with nest observations?
Questions:
Edward
Winter
Roost
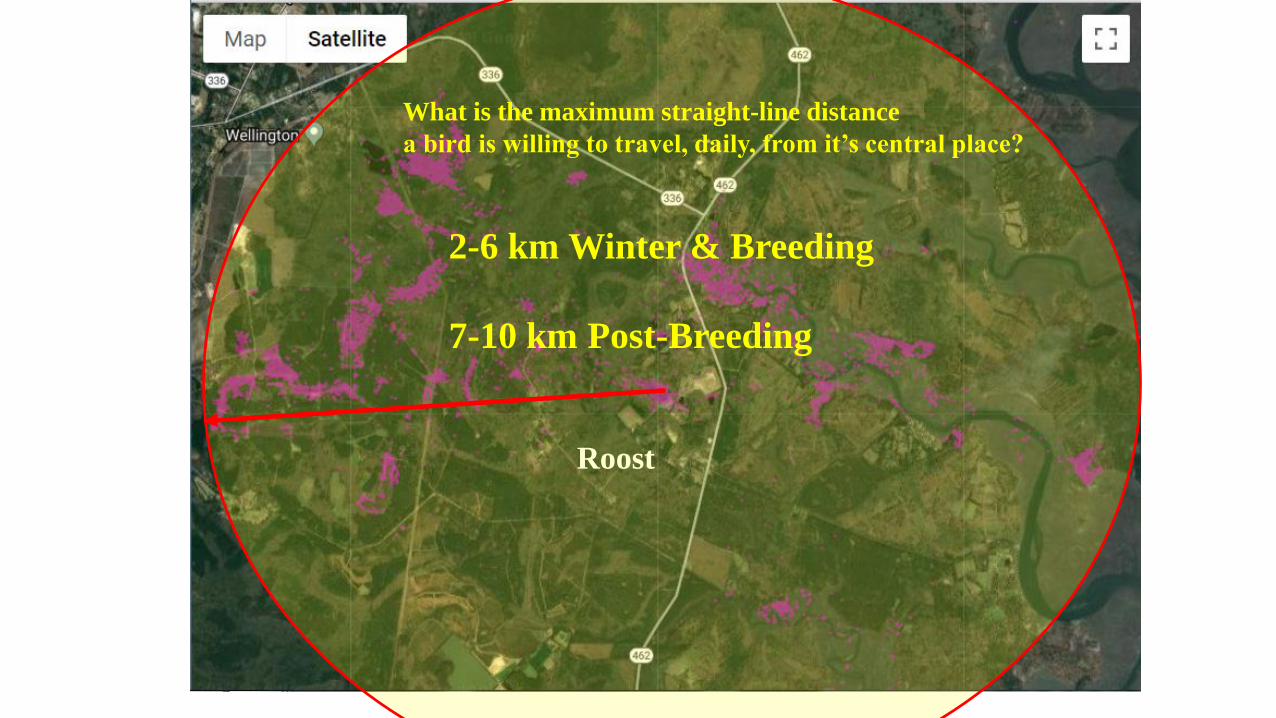
What is the maximum straight-line distance
a bird is willing to travel, daily, from it’s central place?
Roost
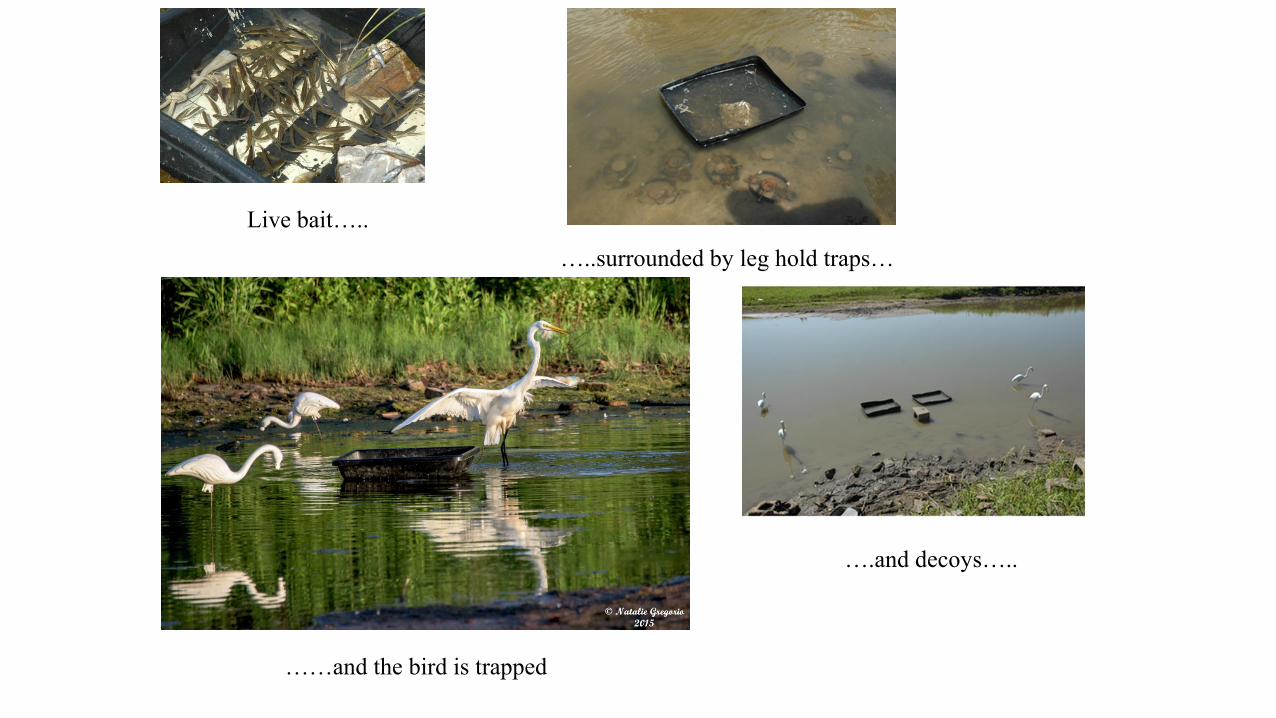
Methods
Live bait…..
…..surrounded by leg hold traps…
….and decoys…..
……and the bird is trapped
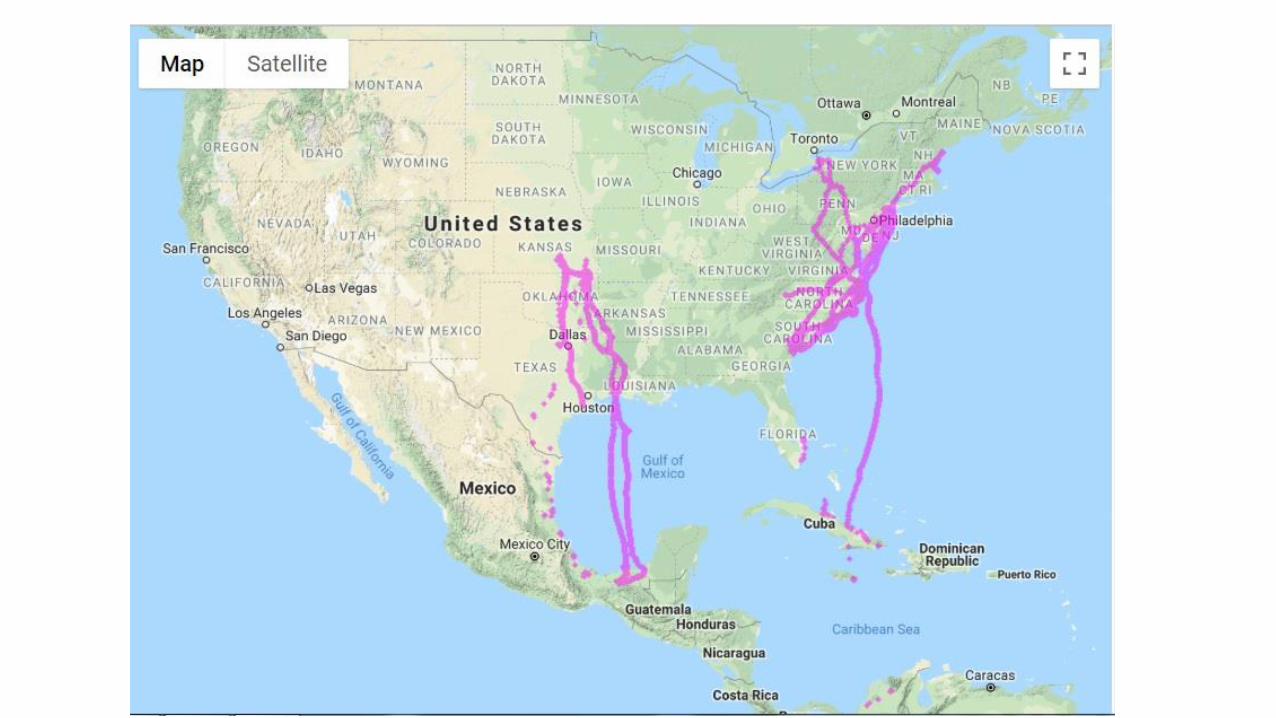
Birds
Breeders: 2691 Kansas ? 90
Nelson Kansas Mexico 1158
Carl Kansas Oklahoma 57
Vicky’s Other Kansas Texas 59
Bisbing N. Carolina Columbia 207
Newbern N. Carolina N. Carolina 242
Palma Massachusetts N. Carolina 315
Kelly Niagara Falls N. Carolina 226
Edward NYC/NJ S. Carolina 936
Clarence NYC/NJ S. Carolina 235
Individual Breeding Wintering # Days
Newly Fledged: Meadows N & S Carolina 176
Young of Year: Heller (female) Coastal N. Carolina 326
Post-Breeder?: Waldo KS-OK Mexico 484
Total
4519 ~ 12 years
13 Birds
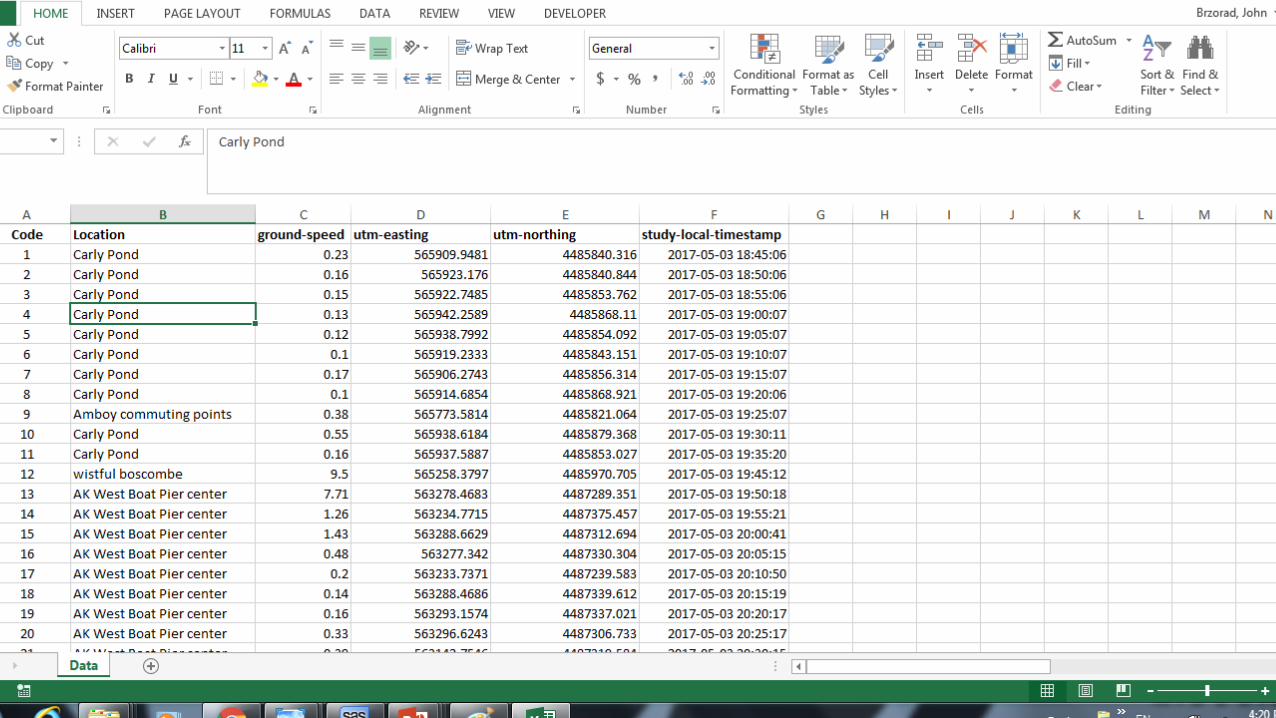
Annotate (name) Clusters
in Movebank
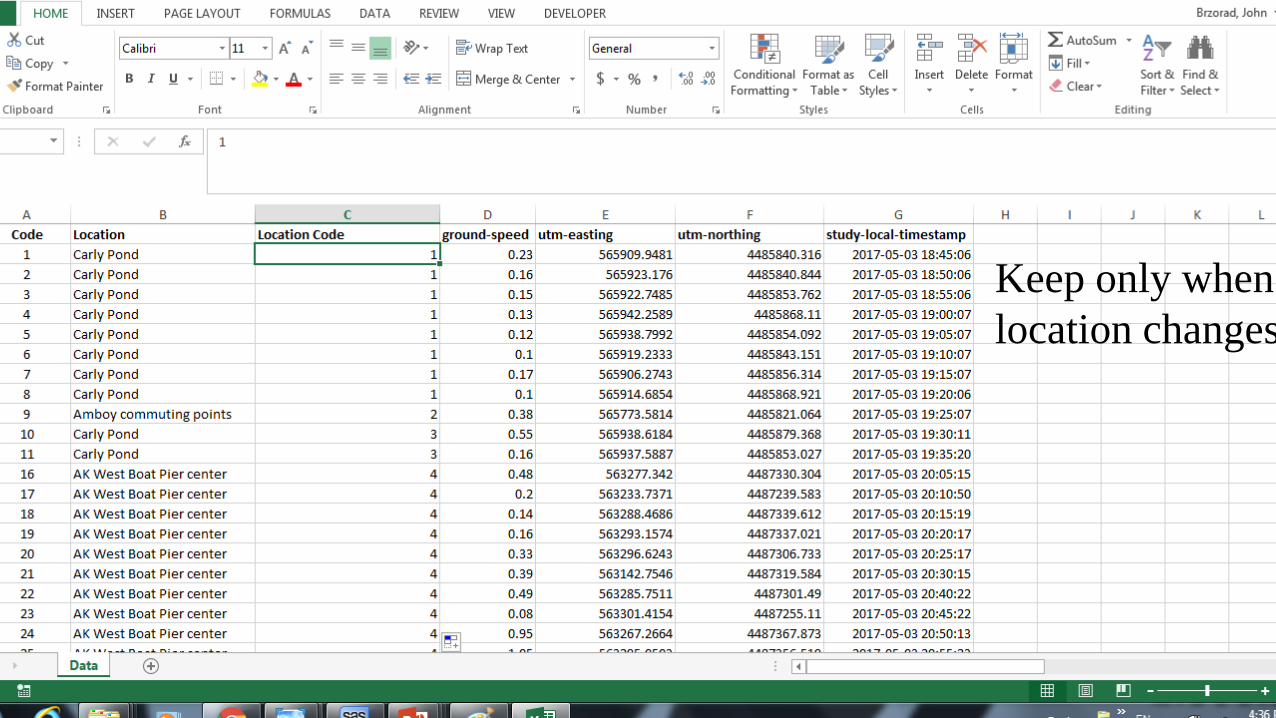
For Daily and Maximum Distances, first:
Remove Flying Points
Make Location Codes
Keep only when
location changes
Keep only when location changes
Now, only have site to site transfers
Calculate distance =(𝑥
2−𝑥
1)2+ 𝑦
2−𝑦
12
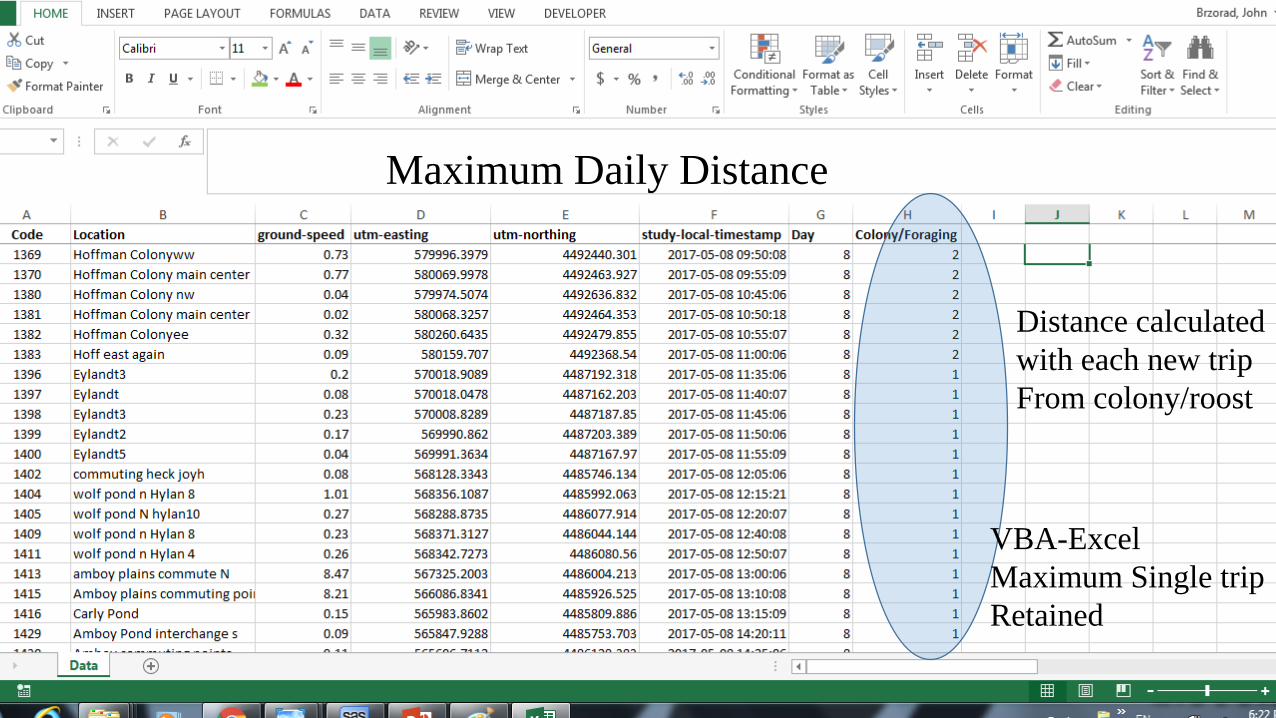
Sum over DAY
Total by Day
Distance calculated
with each new trip
From colony/roost
VBA-Excel
Maximum Single trip
Retained
Maximum Daily Distance
Jan-March: 8.2 days
April-June: 12.7 days
July-Sept: 15.7 days
Oct-Dec: 12.7 days
Representation by day of the year
Results
0
5
10
15
20
25
30
35
40
45
50
0 50 100 150 200 250 300 350 400
Tota
l A
vg.
Dai
ly
Dis
tance
(km
)
Time (Julian Date)
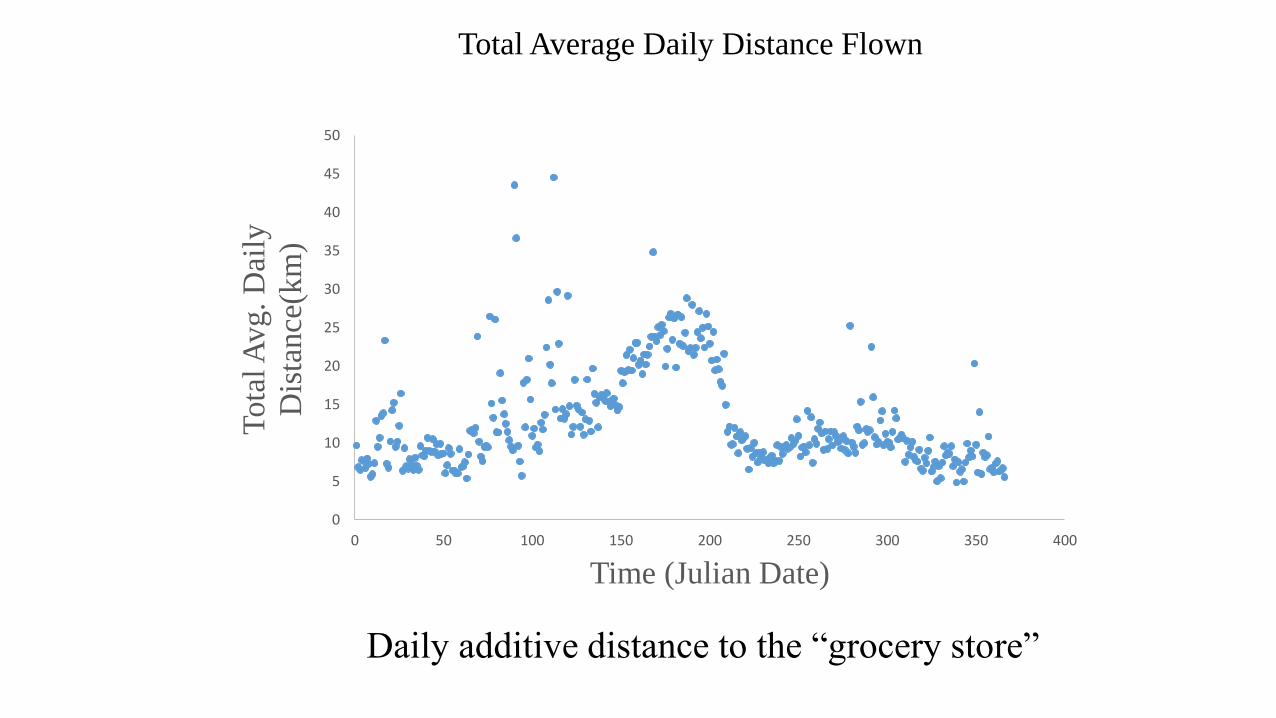
Total Average Daily Distance Flown
Daily additive distance to the “grocery store”
0
2
4
6
8
10
12
14
16
18
20
0 50 100 150 200 250 300 350 400
Max
.Avg
. D
aily
Dis
t. (
km
)
Time(Julian Date)
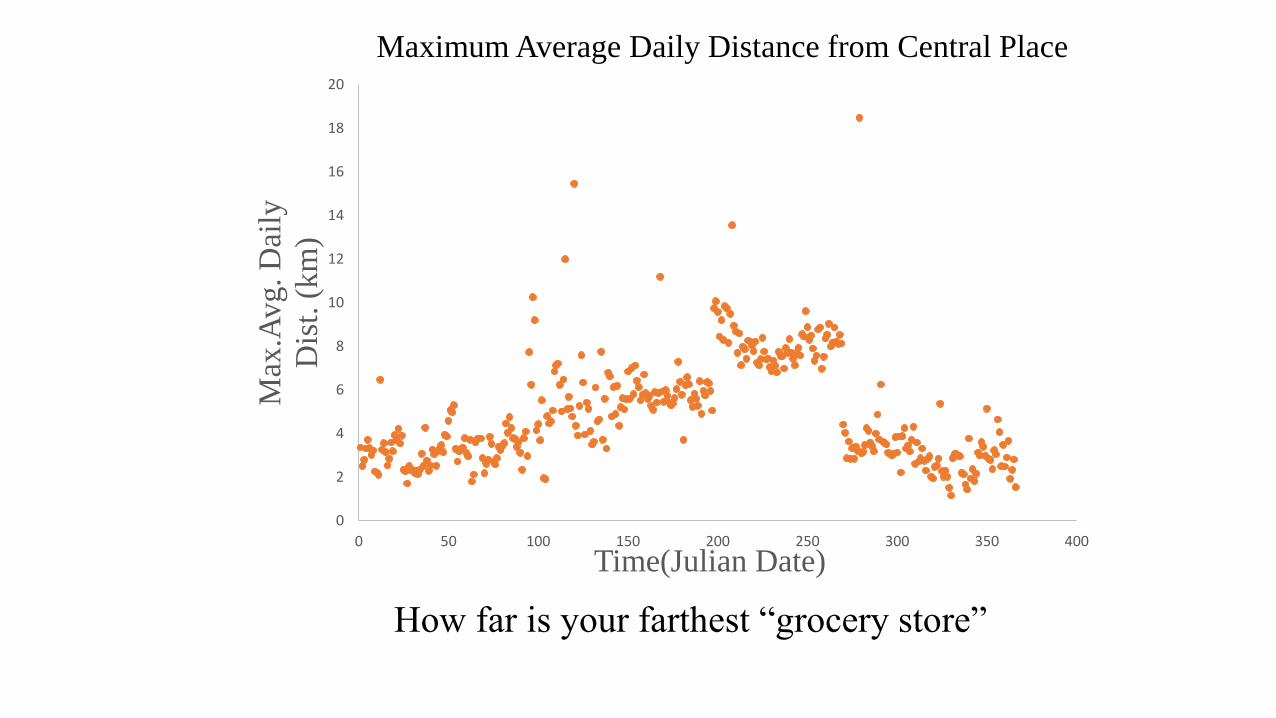
Maximum Average Daily Distance from Central Place
How far is your farthest “grocery store”
0
5
10
15
20
25
30
35
40
45
50
0 50 100 150 200 250 300 350 400
Time (Julian Date)
Dis
tan
ce (
km
)
Total Daily Distance
Maximum Daily Distance
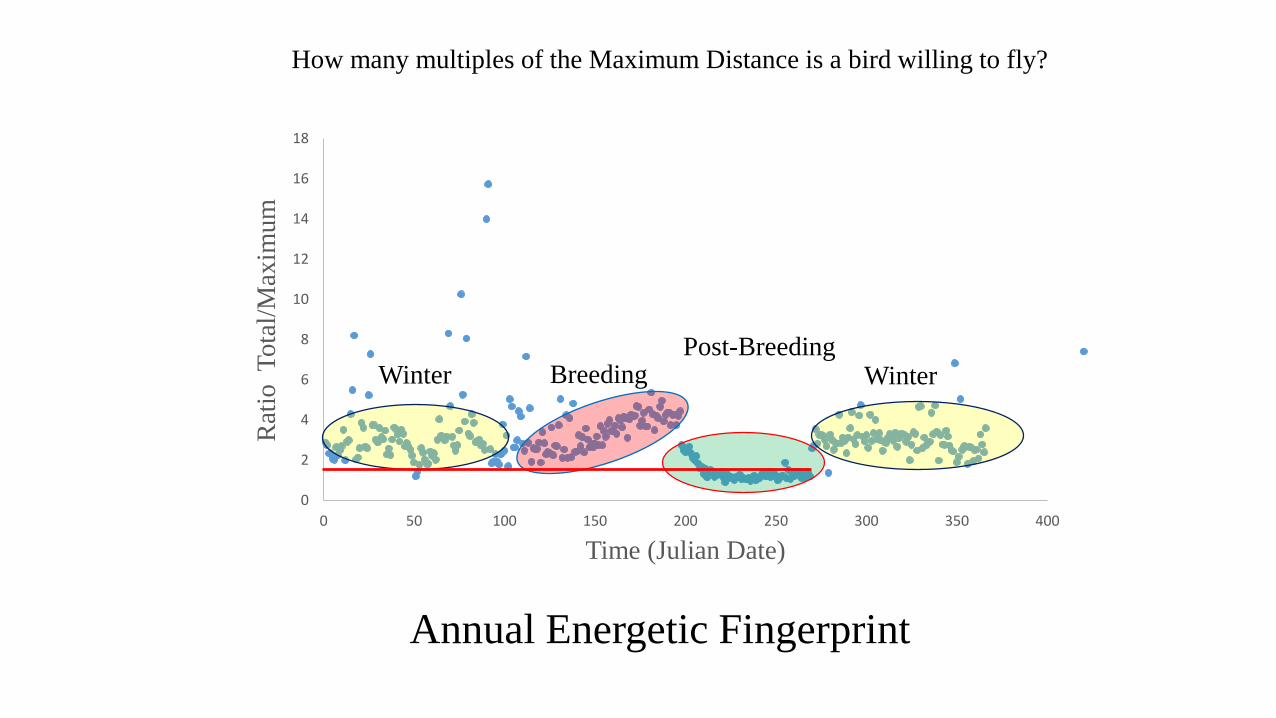
0
2
4
6
8
10
12
14
16
18
0 50 100 150 200 250 300 350 400
Rat
io T
ota
l/M
axim
um
Time (Julian Date)
How many multiples of the Maximum Distance is a bird willing to fly?
Post-BreedingWinterWinter Breeding
Annual Energetic Fingerprint
For the energetics to make any sense
It must be ground truthed with real physiology
Enter Dr. Gwen Bachman; Univ. Nebraska
Statistics
0
5
10
15
20
25
Dis
tance
(K
m)
MAXIMUM AND TOTAL DAILY
FLIGHT DISTANCES BY BREEDING
STATUS
Maximum Distance
Total Distance
Maximum: F = 1.4, P = 0.24
Total: F = 3.2, P = 0.01
Breeding birds fly further as the breeding season progresses.
Why?
Could it be demand?
What is in the nest as the birds fly further?
5
10
15
20
25
30
35
40T
ota
l D
ista
nce
(K
m)
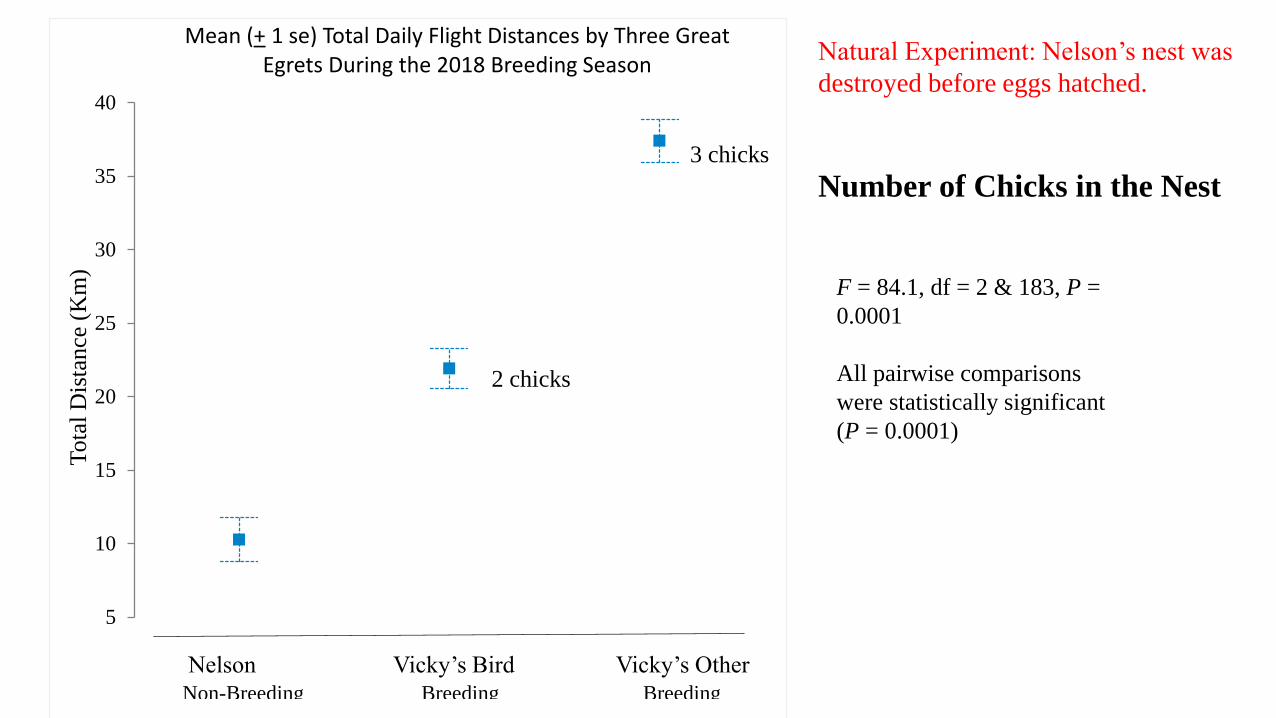
Mean (+ 1 se) Total Daily Flight Distances by Three Great Egrets During the 2018 Breeding Season
Non-Breeding Breeding Breeding
F = 84.1, df = 2 & 183, P =
0.0001
All pairwise comparisons
were statistically significant
(P = 0.0001)
Nelson Vicky’s Bird Vicky’s Other
2 chicks
3 chicks
Natural Experiment: Nelson’s nest was
destroyed before eggs hatched.
Number of Chicks in the Nest
7.5
12.5
17.5
22.5
27.5
32.5
37.5
Tota
l D
ista
nce
(K
m)
Mean (+ 1 se) Total Flight Distances by Three Great Egrets by Breeding Stage
Pre-Lay Incubation Small Medium Large
F = 43.2, df = 4 and 181, P = 0.0001
Size of Chicks in the Nest
Is this pattern applicable for the species? YES, seems so
Can we confirm a link in the rise over breeding season
with nest observations? Appears to be caused by chick
demand
Questions-Answers:
What is the maximum straight-line distance
a bird is willing to travel, daily, from it’s central place?