23
Dairy Industry Trends and Opportunities John F. Smith Extension Dairy Specialist Kansas State University
| Date post: | 23-Dec-2015 |
| Category: |
Documents |
| Upload: | dwain-washington |
| View: | 217 times |
| Download: | 1 times |
Dairy Industry Trends and Opportunities
John F. Smith
Extension Dairy Specialist
Kansas State University
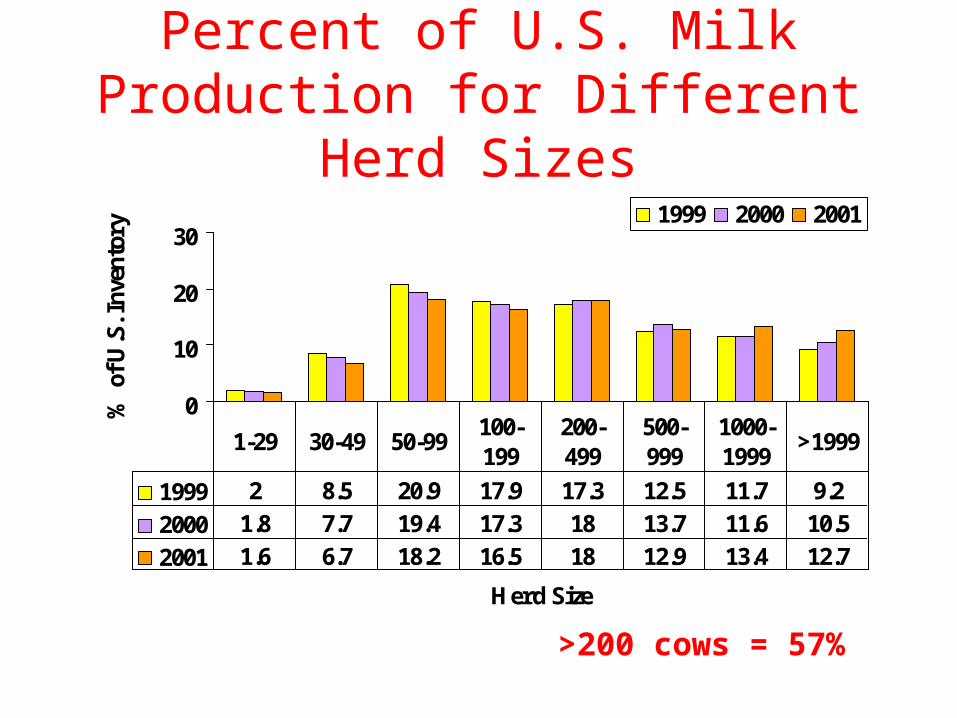
Percent of U.S. Milk Production for Different Herd Sizes
0
10
20
30
Herd Size
% o
f U.S
. Inv
ento
ry
1999 2000 2001
1999 2 8.5 20.9 17.9 17.3 12.5 11.7 9.2
2000 1.8 7.7 19.4 17.3 18 13.7 11.6 10.5
2001 1.6 6.7 18.2 16.5 18 12.9 13.4 12.7
1-29 30-49 50-99100-199
200-499
500-999
1000-1999
>1999
>200 cows = 57%

Percent of U.S. Inventory (cows) for Different Herd Sizes
0
10
20
30
Herd Size
% o
f U.S
. Inv
ento
ry
1999 2000 2001
1999 3.1 10.1 23.2 18.4 16.3 11 10 7.9
2000 2.9 9.1 22 18 16.7 12 10.1 9.2
2001 2.6 8.1 20.9 17.4 16.4 12 11.5 11.1
1-29 30-49 50-99100-199
200-499
500-999
1000-1999
>1999
>200 = 51%

Number of Operations for Different Herd Sizes in the US
0
10000
20000
30000
40000
Herd Size
% o
f U.S
. Inv
ento
ry
1999 2000 2001
1999 32920 24055 32935 13250 5290 1600 695 255
2000 30810 22110 31360 12865 5350 1700 695 280
2001 28155 19865 29215 12335 5195 1700 770 325
1-29 30-49 50-99100-199
200-499
500-999
1000-1999
>1999
>200 = 7990 herds (8.2%)<200 = 89,570 Herds

Percent of U.S. Milk Production from Dairies with > 200 Cows
-
10.0
20.0
30.0
40.0
50.0
60.0
93 94 95 96 97 98 99 0 1
Source: USDA-NASS
Two Ways to Increase Milk Production
• Milk More Cows
• Increase Milk Production per Cow
• Operations over 200 cows are doing both
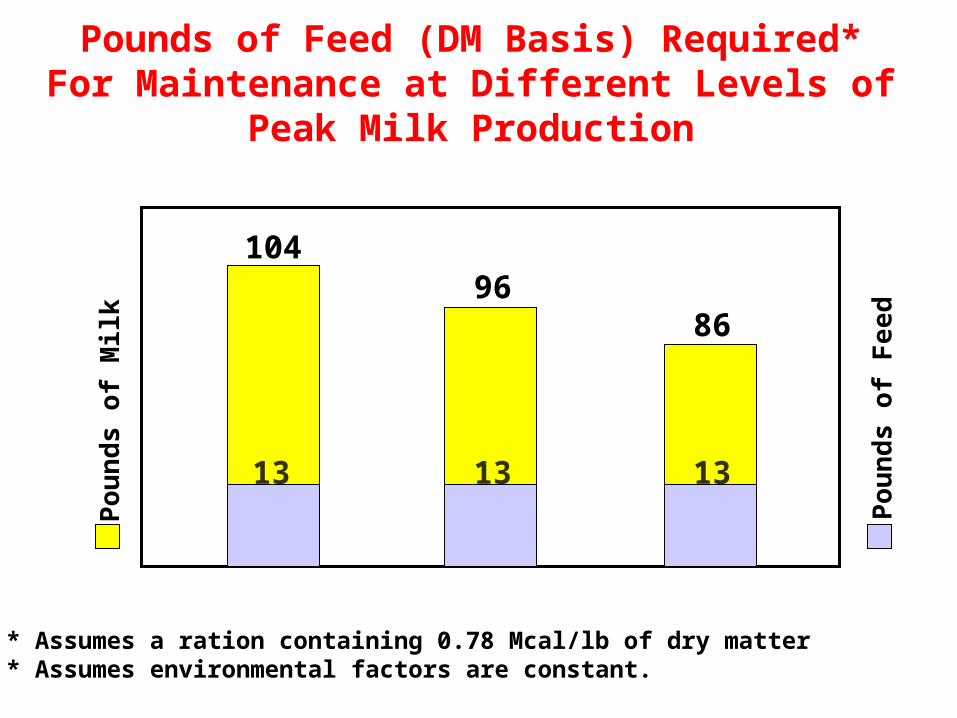
Pounds of Feed (DM Basis) Required* For Maintenance at Different Levels of Peak Milk
Production
10496
86
13 1313
Po
un
ds
of
Milk
Po
un
ds
of
Fe
ed
* Assumes a ration containing 0.78 Mcal/lb of dry matter* Assumes environmental factors are constant.

Total number of milk cows and milk production per cow on dairy farms in the United States
0
5
10
15
20
25
30
1925
1930
1935
1940
1945
1950
1955
1960
1965
1970
1975
1980
1985
1990
1995
1999
Year
Co
ws
/Fa
rm(M
illio
ns
)
0
2
4
6
8
10
12
14
16
18
20
Milk
/Co
w(T
ho
us
an
d P
ou
nd
s)
Number of Cows Pounds/Cow
Compiled from: USDA Statistical Bulletin 303, 430 USDA Statistical Bulletin Entitled Milk: Final Estimates for Various Issues.
80’s + 2432 lb/c/y
90’s + 2989 lb/c/y

Consolidation!!!

Opportunity!!!

Other Industry Trends
• Many producers are building new facilities– Upgrading existing facilities– New facilities
• Urban encroachment is encouraging producers to relocate creating new dairy pockets– ID,NM,TX,KS,IA,IN,MI– Tax implications

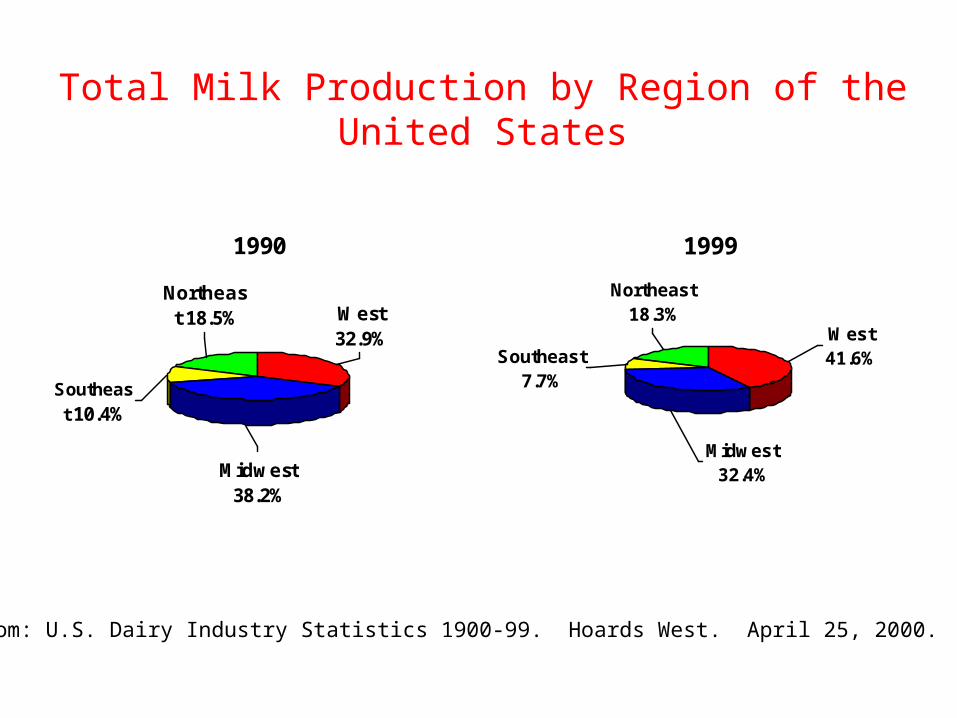
Total Milk Production by Region of the United States
1990
Midwest 38.2%
Southeas
t 10.4%
Northeast 18.5% West
32.9%
1999
Northeast 18.3%
Southeast 7.7%
Midwest 32.4%
West 41.6%
Adapted from: U.S. Dairy Industry Statistics 1900-99. Hoards West. April 25, 2000. Pg 50-51.

Other Industry Trends• Significant Premiums for Shipping a Tanker of Milk
– $0.10-1.80 cwt.• Dilute Fixed Assets over as Many Cows as Possible
– Milking parlor & Manure mgt.• Manage Employees• Partnerships & Business Structures
– Combining Resources
• Increase in the Number of Multiple Unit Operations
Where will the Cows Go?
• Social Acceptance• Environmental Pressure
– Large Tracts of Land
• Quality of Life• Climate
– Both Cold & Hot
• Economic Incentives– Milk Market– Local Incentives

Potential Locations for New Dairies
• Big 3-CA, ID, NM• High Plains-SD, NE, KS• Eastern Oregon• Panhandle of TX & OK• I-29 Corridor-SD, MN, IA, NE, KS, MO• Tri-State Area-IL, IN, OH• Upper Midwest• Western New York• Utah, Nevada, Montana & Wyoming

Who’s Building These New Dairies?
• Expansion of Existing Operations
• Relocations– CA– Other States– Immigrants
• Unknown Entities or Investor Groups– Business Structure Changes

Limitations to Expansion or Relocation
• Capable Managers• Ability to Obtain Permits
– Clear Definition of Requirements– Permits Held Up in Court
• Social Acceptance• Technical Support
– Engineers, Contractors, Technicians, Management Specialist

Effect of Herd Size on Annual Ownership Costs Per Cow for a Double-8 Herringbone
$691
$401
$304$255 $226
0
100
200
300
400
500
600
700
100 200 300 400 500
Herd Size (total cows)
An
nu
al P
arlo
r O
wn
ersh
ip
Co
sts
per
Co
w
Source: Craig Thomas, Michigan State University

Investment in Facilities and Livestock
Number of Lactating Cows
Housing Type Investment per Lactating Cow
100 Freestalls $6,582
600 Freestalls $5,105
2400 Freestalls $4,751
2400 Dry-lot $3,932
KSU: Dairy enterprise budgets, 2001

Summary
• The dairy industry at the farm level is consolidating very rapidly.– 8.2% of the herds produce 57% of the milk
51% of the cows
• New dairy pockets are developing rapidly– Relocating dairies– Expansion of existing dairies

Summary
• Business structures are changing• Dilute the cost of facilities over as many
cows as possible• Shortage of people with the management
skills needed to run a large dairy• Limited number of places where large
dairies can be built• Volume and quality premiums

Thank You!


