Vol46, No 3 August 1993 Journal of the Society of Dairy Technology Dairy markets and marketing in Europe IAN GORDON GIRACT, 1290 VersoidGeneva, Switzerland INTRODUCTION It is my great pleasure on this 50th anniversary year of the founding of the Society of Dairy Technology to be able to share with you some of the work carried out by the GIRA group in the last 25 years analysing and forecasting agri-food markets in Western Europe. I can, of course, touch only lightly on a subject as large as that of dairy markets and marketing approaches in Western European countries. I thus propose to limit my analysis to the core countries of Western Europe which I shall treat as the United Kingdom, Germany, France, Italy and Spain, together with the Netherlands, which, although smaller, is also a particularly important pro- ducer of dairy products. From the range of GIRA’s multiclient and single client work in the sector, I have drawn extensively on our report Dairy Products in European Supermarkets. At the time of this report data were not available for historical comparative trends of East and West Ger- many and so, where Germany is shown in subsequent tables and graphs, the past data will refer to West Germany while forecasts will be for the united country. The milk products which I shall consider are the following: milk, cream, yellow fats, fer- mented milks, dairy desserts, fromage frais and cheeses in general. These products are found in all of the European countries which I shall consider; only the fromage frais sector is essentially concentrated on France, UK and Italy, cottage cheese in the UK having been separately considered within the cheese sector. CONSUMPTION OF DAIRY PRODUCTS Considering first the total expenditure on dairy products as a percentage of total food expenditure, Fig. 1 shows that expenditure generally varies between 12 and 13% of total food expenditure and the two outlyers are Italy, with an expenditure of less than lo%, and the Netherlands, where it is greater than 20%. These differences are explained by varia- tions in consumption per capita. Figure 2 shows that with an average index of 100, consumption in Italy is only 70 while that in the Netherlands is 165. Nevertheless, this is somewhat misleading since the countries with the highest consump- tion are those which consume dilute milk products, such as milk itself, while those of relatively low consumption are larger than average consumers of concentrated products such as cheese. You will note that, on average, GIRA forecasts a growth in con- sumption of milk products of some 10% between 1989 and the year 2000. The point concerning different manners of consuming milk products is further illustrated in Fig. 3, showing in percentage the make up of consumption of each of the forms of milk in each of the countries. Particularly notable is the high consumption of liquid milk in the UK and Spain, the former being explained by the traditions of school milk and doorstep delivery coupled with a breakfast cereal eating habit. Spain should be noted as atypical for a southern country, and this ‘northern food habit’ characteristic in Spain has been shown by GIRA in a number of other food sectors. When a similar figure is produced (Fig. 4) showing the consumption of milk products by value, naturally milk takes a much less pre- dominant role and generally it is cheese which assumes an equal or, in the case of Italy, France and Germany, an even more import- ant role. Fig. 1. Dairy products: percentage of total food expenditure: UK, Netherlands, Germany, France, Italy, Spain. Source: GIRA. Fig. 2. Dairy products: per capita consumption, 1980-1989- 2000. Source: GIRA. 71
Transcript
Vol46, No 3 August 1993 Journal of the Society of Dairy Technology
Dairy markets and marketing in Europe
IAN GORDON GIRACT, 1290 VersoidGeneva, Switzerland
INTRODUCTION It is my great pleasure on this 50th anniversary year of the founding of the Society of Dairy Technology to be able to share with you some of the work carried out by the GIRA group in the last 25 years analysing and forecasting agri-food markets in Western Europe.
I can, of course, touch only lightly on a subject as large as that of dairy markets and marketing approaches in Western European countries. I thus propose to limit my analysis to the core countries of Western Europe which I shall treat as the United Kingdom, Germany, France, Italy and Spain, together with the Netherlands, which, although smaller, is also a particularly important pro- ducer of dairy products.
From the range of GIRA’s multiclient and single client work in the sector, I have drawn extensively on our report Dairy Products in European Supermarkets. At the time of this report data were not available for historical comparative trends of East and West Ger- many and so, where Germany is shown in subsequent tables and graphs, the past data will refer to West Germany while forecasts will be for the united country.
The milk products which I shall consider are the following: milk, cream, yellow fats, fer- mented milks, dairy desserts, fromage frais and cheeses in general. These products are found in all of the European countries which I shall consider; only the fromage frais sector is essentially concentrated on France, UK and Italy, cottage cheese in the UK having been separately considered within the cheese sector.
CONSUMPTION OF DAIRY PRODUCTS
Considering first the total expenditure on dairy products as a percentage of total food
expenditure, Fig. 1 shows that expenditure generally varies between 12 and 13% of total food expenditure and the two outlyers are Italy, with an expenditure of less than lo%, and the Netherlands, where it is greater than 20%.
These differences are explained by varia- tions in consumption per capita. Figure 2 shows that with an average index of 100, consumption in Italy is only 70 while that in the Netherlands is 165.
Nevertheless, this is somewhat misleading since the countries with the highest consump- tion are those which consume dilute milk products, such as milk itself, while those of relatively low consumption are larger than average consumers of concentrated products such as cheese. You will note that, on average, GIRA forecasts a growth in con- sumption of milk products of some 10% between 1989 and the year 2000.
The point concerning different manners of consuming milk products is further illustrated in Fig. 3, showing in percentage the make up of consumption of each of the forms of milk in each of the countries. Particularly notable is the high consumption of liquid milk in the UK and Spain, the former being explained by the traditions of school milk and doorstep delivery coupled with a breakfast cereal eating habit. Spain should be noted as atypical for a southern country, and this ‘northern food habit’ characteristic in Spain has been shown by GIRA in a number of other food sectors.
When a similar figure is produced (Fig. 4) showing the consumption of milk products by value, naturally milk takes a much less pre- dominant role and generally it is cheese which assumes an equal or, in the case of Italy, France and Germany, an even more import- ant role.
Fig. 1. Dairy products: percentage of total food expenditure: UK, Netherlands, Germany, France, Italy, Spain. Source: GIRA.
Vol46, No 3 August 1993 Journal of the Society o fDai ry Technology
general conclusions still stand with the UK and Netherlands being predominantly pas- teurized milk environments; France being essentially an ultra high temperature (UHT) land, though fresh milk is making inroads; and the other countries being approximately 50 : 50 between the two processing types.
The major development in the last five years has been the increase in semi-skimmed milk (Fig. 6). Semi-skimmed milk occupies a par- ticularly important place in France at 74% of the total consumption and 57% in the Nether- lands, while the six country average is only some 28%. It is at least arguable that develop- ment of semi-skimmed milk in France is in part linked to the UHT phenomenon, since the view is held that UHT semi-skimmed milk has a fuller mouthfeel than the pasteurized product of the same fat concentration.
Consumption of cream is relatively low at approximately 1.8 kg per person (Fig. 7).This is expected to grow, however, to 2.1 kg by the year 2000, due both to the growth of products offering the qualities of cream but with lower fat contents and the development of UHT and aerosol products. Strikingly, Germany is a major consumer of cream, at 280% of the norm, while Spain is a very minor consumer at some 18% of the norm. In general, fresh pasteurized cream represents some 60% of consumption, with UHT cream representing most of the rest. Major differences to this pattern occur in Italy and Spain where UHT has a much more important place; this effect is
I now turn to the consumption of individual sectors of the milk universe. Figure 5 shows the consumption of liquid milk per capita to the year 2000. We see movements towards a norm of about 72 kg of liquid milk, though we expect the UK, Netherlands and Spain to be above this level by the year 2000 and the other three countries below it.
At an earlier SDT conference. I had the pleasure Of presenting Some On both the packaging and the preservation approach
Fig. 6 . Breakdown of liquid milk consumption by fat content. Source: GIRA.
for milk and am happy to say that those
Fig. 5. Per capita consumption of liquid milk. 198&1989- 2000. Source: GIRA. Source: GIRA.
Fig. 7. Per capita consumption of cream, 1980-1989-2000.
72
Vol46, No 3 August 1993 Journal of the Society of Dairy Technology
Fig. 11. Distribution of fermented milk products. Source: GIRA.
almost certainly due to the relatively underde- veloped chilled chains and refrigerator owner- ship in those two countries.
When we look at consumption of yellow fats (Fig. 8), there is a striking north/south divide with France falling neatly in between the two: high consumption in the north, low in the south. The reasons are associated both with the use of olive and other oils in southern Europe and with the use of yellow fats and butter on bread in the north. The actual distribution between butter and margarine based products is, however, quite different, as shown in Fig. 9. The UK, Netherlands and Spain are essentially margarine consumers, while the other countries are butter eaters. In general, the ‘light proposition’ has made relatively little impact, ranging from 617% of the total yellow fats market, the most import- ant penetration being in the Netherlands.
Consumption of fermented milks (Fig. 10) shows a wide range of different tendencies, but a general boom in this, the most exciting part of dairy industry growth. We expect average consumption to move from 10.2 kg to 15.7 kg-a 50% increase-to the year 2000 since the products meet a whole series of desires for the consumer. They are seen as nutritionally positive, with a natural image, as convenience foods and with a wide range of tastes to meet differing consumer preferences. Currently, the Netherlands is clearly ahead of the average European consumption, in part due to its consumption of buttermilk. France is also already above the forecast norm, due at least in part to the dynamism of its own producers in promoting this sector through the 1970s and 80s.
Again, there is a significant range in the types of presentation of fermented milks (Fig. 11). Thus the consumption of drinking fermented milks is particularly concentrated in the Netherlands and Germany, while there are wide variations in the appreciation of natural unflavoured yogurts, with France, Spain and the UK leading the field and Germany having a very small representation. Meanwhile flavoured and fruit-containing yogurts are important in all countries other than the Netherlands.
Fig. 12. Per capita consumption of dairy desserts, 1980- 198!3-2000. Source: GIRA.
13
Vol46, No 3 August 1993 Journal of the Society of Dairy Technology
Turning to dairy desserts (Fig. 12), the Netherlands is a quite different market to all the rest, with France being the second import- ant country and growing relatively rapidly.
When fromage frais is considered (Fig. 13), Germany and France are the two important markets, Germany being the specialty quark market. This came from a background of being an important ingredient for the manu- facture of cheesecake in the home. Consump- tion is also growing rapidly in the Nether- lands. In both France and Germany the great majority of the products are unflavoured soft cheese, while in all the other countries, fruit flavoured products are the norm.
Finally, the cheese market (Fig. 14) is forecast to show growth in all countries, especially in France and Germany. As men- tioned before, France and Italy have a signifi- cantly overproportional consumption of cheese. I shall only touch lightly on this complex sector, itself subject of a complete report, Cheese 2000. Again, there is a major difference between the UK and the Nether- lands, with very high proportions of hard cheese consumption, and other markets where the hard cheese sector is at 50% or less of the total cheese sold. France, on the other hand, is atypical in consuming much more than the average quantity of cheeses. Other subsectors include processed cheese, goat and sheep cheese and herb flavoured cheeses.
Fig. 14. Per capita consumption of cheese, 1980-1989-2000. Source: GIRA.
MARKETING OF DAIRY PRODUCTS
A number of factors influence the marketing of dairy products, not the least of which is current and proposed legislation, which I will not elaborate on. Even more important are the consumer’s desires, cultural background, attitudes towards nutritional convenience and different taste profiles. In considering the marketing of dairy products, these factors must be taken into account, as well as the concept expressed by GIRA as the search for authenticity, ie, products which have particu- lar cultural roots or can lay particular claim to biological or ecological features. This particu- lar feature is translated in different ways in the different subsectors. Thus in milk we see farm produced milk and organic milks, the devel- opment of fresh pasteurized milks, a certain loss of position of some UHT milks, despite their convenience, and the re-emergence of some glass bottled milks, eg, in France and Italy, due to ecological concern.
Similarly, in the yellow fats sector there is a higher added-value sector of farm made butter and the possibility of gaining market share with a waxed paper wrapping signalling authentic ‘home made’ production. A similar pattern is seen in the chilled products sector and the development of ‘old style’ products: a number of products being offered in glass and a number of dairy desserts which are being positioned as ‘almost home made’.
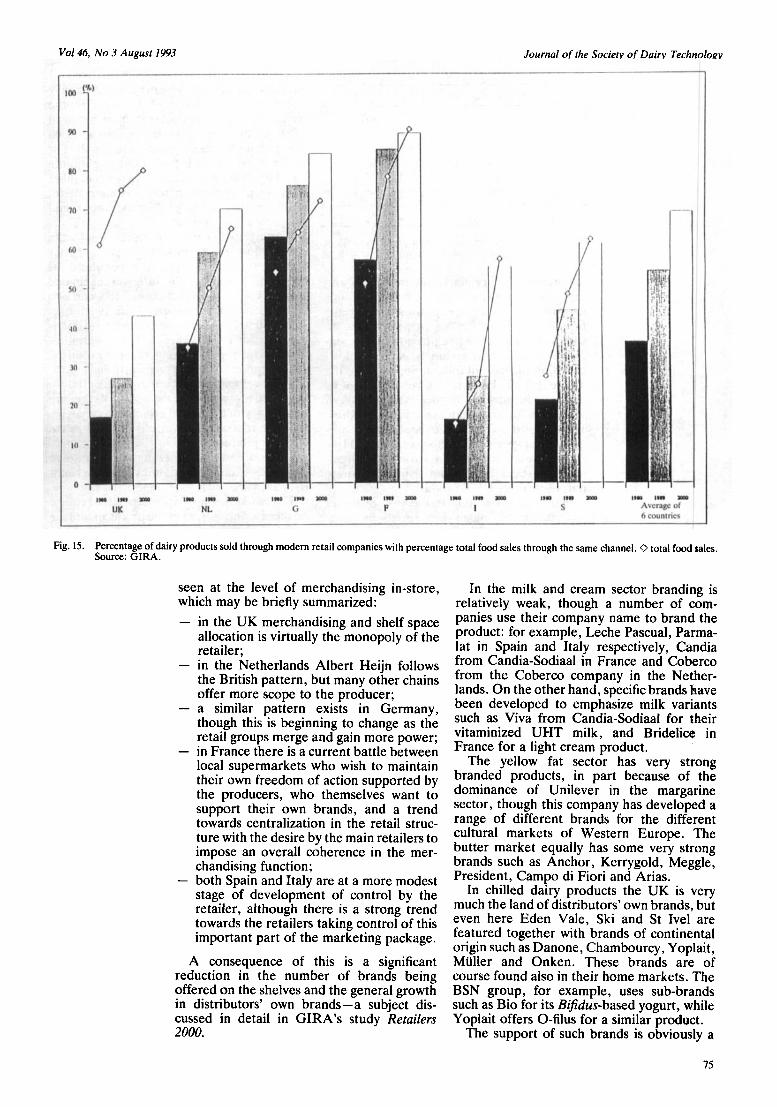
However, the key factor is the distribution chain, particularly the influence of the modern hyper- and supermarket sector on availability and consumption of these products- especially chilled dairy products. The rela- tionship between producer and retail multiple is particularly important. Total sales of dairy products through retail multiples in the EC is of the order of some ecu 26bi0, ie, 53% of the total household sales. The pattern of these sales (Fig. 15) is very similar to Fig. 4 showing the distribution of sales by product value, except in the UK where doorstep milk deli- very modifies the sales distribution.
Thus, in general, cheese represents the most important part of the modern retailer’s turnover in dairy products with some 37% of total, while milk represents 21% and the total range of chilled dairy products, 23%. This should be compared with only 16% of the total household expenditure on dairy products being directed towards these chilled products. This underlines the predominant role of the supermarket in this subsector, which is both dynamic and offers the most interesting margins.
The question of marketing mix varies signi- ficantly by country and is particularly influenced by the relationship between distri- butor and producer and the role of distribu- tors’ own branding. These differences are
14
Vol46, No 3 August 1993 Journal of the Society of Dairy Technology
Fig. 15. Percentage of dairy products sold through modem retail companies with percentage total food sales through the same channel. 0 total food sales. Source: GIRA.
seen at the level of merchandising in-store, which may be briefly summarized: - in the UK merchandising and shelf space
allocation is virtually the monopoly of the retailer;
- in the Netherlands Albert Heijn follows the British pattern, but many other chains offer more scope to the producer;
- a similar pattern exists in Germany, though this is beginning to change as the retail groups merge and gain more power;
- in France there is a current battle between local supermarkets who wish to maintain their own freedom of action supported by the producers, who themselves want to support their own brands, and a trend towards centralization in the retail struc- ture with the desire by the main retailers to impose an overall coherence in the mer- chandising function;
- both Spain and Italy are at a more modest stage of development of control by the retailer, although there is a strong trend towards the retailers taking control of this important part of the marketing package.
A consequence of this is a significant reduction in the number of brands being offered on the shelves and the general growth in distributors’ own brands-a subject dis- cussed in detail in GIRA’s study Retailers 2000.
In the milk and cream sector branding is relatively weak, though a number of com- panies use their company name to brand the product: for example, Leche Pascual, Parma- lat in Spain and Italy respectively, Candia from Candia-Sodiaal in France and Coberco from the Coberco company in the Nether- lands. On the other hand, specific brands have been developed to emphasize milk variants such as Viva from Candia-SodiaaI for their vitaminized UHT milk, and Bridelice in France for a light cream product.
The yellow fat sector has very strong branded products, in part because of the dominance of Unilever in the margarine sector, though this company has developed a range of different brands for the different cultural markets of Western Europe. The butter market equally has some very strong brands such as Anchor, Kerrygold, Meggle, President, Campo di Fiori and Arias.
In chilled dairy products the UK is very much the land of distributors’ own brands, but even here Eden Vale, Ski and St Ivel are featured together with brands of continental origin such as Danone, Chambourcy, Yoplait, Muller and Onken. These brands are of course found also in their home markets. The BSN group, for example, uses sub-brands such as Bio for its Bifidus-based yogurt, while Yoplait offers 0-filus for a similar product.
Fig. 16. Advertising expenditure as a proportion (%) of sector turnover (milk and cream). Source: GIRA.
12
10
9
5
major part of dairy marketing in the UK and Figs 16-19 illustrate some features of this expenditure as a proportion of sector turnover at retail selling prices. Figure 16 shows that above the line promotional expen- diture in milk and cream is generally low, except in the case of milk in Spain where the market leader, Pascual, is investing 6% of its turnover in advertising to generate sales of milk and for corporate publicity purposes. With regard to cream, expenditure is fre- quently on special subsectors such as UHT or aerosol cream, though here Parmalat is invest- ing substantially, again for corporate purposes, in its UHT product.
Figure 17 shows that in the case of butter and margarine, again two situations exist: margarine has the highest ratio of expenditure
I S
13
4
2 0 9
5 8
- 3
-I---
- - - 5
12
...
Fig. 18. Advertising expenditure as a proportion of sector turnover: chilled and cheese.
76
Journal of the Society of Dairy Technology
on advertising to turnover in the sector largely due to the dominance of Unilever in the sector; this and other operators have managed to establish strong branded positions which they defend by means of consumer pull. For butter, expenditure is particularly high in the UK, largely because there are a small number of major players competing for brand share, while in the south of Europe the brand situation is very fragmented.
Turning to the fresh products, this is the second most important sector in general after margarine, with a typical expenditure of between 2% and 2.5% of turnover, again due to a very intensive competition between two or three major brands per country and, in some countries, major competition with distri- butors’ own brands (Fig. 18). Furthermore, there is regular launching of new products, again supported by heavy advertising.
The level again is particularly high in Italy - nearly 10% -where all the major players are investing with the aim of establishing a yogurt tradition in a country which is not well aware of these products.
Cheeses, on the other hand, operate at about 1.5% and the variations between coun- tries are very small.
The marketing approach depends of course on the size and culture of the producer and the policies of the retailer in each country. In terms of producers, there are three different types of operator: the international players are essentially NestlC in chilled products (Chambourcy) and cheeses, Kraft in yellow fats and cheeses, Unilever in yellow fats and BSN in chilled products (Danone) and cheeses.
Of these four only Unilever and BSN have a significant presence across all countries exa- mined in one key sector-yellow fats for Unilever and chilled dairy products for BSN. All the others have gaps in their offer.
Fig. 19. Distributors’ own brands as a proportion (%) of total sales. * Products simply bearing the retailer’s label are not considered ‘own brands’. Source: GIRA.
Vol46, No 3 August 1993 Journal of the Society of Dairy Technology
The second level then is a number of national operators: - in the UK: Northern, Unigate and Dairy
- in the Netherlands: Melkunie, Campina,
- in Germany: Sudmilch, Hochland, Bauer,
- in France: Sodiaal, ULN, Besnier and
- in Italy: Parmalat, Sitia Yomo; - in Spain: Pascual, Uniasa, Ilas, Lesa.
The final feature of markets for dairy products is the development of distributors’ own brands. Figure 19 shows the degree of
Crest;
Coberco and Friesland/Frico/Domo;
Muller ;
Bongrain;
penetration of distributors’ own brand in each of the sectors we have considered in the supermarket distribution chain. It will be noted that the UK is dramatically more orientated to this form of branding than any other country, with only milk in Germany and France approaching UK levels of own brand percentage. Given the continual development of distributors’ own brands, especially in France, Germany and the Netherlands, we would expect this pattern to change in favour of this form of branding during the 1990s, with the yellow fats sector proving most resistant to such change and BSN holding its own with its branded chilled dairy products.
Milk production
P C THOMAS Central Office, The Scottish Agricultural College, Edinburgh EH9 3JG
This paper outlines some of the factors likely to influence the development of the United Kingdom dairy industry over the next decade. It considers the role of non-European Community countries in European milk supply and utilization, the impact of changing agricultural policies and the strategies available to dairy farmers to respond to the challenges that lie ahead. It is concluded that while Eastern European countries may have long term importance as sources of low cost milk production the influences of changing agricultural policy and marketing frameworks within the EC will have a more immediate and more significant impact on UK dairy farmers. It is envisaged that medium term developments in the U K will include an increased variety in the linkages between producers and retailers and producers and manufacturers; some resurgence in farm- based manufacturing; increased emphasis on milk compositional quality and manufacturing characteristics; continued pressure to reduce unit costs of farm production; and a movement towarak lower input, less intensive systems of production.
INTRODUCTION When the Society of Dairy Technology was established in 1943 the founders could hardly have planned that the 50th Anniversary Con- ference would take place at a time of unpre- cedented uncertainty for the dairy industry, but that has proved to be the case. Against that background this paper considers the role of non-European Community countries in European milk supply and utilization, the impact of EC and UK agricultural policies, and the strategies of UK dairy farmers to respond to the challenge that lies ahead.
EUROPEAN MILK SUPPLY AND UTILIZATION Outside the EC the major milk producing and consuming countries in Europe are those within the European Free Trade Association (EFTA) and those of the former Eastern European block. Both groups of countries could have a significant influence on the EC dairy industry either through ultimate membership of an expanded Community or,
more immediately, through an increased con- tribution to the 5% or so of world dairy production that is traded on the international market. Alternatively, both groups of countries could offer potential as new markets for the existing 12 EC Member States.
In recent times EFTA has moved closer to the EC through signature of the European Economic Area Free Trade Treaty, and four countries- Austria, Finland, Sweden and Switzerland - have applied for EC member- ship. No Eastern European country has yet submitted a similar application, but Hungary, Poland and the former Czechoslovakia have signed Association Agreements which set out EC membership as a long term objective. It has been made clear, however, that no country will be able to join the Community without a large degree of economic and political harmonization. For Austria, Finland, Sweden and Switzerland this may be achiev- able by the late 1990s, although the unqr- tainty of public opinion in some of these