42
Dairy sector in 2021: Consumer trends, market and innovations Daniel Álvarez, Clúster Alimentario de Galicia 07.07.2021

Dairy sector in 2021: Consumer trends, market
and innovations
Daniel Álvarez, Clúster Alimentario de Galicia
07.07.2021

Introduction
▪ Goal: Present market data, consumer preferences and innovations in the dairy and alternative-dairy sector,special focus on health.
▪ Geographical focus: Europe and AHFES countries (France, Ireland, Portugal, Spain, United Kingdom).
▪ Content: Production, value and volume of sales, new products development, main positionings, consumertrends and market health claims.
▪ Main information sources: Innova Database, Innova Markets Insights, GlobalData, and EuropeanCommission databases, among others.
▪ First report of a series of “consumer, market and innovation reports” that represent one of the severalinnovation support services for SMEs implemented in the scope of the project AHFES.

Global and European market

▪ The dairy sector is growing worldwide.(strong demand by India, Pakistan).
Per capita consumption of processed and fresh dairy products
(Kg/capita/year)
0
5
10
15
20
25
30
35
40
45
50
2017-19 2029 2017-19 2029 2017-19 2029 2017-19 2029 2017-19 2029 2017-19 2029
European Union United States India Pakistan China World
Processed dairy products
Fresh dairy products
Source: OECD-FAO
Dairy production globally
0
50
100
150
200
250
300
350
400
Asia Europe NorthAmerica
SouthAmerica
Africa Oceania CentralAmerica
2019 estim. 2020 estim.
World milk production by region (M t)
Source: UN (FAO)
▪ Milk is one of the most valuable products globally.
▪ Global milk production reached ~906 M t in 2020(+2.0% vs 2019).
▪ Asia is the top milk producer, followed by Europe.

136,163
69,690
38,236
34,607
22,740
16,038
14,597
200,964
150,746
13,151
19,076
12,265
5,232
4,267
3,138
7,145
8,638
1,339
Milk
Cheese
Yogurt
Drinkable Yogurt
Butter & Spreadable Fats
Dairy-Based & Soy-Based Desserts
Cream
Soymilk & Soy Drinks
Fromage Frais & Quark
Dairy market value and volume
Value (US$M) Volume (kg M)
Source: GlobalData
▪ Milk is the main dairy product in terms of market value and volume, followed by cheese and yogurt.
▪ A growth of 4.9% in volume and 5.2% in value for milk expected (2019-2024).
Dairy production globally
Volume growth (US$M), 2019–24 Value growth (US$M), 2019–24
Top three CAGR 2019–24
Drinkable yogurt +7,668 +10.2%
Yogurt +3,994 +3.9%
Soy milk/drinks +1,062 +2.8% Butter/spreadable fats +8,352 +4.4%
Source: GlobalData
Top three CAGR 2019–24
Drinkable yogurt +31,142 +12.7%
Yogurt +34,281 +8.3%
▪ Drinkable yogurt is forecasted to be the fastest-growing category.

Dairy production in Europe
▪ EU accounts with 38% share of global dairy sales value.
▪ EU produces ~25% of the world's total cow's milk.
▪ Germany, main milk producing country.
▪ 1/3 of milk production is traded within the EU as dairy products.
Product 2017 2018 2019 2020
Drinking milk 30,274 29,526 28,613 29,384
Cream for direct consumption 2,777 2,702 2,764 2,780
Acidified milk (yogurts and other) 8,128 8,190 8,120 8,197
Butter 2,153 2,183 2,273 2,323
Cheese 10,169 10,253 10,454 -*
Milk and cream powders, excl. SMP
(WMP)810 792 806 795
Skimmed milk powder (SMP) 1,513 1,520 1,505 1,556
Drinks with a milk base 1,244 1,758 1,792 -
Whey (in powder or in block) 1,867 1,943 2,019 -
Caseins and caseinates 121 126 128 -
Other fresh products (milk-based
desserts, ice cream)2,270 2,101 2,214 -
EU-28 dairy production (thousands t)
Source: CLAL, Eurostat
*Cells with a dash indicate no data available
Germany
France
UK
PolandNeetherlands
Italy
Spain
Rest EU-28
Source: Eurostat
EU-28 main milk-producing countries

100
88 8694
118
100 102 95101
122
100
103 106109
112100
103
107 111
115
0
20
40
60
80
100
120
140
2015 2016 2017 2018 2019
Milk Launches Dairy Launches Milk Sales Dairy Sales
Ind
exe
dV
alu
es
CAGR
2015 to
2019
4.3%
5.1%
2.9%
3.5%
Relative development of Milk and Dairy launches and sales in Europe
Source: Innova Market Insights
Dairy sales in Europe
▪ Positive growth of milk sales and launches 2015-2019 (+2.9% and +4.3%).
▪ Positive growth of dairy sales and launches 2015-2019 (+3.5% and +5.1%).

▪ International dairy trade increased by 1.2% in 2020.
▪ China: world's largest importer.
▪ New Zealand, the US and the EU, main suppliers of the international import demand.
International trade of dairy products globally
Composition of global dairy exports (million tonnes, milk equivalent)
0
5
10
15
20
25
Butter Cheese SMP WMP Whey Others
2019 estim. 2020 estim.
Source: UN (FAO)
4.1%
1.9%
8.0%
0.5%
-6.0%
-2.3%

EU-28 main dairy export destination countries (thousands t)
Source: Agri-Food Data Portal (European Commission)
0
200
400
600
800
1.000
1.200
Packedmilk
Cheese SMP Whey WMP Butter &other fats
Yoghurt&
buttermilk
Cream
2018 2019 2020
EU-28 main dairy products export (thousands t)
Source: CLAL, Eurostat
▪ EU one of the world's top three players for dairy exports (New Zealand, US).
▪ EU world's biggest exporter of cheese.
▪ Japan top importer of cheese; China top importer of packed milk and SMP.
▪ EU exports expected to continue increasing.
International trade of dairy products in the EU

2020 Company name Country of Origin Dairy turnover (USD billion)*
1 Nestlé Switzerland 22.1
2 Lactalis France 21.0
3 Dairy Farmers of America US 20.1
4 Danone France 18.2
5 Yili China 13.4
6 Fonterra New Zealand 13.2
7 FrieslandCampina Netherlands 12.6
8 Mengniu China 11.9
9 Arla Foods Denmark/Sweden 11.8
10 Saputo Canada 11.3
11 DMX Germany 6.5
12 Unilever Netherlands/UK 6.4
13 Meiji Japan 5.9
14 Sodiaal France 5.7
15 Savencia France 5.6
Top companies globally
▪ Half of the companies in the ranking are European.

Healthy dairy new products development (NPD) and positionings

18
1413
87
6 65
43
0
2
4
6
8
10
12
14
16
18
20
% p
en
etr
atio
n
5.5%
5.0% 4.4%
Spoonable strawberry flavoured
yogurt (Ireland).
Dairy NPD in Europe
1. Spoonable yogurts
2. Semi-hard and hard cheese
3. Dairy based ice cream and frozen yogurt

Positioning in the European dairy market

Banana and peanut butter
flavoured skimmed fermented
milk product with protein
(Spain).
18
16 16 16
1312
7 7
5
4
0
2
4
6
8
10
12
14
16
18
20
% p
en
etr
atio
n
11.3%6.7%
12.0%
Health claims
▪ Passive health claims (free/no/low/reduced) are present in almost half of dairy launches.

Specific age groups
▪ Companies target specific age groups to cover particular health demands.
37
17
1513
13
12
12
77 5 No Additives/Preservatives
Gluten Free
Natural
Organic
High/Source Of Protein
Vitamin/Mineral Fortified
Bone Health
Added Calcium
Lactose Free
Low/No/Reduced Fat
Health claims in launches of dairy products for children 5-12 years
Strawberry and banana
flavoured yogurt drink, a
source of calcium for
bones, no added colours
nor artificial sweeteners
(United Kingdom).
0
20
40
60
80
100
120
140
160
180
Germany Sweden Finland Portugal Ireland
# o
f p
rod
uct la
un
ch
es
Launches with claims related to aging
Vitamin/Mineral Fortified
Added Calcium
Bone Health
Immune Health
Heart Health
Margarine, with a source of
calcium and vitamin D2,
ideal for people over 50
years of age, maintaining a
healthy bone structure
(Netherlands).

34
2825
9
4
0
5
10
15
20
25
30
35
40
% p
en
etr
ation
Dairy launches in AHFES countries (2016-2020)
Dairy NPD in AHFES countries
Spain France United Kingdom Portugal Ireland
1 Hacendado Auchan Morrisons Milbona Tesco
2 Carrefour Paturages Asda Continente Alpro
3 Dia President Alpro Pingo Doce Dairylea
4 Alteza Activia Marks and Spencer Mimosa Deluxe
5 Activia Casino Tesco Provamel Glenisk
Private labels
1/3 of European dairy market
7.6%
Top 5 brands in AHFES countries

Region1. No Additives/
Preservatives
2. Low/No/
Reduced Fat
3. High/
Source of protein4. Organic
5. Gluten
Free
6. No
added
sugar
7.
Digestive/
gut health
8.
Lactose
Free
9. Natural10. Bone
Health
Spain 8%* 13% 8%* 7%* 30% 5%* 7% 7%* 7%* 2%
Portugal 8% 20% 9%* 3% 19%* 9%* 8% 9%* 3%*
France 11%* 6% 4%* 18%* 3%* 4% 2%* 2%* 2%
United
Kingdom21% 19% 17%* 7% 11% 7%* 8% 3%* 5%*
Ireland 22% 21% 14%* 6% 13% 8% 8% 6% 4%
Top 10 Health Claims by country (2016-2020)
*growing trend
Colour code highlighting Top 1-3 health claims:
Percentages indicate the % of new products carrying the claim#1 #2 #3
Vanilla flavoured
creamer gluten
free, fat free
(United Kingdom).
Yogurt with mangoes,
passion fruit and
turmeric with no
additives (France).
Slices of matured
cow, sheep and goat
cheese with 38%
less fat. (Spain).
Main health claims in AHFES countries

Top trends
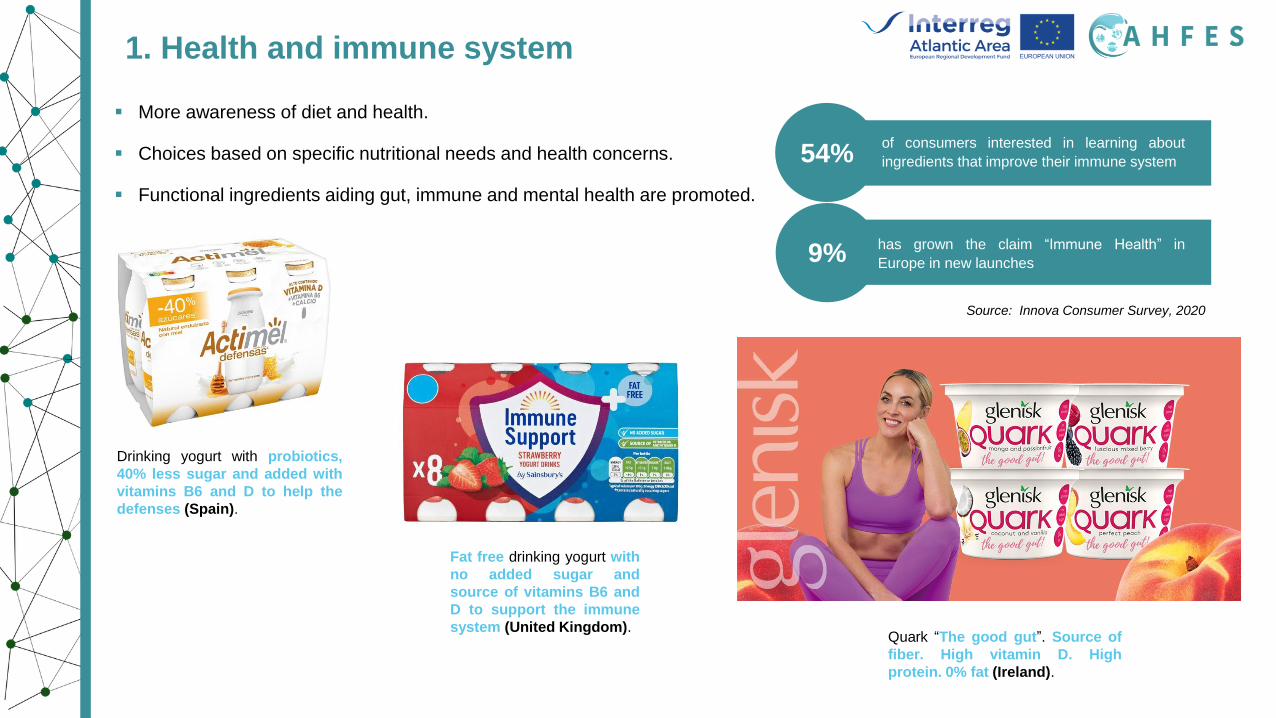
Quark “The good gut”. Source of
fiber. High vitamin D. High
protein. 0% fat (Ireland).
Drinking yogurt with probiotics,
40% less sugar and added with
vitamins B6 and D to help the
defenses (Spain).
Fat free drinking yogurt with
no added sugar and
source of vitamins B6 and
D to support the immune
system (United Kingdom).
1. Health and immune system
▪ More awareness of diet and health.
▪ Choices based on specific nutritional needs and health concerns.
▪ Functional ingredients aiding gut, immune and mental health are promoted.
54%
9%has grown the claim “Immune Health” in
Europe in new launches
of consumers interested in learning about
ingredients that improve their immune system
Source: Innova Consumer Survey, 2020

of global consumers found “more
ways to tailor their life and the
products they bought to their
individual style, beliefs, and
needs”
2 in 3
Source: Innova Consumer Survey 2020
Fermented milk, a natural
source of protein and
calcium, “important for
healthy bones and
teeth” (United Kingdom).
2. Personalised nutrition
Mango flavored yogurt drink
that contains 25 g protein,
fuel for your muscles. High
protein content. 0% fat
content. 0% added sugars.
No lactose. No coloring.
Protein contributes to the
maintenance and growth
of muscle mass (Portugal).
“This milk helps your
immune system by giving
it the vitamins and
minerals it needs.
Vitamins A, D, B12, B6,
B9, zinc and selenium
contribute to the normal
function of the immune
system.” (Spain).

Happiness
Calm/Relax
0,0%
0,1%
0,2%
0,3%
0,4%
0,5%
0,6%
0,7%
0,8%
0,9%
-20% -10% 0% 10% 20% 30% 40% 50% 60%
% s
ha
re o
f d
air
y &
da
iry a
lte
rna
tive
la
un
ch
es (
20
19
)
Average annual growth (CAGR 2017-2019)
“Mood Health Platforms” in dairy & dairy alternative launches (Global)
What’s next?
Established
“L-theanine for increased
cognitive performance, aids
with relaxation and sleep”
“We want to provide you with a healthier
and more sustainable solution to keep
you going. That's why we use
adaptogens in our products - to help
boost your immune system all the while
fueling your body”
3. Improved mood health
▪ Ingredients for an improved mood.

Cheese cubes rich in protein
with almonds and cranberries
(Portugal).
Kefir rich in protein and
probiotics. Source of
calcium, vitamins B2 and
B12. Portable 220 ml bottle
(France).
Rice drink, lactose free with
no added sugar and gluten
free. Portable 100 ml bottle
(France).
Cheese sticks, reduced
fat (United Kingdom).
4. On the go healthy snackification

Source: Innova Consumer Survey 2020
of global consumers say that they are interested in “learning
more about where their
food comes from and
how it is made”
3 in 5
Then
Now
NaturalNo additives
Nothing artificialOrganic
GMO freeMinimally processed
Real/recognizableShort ingredient lists
Dairy/meat alternativesSugar/salt/fat reformulation
Human/animal welfare Supply chain transparency
Plant-powered nutritionSustainably sourced
5. Transparency and origin
▪ Clean labeling describing the characteristics of the product respond to the consumer’s concern for the environment,ethical aspects and the own well-being.

Biogurte: Organic yogurt made with
ingredients of sustainable origin. Green Dot,
FSC and Ecocert certified. (Portugal).
La Fromagerie Milleret produces lactose
free cheeses made from milk that has
been collected locally, with an average
radius of 25 km around the cheese factory
in Franche-Comté (France).
5. Transparency and origin
▪ Clean labeling describing the characteristics of the product respond to the consumer’s concern for the environment,ethical aspects and the own well-being.

0
5
10
15
20
25
2016 2017 2018 2019 2020
% p
en
etr
atio
n
CAGR
(2016-2020)
3 %
Alternative dairy launches in Europe (2016-2020)
6. Plant based alternatives
▪ Growth of claims such as “plant-based” (44%), vegan (19%) and vegetarian (8%).
19%of consumers
globally
32%of consumers
globally
35%of consumers
globally
53%of consumers
globally
IT IS HEALTHIER
IT BRINGS VARIETY
TO MY DIET
IT IS BETTER
FOR THE PLANET
IT TASTES BETTER
Gluten Free
Lactose Free
Organic
Low/No/Reduced Fat
No Added Sugar
High/Source Of Protein
Vitamin/MineralFortified
Added Calcium
NoAdditives/Preservatives
Digestive/Gut Health
Health claims in alternative dairy products in Europe
11%
1%
Gluten
free
Lactose
free
Organic
9%
3%
Oat drink
(United Kingdom).
Cashew yogurt
(United Kingdom).Source: Innova Consumer Survey 2020

75% of the UK population
who use plant-
based alternatives also use
standard dairy milk (Mintel,
2020)
The US brand Live Real Farms has launched the first
line of beverages that contain a blend of fresh milk
and plant-based drinks.
7. Hybrid dairy
▪ Blend of dairy and non-dairy based products

Categories
Milk

Launches of milk per subcategory in Europe
(%)
Region1. Low/No/
Reduced Fat
2. High/
Source of
protein
3.
Organic
4. No
Additives/
Preservatives
5. Bone
Health
6. Gluten
Free
7. No added
sugar
8. Vitamin/
Mineral
fortified
9. Lactose
Free
10.
Natural
Spain 18% 13%* 9%* 8%* 8% 26% 6%* 12%* 20%* 13%*
Portugal 18%* 12% 9%* 4% 5% 12%* 7%* 20%*
France 6% 10% 33%* 9%* 7% 10% 5%*
United Kingdom 19% 41% 9% 32% 11% 10% 18% 19%
Ireland 40% 58% 13% 33% 16%* 7% 11% 18% 11%*
EUROPE 18% 15%* 13%* 9% 5% 8% 5%* 7% 13%* 5%
97,3
1,4 0,3
Cow Milk
Goat Milk
Sheep Milk
Top 10 health claims in AHFES countries
Skimmed milk with
omega 3 and low
in fat (Spain).
Launches and health claims
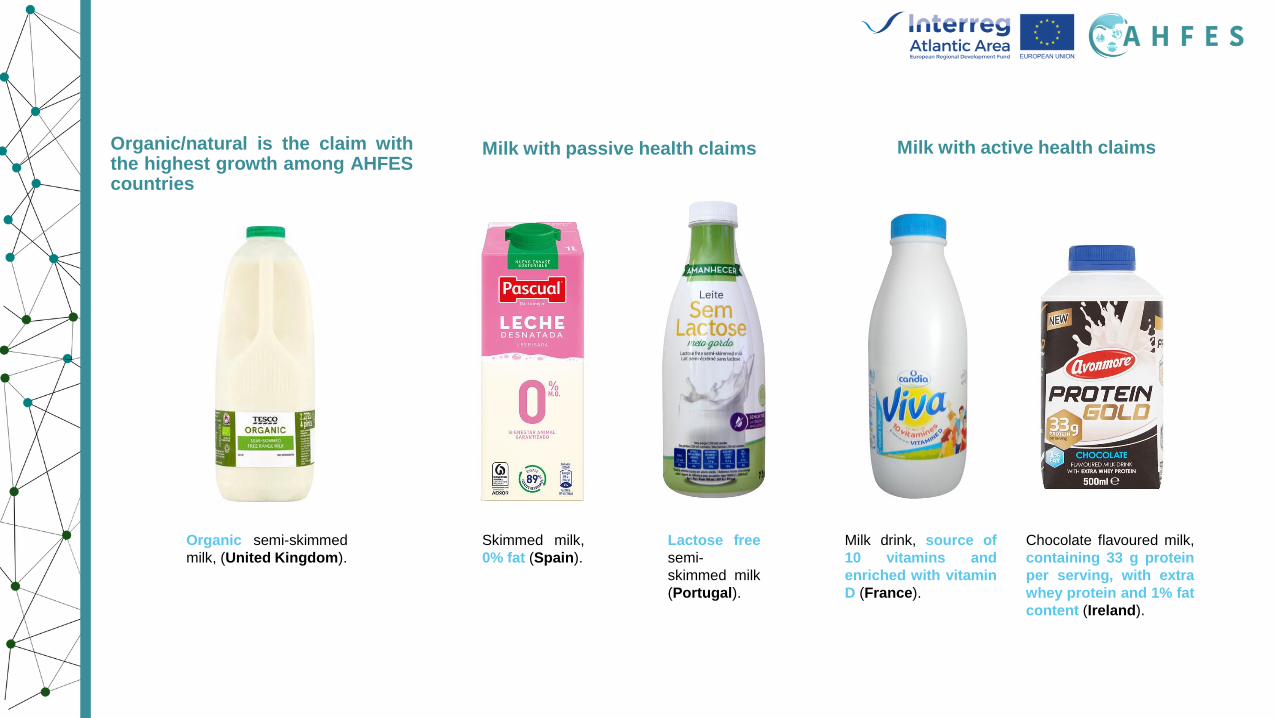
Organic semi-skimmed
milk, (United Kingdom).
Organic/natural is the claim withthe highest growth among AHFEScountries
Skimmed milk,
0% fat (Spain).
Lactose free
semi-
skimmed milk
(Portugal).
Milk with passive health claims
Chocolate flavoured milk,
containing 33 g protein
per serving, with extra
whey protein and 1% fat
content (Ireland).
Milk drink, source of
10 vitamins and
enriched with vitamin
D (France).
Milk with active health claims

Cheese

39
22
18
12
10Cheese - Semi-Hard& Hard
Cheese - Soft &Semi-Soft
Cheese - Fresh &Cream
Cheese - ProcessedCheese
Cheese - SoftCheese Desserts
Launches of cheese per subcategory in Europe (%)
Tomme de Savoie
semi-soft cheese from
cow’s milk (France).
Region
1. No
Additives/
Preservatives
2. Low/No/
Reduced Fat
3. High/
Source of
protein
4. Organic5. Bone
Health
6. Gluten
Free
7. No
added
sugar
8.
Vitamin/
Mineral
fortified
9. Lactose
Free
10.
Natural
Spain 14% 13% 11%* 3% 2% 4% 2%* 2%* 2%
Portugal 3%* 13%* 8% 2%* 9% 1%* 11%* 3%*
France 16%* 13% 15%* 56%* 3%* 5%* 4% 8%
United Kingdom 14% 13% 11%* 3% 2% 4% 2%* 2%* 2%
Ireland 20% 12% 7%* 2% 4% 5% 2% 4%* 4%
EUROPE 10% 7% 7%* 7%* 1% 8% 1% 1% 10%* 4%
Top 10 health claims in AHFES countries
Launches and health claims

Organic Matured sheep
cheese (Spain).
Raclette cheese slices bio
and without additives or
preservatives (France).
No additives/preservatives is the mostpopular claim in AHFES countries
Mild Irish grated coloured
cheddar cheese high in
protein (Ireland).
High/source of protein is the claim with a higher growth
Lactose free cheese
slices (Portugal).
“Free from” claims are recurrent claims
Mature white cheese with
50% less fat (United
Kingdom).

Yogurt

71
29
Spoonable Dairy Yogurt Drinking Yogurt/Fermented Beverages
Spoonable strawberry
flavoured fat free yogurt
(United Kingdom).
Launches of yogurt per subcategory in Europe (%)
Top 10 health claims in AHFES countries
Launches and health claims
Region1. Low/No/
Reduced Fat
2. No Additives/
Preservatives3. Gluten Free
4. High/
Source of protein
5.
Organic
6. No added
sugar7. Natural
8.Digestive/
Gut health
9.
Lactose
Free
10. Vitamin/
Minerals
fortified
Spain 28% 11%* 49% 10%* 11%* 14%* 8% 22% 5%
Portugal 45% 23%* 71% 38% 44% 35% 73% 26%*
France 12% 18%* 4% 7%* 21%* 3% 5%* 14% 7%
United
Kingdom39% 28% 17% 25%* 13% 15%* 9%* 22%
Ireland 33%* 13%* 39%* 13%* 4% 20% 5% 18% 7%*
EUROPE 20% 15% 12% 14%* 13% 6%* 6% 21% 6%*

Launches and health claims
Raspberry and Blackcurrant
flavoured yogurt low in fat
and high in protein (United
Kingdom).
Low/no/reduced fat is the most popular claim,protein growing
Vanilla flavoured creamy
Greek style yogurt with no
colourings or artificial
flavour (France).
No additives/preservativespresents a strong growth
High protein, 0% added
sugar, 0% fat and gluten
free unflavoured yogurt
(Spain).
Natural yogurt with no
added sugar and 0% fat
content (Ireland).
Other recurrent passive healthclaims
Coconut flavoured yogurt
containing 15 g of protein
(Portugal).

Dairy alternatives

55
23
14
8
Dairy Alternative Drinks
Spoonable Non-DairyYogurt
Margarine & OtherBlends
Cheese - Non-Dairy
Almond drink (Ireland).
Launches of dairy alternatives per subcategory in Europe (%)
Launches and health claims
Top 10 health claims in AHFES countries
Region1. Gluten Free
2. Lactose
Free3. Organic 4. Low/No/
Reduced Fat
5. High/
Source of protein
6. No Additives/
Preservatives
7. No
added
sugar
8.
Vitamin/
Minerals
fortified
9. Added
calcium
10.
Digestive/
Gut Health
Spain 64% 56% 42%* 32% 23% 23% 31%* 18% 18%
Portugal 70% 73% 44% 45% 38% 23%* 35% 26%* 26%*
France 43% 38% 59% 31% 31% 18%* 20% 14% 17%
United
Kingdom59%* 40%* 21% 29%* 22%* 29%* 18%* 36%* 33%*
Ireland 72% 57% 31% 40% 20% 37% 25% 38% 34% 13%
EUROPE 51% 51% 38% 28% 21% 20%* 22%* 21%* 19%*

Gluten free and organic
rice and coconut drink
(France).
No lactose oat drink
(Portugal).
Lactose free, gluten free andorganic are the most popular claims
No preservatives, lactose
free, gluten free vegan
slices (Spain).
Mango flavoured soy yogurt
with no added sugar
(Portugal).
Organic vegan spreadable
with rapeseed, coconut,
shea and almond (United
Kingdom).
Both active and passive health claims in plant-based alternatives are growing in all AHFES countries

Conclusions

▪ The global demand for dairy products is growing.
▪ EU is a major player globally in the dairy market.
▪ EU one of the top players regarding dairy products export.
▪ Yogurt is one the fastest growing category, specially in the drinkable form.
▪ Strong presence of ethical and convenience positionings and passive “free” health claims.
▪ Strong growth of organic and natural products with no additives or preservatives.
Great scope for innovation of healthy products in the dairy sector: healthy snacks, novel ingredientsnutrition- and mood-focused, plant-based alternatives, sustainable production and natural “free from”products.
Conclusions
Contact: [email protected]
Study available and more project information at: www.ahfesproject.com
Follow AHFES:
AHFES on Twitter AHFES on LinkedIn
Thank you for your attention!


