Straw/organic tonsAssume 0.5% of 50lb ration/day, milk strings Damaged feed 15.1 0.02 40 lb/ft^3 den
at 40 lb/cu ft or silage tonsImported manure, whey, other External inputs 0 0.00
10 cy loadsDry lot scrapings plus 20 0.12
imports to compost pile 10 cy loadsSubtotal 0.26
Hours per Day
Annual Manure ProdAcre-feet
Equivalent Days
Dairy Waste Pond Size Estimation
Page 2
5. Wash and Process Water Produced Annually Rate Use Gal/Day Ac/ft Percent
Gal/min Hr/day per yr of TotalMilking System Wash Water 200 0.22 21.3Milking System Backflush @ .25 gal/unit 165 0.18 17.6Milk Tank Wash Water 60 0.07 6.4
Milk claw Wash Water Gal H2O/cow 0.25 165 0.18 17.6Milkings/day 2
Sprinkler Pen Water 0 0.00 0.0
Milking Parlor Wash Water 5 1.00 300 0.34 31.9Recycled wash water, per day 0 0.00 0 0.00 0.0Vacuum Pump Water 0 0 0 0.00 0.0Air Comp/Milk Cooler Water 0 0 0 0.00 0.0Leaking troughs, other losses 0 24 0 0.00 0.0Spring flows to manure storage 0 24 0 0.00 0.0Flush System Added Water Calf pen cleanup 50 0.06 5.3
days/year 365Total Wash and Process Water 940 1.05 100.0
Gal/day Acre FeetSection IV. Rain Water Additions to Waste System
Rainfall Data for Discretionary DesignLocal average 36.0 Local average per SCWA 5.4 25-year, 24-hr storm
annual rainfall, inches isohyetal map, rev June 83. Inches @ 3.8*(local avg/25.5) @ Petaluma.10-year Wet-Winter 53.6 10-year wet winter prorated based on 46-year Petaluma data with
Dairy Pond Size Estimation - Data Summary SheetOcean View Dairy - Marvin L. Nunes 707.528.3545 17-Dec-123975 Mark West Station Road, Windsor CA 1:16 PM
Unconfined manure production 1.63 acre feetConfined manure production 7.79 acre feet 7.79 acre-feetTotal waste production 9.41 acre feetAdditions to the Confinement Waste Management SystemAnimal Bedding Makeup sand 0.02 acre feet
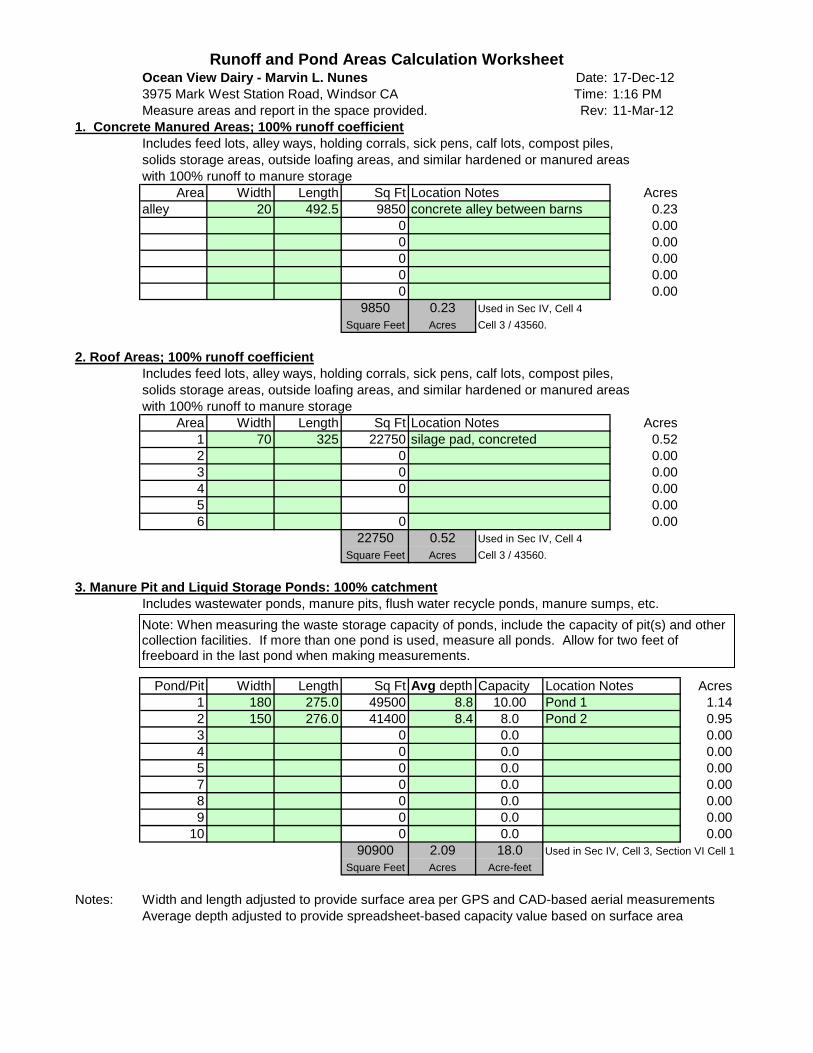
Runoff and Pond Areas Calculation WorksheetOcean View Dairy - Marvin L. Nunes Date: 17-Dec-123975 Mark West Station Road, Windsor CA Time: 1:16 PMMeasure areas and report in the space provided. Rev: 11-Mar-12
1. Concrete Manured Areas; 100% runoff coefficientIncludes feed lots, alley ways, holding corrals, sick pens, calf lots, compost piles,solids storage areas, outside loafing areas, and similar hardened or manured areaswith 100% runoff to manure storage
Area Width Length Sq Ft Location Notes Acresalley 20 492.5 9850 concrete alley between barns 0.23
0 0.000 0.000 0.000 0.000 0.00
9850 0.23 Used in Sec IV, Cell 4Square Feet Acres Cell 3 / 43560.
2. Roof Areas; 100% runoff coefficientIncludes feed lots, alley ways, holding corrals, sick pens, calf lots, compost piles,solids storage areas, outside loafing areas, and similar hardened or manured areaswith 100% runoff to manure storage
10 0 0.0 0.0090900 2.09 18.0 Used in Sec IV, Cell 3, Section VI Cell 1
Square Feet Acres Acre-feet
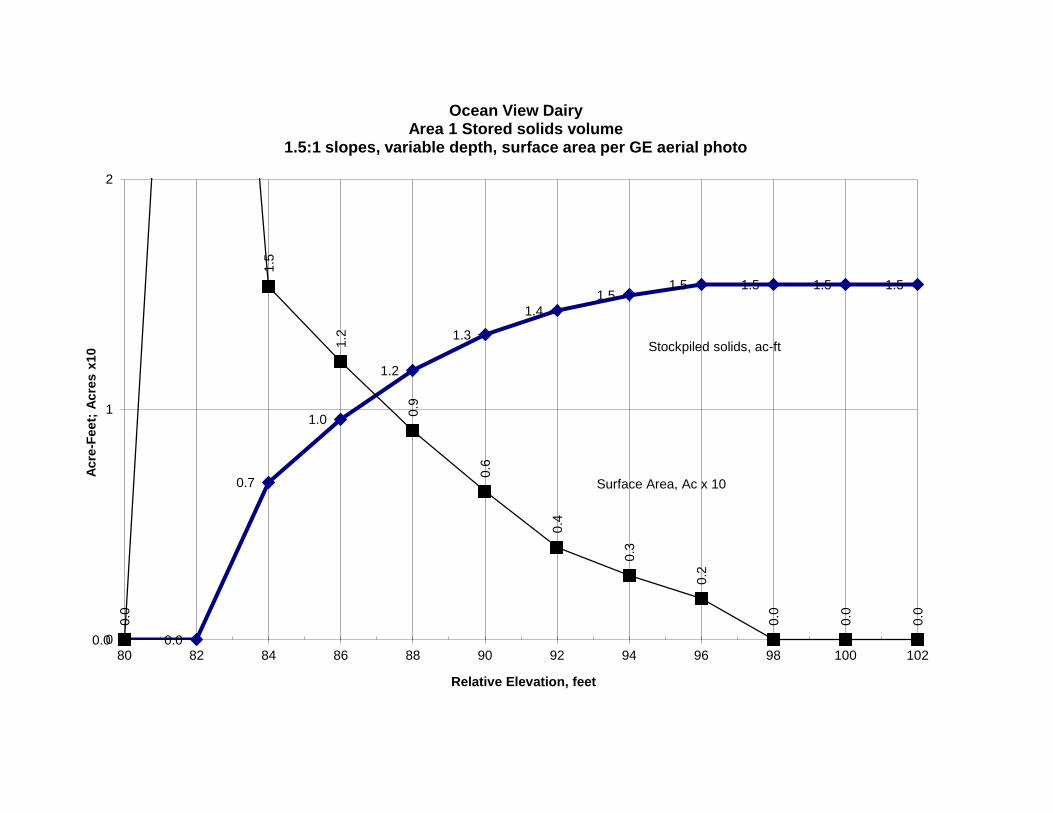
Notes: Width and length adjusted to provide surface area per GPS and CAD-based aerial measurementsAverage depth adjusted to provide spreadsheet-based capacity value based on surface area
Note: When measuring the waste storage capacity of ponds, include the capacity of pit(s) and other collection facilities. If more than one pond is used, measure all ponds. Allow for two feet of freeboard in the last pond when making measurements.
4. Non-Concrete Manured Areas Draining to StorageIncludes tributary areas of clean water around barns and corrals that drain to manure ponds.
This worksheet is intended to provide guidance for nutrient budgeting for management of manure produced by animals in both confined and unconfined conditions. It will partially fulfill facilities management plans as recommended by regulatory agencies. Complete the Producer and Area worksheets prior to entering nutrient bugeting information. Provide inputs as required in empty green-shaded boxes in the Nutrient Bugeting worksheet. Calculation results are shown in non-shaded boxes. Nutrient budgeting may include confined or unconfined animals, irrigated and non-irrigated land, fertilized or non-fertilized inputs, and may use lab or handbook data for stored manure nutrient values. Several runs of this computer spreadsheet worksheet will be needed to evaluate confined animal manures, unconfined animal manures, and individual fields, either on-site or off-site, because of the large number of possible nutrient input combinations. Take care when evaluating individual fields to include all inputs, and to eliminate duplicate accounting with such items as animals pastured elsewhere or fertilizer and irrigation water used elsewhere. Total ranch nutrient budgeting can be accomplished using total headcounts, acreages, etc., and will represent average conditions rather than site-specific conditions. Results are based on a large number of input assumptions, and represent general nutrient budgeting trends, rather than an exact detail accounting of site-specific conditions. Detailed assessments will require concentration sampling and quantity measurements of soil, forage, crops, irrigation water, stored manure, and other inputs and outputs to the nutrient input, waste management, and nutrient consumption systems.
Section IV. Annual Production of Animal Waste for All Livestock
1. Handbook Method Animal counts from the companion Producer worksheet are multiplied by the appropriate table values for N, P, and K above to determine nutrient production.
Table 4. Unconfined Animal Nutrients Table 5. Confined Animal NutrientsProduction based on Handbook Values Production based on Handbook Values
Unconfined Total Pounds of Nutrients Confined Total Pounds of NutrientsCubic Feet N P K Cubic Feet N P K
Nutrient concentration of manure depends on animal species and age, feed materials and additives, source of manure, storage method, length of storage, rainwater dilution, disposal method, and other factors. The most accurate nutrient budgeting estimates will be obtained if lab samples for nutrient concentration are taken from the storage area. A composite sample from several surface locations and depths within the storage is required for a representative value. The average table values shown from USDA-SCS Ag Waste Management Field Handbook are used for calculations if you do not provide site-specific nutrient concentrations.
Nutrient quantities stored in containment facilities are estimated in one of two ways: 1) USDA handbook N-P-K values are used with confined animal counts and manure production estimates obtained from the Producer worksheet. 2) If commercial lab analysis data for N-P-K is entered above, nutrient quantities are based on the lab concentration data times the pond storage volume obtained from the Producer worksheet. Note that total nutrient quantity estimates in storage facilities may be significantly different using the two different approaches. Lab data from the storage pond will tend to be most accurate. This is because factors affecting nutrient concentration are taken into account, including seasonal dilution, process and wash water, actual manure quantities collected, external inputs to storage, changes during storage, and similar factors. Wide variation between individual facilities can be expected.
Dairy Nutrient Budgeting Worksheet
Page 9
2. Lab Data Method: Laboratory nutrient analysis of existing storage liquid is multiplied by existing pond storagevolume to estimate total nutrient quantities in storage. Only for CONFINEMENT manure.
Working storage capacity, from Storage Table 6. Confined Animal Producer Worksheet, Section VI: Additons, Manure Storage Nutrients
Acre-feet Acre-feet Based on lab sampling data, lb.-22.51 0.00 N P K
0 0 0Cells G130+g134-F159 main sheet
3. Calculation Method for Acreage Requirments:
CONFINED ONLY Animal Manure 1 1 = Handbook ValuesNutrient Calculation Method 2 = Lab Data Values
Table 7. Percentage of Original Manure Nutrient Content Retained by Storage System
N P KDaily Spread 80 90 90Dry, under roof 70 90 90Earth storage 55 60 70Lagoon/flush 30 40 60Open lot 60 70 65Pits under slats 75 95 95Scrape/storage tank 70 90 90None (grazing) 100 100 100
2. Manure Spreading Method
Table 8. Percentage of Original Manure Nutrient Content Delivered to Crop and Available for Uptake
N P KInjection 95 100 100Broadcast 80 100 100Broadcast/cultivate 95 100 100Sprinkling 75 100 100Grazing 85 100 100
Nutrient losses from manure occur during collection, storage, application, and after land application. Losses can vary widely, depending on collection method, collection frequency, temperature, precipitation, type of handling system, duration, type, and location of storage, and other factors. About half the N in fresh manure is inorganic, and subject to significant losses. The table from Oregon State University publication EC1094 provides an estimate of NPK retained by various storage systems. Lab nutrient analyses of manure take these storage losses into account. Use these adjustment values in Table 14 and Table 16
Nitrogen nutrient losses from manure can occur during spreading (Fresh manure odor is mostly volatized ammonia). Essentially all phosphorus and potassium applied will be available to the crop. The table from OSU publication EC1094 summarizes percent nutrient delivered to cropland and available for plant uptake, based on application and preutilization losses. Use these adjustment values in Table 14 and Table 16 below.
The remainder of this worksheet is used to determine the acres required for consumption of N - P - K nutrients in keeping with good crop management practices. Application rates consistent with crop uptake needs will maximize economic benefits of applied manures and will reduce chance of impairing surface water runoff quality. Area requirement calculations are based on total nutrients produced. Indicate in the box below if the calculations for stored liquid and solid manures should be based on : 1 = Handbook values, or 2 = Lab Data values. Unconfined animal nutrient values are based on handbook information, because lab data for grazed animal manures is difficult to obtain.
Note: If ponds are pumped to maintain adequate winter storage, or if storage encroaches into freeboard requirements, the working storage capacity is not a true measure of animal manure production and storage. Indicate additional storage in the box provided to account for total annual production.
Dairy Nutrient Budgeting Worksheet
Page 10
Section VI: Additional Nutrient Inputs
1. Commercial Fertilizer
Table 9. Nutrient Value of Selected Commercial FertilizersWestern Fertilizer Handbook Available Water-Table 5-5 Total Phosphoric solubleFertilizer Formulation Nitrogen Acid Potash
Many ranchers provide supplemental fertilizer to pasture or silage crops, on an annual or other intermittent basis. These nutrients should be accounted for in a complete nutrient budget. Fertilizer may be applied in pastures where unconfined animals are grazed, in irrigated pastures, where manure is disposed, and in crop areas. This section estimates total nutrients available based on the fertilizer formulation used, the application rate, and the application frequency. Fertilizer composition data is from Western Fertlilzer Handbook, Table 5-5.
Indicate tons of fertilizer applied, area covered in acres, and how many years between applications for the commercial fertilizers noted. Formulations in Table 9 are used to estimate NPK application rates by fertilizer classification, using multipliers for elemental nutrients NPK. You will need to rerun the spreadsheet to determine effects on individual fields, if all fields are not treated the same. Entering two kinds of fertilizer on a single field will result in acreage duplication in the Table 10 summary and errors in the nutrient budget summary in Table 14. For simplicity, fertilizer nutrient values are included in both confined and unconfined animal manure disposal area evaluations, further down the spreadsheet. You will need to rerun the spreadsheet to individually evaluate confined and unconfined manure disposal areas, if both are not treated with equal amounts of commercial fertilizer.
Dairy Nutrient Budgeting Worksheet
Page 11
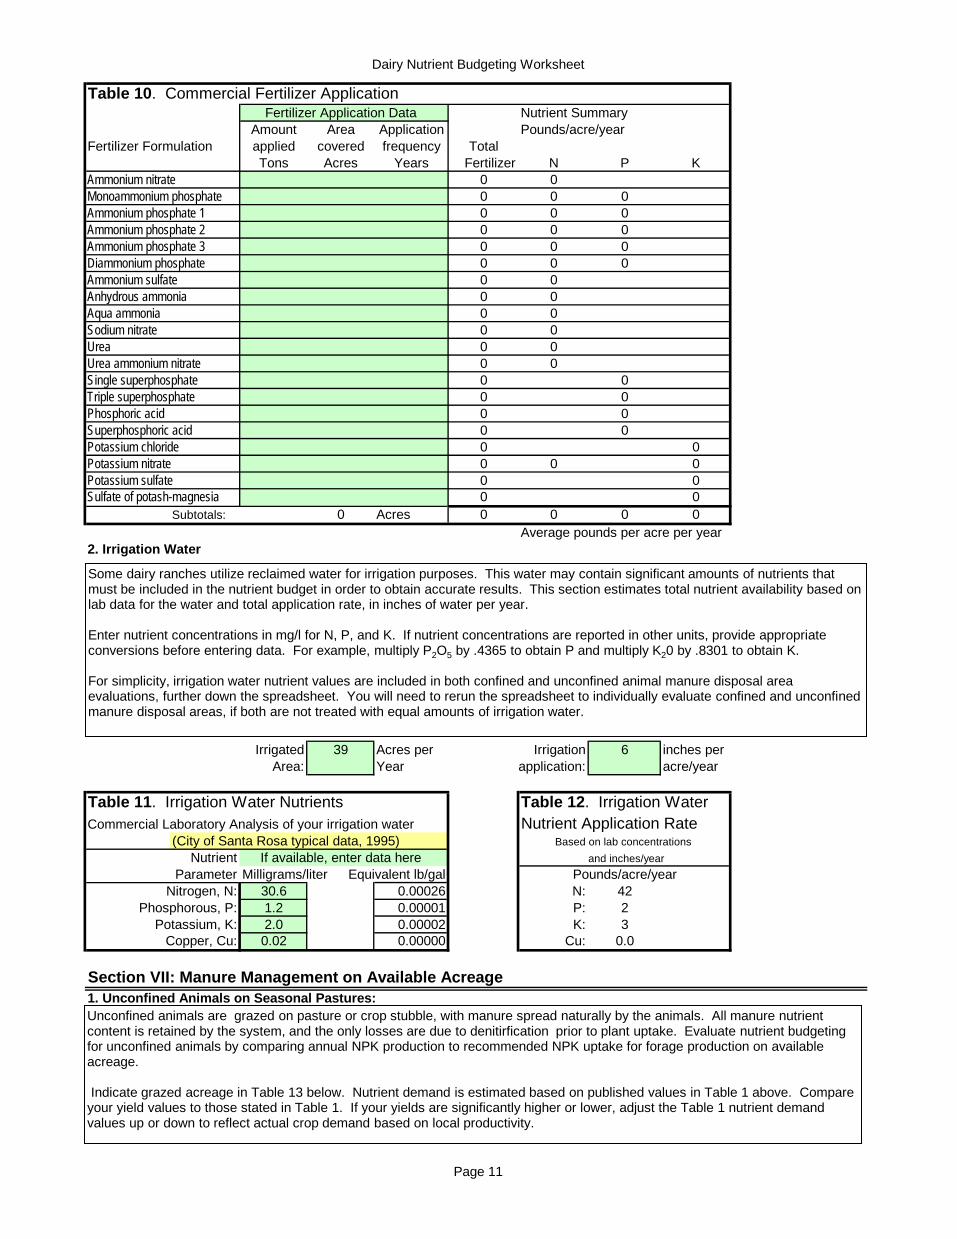
Table 10. Commercial Fertilizer ApplicationFertilizer Application Data Nutrient Summary
Amount Area Application Pounds/acre/yearFertilizer Formulation applied covered frequency Total
Section VII: Manure Management on Available Acreage1. Unconfined Animals on Seasonal Pastures:Unconfined animals are grazed on pasture or crop stubble, with manure spread naturally by the animals. All manure nutrient content is retained by the system, and the only losses are due to denitirfication prior to plant uptake. Evaluate nutrient budgeting for unconfined animals by comparing annual NPK production to recommended NPK uptake for forage production on available acreage. Indicate grazed acreage in Table 13 below. Nutrient demand is estimated based on published values in Table 1 above. Compare your yield values to those stated in Table 1. If your yields are significantly higher or lower, adjust the Table 1 nutrient demand values up or down to reflect actual crop demand based on local productivity.
Some dairy ranches utilize reclaimed water for irrigation purposes. This water may contain significant amounts of nutrients that must be included in the nutrient budget in order to obtain accurate results. This section estimates total nutrient availability based on lab data for the water and total application rate, in inches of water per year. Enter nutrient concentrations in mg/l for N, P, and K. If nutrient concentrations are reported in other units, provide appropriate conversions before entering data. For example, multiply P2O5 by .4365 to obtain P and multiply K20 by .8301 to obtain K. For simplicity, irrigation water nutrient values are included in both confined and unconfined animal manure disposal area evaluations, further down the spreadsheet. You will need to rerun the spreadsheet to individually evaluate confined and unconfined manure disposal areas, if both are not treated with equal amounts of irrigation water.
Dairy Nutrient Budgeting Worksheet
Page 12
Table 13. Grazed acreage for unconfined animals.On-Site Nutrient Demand, PoundsAcres N P2O5 K2O
Note: This evaluation for grazed pasture areas is based on handbook nutrient values, since lab data for animal-distributed manure is difficult to obtain. It assumes that common acreage is used for livestock pasture and application of both commercial fertilizer and irrigation water. Unconfined animal counts are reported in the Producer worksheet. Return to previous sections if necessary to adjust animal counts, acreages, irrigation application, and commercial fertilizer application so that a valid evaluation may be made for pastured areas where unconfined animals are kept. Acre counts for Pastured, Irrigated, and Fertilized should be the same. Acres used for nutrient consumption should be equal to or less than total available on-site and off-site acres.
Dairy Nutrient Budgeting Worksheet
Page 13
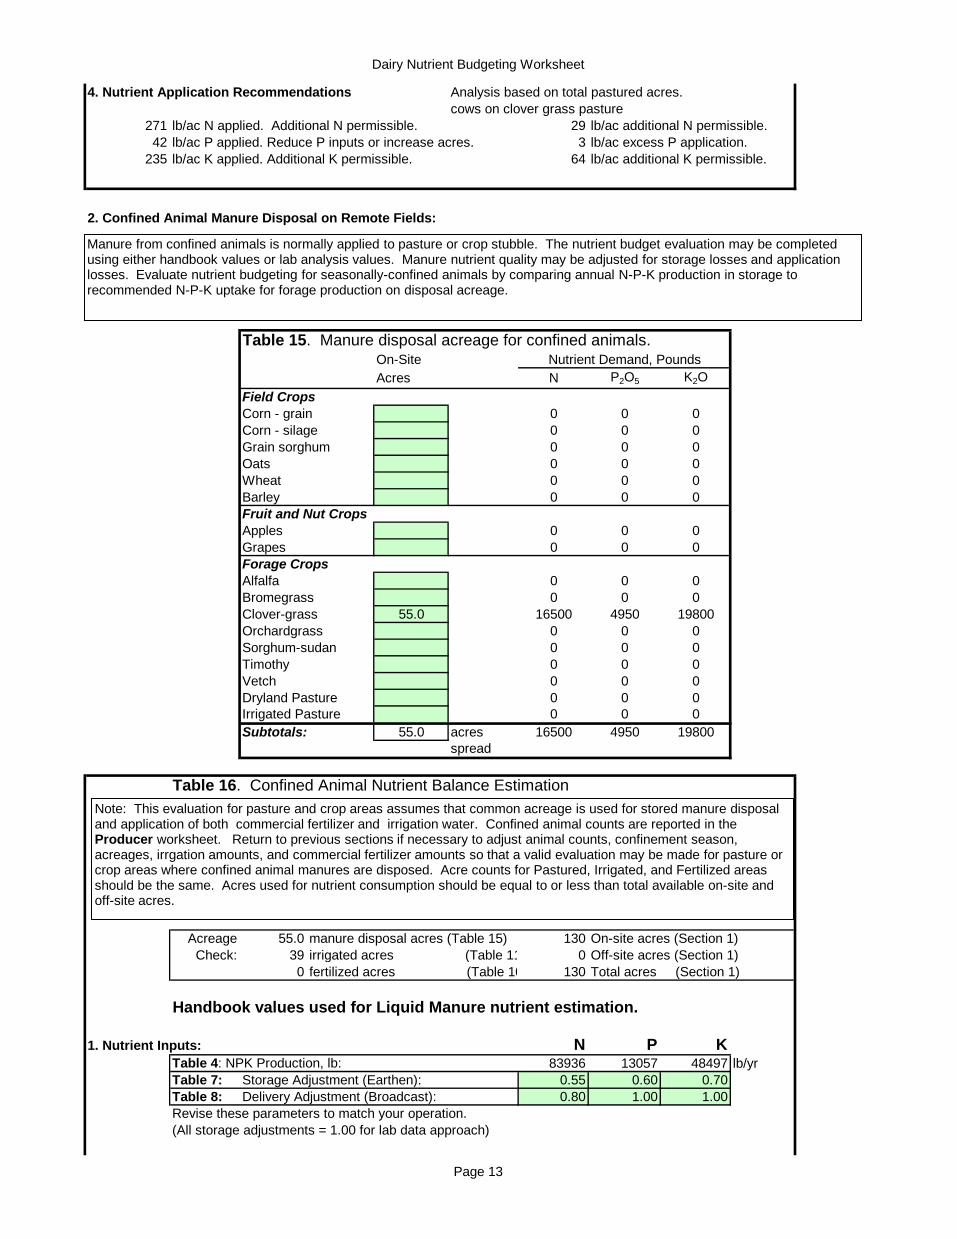
4. Nutrient Application Recommendations Analysis based on total pastured acres.cows on clover grass pasture
271 lb/ac N applied. Additional N permissible. 29 lb/ac additional N permissible.42 lb/ac P applied. Reduce P inputs or increase acres. 3 lb/ac excess P application.
235 lb/ac K applied. Additional K permissible. 64 lb/ac additional K permissible.
2. Confined Animal Manure Disposal on Remote Fields:
Table 15. Manure disposal acreage for confined animals.On-Site Nutrient Demand, PoundsAcres N P2O5 K2O
0 fertilized acres (Table 10 130 Total acres (Section 1)
Handbook values used for Liquid Manure nutrient estimation.
1. Nutrient Inputs: N P KTable 4: NPK Production, lb: 83936 13057 48497 lb/yrTable 7: Storage Adjustment (Earthen): 0.55 0.60 0.70Table 8: Delivery Adjustment (Broadcast): 0.80 1.00 1.00Revise these parameters to match your operation.(All storage adjustments = 1.00 for lab data approach)
Manure from confined animals is normally applied to pasture or crop stubble. The nutrient budget evaluation may be completed using either handbook values or lab analysis values. Manure nutrient quality may be adjusted for storage losses and application losses. Evaluate nutrient budgeting for seasonally-confined animals by comparing annual N-P-K production in storage to recommended N-P-K uptake for forage production on disposal acreage.
Note: This evaluation for pasture and crop areas assumes that common acreage is used for stored manure disposal and application of both commercial fertilizer and irrigation water. Confined animal counts are reported in the Producer worksheet. Return to previous sections if necessary to adjust animal counts, confinement season, acreages, irrgation amounts, and commercial fertilizer amounts so that a valid evaluation may be made for pasture or crop areas where confined animal manures are disposed. Acre counts for Pastured, Irrigated, and Fertilized areas should be the same. Acres used for nutrient consumption should be equal to or less than total available on-site and off-site acres.
Dairy Nutrient Budgeting Worksheet
Page 14
Required manure application rate for disposal:185 tons/acre Based on Table 5 animal production quantities, spread acres.
N P KAvailable from manure: Manure NPK available , lb: 36932 7834 33948 lb/yr
4. Nutrient Application Recommendations Analysis based on total manure disposal acres.
713 lb/ac N applied. Reduce N inputs or increase acres. 413 lb/ac excess N application.144 lb/ac P applied. Reduce P inputs or increase acres. 105 lb/ac excess P application.620 lb/ac K applied. Reduce K inputs or increase acres. 321 lb/ac excess application
Table 17. Fertilizer Economic Value
1. Benchmark economic values Enter current fertilizer costsAmmonium Sulfate (16-20-0), bulk grannular delivered to ranch: 700.00$ per tonPotassium Chloride (0-0-60), bulk grannular delivered to ranch: 600.00$ per ton
N P KEquivalent value, $/lb: 0.0560$ 0.0306$ 0.1494$ Unconfined animal manure $1,140 $96 $2,634 $3,871 unconfinedConfined animal manure $2,068 $239 $5,073 $7,380 confinedIrrigation water $91 $2 $16Applied Nutrient Values: $3,299 $338 $7,723 Total Values
Total Applied Nutrient Value: 11,360
Relative value of animal manure and irrigation water nutrients may be determined by comparison to commercially available bulk grannular fertilizer. Enter comparative retail costs for Ammonium sulfate (16-20-0)and for Potassium Chloride KCl (0-0-60) below for use as benchmark values. Handling and spreading costs vary for each producer and are not considered in the evaluation. Animal manures as fertlizer provide additional intangible benefits such as micronutrients, microbial populations, and organic matter for soil building.
This Nutrient Budgeting worksheet was developed to assist dairy ranch operators in evaluating waste management facilities and non-point source nutrient loading on their property, in order to better manage manures and protect fresh water resources. Developing and implementing a waste management plan based on appropriate management strategies will aid in preventing code violation through discharge of nutrient-laden materials into the waters of the region. The plan is the effort of the Gold Ridge Resource Conservation District, in cooperation with the University of California Cooperative Extension, Sonoma Marin Animal Waste Committee, North Coast Regional Water Quality Control Board, Natural Resource Conservation Service, and Western United Dairymen. The plan is a self-monitoring aid and may be used by anyone. The document may be copied and used freely. No warranty is expressed or implied and the authors are not responsible for facilities construction or operation or management decisions made on the basis of program outputs. Credit to the authors will be appreciated. L.R. Erickson Ph.D. Gold Ridge
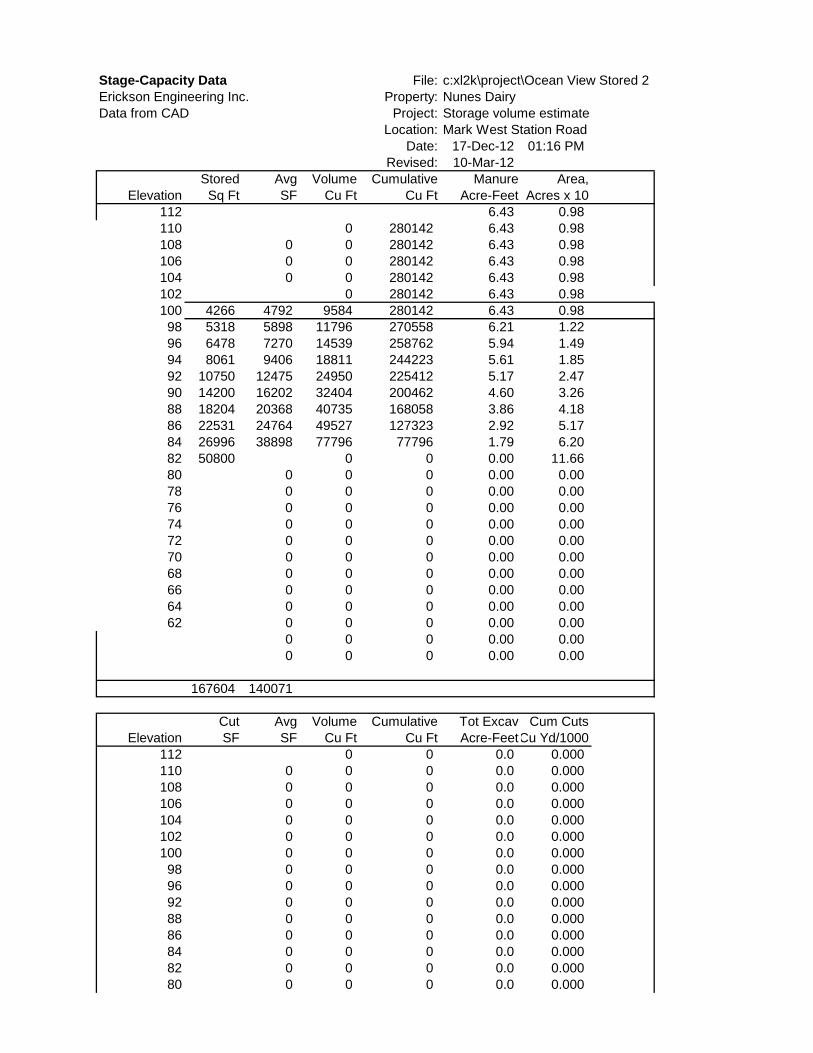
Stage-Capacity Data File: c:xl2k\project\Ocean View Pond 1Erickson Engineering Inc. Property: Nunes DairyData from CAD Project: Pond Volume Estimate
Location: Mark West Station RoadDate: 17-Dec-12 01:16 PM
Revised: 10-Mar-12Water Avg Volume Cumulative Water H2O Area, Water


![Country Chapter - uncrd.or.jp1121] India.pdf · Indian Institute of Petroleum, ... as an economic industry, ... horticulture waste, agriculture and dairy waste, treated bio-](https://static.documents.pub/doc/80x56/5a82333b7f8b9a0c748de0bb/country-chapter-uncrdorjp-1121-indiapdfindian-institute-of-petroleum-.jpg)


