27
Commercial Real Estate Market Update presented to Dallas Bar Association

Commercial Real Estate Market Update
presented to
Dallas Bar Association

2
NATIONAL MARKET UPDATE
A G E N D ANATIONAL MARKET UPDATE
DFW MARKET UPDATE
VALUATION & ADVISORY
CAPITAL MARKETSCAPITAL MARKETS

NATIONAL MARKET UPDATE

4National Economic Overview
F th Q t 2010
■ Cautious consumers and businesses softened by yr end 2010.
New leases signed (leasing activity) up in the CBDs by 31 6 % in
Fourth Quarter 2010
New leases signed (leasing activity) up in the CBDs by 31.6 %, in suburbs by 20.2 % year over year.
■ Spending up = steady growth in real gross domestic product (2.9% for 2010).
■ By December, non-farm employment up by more than 1.1 million workers from one year ago - unemployment rate down one-half y g p ypercentage point to 9.4%.
Look for slow and steady improvement in 2011.
■ Asking office rents inching up slowly but most markets will not see significant increases until 2012 and 2013.
Source: Cushman & Wakefield Research

5
E l t V R t 1986 2010
U.S. Growth in OfficeEmployment vs. Vacancy Rates 1986 – 2010
1,500 25%4-qtr Change in Office-Using Employment CBD Vacancy Non-CBD Vacancy
1,000
(000
s)
20%
0
500
Empl
oym
ent
15%
-500
Offi
ce-U
sing
10%
-1,500
-1,000
Cha
nge
in
5%
-2,00086 87 88 89 90 91 92 93 94 95 96 97 98 99 00 01 02 03 04 05 06 07 08 09 10
0%
Data as of Fourth Quarter 2010
Source: Moody’s|Economy.com, Cushman & Wakefield Research

6
Y O Y N t J b G i
U.S. Employment GrowthYear-Over-Year Net Job Gains
February 2011
18.0 to 32.9
9.0 to 17.9
33.0 to 230.0
0.1 to 8.9
-10.5 to 0.0
Source: U.S. Bureau of Labor Statistics, Cushman & Wakefield Research

7
N L i A ti it
National Office MarketNew Leasing Activity
Square FeetCBD Suburban
(Forecast)
Square Feet(In Millions)
200.0
120 0
160.0
80.0
120.0
40.0
0.0
94 95 96 97 98 99 00 0302 04 05 070601 08 1009 11F 12F 13F 14F 15F
Data as of Fourth Quarter 2010
Source: Cushman & Wakefield Research

8
Hi h t CBD d N CBD N L i A ti it
National Office MarketHighest CBD and Non-CBD New Leasing Activity
Fourth Quarter 2010
CBD Non-CBD
1. Midtown NY 18,859,0002 Washington D C 5 822 502
1. Dallas, TX 11,392,6602 Los Angeles Metro 9 396 0542. Washington, D.C. 5,822,502
3. Chicago, IL 4,603,0534. Midtown South NY 4,082,887 5. Boston, MA 3,755,442
2. Los Angeles Metro 9,396,0543. Atlanta, GA 8,368,950 4. Boston, MA 7,906,5955. Denver, CO 7,553,135
6. San Francisco, CA 3,580,6847. Orange County CA 3,407,9888. Downtown NY 3,377,6809 Denver CO 2 730 124
6. Houston, TX 7,307,0287. Northern VA 7,023,4488. San Diego, CA 5,485,0869 Chicago IL 5 406 5259. Denver, CO 2,730,124
10. Houston, TX 1,553,652-- -- --
17. Dallas, TX 818,169
9. Chicago, IL 5,406,52510. Silicon Valley CA 4,460,213
Data as of Fourth Quarter 2010
Source: Cushman & Wakefield Research

9
O ll Ab ti
National Office MarketOverall Absorption
(Forecast)Square Feet80.0
CBD Suburban(Forecast)Square Feet
(In Millions)
60.0
80.0
40.0
20.0
-20.0
0.0
-40.094 95 96 97 98 99 00 0302 04 05 070601 08 1009 11F 12F 13F 14F 15F
Data as of Fourth Quarter 2010
Source: Cushman & Wakefield Research

10
O ll A ki R t
National Office Market
(Forecast)
Overall Asking Rents
CBD Suburban(Forecast)
$45.00
$40 00$40.00
$35 00
$30.00
$35.00
$25.00
06$20.00
01 02 03 04 05 11F06 0701 02 03 04 05 08 09 10 11F 12F 13F 14F 15F
Data as of Fourth Quarter 2010
Source: Cushman & Wakefield Research

DFW MARKET UPDATE
12Dallas Office Market
O iOverview
Economy
Jobs/Housing/Population
Office
Multi-family / Retail / Industrial

13Dallas Office Market
V t O i d S bl SVacant vs. Occupied Sublease Space
Vacant Occupied
Millions (SF)10
6
8
4
6
2
95 96 97 98 99 00 01 02 03 04 05 06 07 08 09 10 1Q11
0
Data as of First Quarter 2011
Source: Cushman & Wakefield Research

14Dallas Office Market
S b k t Offi R t b Cl
Class A Class B
Submarket Office Rates by Class
$35Dollars/SF
$25
$30
$15
$20
$10
$15
*All rental rates are full service, including electricityData as of First Quarter 2011Source: Cushman & Wakefield Research

15Dallas Office Market
CBD Q t d G R t l R t b Cl *CBD - Quoted Gross Rental Rates by Class* vs. Occupancy in All Classes
Dallas CBD % Occupied Class A Class B
$25.00
$28.00 100%
$22.00
90%
$16.00
$19.00 80%
$13.00
$16.00
70%
$10.00 60%90 91 92 93 94 95 96 97 98 99 00 01 02 03 04 05 06 07 08 09 10 1Q
11
*All rental rates are full service, including electricityData as of First Quarter 2011Source: Cushman & Wakefield Research

16Proposed Office Projects
TWO ARTS PLAZAHALL ARTS CENTER SPIRE DEVELOPMENT TWO ARTS PLAZAHALL ARTS CENTER SPIRE DEVELOPMENT
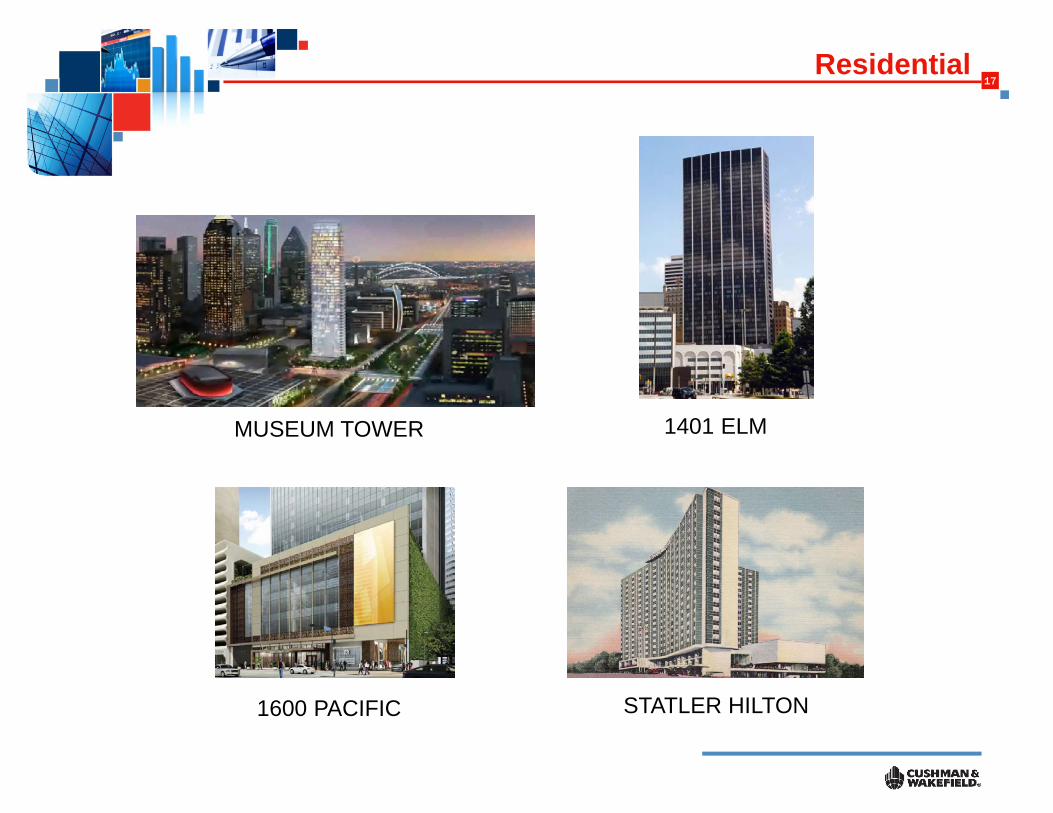
17Residential
1401 ELMMUSEUM TOWER
STATLER HILTON1600 PACIFIC STATLER HILTON1600 PACIFIC

VALUATION & ADVISORY

19Valuation & Advisory
In 2009, Valuation & Advisory (U.S.) completed over 18,500 appraisal assignments with an aggregate value in excess of $400 Billion.
C d t P i YCompared to Prior Years:
2008 – 19,000 appraisal assignments. Values of $558 Billion.2007 21 000 appraisal assignments Values of $600 Billion2007 – 21,000 appraisal assignments. Values of $600 Billion.
C&W’s Appraisal Group is organized by Geographic Areas and Specialty Practices.
20Valuation & Advisory
S i lt P ti
U f A i l S i d d k l d d ti b th t f
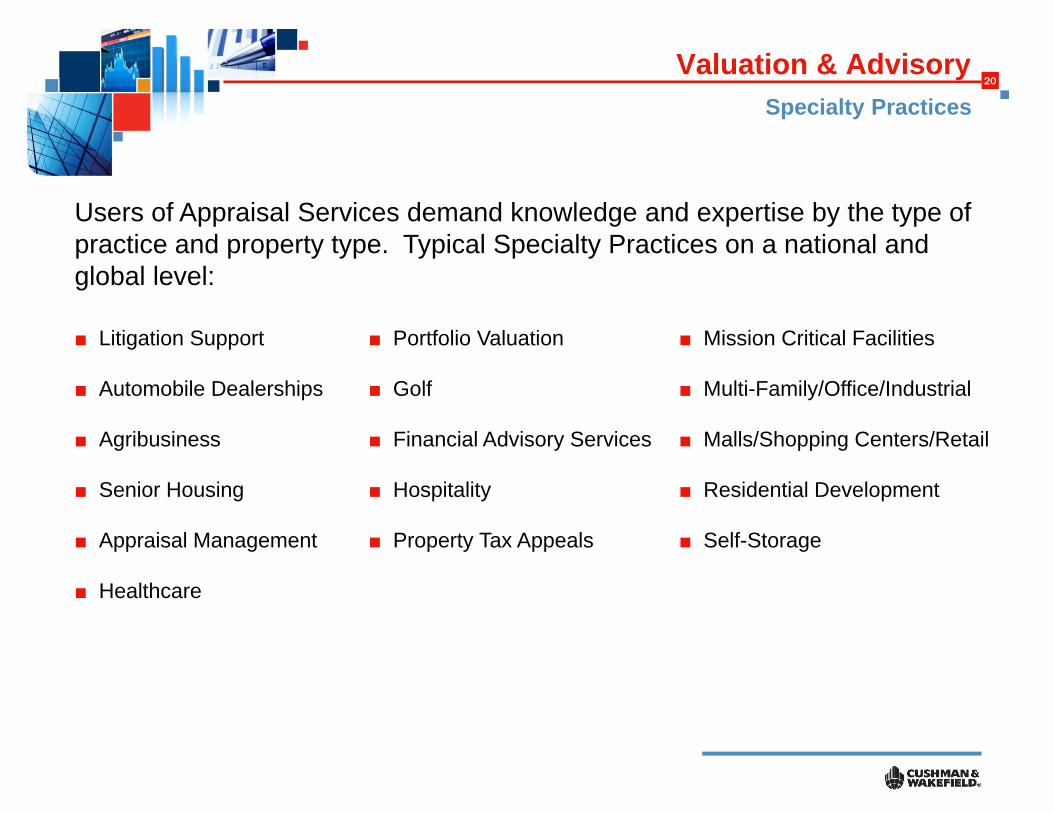
Specialty Practices
Users of Appraisal Services demand knowledge and expertise by the type of practice and property type. Typical Specialty Practices on a national and global level:
■ Litigation Support ■ Portfolio Valuation ■ Mission Critical Facilities
■ Automobile Dealerships ■ Golf ■ Multi-Family/Office/Industrial
■ Agribusiness ■ Financial Advisory Services ■ Malls/Shopping Centers/Retail
■ Senior Housing ■ Hospitality ■ Residential Development
■ Appraisal Management ■ Property Tax Appeals ■ Self-Storage
■ Healthcare
21Valuation & Advisory
C it li ti (C ) R tCapitalization (Cap) Rates
A l t ti i
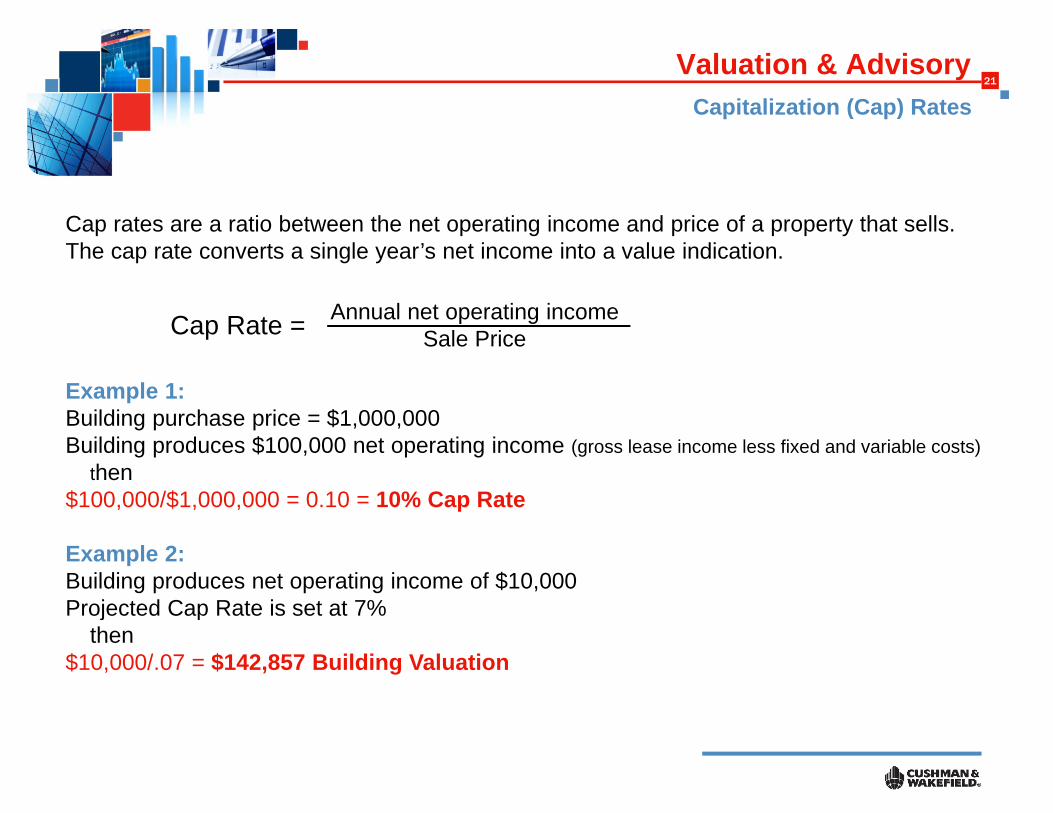
Cap rates are a ratio between the net operating income and price of a property that sells. The cap rate converts a single year’s net income into a value indication.
Cap Rate = Annual net operating incomeSale Price
Example 1:Building purchase price = $1,000,000Building produces $100,000 net operating income (gross lease income less fixed and variable costs)
then$100,000/$1,000,000 = 0.10 = 10% Cap Rate$ , $ , , p
Example 2:Building produces net operating income of $10,000Projected Cap Rate is set at 7%Projected Cap Rate is set at 7%
then$10,000/.07 = $142,857 Building Valuation
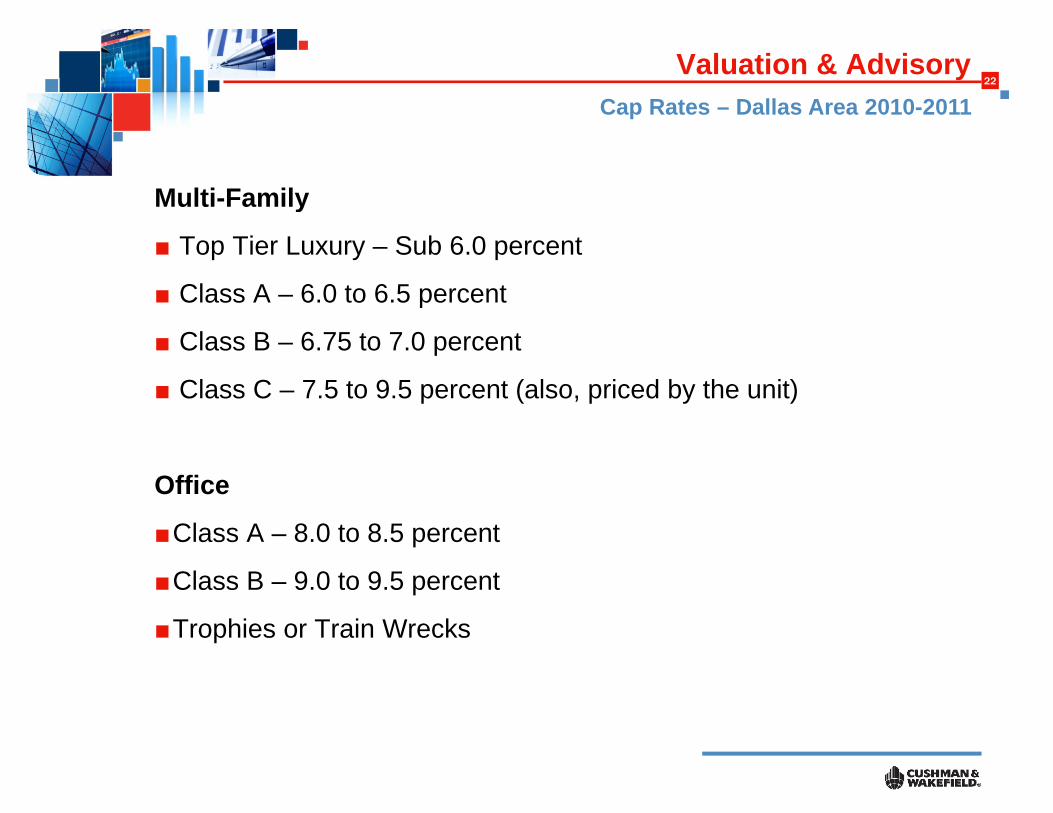
22Valuation & Advisory
C R t D ll A 2010 2011
Multi-Family
Cap Rates – Dallas Area 2010-2011
Multi Family
■ Top Tier Luxury – Sub 6.0 percent
■ Class A – 6.0 to 6.5 percentp
■ Class B – 6.75 to 7.0 percent
■ Class C – 7.5 to 9.5 percent (also, priced by the unit)
Office
■Class A – 8.0 to 8.5 percent
■Class B – 9.0 to 9.5 percent
■Trophies or Train Wrecks

23Valuation & Advisory
C R t D ll A 2010 2011
Industrial
Cap Rates – Dallas Area 2010-2011
Industrial
■ Class A – Plus/Minus 7 percent
■ Class B – Plus/Minus 8 percentp
Shopping Centers/Retail
■ Class A Power Centers – 7.6 to 7.7 percent
■ Neighborhood Centers – 7.5 to 7.75 percent
■ Strip Centers – 9.0 to 10.0 percent
■ Top Tier Properties – 6.5 to 6.75 percent
(infill, with strong demographics)
CAPITAL MARKETS
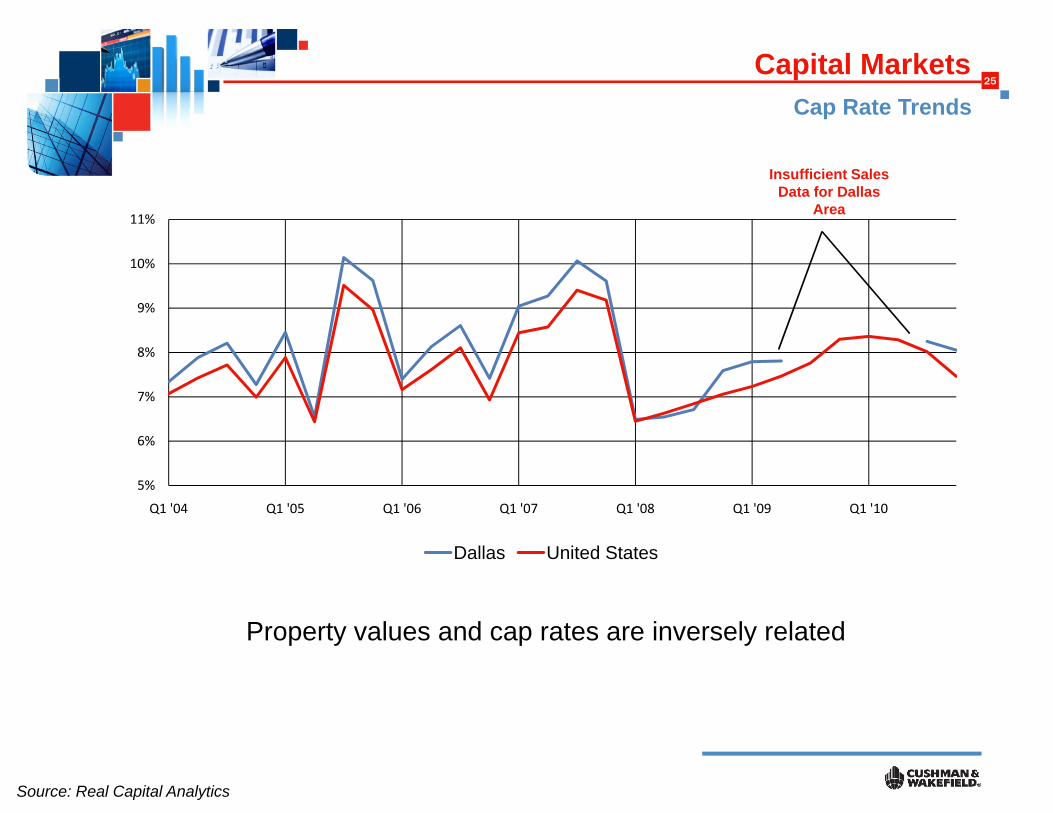
25Capital Markets
C R t T d
Insufficient Sales Data for Dallas
Cap Rate Trends
9%
10%
11%Area
7%
8%
9%
5%
6%
Q1 '04 Q1 '05 Q1 '06 Q1 '07 Q1 '08 Q1 '09 Q1 '10Q1 04 Q1 05 Q1 06 Q1 07 Q1 08 Q1 09 Q1 10
Dallas United States
Property values and cap rates are inversely related
Source: Real Capital Analytics

26
D ll M k t S l V l
Capital Markets
■ Office sales activity showed major signs of improvement in 2010
Dallas Market Sales Volume
y j g p
■ Strong momentum into 2011, as evidenced by several major sales that closed during the 1st Quarter 2011
6,000
7,000
3,000
4,000
5,000
1,000
2,000
,
0
Q1 '04 Q1 '05 Q1 '06 Q1 '07 Q1 '08 Q1 '09 Q1 '10
Rolling 12 mo Total Quarterly VolRolling 12-mo. Total Quarterly Vol.
Source: Real Capital Analytics

27Capital Markets
A ti B
Dallas Market U.S. Overall
Active Buyers
■ 2010 marked the return ofbuyers of all types to themarket after the downturnf 2008 09
0%0%19%
8%
32%
17%
29%of 2008-09■ Buyers are most actively
pursuing core assets anddi d i i h
5%
24%
1%
2%
0%
11%
32% 29%
Institutional
Cross-Border
distressed properties, withsignificantly less activity forother properties 54%
67% 14%
19%
Public Listed/REITs
Private
User/Other
50%
38%
36%
20%26%
2%
21%
5%
2008 2009 2010 2011 (YTD) 2011 (YTD)
Source: Real Capital Analytics


