U.S. Department of the Interior U.S. Geological Survey Scientific Investigations Report 2015–5052 Prepared in cooperation with the City of Oklahoma City, Oklahoma Dam-Breach Analysis and Flood-Inundation Mapping for Selected Dams in Oklahoma City, Oklahoma, and near Atoka, Oklahoma
Transcript
U.S. Department of the InteriorU.S. Geological Survey
Scientific Investigations Report 2015–5052
Prepared in cooperation with the City of Oklahoma City, Oklahoma
Dam-Breach Analysis and Flood-Inundation Mapping for Selected Dams in Oklahoma City, Oklahoma, and near Atoka, Oklahoma
Cover.1. Photograph of a redbud tree near Lake Hefner Dam in Oklahoma City, Okla., 2015. (S. Jerrod Smith, U.S. Geological Survey)2. Photograph of Lake Overholser Dam in Oklahoma City, Okla., 2013. (Trevor S. Grout, U.S. Geological Survey)
Back cover.Panoramic photograph of Lake Hefner Dam, 2015. (S. Jerrod Smith, U.S. Geological Survey)
2.1.
i
Dam-Breach Analysis and Flood-Inundation Mapping for Selected Dams in Oklahoma City, Oklahoma, and near Atoka, Oklahoma
By Molly J. Shivers, S. Jerrod Smith, Trevor S. Grout, and Jason M. Lewis
Prepared in cooperation with the City of Oklahoma City, Oklahoma
Scientific Investigations Report 2015–5052
U.S. Department of the InteriorU.S. Geological Survey
ii
U.S. Department of the InteriorSALLY JEWELL, Secretary
U.S. Geological SurveySuzette M. Kimball, Acting Director
U.S. Geological Survey, Reston, Virginia: 2015
For more information on the USGS—the Federal source for science about the Earth, its natural and living resources, natural hazards, and the environment—visit http://www.usgs.gov or call 1–888–ASK–USGS.
For an overview of USGS information products, including maps, imagery, and publications, visit http://www.usgs.gov/pubprod/.
Any use of trade, firm, or product names is for descriptive purposes only and does not imply endorsement by the U.S. Government.
Although this information product, for the most part, is in the public domain, it also may contain copyrighted materials as noted in the text. Permission to reproduce copyrighted items must be secured from the copyright owner.
Suggested citation:Shivers, M.J., Smith, S.J, Grout, T.S., and Lewis, J.M., 2015, Dam-breach analysis and flood-inundation mapping for selected dams in Oklahoma City, Oklahoma, and near Atoka, Oklahoma: U.S. Geological Survey Scientific Investigations Report 2015–5052, 62 p., http://dx.doi.org/10.3133/sir20155052.
Abstract .......................................................................................................................................................................................................... 1Introduction..................................................................................................................................................................................................... 1Purpose and Scope ....................................................................................................................................................................................... 1Description of Selected Dams and Lakes .................................................................................................................................................. 1
Atoka Reservoir ..................................................................................................................................................................................... 1Dolese Youth Park Lake ....................................................................................................................................................................... 1Dry Creek Detention Reservoir ........................................................................................................................................................... 1Lake Hefner ............................................................................................................................................................................................ 4Lake Overholser .................................................................................................................................................................................... 4Lightning Creek Holding Pond A ......................................................................................................................................................... 4Lightning Creek Holding Pond C ......................................................................................................................................................... 4Northeast (Zoo) Lake ............................................................................................................................................................................ 4Northwest Oklahoma City Sludge Lagoon ........................................................................................................................................ 4Stanley Draper Lake ............................................................................................................................................................................. 4Will Rogers Park Holding Pond .......................................................................................................................................................... 4
Dam-Breach Analysis ................................................................................................................................................................................... 4Model Selection .................................................................................................................................................................................... 4Data Inputs for Hydraulic Model ........................................................................................................................................................ 4
Elevation Data............................................................................................................................................................................... 4Survey Data................................................................................................................................................................................... 5Hydraulic Data .............................................................................................................................................................................. 5Hydrologic Data............................................................................................................................................................................ 5
Model Development ............................................................................................................................................................................. 5Cross Sections.............................................................................................................................................................................. 5Manning’s Roughness Coefficients .......................................................................................................................................... 5Flow and Boundary Conditions .................................................................................................................................................. 6Dam-Breach Parameters ........................................................................................................................................................... 6Calibration and Sensitivity Analysis ......................................................................................................................................... 7Postprocessing of Model Results ............................................................................................................................................. 7
Flood-Inundation Mapping ........................................................................................................................................................................... 7Sources of Uncertainty in Flood-Inundation Maps .................................................................................................................................. 7
Summary and Conclusions ......................................................................................................................................................................... 12References Cited.......................................................................................................................................................................................... 13Appendixes [available at http://pubs.usgs.gov/sir/2015/5052/]
1. Limitations Regarding Use of Flood-Inundation Maps2. Maps showing inundated areas for the 75-percent probable maximum flood and sunny-day
Atoka Reservoir dam-breach model scenarios and time to peak stage for the 75-percent probable maximum flood
3. Map showing inundated areas for the 75-percent probable maximum flood and sunny-day Dolese Youth Park Lake dam-breach model scenarios and time to peak stage for the 75-percent probable maximum flood
4. Maps showing inundated areas for the 75-percent probable maximum flood and sunny-day Dry Creek Detention Reservoir dam-breach model scenarios and time to peak stage for the 75-percent probable maximum flood
5. Maps showing inundated areas for the 75-percent probable maximum flood and sunny-day Lake Hefner dam-breach model scenarios and time to peak stage for the 75-percent probable maximum flood
6. Maps showing inundated areas for the 75-percent probable maximum flood and sunny-day Lake Overholser dam-breach model scenarios and time to peak stage for the 75-percent probable maximum flood
7. Maps showing inundated areas for the 75-percent probable maximum flood and sunny-day Lightning Creek Holding Pond A dam-breach model scenarios and time to peak stage for the 75-percent probable maximum flood
8. Maps showing inundated areas for the 75-percent probable maximum flood and sunny-day Lightning Creek Holding Pond C dam-breach model scenarios and time to peak stage for the 75-percent probable maximum flood
9. Maps showing inundated areas for the 75-percent probable maximum flood and sunny-day Northeast (Zoo) Lake dam-breach model scenarios and time to peak stage for the 75-percent probable maximum flood
10. Map showing inundated areas for the 75-percent probable maximum flood and sunny-day Northwest Oklahoma City Sludge Lagoon dam-breach model scenarios and time to peak stage for the 75-percent probable maximum flood
11. Maps showing inundated areas for the 75-percent probable maximum flood and sunny-day Stanley Draper Lake dam-breach model scenarios and time to peak stage for the 75-percent probable maximum flood
12. Maps showing inundated areas for the 75-percent probable maximum flood and sunny-day Will Rogers Park Holding Pond dam-breach model scenarios and time to peak stage for the 75-percent probable maximum flood
Figures 1. Map showing study area and Manning’s roughness coefficients for dam-breach analysis
of a selected dam near Atoka, Oklahoma ................................................................................................................................ 2 2. Map showing study area and Manning’s roughness coefficients for dam-breach analysis
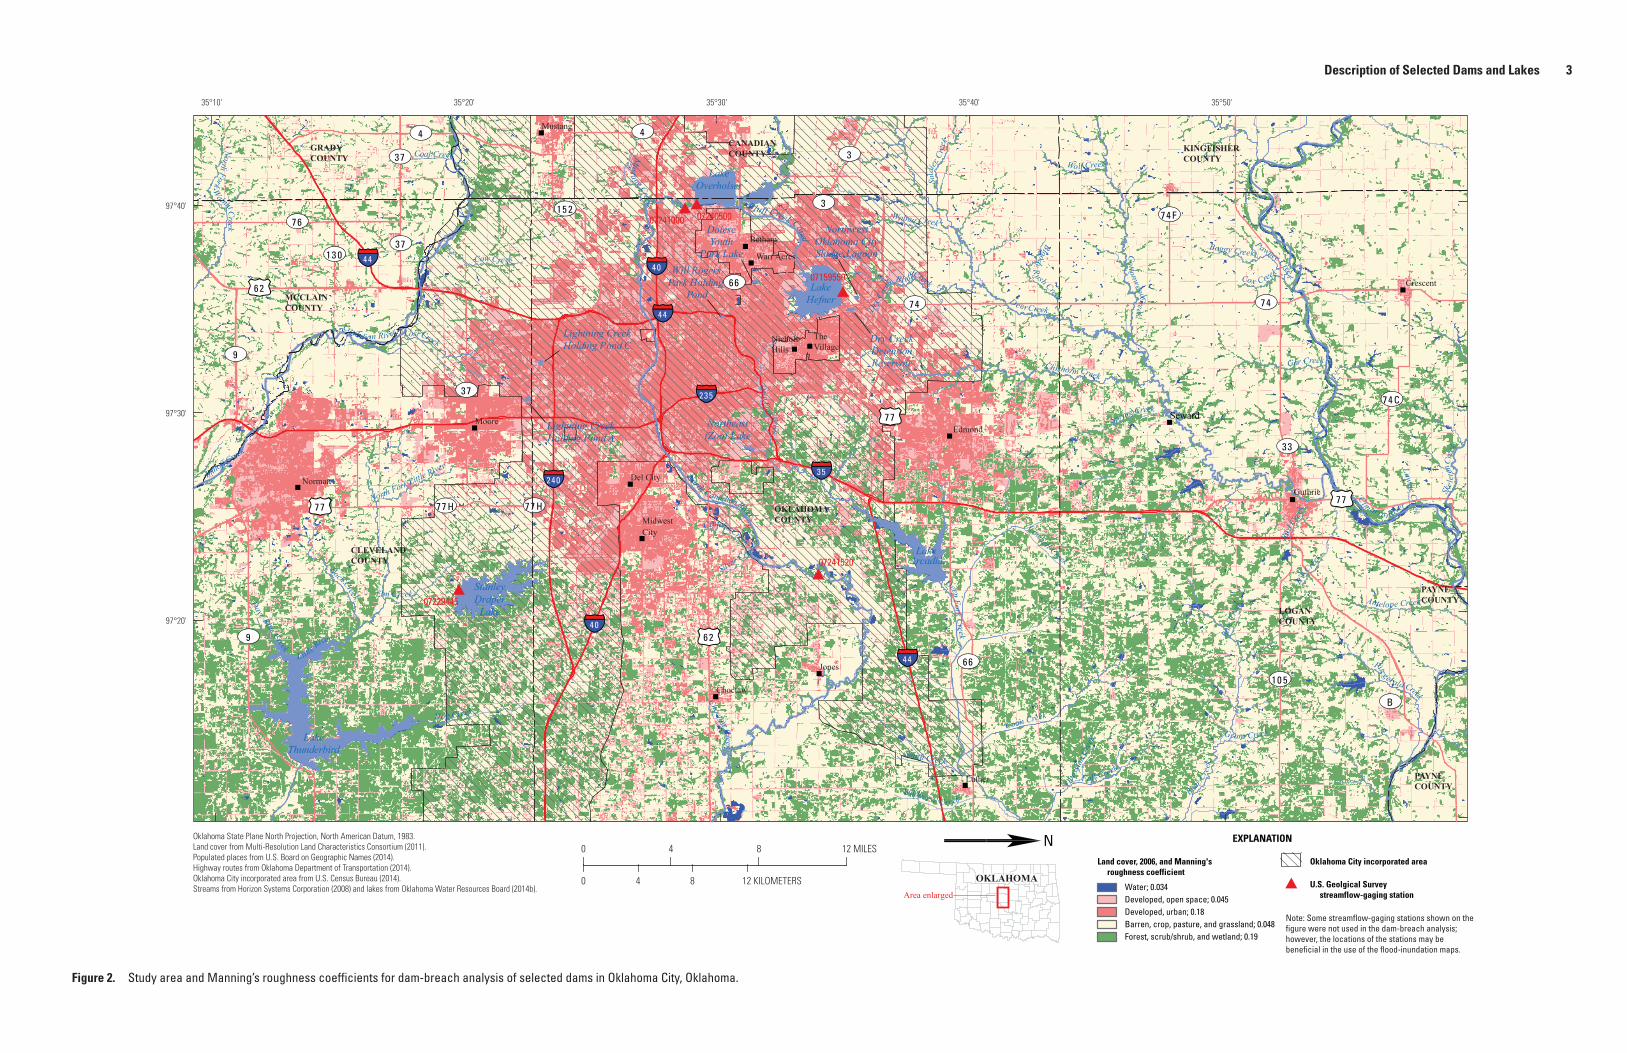
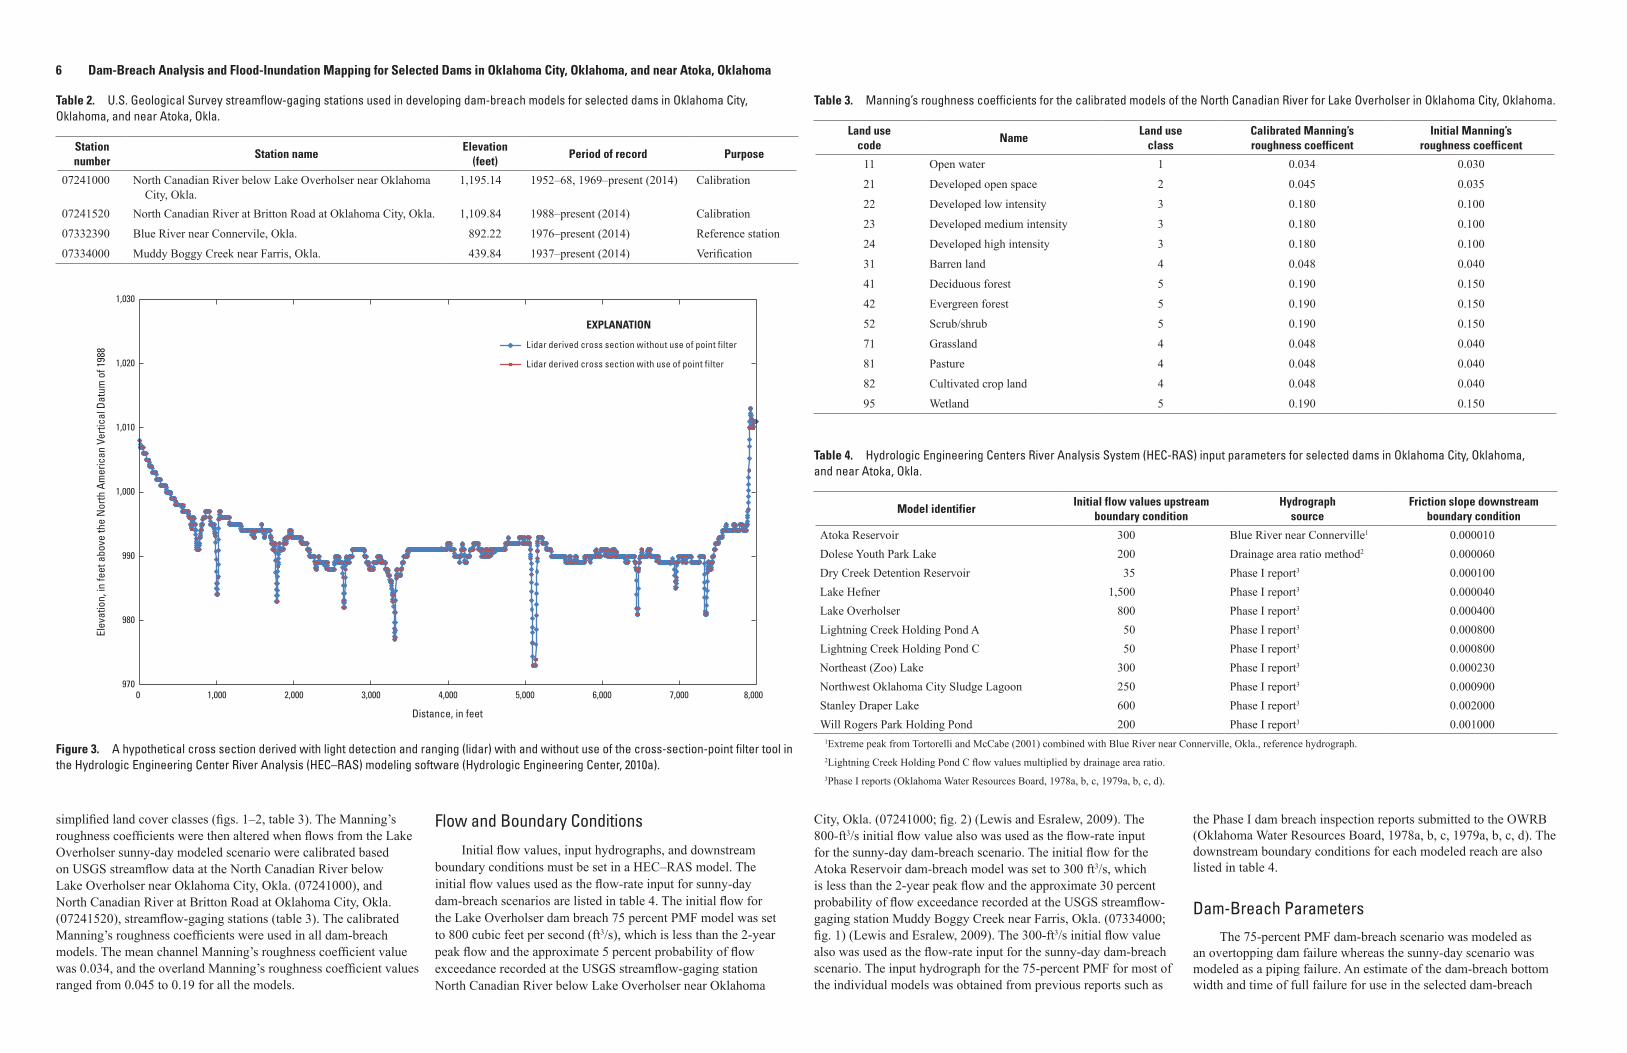
of selected dams in Oklahoma City, Oklahoma ........................................................................................................................3 3. Graph showing a hypothetical cross section derived with light detection and ranging
with and without use of the cross-section-point filter tool in the Hydrologic Engineering Center River Analysis modeling software ................................................................................................................................6
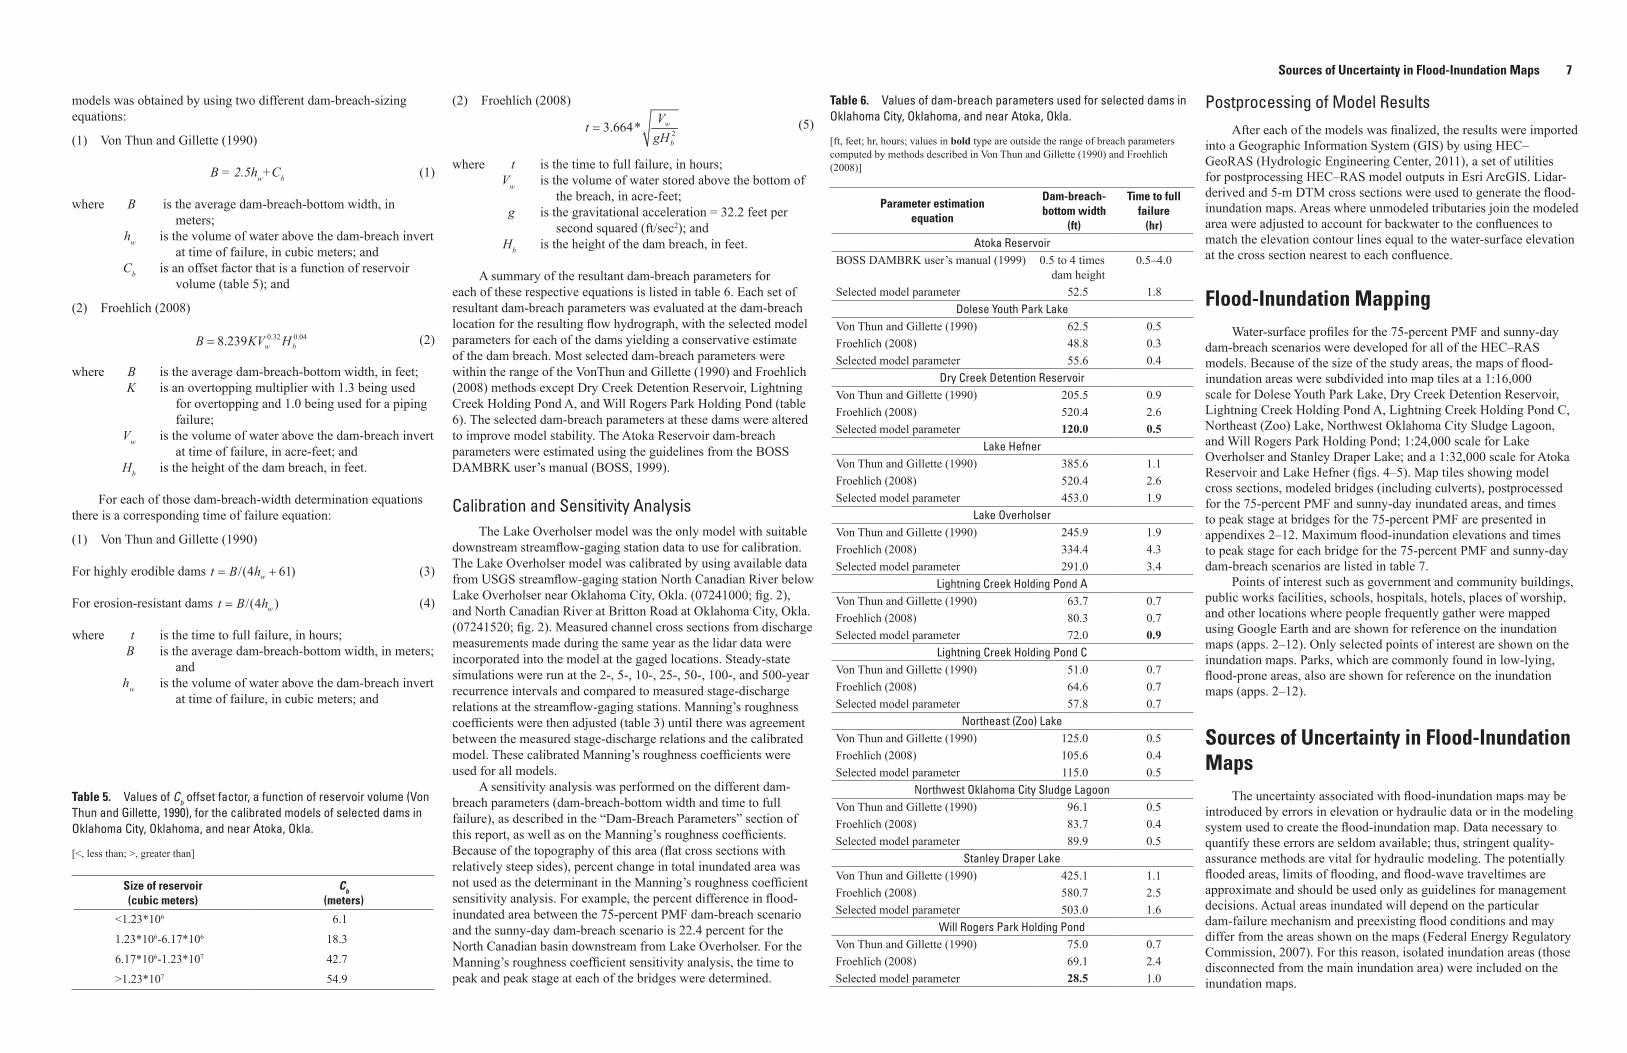
4. Map showing extents for figures in appendix 2 that show flood-inundation areas from dam-breach analysis of Atoka Reservoir near Atoka, Oklahoma ...............................................................................8
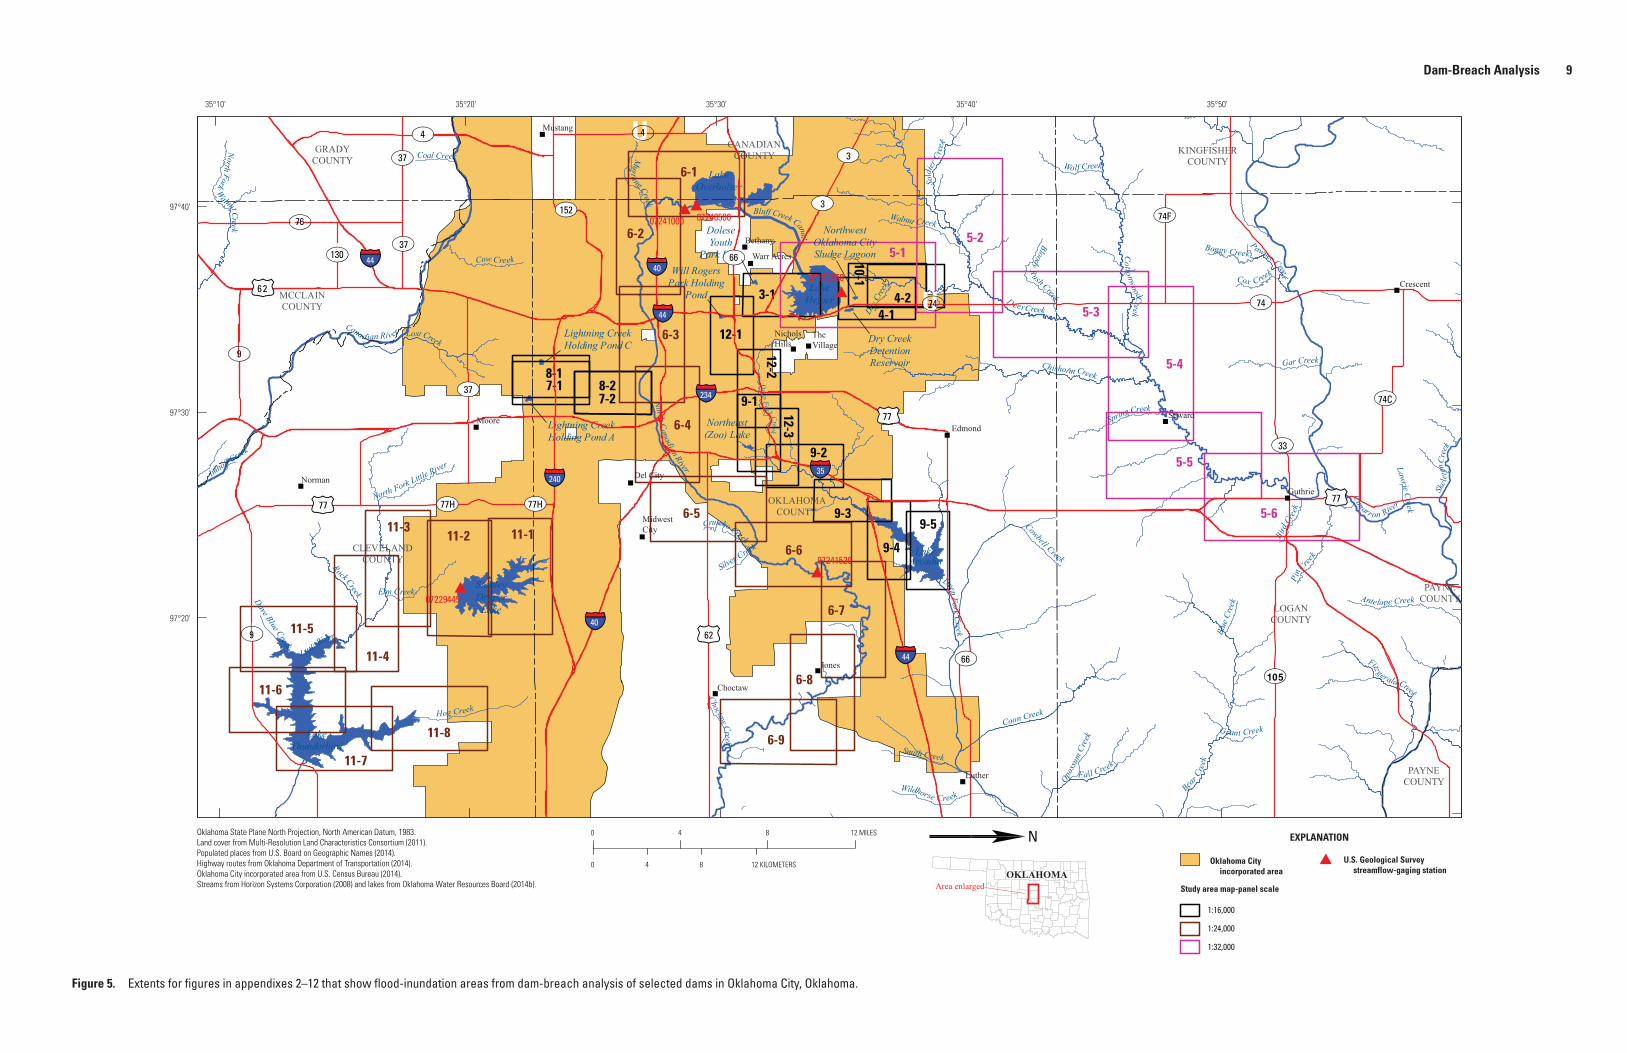
5. Map showing extents for figures in appendixes 3–12 that show flood-inundation areas from dam-breach analysis of selected dams in Oklahoma City, Oklahoma ........................................................................9
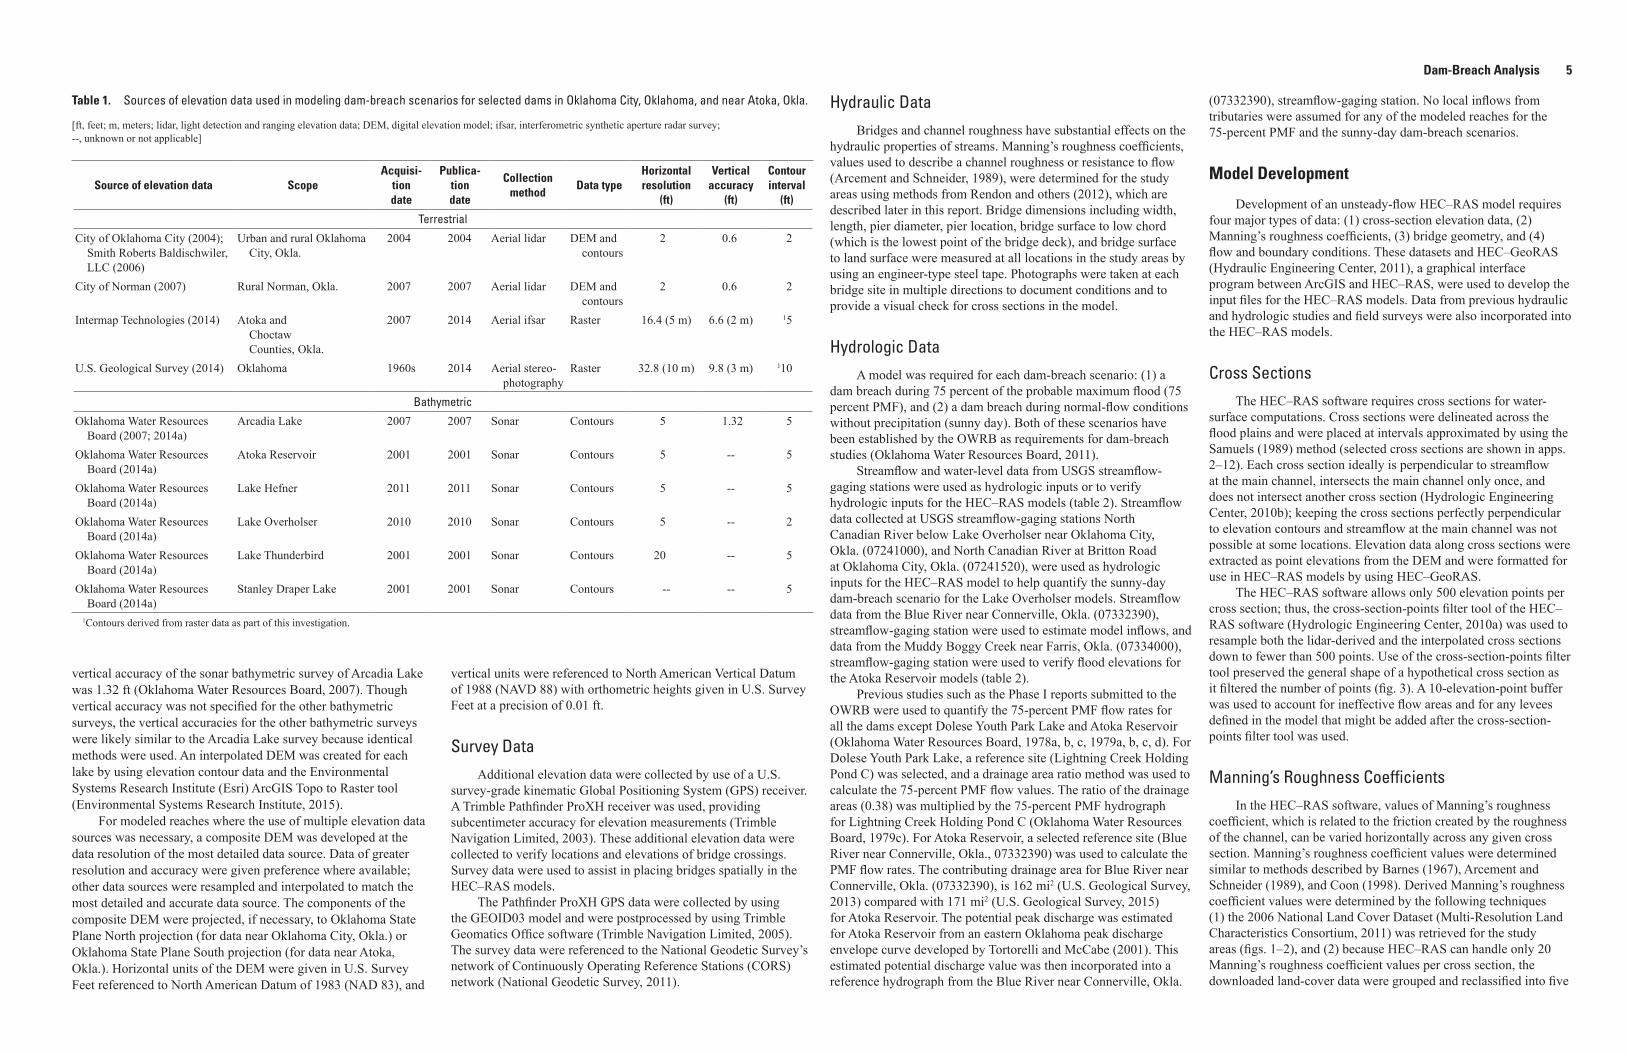
Tables 1. Sources of elevation data used in modeling dam-breach scenarios for selected dams in
Oklahoma City, Oklahoma, and near Atoka, Okla. ...................................................................................................................5 2. U.S. Geological Survey streamflow-gaging stations used in developing dam-breach models
for selected dams in Oklahoma City, Oklahoma, and near Atoka, Okla. ..............................................................................6 3. Manning’s roughness coefficients for the calibrated models of the North Canadian River for
Lake Overholser in Oklahoma City, Oklahoma .........................................................................................................................6 4. Hydrologic Engineering Centers River Analysis System input parameters for
selected dams in Oklahoma City, Oklahoma, and near Atoka, Okla. ....................................................................................6 5. Values of Cb offset factor, a function of reservoir volume, for the calibrated models of selected
dams in Oklahoma City, Oklahoma, and near Atoka, Okla. ....................................................................................................7 6. Values of dam-breach parameters used for selected dams in Oklahoma City, Oklahoma,
and near Atoka, Okla ....................................................................................................................................................................7 7. Maximum flood-inundation elevation and time for the 75-percent probable maximum flood
and sunny-day dam-breach scenarios for selected dams in Oklahoma City, Oklahoma, and near Atoka, Okla. .................................................................................................................................................................10
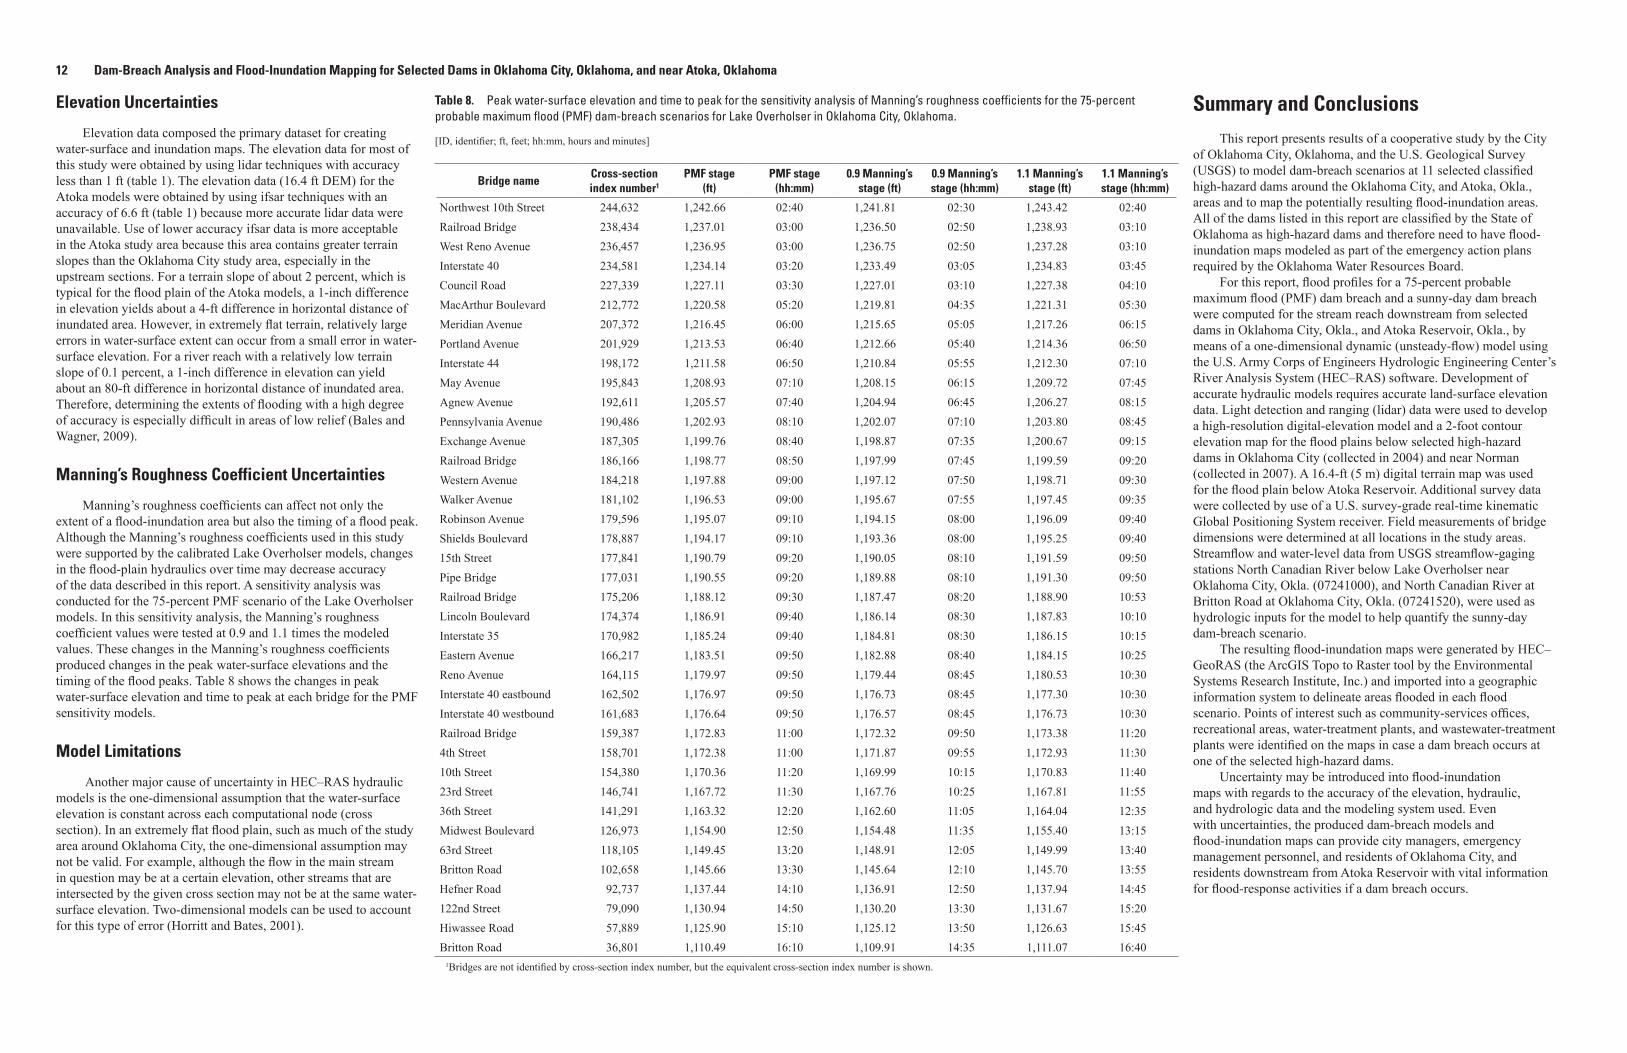
8. Peak water-surface elevation and time to peak for the sensitivity analysis of Manning’s roughness coefficients for the 75-percent probable maximum flood dam-breach scenarios for Lake Overholser in Oklahoma City, Oklahoma. ................................................................................................................12
Conversion Factors
Inch/Pound to International System of Units
Multiply By To obtain
Lengthinch (in.) 2.54 centimeter (cm)foot (ft) 0.3048 meter (m)mile (mi) 1.609 kilometer (km)
Flow ratecubic foot per second (ft3/s) 0.02832 cubic meter per second (m3/s)
International System of Units to Inch/Pound
Multiply By To obtain
Lengthmeter (m) 3.281 foot (ft)
Volumecubic meter (m3) 0.0008107 acre-foot (acre-ft)
Datum
Vertical coordinate information is referenced to the North American Vertical Datum of 1988 (NAVD 88).
Elevation, as used in this report, refers to distance above the vertical datum.
Horizontal coordinate information (U.S. Survey Feet) is referenced to the North American Datum of 1983 (NAD 83).
Supplemental Information
A U.S. Survey Foot is defined as 1 meter = 39.37 inches. Dividing 39.37 inches by 12 (12 inches per foot), the resulting conversion factor is 1 meter = 3.280833333 feet (www.ngs.noaa.gov/faq.shtml).
AbbreviationsDEM digital-elevation modelDTM Digital Terrain MapEAP emergency action planEsri Environmental Systems Research InstituteFEMA Federal Emergency Management AgencyGIS Geographical Information SystemGPS Global Positioning SystemHEC–RAS Hydrologic Engineering Centers River Analysis Systemifsar interferometric synthetic aperture radarlidar light detection and rangingOWRB Oklahoma Water Resources BoardPMF probable maximum floodUSGS U.S. Geological Survey
Dam-Breach Analysis and Flood-Inundation Mapping for Selected Dams in Oklahoma City, Oklahoma, and near Atoka, Oklahoma
By Molly J. Shivers, S. Jerrod Smith, Trevor S. Grout, and Jason M. Lewis
Abstract Dams provide beneficial functions such as flood control,
recreation, and storage of water supplies, but they also entail risk; dam breaches and resultant floods can cause substantial property damage and loss of life. The State of Oklahoma requires each owner of a high-hazard dam, which the Federal Emergency Management Agency defines as dams for which failure or improper operation probably will cause loss of human life, to develop an emergency action plan specific to that dam. Components of an emergency action plan are to simulate a flood resulting from a possible dam breach and map the resulting downstream flood-inundation areas. The resulting flood-inundation maps can provide valuable information to city officials, emergency managers, and local residents for planning an emergency response if a dam breach occurs.
This report presents results of a cooperative study by the U.S. Geological Survey and the City of Oklahoma City to model dam-breach scenarios at 11 dams controlled and operated by Oklahoma City, Okla., and to map the potential flood-inundation areas of such dam breaches. To assist the City of Oklahoma City with completion of the emergency action plans for the 11 dams, the U.S. Geological Survey used light detection and ranging (lidar) elevation data (2004), which produced a 2-foot contour elevation map for the flood plains around Oklahoma City. A 5-meter Digital Terrain Map was used to model the flood plain below Atoka Reservoir in southeastern Oklahoma.
Digital-elevation models, field survey measurements, hydraulic data, and hydrologic data (U.S. Geological Survey streamflow-gaging stations North Canadian River below Lake Overholser near Oklahoma City, Okla. [07241000], and North Canadian River at Britton Road at Oklahoma City, Okla. [07241520]), were used as inputs for the one-dimensional dynamic (unsteady-flow) models using Hydrologic Engineering Centers River Analysis System (HEC–RAS) software. The modeled flood elevations were exported to a geographic information system to produce flood-inundation maps. Water-surface profiles were developed for a 75-percent probable maximum flood dam-breach scenario and a sunny-day dam-breach scenario, as well as for maximum flood-inundation elevations and flood-wave arrival times at selected bridge crossings. Points of interest such as community-services offices, recreational
areas, water-treatment plants, and wastewater-treatment plants were identified on the flood-inundation maps.
IntroductionDams have altered the flow of many of the rivers in the Nation
to provide societal needs such as hydropower, recreation, drinking water, irrigation, and flood control (Collier and others, 1996). Although dams provide many benefits, they also entail risk. A dam breach (failure) can cause rapid downstream flood inundation, causing fatalities and catastrophic damage to infrastructure and the landscape. Some notable historic dam breaches include St. Francis Dam in California, 1928 (Rogers, 2006); Buffalo Creek Dam in West Virginia, 1972 (Davies and others, 1972); and Teton Dam in Idaho, 1976 (Arthur, 1977).
The Oklahoma Water Resources Board inspects more than 4,600 dams in Oklahoma every 5 years and conducts more frequent inspections of high-hazard dams, which the Federal Emergency Management Agency (FEMA) defines as dams for which failure or improper operation will cause loss of human life (Federal Emergency Management Agency, 1998). The Oklahoma Water Resources Board (OWRB) requires the owners of high-hazard dams to develop an emergency action plan (EAP) (Oklahoma Water Resources Board, 2011) that maps or delineates areas of potential flood inundation resulting from a dam breach. Knowledge of the flood-wave timing and flood-inundation area caused by a dam breach can potentially mitigate loss of life and property damage.
A cooperative study by the U.S. Geological Survey (USGS) and the City of Oklahoma City was done to simulate dam-breach scenarios at high-hazard dams and to map the potentially resulting flood-inundation areas. The City of Oklahoma City, Okla., owns and operates several dams and reservoirs, but only 11 dams classified as high hazard were modeled and mapped for this report (figs. 1–2). Dam-breach models and flood-inundation maps were developed for Atoka Reservoir (fig. 1), Dolese Youth Park Lake, Dry Creek Detention Reservoir, Lake Hefner, Lake Overholser, Lightning Creek Holding Pond A, Lightning Creek Holding Pond C, Northeast (Zoo) Lake, Northwest Oklahoma City Sludge Lagoon, Stanley Draper Lake, and Will Rogers Park Holding Pond (fig. 2).
Purpose and ScopeThe purpose of this report is to document the methods and
results of hydraulic dam-breach analysis and present resulting flood-inundation maps for the affected areas downstream from 11 high-hazard dams owned and operated by the City of Oklahoma City. Two dam-breach models were developed for each for the 11 selected dams: (1) for a 75-percent probable maximum flood scenario, and (2) for a sunny-day scenario. Results presented in this report can be used to assist the City of Oklahoma City in identifying and mitigating areas at risk if a dam breach occurs. Information regarding limitations on use of the flood-inundation maps is presented in appendix 1. Appendixes in this report can be accessed from the report Index Page (http://pubs.usgs.gov/sir/2015/5052/).
Results of these analyses also can be used to assist the City of Oklahoma City by providing (1) flood-inundation maps, (2) hydraulic models, (3) elevation data for the study areas, and (4) detailed hydraulic information about reaches in the study areas. The 75-percent probable maximum flood model scenario is defined as an inflow hydrograph of 75 percent of the design flood that equals the top of the dam (Oklahoma Water Resources Board, 2011). The sunny-day model scenario is defined as the reservoir at its maximum normal operating pool level (Oklahoma Water Resources Board, 2011).
Description of Selected Dams and LakesCharacteristics of selected dams were compiled primarily
from Phase I reports submitted to the OWRB (Oklahoma Water Resources Board, 1978a, b, c, 1979a, b, c, d). Additional sources (U.S. Geological Survey, 2013; City of Oklahoma City, 2014) were used to describe the characteristics of Atoka Reservoir and Dolese Youth Park Lake.
Atoka Reservoir
Atoka Reservoir is approximately 100 miles (mi) southeast of Oklahoma City (fig. 1). The reservoir was constructed in 1959 by the City of Oklahoma City to serve as a water-supply source
(U.S. Geological Survey, 2013). The reservoir was impounded by an earth-filled dam. The normal pool elevation of this reservoir is 590 feet (ft) (North American Vertical Datum of 1988 [NAVD 881]), with a maximum pool elevation of 602.5 ft; the lake covers approximately 5,477 acres with a storage volume of 123,500 acre-feet (acre-ft) (U.S. Geological Survey, 2013). Water from Atoka Reservoir is transported into Stanley Draper Lake through a 60-inch pipeline (U.S. Geological Survey, 2013).
Dolese Youth Park Lake
Dolese Youth Park Lake is part of a municipal park located in the northwestern part of Oklahoma City (fig. 2). This park was once a mining site that was donated to the community (City of Oklahoma City, 2014). Dolese Youth Park Lake is a 19.68-acre lake that was impounded for recreational purposes (City of Oklahoma City, 2014). The lake is impounded by a concrete and earth-filled dam on the northeastern side of the lake. Water flowing through the outlet of Dolese Youth Park Lake flows north toward Lake Hefner.
Dry Creek Detention Reservoir
The Dry Creek Detention Reservoir is in the northwestern part of Oklahoma City, east of Lake Hefner (fig. 2). This detention pond was built in 1978 with an earth-filled dam section on the northern end (Oklahoma Water Resources Board, 1978a). Two lateral concrete drains divide the reservoir area into three sections and carry runoff into a longitudinal concrete drain along the eastern side of the detention pond (Oklahoma Water Resources Board, 1978a). An emergency spillway is located on the northwestern end of the earth-filled dam. The Dry Creek Detention Reservoir averages 1,770 ft in length and 350 ft in width with the top of the dam elevation being 1,157 ft (NAVD 88; Oklahoma Water Resources Board, 1978a). Dry Creek Detention Reservoir is dry most of the time and serves only as a holding pond during periods of runoff (Oklahoma Water Resources Board, 1978a).
1 Conversions from National Geodetic Vertical Datum of 1929 (NGVD 29) to NAVD 88 were made using an orthometric height conversion tool (National Oceanic and Atmospheric Administration, 2015).
2 Dam-Breach Analysis and Flood-Inundation Mapping for Selected Dams in Oklahoma City, Oklahoma, and near Atoka, Oklahoma
0 4 8 12 MILES
0 4 8 12 KILOMETERS
95°40'95°50'96°0'96°10'96°20'96°30'96°40'
34°30'
34°20'
34°10'
Area enlarged
OKLAHOMAOKLAHOMAOklahomaCityOklahomaCity
69
271
22
3B
3
48
3
22
487D
43
43
199
99
31
48
9 9
7
348A
78
31
7
2
22
Atoka
Farris
Lane
Stringtown
Tushka
Flora
Bruno
31B 75
laf15-CSSH00-0684_fig01
S andyCreekS andyCreek
ngtPenni
onCreek
Glasses Cre ek
Caney Creek
Blue River
Littl eBlue
Creek
BellCree
k
Litt le WestBlue
Creek
Bi g Branch
Kansa
s Cree
k
rReed
erC
eek
John
son
Cree
k
WashitaRiver
OldCh
an
nel
Simo
nC
reek
Salt Creek
LittleBlue
Rive
r
Fron
terh
ouse
Cree
k
BuzzardCre ek
AtokaReservoir
AtokaReservoir
McGee Creek
RockCreek
Br ierCreek
RayCreek
Fobb Creek
Owl Cre ek
Kiam
ichiRiver
North
Boggy Creek
Dunf
ord C
reek
Chilly CreekCan
yonC
reek
Camp
bellC
reek
PotapoC
re ek
TenmileCreek
IngersollCreek
Clear Boggy Creek
Caddo Creek
Buck Creek
Ch ickasaw Creek
Coon
Creek
ClearC
reek
D elawa reCreek
Harr
ington
BranchBois
d 'ArcCreek
Spri
ngC r
eek
BeaverdamCreek
Davenport Creek
BigSandy
Creek
Shaw
neeCreek
Char
lie Cr
eek
Mayhew Cree
k
Pine
Creek
Sand Creek
Goose Creek
Cowpen Creek
Pecan C reek
Bee Creek
ElmCreekLeader
Creek
BokchitoC
reek
CoalC ree k
Cole
Cree
k
Str
aight Creek
Augu
stCr
eek
Long
Branch
Tany
ard C
reek
Crow
der C
reek
Davis
Cree
k
Wildhorse Creek
Mill
Cree
k
Red River
McGeeCreekReservoir
Dumpling Cre ek
DryBoggyCreek
Brea
dtow
nCr
eek
PONTOTOCCOUNTY
JOHNSTONCOUNTY
MARSHALLCOUNTY BRYAN
COUNTY
CHOCTAWCOUNTY
ATOKACOUNTY
PUSHMATAHACOUNTY
COALCOUNTY
Oklahoma State Plane North Projection, North American Datum, 1983.Land cover from Multi-Resolution Land Characteristics Consortium (2011).Populated places from U.S. Board on Geographic Names (2014).Highway routes from Oklahoma Department of Transportation (2014).Oklahoma City incorporated area from U.S. Census Bureau (2014).Streams from Horizon Systems Corporation (2008) and lakes from Oklahoma Water Resources Board (2014b).
07333010
07334000
07332390
EXPLANATION
Land cover, 2006, and Manning's roughness coefficient
Water; 0.034Developed, open space; 0.045Developed, urban; 0.18Barren, crop, pasture, and grassland; 0.048Forest, scrub/shrub, and wetland; 0.19
U.S. Geological Survey streamflow-gaging station
Figure 1. Study area and Manning’s roughness coefficients for dam-breach analysis of a selected dam near Atoka, Oklahoma.
Description of Selected Dams and Lakes 3
Deep For k Creek
£7 7 £7 7
£6 2
7 7
6 2
7 7 H
U4
1 3 0
1 5 2
U3 7
6 6
3 7
U9
3
U3 3
UB
U9
U7 7 H
U7 4 F
4
U3 7
U7 4
U7 6
U7 4 C
3
U1 0 5U6 6
7 4
§3 5
§̈4 4
§4 0
§4 4
§̈2 3 5
§4 4
2 4 0
§̈4 0
laf15-CSSH00-0684_fig02
Note: Some streamflow-gaging stations shown on the figure were not used in the dam-breach analysis; however, the locations of the stations may be beneficial in the use of the flood-inundation maps.
#
#
##
#
07229445
07240500
07241520
07159550
07241000
CANADIANCOUNTY
GRADYCOUNTY
MCCLAINCOUNTY
CLEVELANDCOUNTY
OKLAHOMACOUNTY
LOGANCOUNTY
PAYNECOUNTY
PAYNECOUNTY
KINGFISHERCOUNTY
LakeArcadia
LakeHefner
Northeast(Zoo) Lake
LakeOverholser
StanleyDraperLake
LakeThunderbird
NorthwestOklahoma CitySludge Lagoon
Will RogersPark Holding
Pond
Dry CreekDetentionReservoir
Lightning CreekHolding Pond C
DoleseYouth
Park Lake
Lightning CreekHolding Pond A
Gar Creek
Opos
sum
Cree
k
Pin
Creek
Cox Creek
Fitz gerald Creek
Wildhorse Creek
Coal Creek
Imhoff Creek
Grant Creek
Wolf Creek
Bear Cr
eek
Coon Creek
Ske l
eton
Cre
ek
Blue
Cre
ek
BloodyR
ush Creek
Spring Creek
Fall Creek
Bl uffCreek
Soldi
erCre
ek
Rock CreekBird
Creek
Cott o nw
oodCreek
Chishol m Creek
Hog Creek
MustangCreek
Smith Creek
Walnut Creek
Dry C
reek
Lost Creek
Antelope Creek
LawrieCreek
L ittleRiver
Boggy Creek
Pawnee Creek
ChoctawCree k
Cow Creek
Cowbell Creek
Crutcho Creek
Dave Blue Creek
Silver Creek
Elm Creek
D eerCreek
North Fork LittleRiver
NorthFork
W
alnutCreek
Canad ian River
Cim arronRiver
North CanadianRiver
Bluff Creek Canal
Deep Fork Creek
0 4 8 12 MILES
0 4 8 12 KILOMETERS
97°40'
97°30'
97°20'
35°10' 35°50'35°40'35°30'35°20'
NOklahoma State Plane North Projection, North American Datum, 1983.Land cover from Multi-Resolution Land Characteristics Consortium (2011).Populated places from U.S. Board on Geographic Names (2014).Highway routes from Oklahoma Department of Transportation (2014).Oklahoma City incorporated area from U.S. Census Bureau (2014).Streams from Horizon Systems Corporation (2008) and lakes from Oklahoma Water Resources Board (2014b).
"
"
"
"
"
"
"
"
"
Choctaw
Del City
Jones
MidwestCity
Moore
Norman
" Mustang
" Luther
Edmond
TheVillage
NicholsHills
Guthrie"
" Seward
" Crescent
""
Bethany
Warr Acres
EXPLANATION
Oklahoma City incorporated areaLand cover, 2006, and Manning's roughness coefficient
Water; 0.034Developed, open space; 0.045Developed, urban; 0.18Barren, crop, pasture, and grassland; 0.048Forest, scrub/shrub, and wetland; 0.19
U.S. Geolgical Survey streamflow-gaging stationArea enlarged
OKLAHOMAOKLAHOMA
Figure 2. Study area and Manning’s roughness coefficients for dam-breach analysis of selected dams in Oklahoma City, Oklahoma.
4 Dam-Breach Analysis and Flood-Inundation Mapping for Selected Dams in Oklahoma City, Oklahoma, and near Atoka, Oklahoma
Lake Hefner
Lake Hefner is in Oklahoma County about 8 mi northwest of downtown Oklahoma City (fig. 2). Lake Hefner was constructed in 1947 by the City of Oklahoma City for the main purpose of water supply (U.S. Geological Survey, 2013). The lake was formed by an earth-filled dam, which is more than 3 mi long with a maximum height of 112 ft (U.S. Geological Survey, 2013). The maximum storage capacity of this lake is 107,000 acre-ft at an elevation of 1,209 ft (NAVD 88) (U.S. Geological Survey, 2013). The source of water for Lake Hefner is water diverted from the North Canadian River at Lake Overholser through Bluff Creek Canal and runoff in the local drainage basin (U.S. Geological Survey, 2013).
Lake Overholser
Lake Overholser is on the Oklahoma and Canadian County line about 8 mi west of downtown Oklahoma City (fig 2). Lake Overholser was completed and began storing water in 1917 (Oklahoma Water Resources Board, 1979a). In 1923, the dam was partly washed out and was rebuilt in 1924 (Oklahoma Water Resources Board, 1979a). Lake Overholser is formed by a dam flanked by long earth-filled sections. The dam consists of a buttress type concrete dam and spillway that is approximately 1,260 ft long and 61 ft high with a low earth-filled embankment extending 3 mi to the west and north (Oklahoma Water Resources Board, 1979a). The outlet of the dam consists of 23 tainter gates and one uncontrolled spillway (Oklahoma Water Resources Board, 1979a). The maximum storage capacity of Lake Overholser is 17,100 acre-ft at an elevation of 1,242 ft (NAVD 88; U.S. Geological Survey, 2013). A bypass levee separates the North Canadian River from the east shore of Lake Overholser and extends 1.75 mi northward from the spillway to a concrete rollover dam (Oklahoma Water Resources Board, 1979a). The lake is supplied with water from the North Canadian River over the rollover dam (Oklahoma Water Resources Board, 1979a).
Lightning Creek Holding Pond A
Lightning Creek Holding Pond A is in Oklahoma County on the south side of Oklahoma City (fig. 2). Lightning Creek Holding Pond A was completed in 1977 and is normally dry (Oklahoma Water Resources Board, 1979b). The primary purpose of Lightning Creek Holding Pond A is storage of floodwaters during periods of heavy rainfall (Oklahoma Water Resources Board, 1979b). During periods of heavy rainfall a release gate is opened manually. Lightning Creek Holding Pond A consists of a rectangular shaped reservoir storage area formed by an earth-filled dam, with the only outlet being a concrete conduit. There is no designated spillway, but a natural spillway at the southeastern corner allows incoming water above an elevation of 1,292 ft (NAVD 88) to bypass the holding pond (Oklahoma Water Resources Board, 1979b). Lightning Creek Holding Pond A is a relatively small storage pond that is only 18 ft above the streambed and has only 541 acre-ft of storage (Oklahoma Water Resources Board, 1979b).
Lightning Creek Holding Pond C
Lightning Creek Holding Pond C is in Oklahoma County on the southern side of Oklahoma City (fig. 2). Lightning Creek Holding Pond C was completed in 1977 and is normally dry (City of Oklahoma City, 2014). The primary purpose of Lightning Creek Holding Pond C is temporary storage of floodwaters during periods of heavy rainfall (City of Oklahoma City, 2014). Lightning Creek Holding Pond C is a relatively small storage pond with a dam that has a height of 16 ft above the streambed (City of Oklahoma City, 2014). The storage capacity of Lightning Creek Holding Pond C was calculated to be approximately 187 acre-ft.
Northeast (Zoo) Lake
Northeast (Zoo) Lake is on a tributary to the Deep Fork Creek in northeastern Oklahoma City (fig.2). The Northeast (Zoo) Lake dam is an earth-filled dam that was built for recreational purposes and is approximately 850 ft long with a maximum height of 43 ft (Oklahoma Water Resources Board, 1978b). The spillway of this lake is on the eastern abutment of the dam and has an elevation of 1,098 ft (NAVD 88) (Oklahoma Water Resources Board, 1978b). Normal pool levels are maintained by a spillway. The total storage from the top of the dam is 800 acre-ft (Oklahoma Water Resources Board, 1978b).
Northwest Oklahoma City Sludge Lagoon
The Northwest Oklahoma City Sludge Lagoon is on a tributary to Bluff Creek, north of Lake Hefner, in northwestern Oklahoma County (fig. 2). The dam at the Northwest Oklahoma City Sludge Lagoon is an earth-filled embankment that was built in 1954 and is about 1,265 ft long and 30 ft high (Oklahoma Water Resources Board, 1978c). The maximum storage for the lagoon is 403 acre-ft (Oklahoma Water Resources Board, 1978c). The Northwest Oklahoma City Sludge Lagoon is used by the City of Oklahoma City to recycle and reuse water from the Lake Hefner drinking-water treatment plant (Oklahoma Water Resources Board, 1978c).
Stanley Draper Lake
Stanley Draper Lake is in Cleveland County about 12 mi southeast of downtown Oklahoma City (fig.2). Stanley Draper Lake was formed by a compacted earth dam constructed in 1962 for the primary purpose of water supply (Oklahoma Water Resources Board, 1979c). The earth-filled embankment is about 6,900 ft long and 111 ft high with a 1,000-ft long dike section in the western abutment area (Oklahoma Water Resources Board, 1979c). A circular intake tower and two 60-inch pipes convey water through a conduit and open ditch to a water treatment plant (Oklahoma Water Resources Board, 1979c). The top of the dam has an elevation of 1,201 ft (NAVD 88), and the lake has a maximum storage capacity of 148,000 acre-ft of water (U.S. Geological Survey, 2013).
Will Rogers Park Holding Pond
Will Rogers Park Holding Pond is in Oklahoma County approximately 4.5 mi northwest of downtown Oklahoma City (fig. 2). Will Rogers Park Holding Pond was completed in 1967 and is normally dry (Oklahoma Water Resources Board, 1979d). During periods of heavy rainfall, a release gate is opened manually and water flows from this pond into the Deep Fork Creek. The primary purpose of Will Rogers Park Holding Pond is temporary storage of floodwaters during periods of heavy rainfall in the upper Deep Fork Creek area (Oklahoma Water Resources Board, 1979d). The Will Rogers Park Holding Pond was formed by an earth-filled dam that is approximately 1,050 ft long (Oklahoma Water Resources Board, 1979d). The main spillway is located on a low section of the dam and has an elevation of 1,192 ft (NAVD 88; Oklahoma Water Resources Board, 1979d). An additional spillway capacity is provided by a paved roadway that crosses the pond at an elevation of 1,195 ft (NAVD 88; Oklahoma Water Resources Board, 1979d). Maximum storage capacity is estimated at 323 acre-ft (Oklahoma Water Resources Board, 1979d).
Dam-Breach AnalysisPreviously collected data used for this analysis included
streamflow data from USGS streamflow-gaging stations North Canadian River below Lake Overholser near Oklahoma City, Okla. (07241000), North Canadian River at Britton Road at Oklahoma City, Okla. (07241520), Blue River near Connerville, Okla. (07332390), and Muddy Boggy Creek near Farris, Okla. (07334000). Data from previously collected bathymetric surveys of Arcadia Lake, Atoka Reservoir, Lake Hefner, Lake Overholser, Lake Thunderbird, and Stanley Draper Lake were used as well as previously collected aerial lidar elevation data from 2004 for the Oklahoma City area, and 16.4 ft (5 m) Digital Terrain Map (DTM) elevation data for the Atoka Reservoir and areas downstream from that reservoir. New data used for this analysis included surveying data and hydraulic and hydrologic measurements.
Model Selection
The one-dimensional dynamic (unsteady-flow) modeling software Hydrologic Engineering Centers River Analysis System (HEC–RAS; version 4.1) was used to simulate flow of water in the study areas (Hydrologic Engineering Center, 2010a). One-dimensional hydraulic analysis, in which the water-surface elevation is assumed to be constant over each computational cross section, can be performed by using HEC–RAS (Hydrologic Engineering Center, 2010a). Given the dynamic nature of a flood wave produced by a dam breach, as well as the size and geometry of the reservoirs in question, the unsteady-flow water-surface profile computation mode was used for all dam-breach scenarios. In unsteady-flow mode, HEC–RAS is capable of simulating subcritical as well as supercritical flows, both of which are commonly encountered in dam-breach analyses (Hydrologic Engineering
Center, 2010a). For most of the modeled reaches, the flow was subcritical, with the velocity of flow being slower than the speed that a wave would propagate; however, supercritical flow—flow with velocity faster than the wave propagation speed—is likely to occur near the location of a dam breach.
Data Inputs for Hydraulic Model
Development of accurate hydraulic models requires accurate elevation data to define the hydraulic conditions from which flood elevations can be computed. Development of accurate flood-inundation maps requires high-resolution elevation data of known accuracy. More accurate elevation data can be used to produce more accurate flood-inundation maps (Horritt and Bates, 2001). Field surveys produce the most accurate elevation data but can be time-consuming and expensive to collect over large areas. Light detection and ranging (lidar) is an airborne laser-profiling system that rapidly produces closely spaced elevation data points that define the heights of the ground surface (bare earth) and above-ground features such as vegetation, bridges, and buildings (Barlow and others, 2008). The ground data points are computer-processed to generate a bare-earth digital-elevation model (DEM) that represents the surface of the Earth without above-ground features. Bare-earth DEMs are useful for hydraulic modeling over large areas.
Elevation Data
Land-surface elevations were determined from a DEM created from the most detailed data sources available for the study areas (table 1). These data sources included aerial-based lidar surveys, aerial-based interferometric synthetic aperture radar (ifsar) surveys, aerial-based stereo photogrammetric surveys, and watercraft-based sonar bathymetric surveys. The lidar surveys were conducted in 2004 for about 752 square miles (mi2) in Oklahoma City, Okla. (City of Oklahoma City, 2004), and in 2007 for about 138 mi2 during leaf-off, snow-free conditions near Norman, Okla. (City of Norman, 2007). The resulting bare-earth lidar DEMs each had a horizontal resolution of 2 ft. Vertical accuracy of the lidar survey points was 0.6 ft. An ifsar survey was conducted downstream from Atoka Reservoir in Atoka County during leaf-off conditions from February 26, 2007, to March 22, 2007, for about 222 mi2 in Atoka and Choctaw Counties, Okla. (Intermap Technologies, Inc., 2014). The resulting ifsar DEM had a horizontal resolution of 16.4 ft (5 m). Vertical accuracy of the ifsar survey points was less than 6.6 ft (2 m). For other terrestrial areas, mostly in rural settings, National Elevation Dataset elevation data from aerial-based stereo photogrammetric surveys were obtained as a DEM (U.S. Geological Survey, 2014). The USGS DEM had a horizontal resolution of 32.8 ft (10 m). The USGS DEM vertical accuracy of survey control points was less than 9.8 ft (3 m; Gesch and others, 2014).
Sonar bathymetric surveys were available as survey points and interpreted elevation contours for Arcadia Lake, Atoka Reservoir, Lake Hefner, Lake Overholser, Lake Thunderbird, and Stanley Draper Lake (Oklahoma Water Resources Board, 2014a). The
Dam-Breach Analysis 5
Table 1. Sources of elevation data used in modeling dam-breach scenarios for selected dams in Oklahoma City, Oklahoma, and near Atoka, Okla.
[ft, feet; m, meters; lidar, light detection and ranging elevation data; DEM, digital elevation model; ifsar, interferometric synthetic aperture radar survey; --, unknown or not applicable]
Source of elevation data ScopeAcquisi-
tion date
Publica-tion date
Collection method
Data typeHorizontal resolution
(ft)
Vertical accuracy
(ft)
Contour interval
(ft)
Terrestrial
City of Oklahoma City (2004); Smith Roberts Baldischwiler, LLC (2006)
Urban and rural Oklahoma City, Okla.
2004 2004 Aerial lidar DEM and contours
2 0.6 2
City of Norman (2007) Rural Norman, Okla. 2007 2007 Aerial lidar DEM and contours
2 0.6 2
Intermap Technologies (2014) Atoka and Choctaw Counties, Okla.
2007 2014 Aerial ifsar Raster 16.4 (5 m) 6.6 (2 m) 15
U.S. Geological Survey (2014) Oklahoma 1960s 2014 Aerial stereo-photography
Raster 32.8 (10 m) 9.8 (3 m) 110
Bathymetric
Oklahoma Water Resources Board (2007; 2014a)
Arcadia Lake 2007 2007 Sonar Contours 5 1.32 5
Oklahoma Water Resources Board (2014a)
Atoka Reservoir 2001 2001 Sonar Contours 5 -- 5
Oklahoma Water Resources Board (2014a)
Lake Hefner 2011 2011 Sonar Contours 5 -- 5
Oklahoma Water Resources Board (2014a)
Lake Overholser 2010 2010 Sonar Contours 5 -- 2
Oklahoma Water Resources Board (2014a)
Lake Thunderbird 2001 2001 Sonar Contours 20 -- 5
Oklahoma Water Resources Board (2014a)
Stanley Draper Lake 2001 2001 Sonar Contours -- -- 5
1Contours derived from raster data as part of this investigation.
vertical accuracy of the sonar bathymetric survey of Arcadia Lake was 1.32 ft (Oklahoma Water Resources Board, 2007). Though vertical accuracy was not specified for the other bathymetric surveys, the vertical accuracies for the other bathymetric surveys were likely similar to the Arcadia Lake survey because identical methods were used. An interpolated DEM was created for each lake by using elevation contour data and the Environmental Systems Research Institute (Esri) ArcGIS Topo to Raster tool (Environmental Systems Research Institute, 2015).
For modeled reaches where the use of multiple elevation data sources was necessary, a composite DEM was developed at the data resolution of the most detailed data source. Data of greater resolution and accuracy were given preference where available; other data sources were resampled and interpolated to match the most detailed and accurate data source. The components of the composite DEM were projected, if necessary, to Oklahoma State Plane North projection (for data near Oklahoma City, Okla.) or Oklahoma State Plane South projection (for data near Atoka, Okla.). Horizontal units of the DEM were given in U.S. Survey Feet referenced to North American Datum of 1983 (NAD 83), and
vertical units were referenced to North American Vertical Datum of 1988 (NAVD 88) with orthometric heights given in U.S. Survey Feet at a precision of 0.01 ft.
Survey DataAdditional elevation data were collected by use of a U.S.
survey-grade kinematic Global Positioning System (GPS) receiver. A Trimble Pathfinder ProXH receiver was used, providing subcentimeter accuracy for elevation measurements (Trimble Navigation Limited, 2003). These additional elevation data were collected to verify locations and elevations of bridge crossings. Survey data were used to assist in placing bridges spatially in the HEC–RAS models.
The Pathfinder ProXH GPS data were collected by using the GEOID03 model and were postprocessed by using Trimble Geomatics Office software (Trimble Navigation Limited, 2005). The survey data were referenced to the National Geodetic Survey’s network of Continuously Operating Reference Stations (CORS) network (National Geodetic Survey, 2011).
Hydraulic DataBridges and channel roughness have substantial effects on the
hydraulic properties of streams. Manning’s roughness coefficients, values used to describe a channel roughness or resistance to flow (Arcement and Schneider, 1989), were determined for the study areas using methods from Rendon and others (2012), which are described later in this report. Bridge dimensions including width, length, pier diameter, pier location, bridge surface to low chord (which is the lowest point of the bridge deck), and bridge surface to land surface were measured at all locations in the study areas by using an engineer-type steel tape. Photographs were taken at each bridge site in multiple directions to document conditions and to provide a visual check for cross sections in the model.
Hydrologic DataA model was required for each dam-breach scenario: (1) a
dam breach during 75 percent of the probable maximum flood (75 percent PMF), and (2) a dam breach during normal-flow conditions without precipitation (sunny day). Both of these scenarios have been established by the OWRB as requirements for dam-breach studies (Oklahoma Water Resources Board, 2011).
Streamflow and water-level data from USGS streamflow-gaging stations were used as hydrologic inputs or to verify hydrologic inputs for the HEC–RAS models (table 2). Streamflow data collected at USGS streamflow-gaging stations North Canadian River below Lake Overholser near Oklahoma City, Okla. (07241000), and North Canadian River at Britton Road at Oklahoma City, Okla. (07241520), were used as hydrologic inputs for the HEC–RAS model to help quantify the sunny-day dam-breach scenario for the Lake Overholser models. Streamflow data from the Blue River near Connerville, Okla. (07332390), streamflow-gaging station were used to estimate model inflows, and data from the Muddy Boggy Creek near Farris, Okla. (07334000), streamflow-gaging station were used to verify flood elevations for the Atoka Reservoir models (table 2).
Previous studies such as the Phase I reports submitted to the OWRB were used to quantify the 75-percent PMF flow rates for all the dams except Dolese Youth Park Lake and Atoka Reservoir (Oklahoma Water Resources Board, 1978a, b, c, 1979a, b, c, d). For Dolese Youth Park Lake, a reference site (Lightning Creek Holding Pond C) was selected, and a drainage area ratio method was used to calculate the 75-percent PMF flow values. The ratio of the drainage areas (0.38) was multiplied by the 75-percent PMF hydrograph for Lightning Creek Holding Pond C (Oklahoma Water Resources Board, 1979c). For Atoka Reservoir, a selected reference site (Blue River near Connerville, Okla., 07332390) was used to calculate the PMF flow rates. The contributing drainage area for Blue River near Connerville, Okla. (07332390), is 162 mi2 (U.S. Geological Survey, 2013) compared with 171 mi2 (U.S. Geological Survey, 2015) for Atoka Reservoir. The potential peak discharge was estimated for Atoka Reservoir from an eastern Oklahoma peak discharge envelope curve developed by Tortorelli and McCabe (2001). This estimated potential discharge value was then incorporated into a reference hydrograph from the Blue River near Connerville, Okla.
(07332390), streamflow-gaging station. No local inflows from tributaries were assumed for any of the modeled reaches for the 75-percent PMF and the sunny-day dam-breach scenarios.
Model Development
Development of an unsteady-flow HEC–RAS model requires four major types of data: (1) cross-section elevation data, (2) Manning’s roughness coefficients, (3) bridge geometry, and (4) flow and boundary conditions. These datasets and HEC–GeoRAS (Hydraulic Engineering Center, 2011), a graphical interface program between ArcGIS and HEC–RAS, were used to develop the input files for the HEC–RAS models. Data from previous hydraulic and hydrologic studies and field surveys were also incorporated into the HEC–RAS models.
Cross SectionsThe HEC–RAS software requires cross sections for water-
surface computations. Cross sections were delineated across the flood plains and were placed at intervals approximated by using the Samuels (1989) method (selected cross sections are shown in apps. 2–12). Each cross section ideally is perpendicular to streamflow at the main channel, intersects the main channel only once, and does not intersect another cross section (Hydrologic Engineering Center, 2010b); keeping the cross sections perfectly perpendicular to elevation contours and streamflow at the main channel was not possible at some locations. Elevation data along cross sections were extracted as point elevations from the DEM and were formatted for use in HEC–RAS models by using HEC–GeoRAS.
The HEC–RAS software allows only 500 elevation points per cross section; thus, the cross-section-points filter tool of the HEC–RAS software (Hydrologic Engineering Center, 2010a) was used to resample both the lidar-derived and the interpolated cross sections down to fewer than 500 points. Use of the cross-section-points filter tool preserved the general shape of a hypothetical cross section as it filtered the number of points (fig. 3). A 10-elevation-point buffer was used to account for ineffective flow areas and for any levees defined in the model that might be added after the cross-section-points filter tool was used.
Manning’s Roughness Coefficients In the HEC–RAS software, values of Manning’s roughness
coefficient, which is related to the friction created by the roughness of the channel, can be varied horizontally across any given cross section. Manning’s roughness coefficient values were determined similar to methods described by Barnes (1967), Arcement and Schneider (1989), and Coon (1998). Derived Manning’s roughness coefficient values were determined by the following techniques (1) the 2006 National Land Cover Dataset (Multi-Resolution Land Characteristics Consortium, 2011) was retrieved for the study areas (figs. 1–2), and (2) because HEC–RAS can handle only 20 Manning’s roughness coefficient values per cross section, the downloaded land-cover data were grouped and reclassified into five
6 Dam-Breach Analysis and Flood-Inundation Mapping for Selected Dams in Oklahoma City, Oklahoma, and near Atoka, Oklahoma
Table 2. U.S. Geological Survey streamflow-gaging stations used in developing dam-breach models for selected dams in Oklahoma City, Oklahoma, and near Atoka, Okla.
Station number
Station nameElevation
(feet)Period of record Purpose
07241000 North Canadian River below Lake Overholser near Oklahoma City, Okla.
1,195.14 1952–68, 1969–present (2014) Calibration
07241520 North Canadian River at Britton Road at Oklahoma City, Okla. 1,109.84 1988–present (2014) Calibration
07332390 Blue River near Connervile, Okla. 892.22 1976–present (2014) Reference station
07334000 Muddy Boggy Creek near Farris, Okla. 439.84 1937–present (2014) Verification
laf15-0684_fig3
970
980
990
1,000
1,010
1,020
1,030
Elev
atio
n, in
feet
abo
ve th
e N
orth
Am
eric
an V
ertic
al D
atum
of 1
988
0 1,000 2,000 3,000 4,000 5,000 6,000 7,000 8,000
Distance, in feet
Lidar derived cross section without use of point filter
Lidar derived cross section with use of point filter
EXPLANATION
Figure 3. A hypothetical cross section derived with light detection and ranging (lidar) with and without use of the cross-section-point filter tool in the Hydrologic Engineering Center River Analysis (HEC–RAS) modeling software (Hydrologic Engineering Center, 2010a).
simplified land cover classes (figs. 1–2, table 3). The Manning’s roughness coefficients were then altered when flows from the Lake Overholser sunny-day modeled scenario were calibrated based on USGS streamflow data at the North Canadian River below Lake Overholser near Oklahoma City, Okla. (07241000), and North Canadian River at Britton Road at Oklahoma City, Okla. (07241520), streamflow-gaging stations (table 3). The calibrated Manning’s roughness coefficients were used in all dam-breach models. The mean channel Manning’s roughness coefficient value was 0.034, and the overland Manning’s roughness coefficient values ranged from 0.045 to 0.19 for all the models.
Flow and Boundary Conditions
Initial flow values, input hydrographs, and downstream boundary conditions must be set in a HEC–RAS model. The initial flow values used as the flow-rate input for sunny-day dam-breach scenarios are listed in table 4. The initial flow for the Lake Overholser dam breach 75 percent PMF model was set to 800 cubic feet per second (ft3/s), which is less than the 2-year peak flow and the approximate 5 percent probability of flow exceedance recorded at the USGS streamflow-gaging station North Canadian River below Lake Overholser near Oklahoma
Table 3. Manning’s roughness coefficients for the calibrated models of the North Canadian River for Lake Overholser in Oklahoma City, Oklahoma.
Land use code
NameLand use
classCalibrated Manning’s roughness coefficent
Initial Manning’s roughness coefficent
11 Open water 1 0.034 0.030
21 Developed open space 2 0.045 0.035
22 Developed low intensity 3 0.180 0.100
23 Developed medium intensity 3 0.180 0.100
24 Developed high intensity 3 0.180 0.100
31 Barren land 4 0.048 0.040
41 Deciduous forest 5 0.190 0.150
42 Evergreen forest 5 0.190 0.150
52 Scrub/shrub 5 0.190 0.150
71 Grassland 4 0.048 0.040
81 Pasture 4 0.048 0.040
82 Cultivated crop land 4 0.048 0.040
95 Wetland 5 0.190 0.150
Table 4. Hydrologic Engineering Centers River Analysis System (HEC-RAS) input parameters for selected dams in Oklahoma City, Oklahoma, and near Atoka, Okla.
Model identifierInitial flow values upstream
boundary conditionHydrograph
sourceFriction slope downstream
boundary condition
Atoka Reservoir 300 Blue River near Connerville1 0.000010Dolese Youth Park Lake 200 Drainage area ratio method2 0.000060Dry Creek Detention Reservoir 35 Phase I report3 0.000100Lake Hefner 1,500 Phase I report3 0.000040Lake Overholser 800 Phase I report3 0.000400Lightning Creek Holding Pond A 50 Phase I report3 0.000800Lightning Creek Holding Pond C 50 Phase I report3 0.000800Northeast (Zoo) Lake 300 Phase I report3 0.000230Northwest Oklahoma City Sludge Lagoon 250 Phase I report3 0.000900Stanley Draper Lake 600 Phase I report3 0.002000Will Rogers Park Holding Pond 200 Phase I report3 0.001000
1Extreme peak from Tortorelli and McCabe (2001) combined with Blue River near Connerville, Okla., reference hydrograph.2Lightning Creek Holding Pond C flow values multiplied by drainage area ratio.3Phase I reports (Oklahoma Water Resources Board, 1978a, b, c, 1979a, b, c, d).
City, Okla. (07241000; fig. 2) (Lewis and Esralew, 2009). The 800-ft3/s initial flow value also was used as the flow-rate input for the sunny-day dam-breach scenario. The initial flow for the Atoka Reservoir dam-breach model was set to 300 ft3/s, which is less than the 2-year peak flow and the approximate 30 percent probability of flow exceedance recorded at the USGS streamflow-gaging station Muddy Boggy Creek near Farris, Okla. (07334000; fig. 1) (Lewis and Esralew, 2009). The 300-ft3/s initial flow value also was used as the flow-rate input for the sunny-day dam-breach scenario. The input hydrograph for the 75-percent PMF for most of the individual models was obtained from previous reports such as
the Phase I dam breach inspection reports submitted to the OWRB (Oklahoma Water Resources Board, 1978a, b, c, 1979a, b, c, d). The downstream boundary conditions for each modeled reach are also listed in table 4.
Dam-Breach ParametersThe 75-percent PMF dam-breach scenario was modeled as
an overtopping dam failure whereas the sunny-day scenario was modeled as a piping failure. An estimate of the dam-breach bottom width and time of full failure for use in the selected dam-breach
Sources of Uncertainty in Flood-Inundation Maps 7
models was obtained by using two different dam-breach-sizing equations:
(1) Von Thun and Gillette (1990)
B = 2.5hw+Cb (1)
where B is the average dam-breach-bottom width, in meters;
hw is the volume of water above the dam-breach invert at time of failure, in cubic meters; and
Cb is an offset factor that is a function of reservoir volume (table 5); and
(2) Froehlich (2008)
(2)
where B is the average dam-breach-bottom width, in feet; K is an overtopping multiplier with 1.3 being used
for overtopping and 1.0 being used for a piping failure;
Vw is the volume of water above the dam-breach invert at time of failure, in acre-feet; and
Hb is the height of the dam breach, in feet.
For each of those dam-breach-width determination equations there is a corresponding time of failure equation:
(1) Von Thun and Gillette (1990) For highly erodible dams (3) For erosion-resistant dams (4)
where t is the time to full failure, in hours; B is the average dam-breach-bottom width, in meters;
and hw is the volume of water above the dam-breach invert
at time of failure, in cubic meters; and
(2) Froehlich (2008)
0.32 0.048.239 w bB KV H=
/(4 61)wt B h= +
/(4 )wt B h=
Table 5. Values of Cb offset factor, a function of reservoir volume (Von Thun and Gillette, 1990), for the calibrated models of selected dams in Oklahoma City, Oklahoma, and near Atoka, Okla.
[<, less than; >, greater than]
Size of reservoir (cubic meters)
Cb (meters)
<1.23*106 6.1
1.23*106-6.17*106 18.3
6.17*106-1.23*107 42.7
>1.23*107 54.9
23.664* w
b
Vt
gH= (5)
where t is the time to full failure, in hours; Vw is the volume of water stored above the bottom of
the breach, in acre-feet; g is the gravitational acceleration = 32.2 feet per
second squared (ft/sec2); and Hb is the height of the dam breach, in feet.
A summary of the resultant dam-breach parameters for each of these respective equations is listed in table 6. Each set of resultant dam-breach parameters was evaluated at the dam-breach location for the resulting flow hydrograph, with the selected model parameters for each of the dams yielding a conservative estimate of the dam breach. Most selected dam-breach parameters were within the range of the VonThun and Gillette (1990) and Froehlich (2008) methods except Dry Creek Detention Reservoir, Lightning Creek Holding Pond A, and Will Rogers Park Holding Pond (table 6). The selected dam-breach parameters at these dams were altered to improve model stability. The Atoka Reservoir dam-breach parameters were estimated using the guidelines from the BOSS DAMBRK user’s manual (BOSS, 1999).
Calibration and Sensitivity AnalysisThe Lake Overholser model was the only model with suitable
downstream streamflow-gaging station data to use for calibration. The Lake Overholser model was calibrated by using available data from USGS streamflow-gaging station North Canadian River below Lake Overholser near Oklahoma City, Okla. (07241000; fig. 2), and North Canadian River at Britton Road at Oklahoma City, Okla. (07241520; fig. 2). Measured channel cross sections from discharge measurements made during the same year as the lidar data were incorporated into the model at the gaged locations. Steady-state simulations were run at the 2-, 5-, 10-, 25-, 50-, 100-, and 500-year recurrence intervals and compared to measured stage-discharge relations at the streamflow-gaging stations. Manning’s roughness coefficients were then adjusted (table 3) until there was agreement between the measured stage-discharge relations and the calibrated model. These calibrated Manning’s roughness coefficients were used for all models.
A sensitivity analysis was performed on the different dam-breach parameters (dam-breach-bottom width and time to full failure), as described in the “Dam-Breach Parameters” section of this report, as well as on the Manning’s roughness coefficients. Because of the topography of this area (flat cross sections with relatively steep sides), percent change in total inundated area was not used as the determinant in the Manning’s roughness coefficient sensitivity analysis. For example, the percent difference in flood-inundated area between the 75-percent PMF dam-breach scenario and the sunny-day dam-breach scenario is 22.4 percent for the North Canadian basin downstream from Lake Overholser. For the Manning’s roughness coefficient sensitivity analysis, the time to peak and peak stage at each of the bridges were determined.
Table 6. Values of dam-breach parameters used for selected dams in Oklahoma City, Oklahoma, and near Atoka, Okla.
[ft, feet; hr, hours; values in bold type are outside the range of breach parameters computed by methods described in Von Thun and Gillette (1990) and Froehlich (2008)]
Parameter estimation equation
Dam-breach-bottom width
(ft)
Time to full failure
(hr)Atoka Reservoir
BOSS DAMBRK user’s manual (1999) 0.5 to 4 times dam height
0.5–4.0
Selected model parameter 52.5 1.8Dolese Youth Park Lake
Von Thun and Gillette (1990) 62.5 0.5Froehlich (2008) 48.8 0.3Selected model parameter 55.6 0.4
Dry Creek Detention ReservoirVon Thun and Gillette (1990) 205.5 0.9Froehlich (2008) 520.4 2.6Selected model parameter 120.0 0.5
Lake HefnerVon Thun and Gillette (1990) 385.6 1.1Froehlich (2008) 520.4 2.6Selected model parameter 453.0 1.9
Lake OverholserVon Thun and Gillette (1990) 245.9 1.9Froehlich (2008) 334.4 4.3Selected model parameter 291.0 3.4
Lightning Creek Holding Pond AVon Thun and Gillette (1990) 63.7 0.7Froehlich (2008) 80.3 0.7Selected model parameter 72.0 0.9
Lightning Creek Holding Pond CVon Thun and Gillette (1990) 51.0 0.7Froehlich (2008) 64.6 0.7Selected model parameter 57.8 0.7
Northeast (Zoo) LakeVon Thun and Gillette (1990) 125.0 0.5Froehlich (2008) 105.6 0.4Selected model parameter 115.0 0.5
Northwest Oklahoma City Sludge LagoonVon Thun and Gillette (1990) 96.1 0.5Froehlich (2008) 83.7 0.4Selected model parameter 89.9 0.5
Stanley Draper LakeVon Thun and Gillette (1990) 425.1 1.1Froehlich (2008) 580.7 2.5Selected model parameter 503.0 1.6
Will Rogers Park Holding PondVon Thun and Gillette (1990) 75.0 0.7Froehlich (2008) 69.1 2.4Selected model parameter 28.5 1.0
Postprocessing of Model ResultsAfter each of the models was finalized, the results were imported
into a Geographic Information System (GIS) by using HEC–GeoRAS (Hydrologic Engineering Center, 2011), a set of utilities for postprocessing HEC–RAS model outputs in Esri ArcGIS. Lidar-derived and 5-m DTM cross sections were used to generate the flood-inundation maps. Areas where unmodeled tributaries join the modeled area were adjusted to account for backwater to the confluences to match the elevation contour lines equal to the water-surface elevation at the cross section nearest to each confluence.
Flood-Inundation MappingWater-surface profiles for the 75-percent PMF and sunny-day
dam-breach scenarios were developed for all of the HEC–RAS models. Because of the size of the study areas, the maps of flood-inundation areas were subdivided into map tiles at a 1:16,000 scale for Dolese Youth Park Lake, Dry Creek Detention Reservoir, Lightning Creek Holding Pond A, Lightning Creek Holding Pond C, Northeast (Zoo) Lake, Northwest Oklahoma City Sludge Lagoon, and Will Rogers Park Holding Pond; 1:24,000 scale for Lake Overholser and Stanley Draper Lake; and a 1:32,000 scale for Atoka Reservoir and Lake Hefner (figs. 4–5). Map tiles showing model cross sections, modeled bridges (including culverts), postprocessed for the 75-percent PMF and sunny-day inundated areas, and times to peak stage at bridges for the 75-percent PMF are presented in appendixes 2–12. Maximum flood-inundation elevations and times to peak stage for each bridge for the 75-percent PMF and sunny-day dam-breach scenarios are listed in table 7.
Points of interest such as government and community buildings, public works facilities, schools, hospitals, hotels, places of worship, and other locations where people frequently gather were mapped using Google Earth and are shown for reference on the inundation maps (apps. 2–12). Only selected points of interest are shown on the inundation maps. Parks, which are commonly found in low-lying, flood-prone areas, also are shown for reference on the inundation maps (apps. 2–12).
Sources of Uncertainty in Flood-Inundation Maps
The uncertainty associated with flood-inundation maps may be introduced by errors in elevation or hydraulic data or in the modeling system used to create the flood-inundation map. Data necessary to quantify these errors are seldom available; thus, stringent quality-assurance methods are vital for hydraulic modeling. The potentially flooded areas, limits of flooding, and flood-wave traveltimes are approximate and should be used only as guidelines for management decisions. Actual areas inundated will depend on the particular dam-failure mechanism and preexisting flood conditions and may differ from the areas shown on the maps (Federal Energy Regulatory Commission, 2007). For this reason, isolated inundation areas (those disconnected from the main inundation area) were included on the inundation maps.
8 Dam-Breach Analysis and Flood-Inundation Mapping for Selected Dams in Oklahoma City, Oklahoma, and near Atoka, Oklahoma
laf15-CSSH00-0684_fig04
Area enlarged
OKLAHOMAOKLAHOMA
96°10'
96°0'
95°50'
34°40'34°30'34°20'34°10'34°0'
0 4 8 12 MILES
0 4 8 12 KILOMETERS
N EXPLANATION
Study area map-panel scale
1:32,000
U.S. Geological Survey streamflow-gaging station
07333010
07334000
69
75
3B
3
131
43
70E
70
7
109
2231
43
AtokaReservoir
A tokaReservoir
Chippewa Creek
Roc
kC ree k
Sugar Creek
RayCreek
Keel Creek
SaltCreek
BrushyCreek
White
gr
ass Creek
Breadtown Creek
Little Caney Creek
Lick
Cre
ek
North Boggy Creek
Caddo Creek
PointerCreek
Muddy Boggy Creek Potapo Creek
Chilly CreekCampbell Creek
Lime
stone
Cree
k
Clear Creek
King
Creek
Cold
Sprin
gs Creek
I ngersollCreekM
cGee
Creek
Mail Rider Creek
Tenmile
Creek
Nolleytuby Creek
Chickasaw CreekDelaware Creek
Davis Creek
P rairi e Creek
MillCreek
Buck Creek
Harrington Branch
FivemileCreek
Bois
d'Arc C reek
Coal C reek
Dav
enpo rtCr
eek
Bea verdam Creek
Shawnee Creek
Mayhew Creek
SandCreek
Cowpen Creek
Pine Creek
S andyCreek
Beck Creek
Bokchit o Creek
Straight Creek
Cl
e arBog
gyCr
eek
August Creek
Tanyard Creek
LongBran c h
Baker BranchCaney Creek
FronterhouseCreek
McGeeCreekReservoir
OwlCreek
Dunford Creek
BrierCreek
2-4
2-1
2-2
2-3
2-5
2-6
2-7
2-82-9
Farris
Lane
Bruno
Flora
Stringtown
BRYANCOUNTY
CHOCTAWCOUNTY
PUSHMATAHACOUNTY
PITTSBURGCOUNTY
COALCOUNTY
ATOKACOUNTY
Oklahoma State Plane North Projection, North American Datum, 1983.Land cover from Multi-Resolution Land Characteristics Consortium (2011).Populated places from U.S. Board on Geographic Names (2014).Highway routes from Oklahoma Department of Transportation (2014).Oklahoma City incorporated area from U.S. Census Bureau (2014).Streams from Horizon Systems Corporation (2008) and lakes from Oklahoma Water Resources Board (2014b).
Figure 4. Extents for figures in appendix 2 that show flood-inundation areas from dam-breach analysis of Atoka Reservoir near Atoka, Oklahoma.
Dam-Breach Analysis 9
Oklahoma State Plane North Projection, North American Datum, 1983.Land cover from Multi-Resolution Land Characteristics Consortium (2011).Populated places from U.S. Board on Geographic Names (2014).Highway routes from Oklahoma Department of Transportation (2014).Oklahoma City incorporated area from U.S. Census Bureau (2014).Streams from Horizon Systems Corporation (2008) and lakes from Oklahoma Water Resources Board (2014b).
8-17-1 8-2
7-2
12-1
9-2
9-1
12-3
3-1
12-2
10-1
4-14-2
9-3
9-4
9-5
6-1
6-2
6-3
6-9
6-8
6-7
6-6
6-4
11-111-211-3
11-4
11-5
11-6
11-7
11-8
6-5
5-15-2
5-3
5-4
5-5
5-6
EXPLANATION
Oklahoma City incorporated area
Study area map-panel scale
1:16,000
1:24,000
1:32,000
U.S. Geological Survey streamflow-gaging station
Gar Creek
Opos
sum
Cree
k
P inC
reek
Cox Creek
Fitz gerald Creek
Wildhorse Creek
Coal Creek
Imhoff Creek
Grant Creek
Wolf Creek
Bear Cr
eek
Coon Creek
Ske l
eton
Cre
ek
Blue
Cre
ek
BloodyR
ush Creek
Spring Creek
Fall Creek
Soldi
erCre
ek
Rock CreekBird
Creek
Cott o nw
oodCreek
Chishol m Creek
Hog Creek
MustangCreek
Smith Creek
Walnut Creek
Dry C
reek
Lost Creek
Antelope Creek
LawrieCreek
Little River
Boggy Creek
Pawnee Creek
ChoctawCree k
Cow Creek
Cowbell Creek
Crutcho Creek
Dave Blue Creek
Silver Creek
Elm Creek
D eerCreek
North Fork LittleRiver
NorthFork
W
alnutCreek
Canad ian River
Cim
arr on River
NorthC
ana dian River
LakeArcadia
LakeHefner
Northeast(Zoo) Lake
LakeOverholser
StanleyDraper
Lake
LakeThunderbird
NorthwestOklahoma CitySludge Lagoon
Will RogersPark Holding
Pond
Dry CreekDetentionReservoir
Lightning CreekHolding Pond C
DoleseYouth
Park Lake
Lightning CreekHolding Pond A
Bluff Creek Canal
Deep Fork Creek
Deep For k Creek
PAYNECOUNTY
PAYNECOUNTY
KINGFISHERCOUNTY
LOGANCOUNTY
CANADIANCOUNTY
GRADYCOUNTY
MCCLAINCOUNTY
OKLAHOMACOUNTY
CLEVELANDCOUNTY
EdmondSeward
Norman
Moore
Mustang
MidwestCity
Del City
Choctaw
Jones
Luther
Bethany
Warr Acres
NicholsHills
TheVillage
Guthrie
Crescent
97°40'
97°30'
97°20'
35°10' 35°50'35°40'35°30'35°20'
0 4 8 12 MILES
0 4 8 12 KILOMETERS
N
£77
£6 2
77
62
4
U130
152
37
66
U9
3
33
U9
74F
U4
37
74
U76
74C
3
66
U74
§̈35
§4440
44
234
44
§240
40
37
77 77H 77H
UV105
laf15-CSSH00-0684_fig05
07229445
07240500
07241520
07159550
07241000
Area enlargedOKLAHOMAOKLAHOMA
Figure 5. Extents for figures in appendixes 2–12 that show flood-inundation areas from dam-breach analysis of selected dams in Oklahoma City, Oklahoma.
10 Dam-Breach Analysis and Flood-Inundation Mapping for Selected Dams in Oklahoma City, Oklahoma, and near Atoka, Oklahoma
Table 7. Maximum flood-inundation elevation and time for 75 percent probable maximum flood (PMF) and sunny-day dam-breach scenarios for selected dams in Oklahoma City, Oklahoma, and near Atoka, Okla.—Continued
[ft, feet; hh:mm, hours and minutes; >, greater than]
Table 7. Maximum flood-inundation elevation and time for the 75-percent probable maximum flood (PMF) and sunny-day dam-breach scenarios for selected dams in Oklahoma City, Oklahoma, and near Atoka, Okla.
[ft, feet; hh:mm, hours and minutes; >, greater than]
Table 7. Maximum flood-inundation elevation and time for 75 percent probable maximum flood (PMF) and sunny-day dam-breach scenarios for selected dams in Oklahoma City, Oklahoma, and near Atoka, Okla.—Continued
[ft, feet; hh:mm, hours and minutes; >, greater than]
Bridge name
Cross-section index number1
75 percent PMF stage
(ft)
Time to peak stage (hh:mm)
75 percent PMF
Sunny-day stage
(ft)
Time to peak stage (hh:mm)
sunny dayLightning Creek Holding Pond A—Continued
51st Street 18,419 1,205.24 02:25 1,198.55 02:35Sage Avenue 17,291 1,203.44 02:25 1,195.83 02:40Unnamed Road 16,949 1,202.16 02:25 1,195.70 02:4044th Street 15,406 1,200.50 02:30 1,194.47 02:40Santa Fe Avenue 14,842 1,199.43 02:30 1,193.67 02:40Draper Park Bridge 14,118 1,197.29 02:35 1,190.82 02:45Santa Fe Avenue 13,560 1,196.22 02:35 1,188.53 02:50Grand Boulevard 12,090 1,194.88 02:35 1,187.06 02:5529th Street 9,418 1,190.45 02:45 1,184.01 03:0028th Street 8,998 1,189.22 02:45 1,183.07 03:0027th Street 8,485 1,188.11 02:45 1,181.85 03:0025th Street 7,480 1,181.47 02:50 1,179.60 03:0023rd Street 6,633 1,185.46 02:50 1,177.07 03:0518th Street 3,945 1,175.14 02:55 1,169.79 03:0515th Street 2,934 1,168.03 02:55 1,162.67 03:05Foot Bridge 2,623 1,166.19 02:55 1,160.56 03:10
Lightning Creek Holding Pond C81st Street 33,441 1,250.59 00:35 1,249.30 00:3581st Street 31,523 1,241.50 00:45 1,239.96 00:45Western Avenue 30,856 1,237.78 00:45 1,233.88 00:45Interstate 240 Service Road 28,671 1,233.72 00:55 1,226.31 00:5067th Street 25,830 1,225.82 01:05 1,216.99 00:5559th Street 22,493 1,210.78 01:15 1,204.74 01:00Walker Avenue 20,380 1,208.04 01:20 1,201.37 01:1051st Street 18,419 1,205.22 01:20 1,198.86 01:10Sage Avenue 17,291 1,203.40 01:20 1,196.09 01:15Unnamed Road 16,949 1,202.14 01:25 1,195.96 01:1544th Street 15,406 1,200.49 01:25 1,194.73 01:20Santa Fe Avenue 14,842 1,199.42 01:25 1,193.93 01:20Draper Park Bridge 14,118 1,197.30 01:30 1,190.95 01:20Santa Fe Avenue 13,560 1,196.21 01:30 1,188.61 01:25Grand Boulevard 12,090 1,194.88 01:35 1,187.07 01:3029th Street 9,418 1,190.45 01:40 1,184.00 01:3528th Street 8,998 1,189.23 01:40 1,183.06 01:3527th Street 8,485 1,188.11 01:40 1,181.84 01:3525th Street 7,480 1,187.48 01:40 1,179.54 01:4023rd Street 6,633 1,185.46 01:40 1,177.00 01:4018th Street 3,945 1,175.14 01:45 1,169.73 01:4515th Street 2,934 1,168.03 01:45 1,162.63 01:45Foot Bridge 2,623 1,166.20 01:45 1,160.50 01:45
Table 7. Maximum flood-inundation elevation and time for the 75-percent probable maximum flood (PMF) and sunny-day dam-breach scenarios for selected dams in Oklahoma City, Oklahoma, and near Atoka, Okla.—Continued
[ft, feet; hh:mm, hours and minutes; >, greater than]
1Bridges are not identified by cross-section index number, but the equivalent cross-section index number is shown.2Time to peak stage was not yet reached at the maximum allowable model simulation period of 96 hours.3Cross-section index number increases because Lake Hefner was modeled as two separate reaches with different indexing systems.4Time was interpolated from times at upstream and downstream bridges.5Stage was interpolated from stages at upstream and downstream bridges.
12 Dam-Breach Analysis and Flood-Inundation Mapping for Selected Dams in Oklahoma City, Oklahoma, and near Atoka, Oklahoma
Elevation Uncertainties
Elevation data composed the primary dataset for creating water-surface and inundation maps. The elevation data for most of this study were obtained by using lidar techniques with accuracy less than 1 ft (table 1). The elevation data (16.4 ft DEM) for the Atoka models were obtained by using ifsar techniques with an accuracy of 6.6 ft (table 1) because more accurate lidar data were unavailable. Use of lower accuracy ifsar data is more acceptable in the Atoka study area because this area contains greater terrain slopes than the Oklahoma City study area, especially in the upstream sections. For a terrain slope of about 2 percent, which is typical for the flood plain of the Atoka models, a 1-inch difference in elevation yields about a 4-ft difference in horizontal distance of inundated area. However, in extremely flat terrain, relatively large errors in water-surface extent can occur from a small error in water-surface elevation. For a river reach with a relatively low terrain slope of 0.1 percent, a 1-inch difference in elevation can yield about an 80-ft difference in horizontal distance of inundated area. Therefore, determining the extents of flooding with a high degree of accuracy is especially difficult in areas of low relief (Bales and Wagner, 2009).
Manning’s Roughness Coefficient Uncertainties
Manning’s roughness coefficients can affect not only the extent of a flood-inundation area but also the timing of a flood peak. Although the Manning’s roughness coefficients used in this study were supported by the calibrated Lake Overholser models, changes in the flood-plain hydraulics over time may decrease accuracy of the data described in this report. A sensitivity analysis was conducted for the 75-percent PMF scenario of the Lake Overholser models. In this sensitivity analysis, the Manning’s roughness coefficient values were tested at 0.9 and 1.1 times the modeled values. These changes in the Manning’s roughness coefficients produced changes in the peak water-surface elevations and the timing of the flood peaks. Table 8 shows the changes in peak water-surface elevation and time to peak at each bridge for the PMF sensitivity models.
Model Limitations
Another major cause of uncertainty in HEC–RAS hydraulic models is the one-dimensional assumption that the water-surface elevation is constant across each computational node (cross section). In an extremely flat flood plain, such as much of the study area around Oklahoma City, the one-dimensional assumption may not be valid. For example, although the flow in the main stream in question may be at a certain elevation, other streams that are intersected by the given cross section may not be at the same water-surface elevation. Two-dimensional models can be used to account for this type of error (Horritt and Bates, 2001).
Table 8. Peak water-surface elevation and time to peak for the sensitivity analysis of Manning’s roughness coefficients for the 75-percent probable maximum flood (PMF) dam-breach scenarios for Lake Overholser in Oklahoma City, Oklahoma.
[ID, identifier; ft, feet; hh:mm, hours and minutes]
1Bridges are not identified by cross-section index number, but the equivalent cross-section index number is shown.
Summary and ConclusionsThis report presents results of a cooperative study by the City
of Oklahoma City, Oklahoma, and the U.S. Geological Survey (USGS) to model dam-breach scenarios at 11 selected classified high-hazard dams around the Oklahoma City, and Atoka, Okla., areas and to map the potentially resulting flood-inundation areas. All of the dams listed in this report are classified by the State of Oklahoma as high-hazard dams and therefore need to have flood-inundation maps modeled as part of the emergency action plans required by the Oklahoma Water Resources Board.
For this report, flood profiles for a 75-percent probable maximum flood (PMF) dam breach and a sunny-day dam breach were computed for the stream reach downstream from selected dams in Oklahoma City, Okla., and Atoka Reservoir, Okla., by means of a one-dimensional dynamic (unsteady-flow) model using the U.S. Army Corps of Engineers Hydrologic Engineering Center’s River Analysis System (HEC–RAS) software. Development of accurate hydraulic models requires accurate land-surface elevation data. Light detection and ranging (lidar) data were used to develop a high-resolution digital-elevation model and a 2-foot contour elevation map for the flood plains below selected high-hazard dams in Oklahoma City (collected in 2004) and near Norman (collected in 2007). A 16.4-ft (5 m) digital terrain map was used for the flood plain below Atoka Reservoir. Additional survey data were collected by use of a U.S. survey-grade real-time kinematic Global Positioning System receiver. Field measurements of bridge dimensions were determined at all locations in the study areas. Streamflow and water-level data from USGS streamflow-gaging stations North Canadian River below Lake Overholser near Oklahoma City, Okla. (07241000), and North Canadian River at Britton Road at Oklahoma City, Okla. (07241520), were used as hydrologic inputs for the model to help quantify the sunny-day dam-breach scenario.
The resulting flood-inundation maps were generated by HEC–GeoRAS (the ArcGIS Topo to Raster tool by the Environmental Systems Research Institute, Inc.) and imported into a geographic information system to delineate areas flooded in each flood scenario. Points of interest such as community-services offices, recreational areas, water-treatment plants, and wastewater-treatment plants were identified on the maps in case a dam breach occurs at one of the selected high-hazard dams.
Uncertainty may be introduced into flood-inundation maps with regards to the accuracy of the elevation, hydraulic, and hydrologic data and the modeling system used. Even with uncertainties, the produced dam-breach models and flood-inundation maps can provide city managers, emergency management personnel, and residents of Oklahoma City, and residents downstream from Atoka Reservoir with vital information for flood-response activities if a dam breach occurs.
References Cited 13
References Cited
Arcement, G.J., and Schneider V.R., 1989, Guide for selecting Manning’s roughness coefficients for natural channels and flood plains: U.S. Geological Survey Water-Supply Paper 2339 [variously paged].
Arthur, H.G., 1977, Teton Dam failure—The evaluation of dam safety: New York, Engineering Foundation Conference Proceedings, American Society of Civil Engineers, p. 61–71.
Bales, J.D., and Wagner, C.R., 2009, Sources of uncertainty in flood inundation maps: Journal of Flood Risk Management, v. 2, p. 139–147.
Barlow, R.A., Nardi, M.R., and Reyes, Betzaida, 2008, Use of light detection and ranging (LiDAR) to obtain high-resolution elevation data for Sussex County, Delaware: U.S. Geological Survey Fact Sheet 2008–3088, 6 p.
Barnes, H.H., 1967, Roughness characteristics of natural channels: U.S. Geological Survey Water-Supply Paper 1849 [variously paged].
BOSS, 1999, BOSS DAMBRK—User’s manual: Madison, Wis., BOSS International, p. 250.
City of Norman, 2007, Lidar-derived bare-earth digital elevation model and accuracy report — Merrick & Company: Prepared for the City of Norman, Oklahoma.
City of Oklahoma City, 2004, Lidar-derived bare-earth digital elevation model — Sanborn Colorado LLC: Prepared for the City of Oklahoma City, Oklahoma.
City of Oklahoma City, 2014, Parks and recreation, accessed March, 6, 2015, at https://www.okc.gov/parks/index.html.
Collier, Michael, Webb, R.H., and Schmidt, J.C., 1996, Dams and rivers—Primer on the downstream effects of dams: U.S. Geological Survey Circular 1126, 94 p.
Coon, W.F., 1998, Estimation of roughness coefficients of natural stream channels with vegetated banks: U.S Geological Survey Water-Supply Paper 2441 [variously paged].
Davies, W.E., Bailey, J.F., and Kelly, D.B, 1972, West Virginia’s Buffalo Creek flood—A study of the hydrology and engineering geology: U.S. Geological Survey Circular 667, 32 p.
Environmental Systems Research Institute, 2015, ArcGIS resource center—Topo to raster (spatial analyst): ArcGIS 10.1, accessed January 26, 2015, at http:// http://resources.arcgis.com/en/help/main/10.1/index.html#//009z0000006s000000.
Federal Emergency Management Agency, 1998, Federal guidelines for dam safety: U.S Department of Homeland Security Federal Emergency Management Agency [variously paged].
Federal Energy Regulatory Commission, 2007, Chapter VI, Emergency action plans in Engineering guidelines for the evaluation of hydropower projects, emergency action plans: Emergency Guidelines, accessed April 1, 2011, at http://www.ferc.gov/industries/hydropower/safety/guidelines/eng-guide/chap6.pdf.
Froehlich, D.C., 2008, Embankment dam breach parameters and their uncertainties: Journal of Hydraulic Engineering, v. 134, no. 12, p. 1708–1720.
Gesch, D.B., Oimoen, M.J., and Evans, G.A., 2014, Accuracy assessment of the U.S. Geological Survey National Elevation Dataset, and comparison with other large-area elevation datasets—SRTM and ASTER: U.S. Geological Survey Open-File Report 2014–1008, 10 p., accessed August 19, 2014, at http://dx.doi.org/10.3133/ofr20141008.
Horizon Systems Corporation, 2008, National Hydrography Dataset plus version 1 (NHDPlus): accessed November 13, 2008, at http://www.horizon-systems.com/nhdplus/.
Horritt, M.S., and Bates, P.D., 2001, Effects of spatial resolution on a raster based model of flood flow: Journal of Hydrology, v. 253, p. 239–249.
Hydrologic Engineering Center, 2010a, HEC–RAS River Analysis System user’s manual, version 4.1: Davis, Calif., accessed April 1, 2011, at ftp://ftp.usace.army.mil/pub/iwr-hec-web/software/ras/documentation/HEC-RAS_4.1_Users_Manual.pdf [variously paged].
Hydrologic Engineering Center, 2010b, HEC–RAS River Analysis System hydraulic reference manual, version 4.1: Davis, Calif., accessed April 1, 2011, at http://www.hec.usace.army.mil/software/hec-ras/documents/HEC-RAS_4.1_Reference_Manual.pdf [variously paged].
Hydrologic Engineering Center, 2011, HEC–GeoRAS GIS tools for support of HEC–RAS using ArcGIS, version 4.3.93: Davis, Calif., accessed April 1, 2011, at http://www.hec.usace.army.mil/software/hec-ras/documents/HEC-GeoRAS_43_Users_Manual.pdf [variously paged].
Intermap Technologies, 2014, NEXTMap Web Store—NEXTMap 5-meter digital terrain model: accessed June 20, 2014, at https://store.intermap.com/MapShop.aspx?GeoLocation=World
Lewis, J.M., and Esralew, R.A., 2009, Statistical summaries of streamflow in and near Oklahoma through 2007: U.S. Geological Survey Scientific Investigations Report 2009–5135, p. 456–459.
Multi-Resolution Land Characteristics Consortium, 2011, National Land Cover Database 2006 (NLCD 2006): National Land Cover Database, accessed December 1, 2011, at http://www.mrlc.gov/nlcd2006.php.
National Geodetic Survey, 2011, Continuously Operating Reference Station (CORS): National Geodetic Survey, accessed April 1, 2011, at http://www.ngs.noaa.gov/CORS/.
National Oceanic and Atmospheric Administration, 2015, Orthometric Height Conversion, accessed December 1, 2014, at http://www.ngs.noaa.gov/cgi-bin/VERTCON/vert_con.prl.
Oklahoma Department of Transportation, 2014, Maps ArcView SHP files: Highway information, accessed December 15, 2014, at http://www.okladot.state.ok.us/maps/shp/index.htm.
Oklahoma Water Resources Board, 1978a, Phase I inspection report Dry Creek Detention Dam and Spillway: National Dam Safety Report, Inventory No. OK 11061, 164 p.
Oklahoma Water Resources Board, 1978b, Phase I inspection report Northeast Lake Dam and Spillway: National Dam Safety Report, Inventory No. OK 02424, 112 p.
Oklahoma Water Resources Board, 1978c, Phase I inspection report NW Oklahoma City Sludge Lagoon Dam No. 1: National Dam Safety Report, Inventory No. OK 11051, 58 p.
Oklahoma Water Resources Board, 1979a, Phase I inspection report Overholser Lake Dam and Spillway: National Dam Safety Report, Inventory No. OK 02537, 166 p.
Oklahoma Water Resources Board, 1979b, Phase I inspection report Lightning Creek Holding Pond A: National Dam Safety Report, Inventory No. OK 11070, 132 p.
Oklahoma Water Resources Board, 1979c, Phase I inspection report Stanley Draper Lake: National Dam Safety Report, Inventory No. OK 02580, 85 p.
Oklahoma Water Resources Board, 1979d, Phase I inspection report Will Rogers Park Dam: National Dam Safety Report, Inventory No. OK 11069, 121 p.
Oklahoma Water Resources Board, 2007, Hydrographic survey of Arcadia Lake: Oklahoma Water Resources Board, accessed August 19, 2013, at http://www.owrb.ok.gov/studies/reports/reports_pdf/ArcadiaHydrographicSurvey.pdf.
Oklahoma Water Resources Board, 2011, Hydrologic and hydraulic guidelines for dams in Oklahoma: Oklahoma Water Resources Board, p. 12–20.
Oklahoma Water Resources Board, 2014a, Bathymetric lake studies: Oklahoma Water Resources Board, accessed August 19, 2014, at http://www.owrb.ok.gov/maps/pmg/owrbdata_Bathy.html.
Oklahoma Water Resources Board, 2014b, Data & Maps—Surface Water: Oklahoma Water Resources Board, accessed August 19, 2014, at http://www.owrb.ok.gov/maps/PMG/owrbdata_SW.html.
Rendon, S.H., Ashworth, C.E., and Smith, S.J., 2012, Dam-breach analysis and flood-inundation mapping for Lakes Ellsworth and Lawtonka near Lawton, Oklahoma: U.S. Geological Survey Scientific Investigations Report 2012–5026, 56 p.
Rogers, D.J., 2006, Lessons learned from the St. Francis Dam failure: Geo-Strata, v. 6, issue 2, p. 14–17.
Samuels, P.G., 1989, Backwater lengths in rivers: Proceedings of the Institution of Civil Engineers, part 2, v. 87, p. 571–582.
Smith Roberts Baldischwiler, LLC, 2006, LIDAR — Statistical analysis for City of Oklahoma City: Oklahoma City, Okla., 8 p.
Tortorelli, R.L., and McCabe, L.P., 2001, Flood frequency estimates and documented and potential extreme peak discharges in Oklahoma: U.S. Geological Survey Water-Resources Investigations Report 2001–4152, 59 p.
Trimble Navigation Limited, 2003, Trimble R7/R8 GPS receiver user guide, version 1.00, revision A: Sunnyvale, Calif., Trimble Navigation Limited, 216 p.
U.S. Board on Geographic Names, 2014, Geographic Names Information System (GNIS): U.S. Board on Geographic Names, accessed December 15, 2014, at http://geonames.usgs.gov/domestic/.
U.S. Census Bureau, 2014, TIGER/Line Shapefiles and TIGER/Line Files: U.S. Census Bureau, accessed December 15, 2014, at http://www.census.gov/geo/maps-data/data/tiger-line.html.
U.S. Department of Agriculture, 2013, National Agriculture Imagery Program imagery, accessed June 1, 2011, at http://www.fsa.usda.gov/FSA/apfoapp?area=home&subject=prog&topic=nai.
U.S. Geological Survey, 2013, USGS water data for the Nation: National Water Information System (NWISWeb), accessed June 18, 2014, at http://waterdata.usgs.gov/nwis/.
U.S. Geological Survey, 2014, National Elevation Dataset: U.S. Geological Survey, accessed on December 15, 2014 at http://ned.usgs.gov/.
U.S. Geological Survey, 2015, Welcome to Streamstats, Oklahoma, accessed January 2, 2015, at http://water.usgs.gov/osw/streamstats/oklahoma.html.
Von Thun, J.L., and Gillette, D.R., 1990, Guidance on breach parameters: Denver, Colo., Internal Memorandum, U.S. Department of the Interior, Bureau of Reclamation, p. 17.