13
0 11 February 2016 Results Presentation Year ended 31 December 2015
| Date post: | 16-Feb-2017 |
| Category: |
Documents |
| Upload: | kushagra-mangal |
| View: | 156 times |
| Download: | 0 times |
0 11 February 2016
Results Presentation Year ended 31 December 2015
Disclaimer
1
This presentation is being made only to, and is only directed at, persons to whom this presentation may lawfully be communicated (relevant
persons). Any person who is not a relevant person should not act or rely on this presentation or any of its contents.
This presentation does not constitute or form part of, and should not be construed as, an offering of securities or otherwise constitute an
invitation, inducement or recommendation to any person to underwrite, subscribe for or otherwise acquire securities in any company within
the DAMAC group (the Group).
Certain statements made in this presentation are forward looking statements. Such statements are based on current expectations and are
subject to a number of risks and uncertainties that could cause actual events or results to differ materially from any expected future events or
results expressed or implied in these forward-looking statements. Forward-looking statements speak only as of the date of this presentation.
2
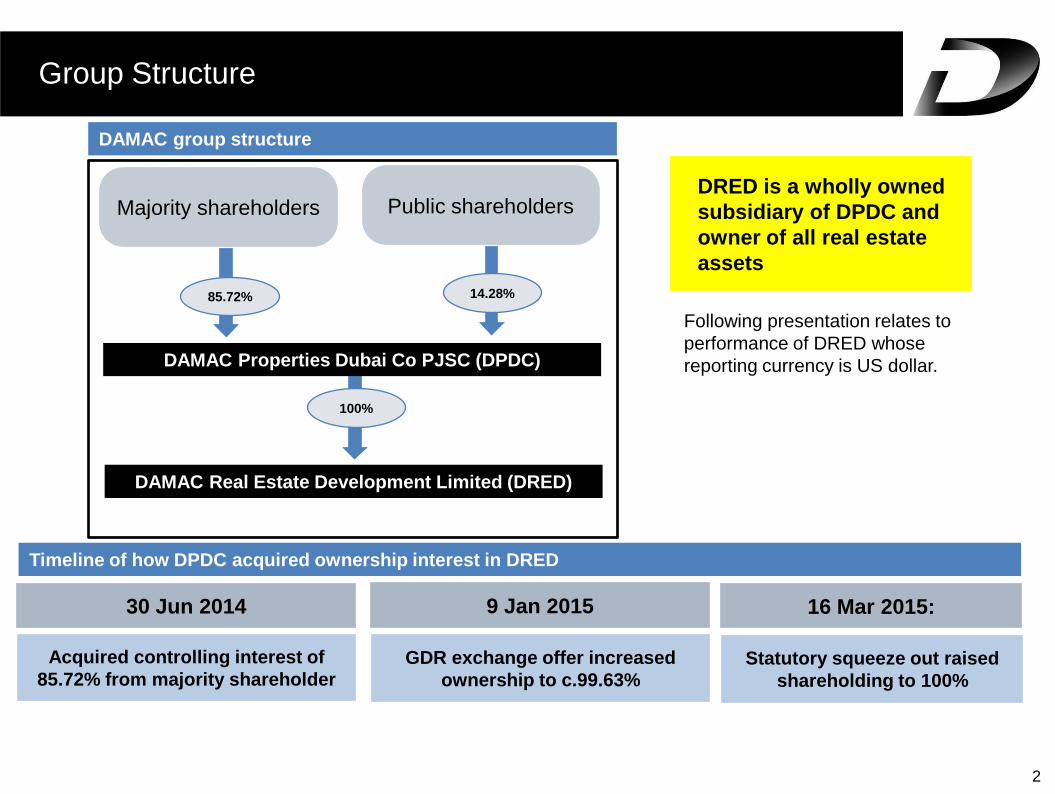
DAMAC group structure
Acquired controlling interest of
85.72% from majority shareholder
30 Jun 2014
Timeline of how DPDC acquired ownership interest in DRED
GDR exchange offer increased
ownership to c.99.63%
9 Jan 2015
Statutory squeeze out raised
shareholding to 100%
16 Mar 2015:
Public shareholders
DAMAC Real Estate Development Limited (DRED)
85.72%
Majority shareholders
100%
DAMAC Properties Dubai Co PJSC (DPDC)
14.28%
DRED is a wholly owned
subsidiary of DPDC and
owner of all real estate
assets
Group Structure
Following presentation relates to
performance of DRED whose
reporting currency is US dollar.
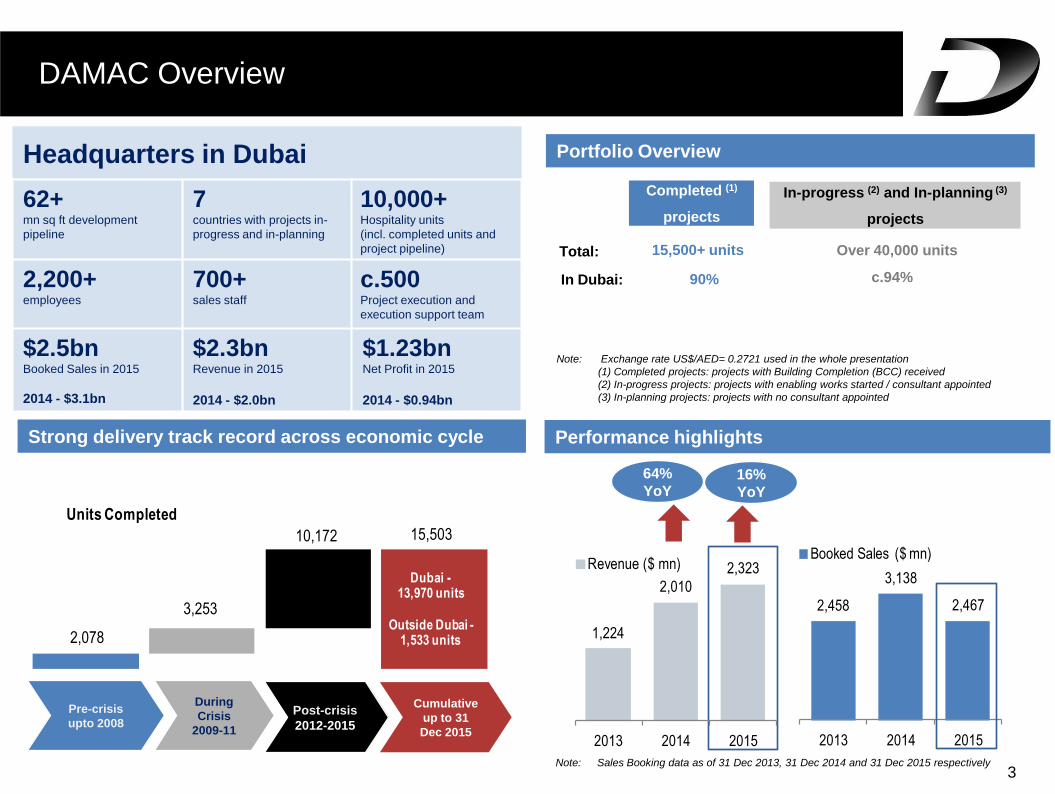
2,458
3,138
2,467
2013 2014 2015
Booked Sales ($ mn)
DAMAC Overview
Completed (1)
projects
15,500+ units
90%
Total:
In Dubai:
During
Crisis
2009-11
Pre-crisis
upto 2008
Cumulative
up to 31
Dec 2015
Strong delivery track record across economic cycle Performance highlights
Portfolio Overview
Note: Exchange rate US$/AED= 0.2721 used in the whole presentation
(1) Completed projects: projects with Building Completion (BCC) received
(2) In-progress projects: projects with enabling works started / consultant appointed
(3) In-planning projects: projects with no consultant appointed
3
64%
YoY
Note: Sales Booking data as of 31 Dec 2013, 31 Dec 2014 and 31 Dec 2015 respectively
In-progress (2) and In-planning (3)
projects
Over 40,000 units
c.94%
Post-crisis
2012-2015
Headquarters in Dubai
62+ mn sq ft development
pipeline
7 countries with projects in-
progress and in-planning
10,000+ Hospitality units
(incl. completed units and
project pipeline)
2,200+ employees
700+ sales staff
c.500 Project execution and
execution support team
$2.5bn Booked Sales in 2015
2014 - $3.1bn
$2.3bn Revenue in 2015
2014 - $2.0bn
$1.23bn Net Profit in 2015
2014 - $0.94bn
16%
YoY
2,078
3,253
10,172 15,503
Units Completed
Dubai -13,970 units
Outside Dubai -1,533 units 1,224
2,010
2,323
2013 2014 2015
Revenue ($ mn)
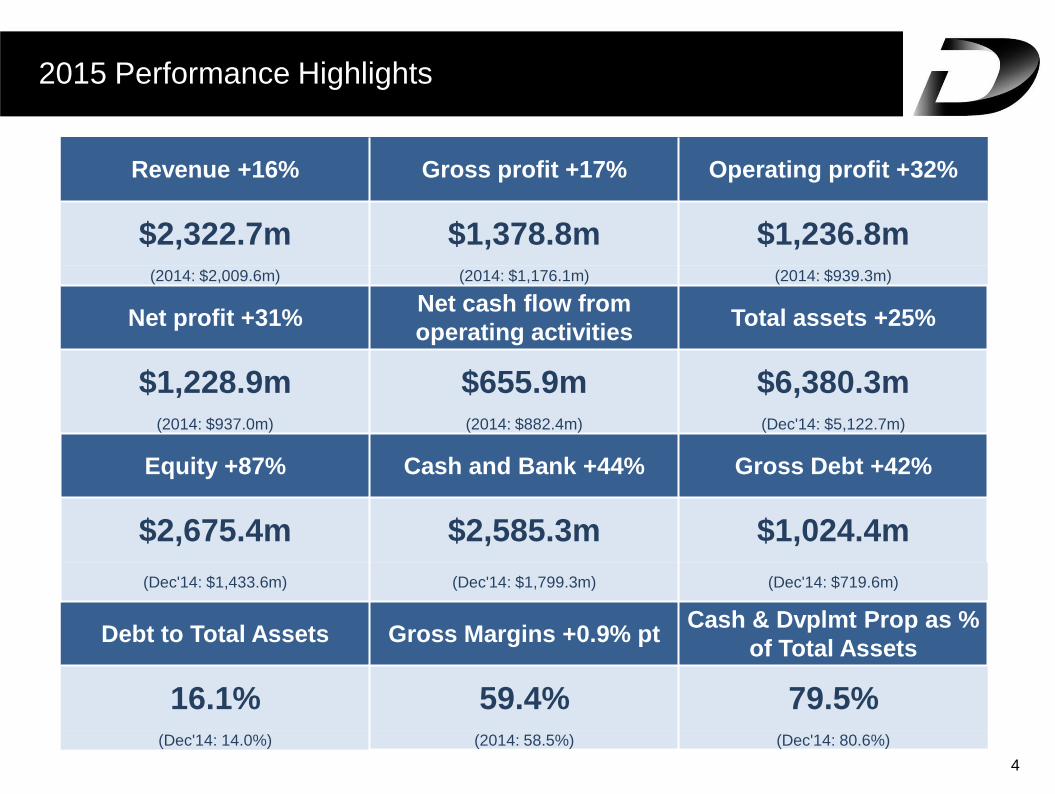
2015 Performance Highlights
4
Revenue +16% Gross profit +17% Operating profit +32%
$2,322.7m $1,378.8m $1,236.8m (2014: $2,009.6m) (2014: $1,176.1m) (2014: $939.3m)
Net profit +31% Net cash flow from
operating activities Total assets +25%
$1,228.9m $655.9m $6,380.3m (2014: $937.0m) (2014: $882.4m) (Dec'14: $5,122.7m)
Equity +87% Cash and Bank +44% Gross Debt +42%
$2,675.4m $2,585.3m $1,024.4m
(Dec'14: $1,433.6m) (Dec'14: $1,799.3m) (Dec'14: $719.6m)
Debt to Total Assets Gross Margins +0.9% pt Cash & Dvplmt Prop as %
of Total Assets
16.1% 59.4% 79.5% (Dec'14: 14.0%) (2014: 58.5%) (Dec'14: 80.6%)
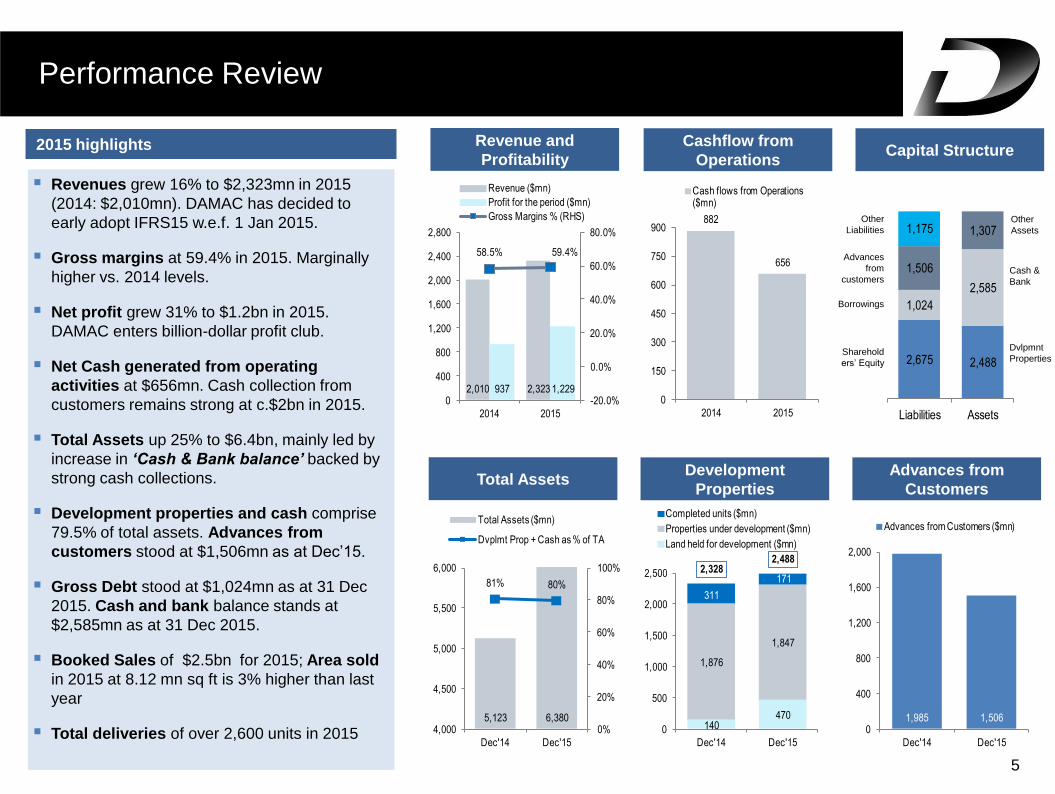
2,675 2,488
1,024
2,585
1,506
1,3071,175
Liabilities Assets
Performance Review
5
Revenues grew 16% to $2,323mn in 2015
(2014: $2,010mn). DAMAC has decided to
early adopt IFRS15 w.e.f. 1 Jan 2015.
Gross margins at 59.4% in 2015. Marginally
higher vs. 2014 levels.
Net profit grew 31% to $1.2bn in 2015.
DAMAC enters billion-dollar profit club.
Net Cash generated from operating
activities at $656mn. Cash collection from
customers remains strong at c.$2bn in 2015.
Total Assets up 25% to $6.4bn, mainly led by
increase in ‘Cash & Bank balance’ backed by
strong cash collections.
Development properties and cash comprise
79.5% of total assets. Advances from
customers stood at $1,506mn as at Dec’15.
Gross Debt stood at $1,024mn as at 31 Dec
2015. Cash and bank balance stands at
$2,585mn as at 31 Dec 2015.
Booked Sales of $2.5bn for 2015; Area sold
in 2015 at 8.12 mn sq ft is 3% higher than last
year
Total deliveries of over 2,600 units in 2015
2015 highlights
Total Assets Development
Properties
Advances from
Customers
Revenue and
Profitability
Cashflow from
Operations Capital Structure
Dvlpmnt
Properties
Cash &
Bank
Other
Assets
Other
Liabilities
Advances
from
customers
Borrowings
Sharehold
ers’ Equity
882
656
0
150
300
450
600
750
900
2014 2015
Cash flows from Operations ($mn)
1,985 1,5060
400
800
1,200
1,600
2,000
Dec'14 Dec'15
Advances from Customers ($mn)
2,010 2,323937 1,229
58.5% 59.4%
-20.0%
0.0%
20.0%
40.0%
60.0%
80.0%
0
400
800
1,200
1,600
2,000
2,400
2,800
2014 2015
Revenue ($mn)
Profit for the period ($mn)
Gross Margins % (RHS)
5,123 6,380
81% 80%
0%
20%
40%
60%
80%
100%
4,000
4,500
5,000
5,500
6,000
Dec'14 Dec'15
Total Assets ($mn)
Dvplmt Prop + Cash as % of TA
140470
1,876
1,847
311
1712,328
2,488
0
500
1,000
1,500
2,000
2,500
Dec'14 Dec'15
Completed units ($mn)
Properties under development ($mn)
Land held for development ($mn)
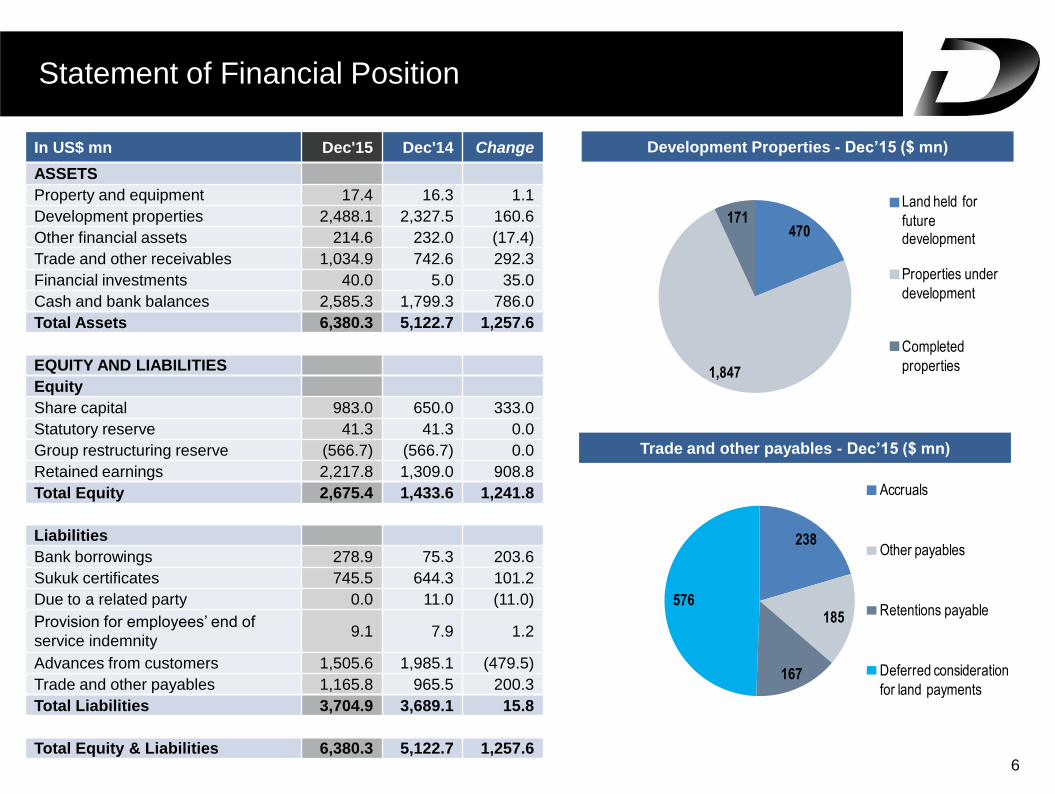
Statement of Financial Position
6
In US$ mn Dec'15 Dec'14 Change
ASSETS
Property and equipment 17.4 16.3 1.1
Development properties 2,488.1 2,327.5 160.6
Other financial assets 214.6 232.0 (17.4)
Trade and other receivables 1,034.9 742.6 292.3
Financial investments 40.0 5.0 35.0
Cash and bank balances 2,585.3 1,799.3 786.0
Total Assets 6,380.3 5,122.7 1,257.6
EQUITY AND LIABILITIES
Equity
Share capital 983.0 650.0 333.0
Statutory reserve 41.3 41.3 0.0
Group restructuring reserve (566.7) (566.7) 0.0
Retained earnings 2,217.8 1,309.0 908.8
Total Equity 2,675.4 1,433.6 1,241.8
Liabilities
Bank borrowings 278.9 75.3 203.6
Sukuk certificates 745.5 644.3 101.2
Due to a related party 0.0 11.0 (11.0)
Provision for employees’ end of
service indemnity 9.1 7.9 1.2
Advances from customers 1,505.6 1,985.1 (479.5)
Trade and other payables 1,165.8 965.5 200.3
Total Liabilities 3,704.9 3,689.1 15.8
Total Equity & Liabilities 6,380.3 5,122.7 1,257.6
Development Properties - Dec’15 ($ mn)
Trade and other payables - Dec’15 ($ mn)
238
185
167
576
Accruals
Other payables
Retentions payable
Deferred consideration
for land payments
470
1,847
171Land held for
future development
Properties under
development
Completed
properties
939
1,237
0
250
500
750
1,000
1,250
2014 2015
Operating Profit ($ mn)
2,010
2,323
0
400
800
1,200
1,600
2,000
2,400
2014 2015
Revenue ($ mn)
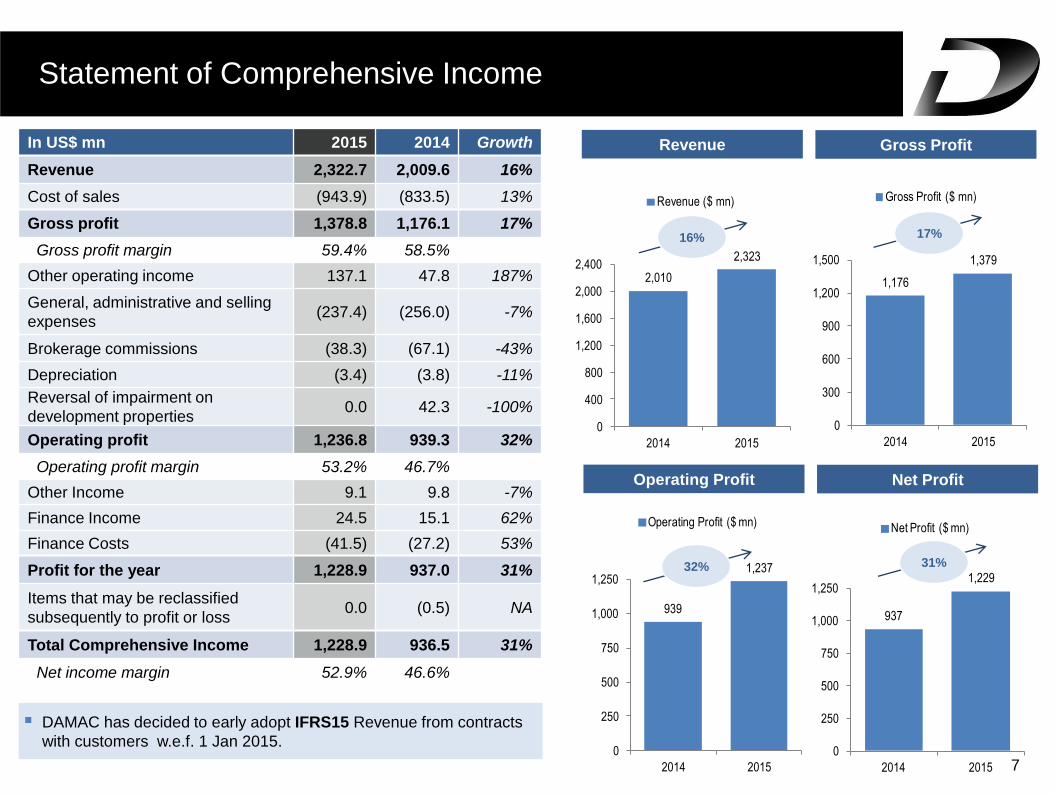
Statement of Comprehensive Income
7
Revenue Gross Profit
Operating Profit Net Profit
In US$ mn 2015 2014 Growth
Revenue 2,322.7 2,009.6 16%
Cost of sales (943.9) (833.5) 13%
Gross profit 1,378.8 1,176.1 17%
Gross profit margin 59.4% 58.5%
Other operating income 137.1 47.8 187%
General, administrative and selling
expenses (237.4) (256.0) -7%
Brokerage commissions (38.3) (67.1) -43%
Depreciation (3.4) (3.8) -11%
Reversal of impairment on
development properties 0.0 42.3 -100%
Operating profit 1,236.8 939.3 32%
Operating profit margin 53.2% 46.7%
Other Income 9.1 9.8 -7%
Finance Income 24.5 15.1 62%
Finance Costs (41.5) (27.2) 53%
Profit for the year 1,228.9 937.0 31%
Items that may be reclassified
subsequently to profit or loss 0.0 (0.5) NA
Total Comprehensive Income 1,228.9 936.5 31%
Net income margin 52.9% 46.6%
16% 17%
32% 31%
DAMAC has decided to early adopt IFRS15 Revenue from contracts
with customers w.e.f. 1 Jan 2015.
1,176
1,379
0
300
600
900
1,200
1,500
2014 2015
Gross Profit ($ mn)
937
1,229
0
250
500
750
1,000
1,250
2014 2015
Net Profit ($ mn)
882
656
0
150
300
450
600
750
900
2014 2015
Net Cashflow from Operations
($ mn)
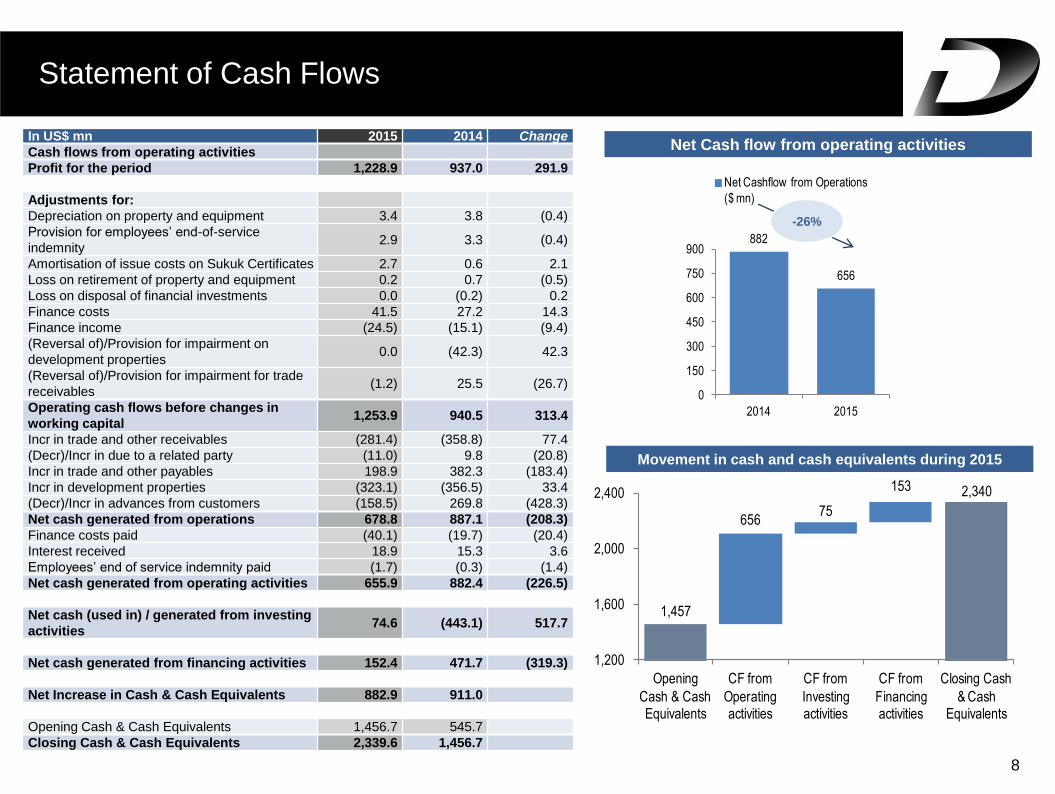
Statement of Cash Flows
8
Net Cash flow from operating activities
Movement in cash and cash equivalents during 2015
-26%
1,457
65675
153 2,340
1,200
1,600
2,000
2,400
Opening
Cash & Cash Equivalents
CF from
Operating activities
CF from
Investing activities
CF from
Financing activities
Closing Cash
& Cash Equivalents
In US$ mn 2015 2014 Change
Cash flows from operating activities
Profit for the period 1,228.9 937.0 291.9
Adjustments for:
Depreciation on property and equipment 3.4 3.8 (0.4)
Provision for employees’ end-of-service
indemnity 2.9 3.3 (0.4)
Amortisation of issue costs on Sukuk Certificates 2.7 0.6 2.1
Loss on retirement of property and equipment 0.2 0.7 (0.5)
Loss on disposal of financial investments 0.0 (0.2) 0.2
Finance costs 41.5 27.2 14.3
Finance income (24.5) (15.1) (9.4)
(Reversal of)/Provision for impairment on
development properties 0.0 (42.3) 42.3
(Reversal of)/Provision for impairment for trade
receivables (1.2) 25.5 (26.7)
Operating cash flows before changes in
working capital 1,253.9 940.5 313.4
Incr in trade and other receivables (281.4) (358.8) 77.4
(Decr)/Incr in due to a related party (11.0) 9.8 (20.8)
Incr in trade and other payables 198.9 382.3 (183.4)
Incr in development properties (323.1) (356.5) 33.4
(Decr)/Incr in advances from customers (158.5) 269.8 (428.3)
Net cash generated from operations 678.8 887.1 (208.3)
Finance costs paid (40.1) (19.7) (20.4)
Interest received 18.9 15.3 3.6
Employees’ end of service indemnity paid (1.7) (0.3) (1.4)
Net cash generated from operating activities 655.9 882.4 (226.5)
Net cash (used in) / generated from investing
activities 74.6 (443.1) 517.7
Net cash generated from financing activities 152.4 471.7 (319.3)
Net Increase in Cash & Cash Equivalents 882.9 911.0
Opening Cash & Cash Equivalents 1,456.7 545.7
Closing Cash & Cash Equivalents 2,339.6 1,456.7
9
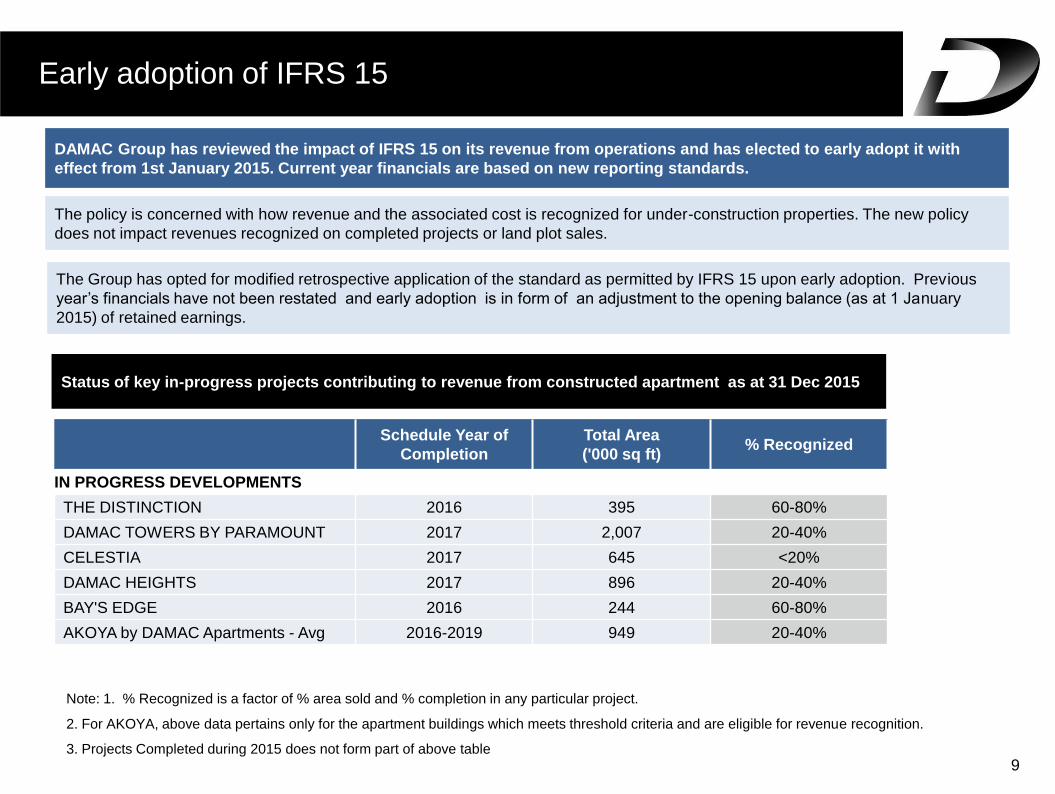
Early adoption of IFRS 15
Status of key in-progress projects contributing to revenue from constructed apartment as at 31 Dec 2015
The policy is concerned with how revenue and the associated cost is recognized for under-construction properties. The new policy
does not impact revenues recognized on completed projects or land plot sales.
DAMAC Group has reviewed the impact of IFRS 15 on its revenue from operations and has elected to early adopt it with
effect from 1st January 2015. Current year financials are based on new reporting standards.
Schedule Year of
Completion
Total Area
('000 sq ft) % Recognized
IN PROGRESS DEVELOPMENTS
THE DISTINCTION 2016 395 60-80%
DAMAC TOWERS BY PARAMOUNT 2017 2,007 20-40%
CELESTIA 2017 645 <20%
DAMAC HEIGHTS 2017 896 20-40%
BAY'S EDGE 2016 244 60-80%
AKOYA by DAMAC Apartments - Avg 2016-2019 949 20-40%
Note: 1. % Recognized is a factor of % area sold and % completion in any particular project.
2. For AKOYA, above data pertains only for the apartment buildings which meets threshold criteria and are eligible for revenue recognition.
3. Projects Completed during 2015 does not form part of above table
The Group has opted for modified retrospective application of the standard as permitted by IFRS 15 upon early adoption. Previous
year’s financials have not been restated and early adoption is in form of an adjustment to the opening balance (as at 1 January
2015) of retained earnings.
10
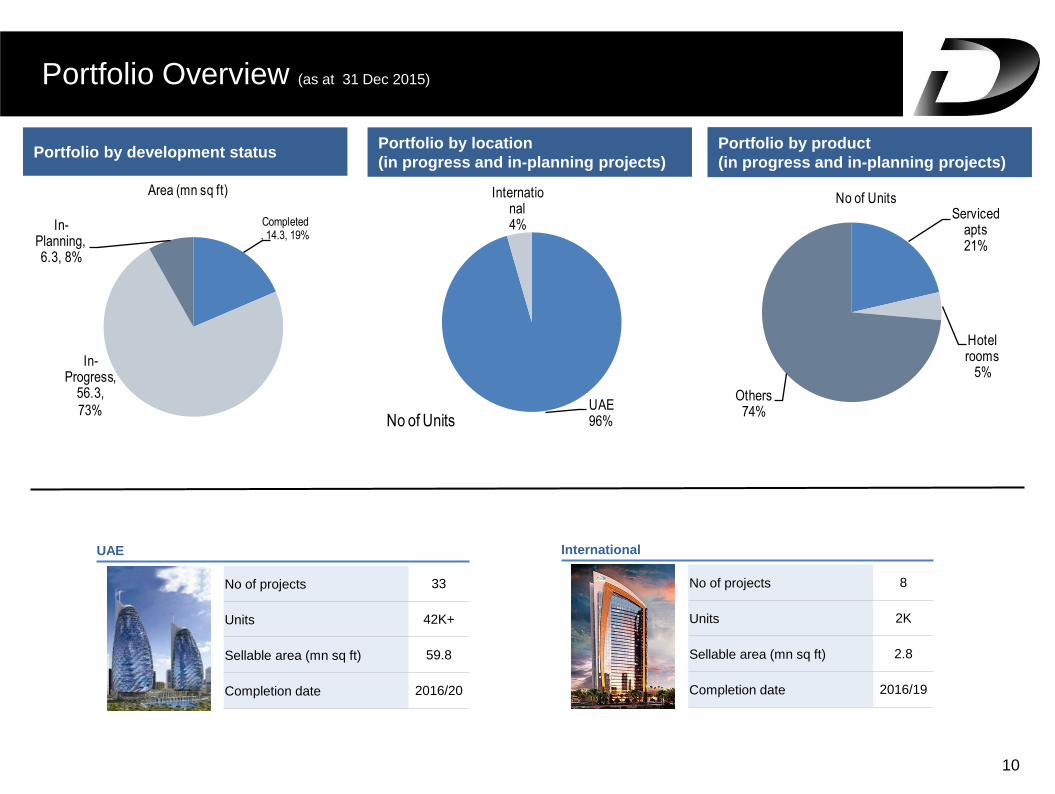
Portfolio Overview (as at 31 Dec 2015)
Portfolio by product
(in progress and in-planning projects) Portfolio by development status
Portfolio by location
(in progress and in-planning projects)
International
No of projects 8
Units 2K
Sellable area (mn sq ft) 2.8
Completion date 2016/19
UAE
No of projects 33
Units 42K+
Sellable area (mn sq ft) 59.8
Completion date 2016/20
Completed, 14.3, 19%
In-Progress,
56.3,
73%
In-Planning, 6.3, 8%
Area (mn sq ft)
UAE96%
International4%
No of Units
Serviced apts21%
Hotel rooms
5%
Others74%
No of Units
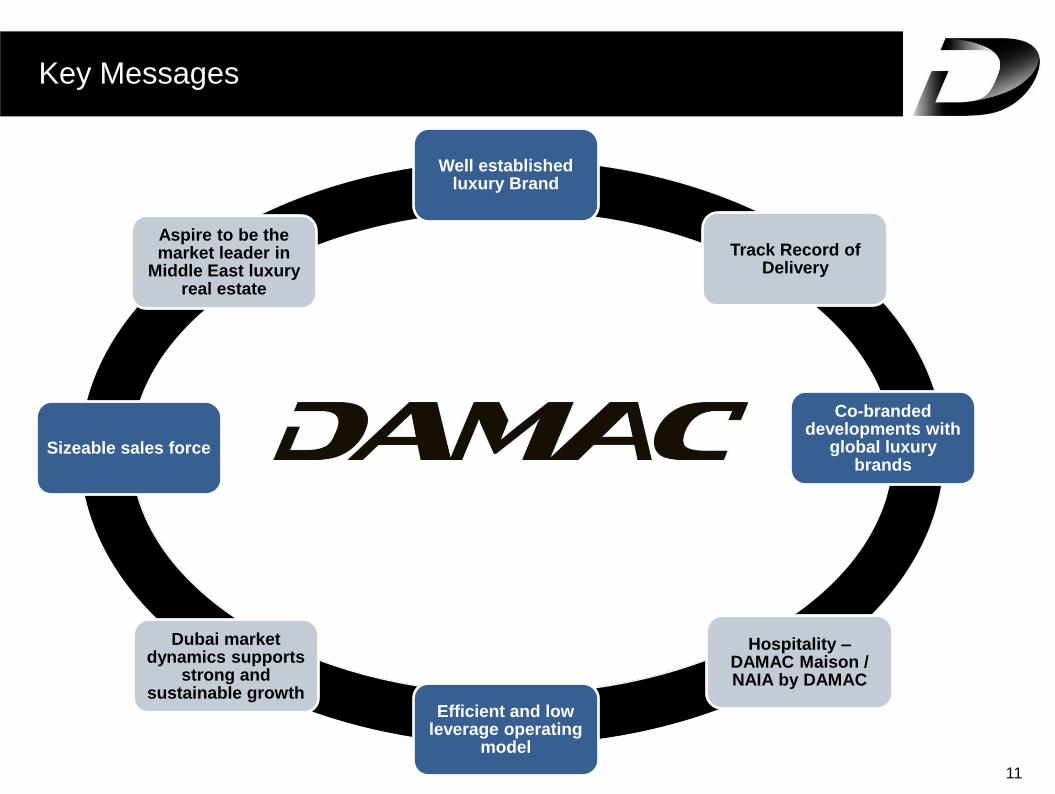
Well established luxury Brand
Track Record of Delivery
Co-branded developments with
global luxury brands
Hospitality – DAMAC Maison / NAIA by DAMAC
Efficient and low leverage operating
model
Dubai market dynamics supports
strong and sustainable growth
Sizeable sales force
Aspire to be the market leader in
Middle East luxury real estate
11
Key Messages