13
Damage characterization in dimension limestone cladding using noncollinear ultrasonic wave mixing Megan McGovern Henrique Reis
Damage characterization in dimensionlimestone cladding using noncollinearultrasonic wave mixing
Megan McGovernHenrique Reis
Damage characterization in dimension limestone claddingusing noncollinear ultrasonic wave mixing
Megan McGovern and Henrique Reis*University of Illinois at Urbana-Champaign, Department of Industrial and Enterprise Systems Engineering, 104 South Mathews Avenue, Urbana,Illinois 61801, United States
Abstract. A method capable of characterizing artificial weathering damage in dimension stone cladding usingaccess to one side only is presented. Dolomitic limestone test samples with increasing levels of damage werecreated artificially by exposing undamaged samples to increasing temperature levels of 100°C, 200°C, 300°C,400°C, 500°C, 600°C, and 700°C for a 90 min period of time. Using access to one side only, these test sampleswere nondestructively evaluated using a nonlinear approach based upon noncollinear wave mixing, whichinvolves mixing two critically refracted dilatational ultrasonic waves. Criteria were used to assure that thedetected scattered wave originated via wave interaction in the limestone and not from nonlinearities in the testingequipment. Bending tests were used to evaluate the flexure strength of beam samples extracted from the arti-ficially weathered samples. It was observed that the percentage of strength reduction is linearly correlated(R2 ¼ 98) with the temperature to which the specimens were exposed; it was noted that samples exposedto 400°C and 600°C had a strength reduction of 60% and 90%, respectively. It was also observed that resultsfrom the noncollinear wave mixing approach correlated well (R2 ¼ 0.98) with the destructively obtained percent-age of strength reduction. © 2016 Society of Photo-Optical Instrumentation Engineers (SPIE) [DOI: 10.1117/1.OE.55.1.011012]
Keywords: nonlinear ultrasonics; noncollinear wave mixing; dolomitic limestone; nonlinear response; damage accumulation; artificialweathering; materials characterization.
Paper 150379SSP received Mar. 23, 2015; accepted for publication May 7, 2015; published online Aug. 5, 2015.
1 IntroductionLimestone is frequently used as a building material in archi-tectural applications mainly because it makes up approxi-mately 10% of the total volume of all sedimentary rocks.Limestone rock can be granular or massive depending onthe method of formation; generally, it is mostly composedof calcite and aragonite, which are different crystal formsof calcium carbonate. Limestone can also originate fromdeposits of skeletal fragments of marine organisms suchas coral. Dolomite is formed when calcium carbonate (cal-cite) sediments are exposed to magnesium ions, which maybe present in the groundwater. Dolomitic limestone1,2 is com-prised of 50% to 90% calcite (CaCO3) and 10% to 50% ofdolomite [CaMgðCO3Þ2].
While early use of stone for structural construction(e.g., the Parthenon) utilized large blocks of stone to providestructural support and stability, with the advent of steel skel-eton frames in the late 1800s, thick load-bearing walls gaveway to thinner nonload-bearing walls.3–5 The early nonload-bearing walls were often constructed with 4-in. (102 mm)thick stone panels anchored to a masonry back-up wall.However, with modern design methods, 1 1
4in. (30 mm)
thick anchored stone panels are commonly used. Recently,(1980s), stone-faced composite panels, consisting of a 3/8 in.(10 mm) honeycombed aluminum core sandwiched betweena 1/16 in. (1.5 mm) thick stone panel (i.e., façade) and a thinmodern composite panel also began to be used on theexterior walls of buildings. However, the use of these thinstone veneers in exterior wall stone cladding systems onbuildings has resulted in new modes of failures.6
A study of failure modes in modern stone claddings con-sisting of granite (25%), limestone (40%), and marble (35%)made by Chin,6 led to the observations that failure of stonecladding systems was caused by: (1) failure of cladding con-nections (45%); (2) reduction in strength of stone (40%); and(3) water leakage (15%). Failure of cladding connections7–9
and water leakage10 can be addresses by better codes andbetter design, and the American Society for Testing andMaterials (ASTM) standards already address many of theseissues. However, reduction in strength due to weathering isstill a problem.11–14 Furthermore, some failure at the connec-tions can also be traced to strength loss of the stone claddingsat the connection points.7–9,15 To further complicate thisissue, the “quality” of undamaged, i.e., virgin, dimensionstone varies from quarry to quarry and from location to loca-tion within the same quarry. An example of poor claddingpractice including poor selection of virgin stone, is the83-story Amoco Building in Chicago.16 This building hadits 44,000 panels of 1 1
4-in. (30 mm) thick white Italian
Carrara marble panels replaced by white Mt. Airy granite.Laboratory testing revealed that the marble cladding hadexperienced a 40% reduction in strength with an additional30% loss of strength forecast over the next 10 years
Schouenborg et al.17 provides a discussion of deteriora-tion in the cladding panels, which gives a very conspicuouschange in their appearance; they can bow, warp, or dish.Marble may deteriorate due to several processes, and muchattention has been given to chemical and biological attack onold monuments and statues where it may cause seriousdecay;18–20 however, bowing in dimension stone has been
*Address all correspondence to: Henrique Reis, E-mail: [email protected] 0091-3286 /2016/$25.00 © 2016 SPIE
Optical Engineering 011012-1 January 2016 • Vol. 55(1)
Optical Engineering 55(1), 011012 (January 2016)
a problem for about a 100-year period.21–22 While mostreports about bowing are related to marble stone panels,examples of bowed limestone panels have also beenreported.23 Fewer examples of bowed granite cladding havebeen reported.24–25 However, in the context of marble andlimestone cladding on buildings, it appears that the most seri-ous problem is caused by thermal hysteresis combined withmoisture because of the thermal anisotropy of the calcitecrystals. In this paper, an ultrasonic noncollinear mixingof two critically refracted longitudinal waves is used toevaluate the level of damage in limestone cladding samples.The method only requires access to one surface of the dimen-sion stone cladding.
2 Nonlinear UltrasonicsTraditional acoustic structural-health-monitoring methodsare based upon principles that are valid in the linear elasticdomain. For waves propagating through a linear elasticmedium, the presence of flaws leads to phase and/or ampli-tude variation of the ultrasonic wave as it propagates throughthe defected material, while the frequency remains consistentwith that emitted by the sending transducer. Furthermore, theproperties of superposition are satisfied, where two or morewaves can cross paths and their resultant (in the region wherethey cross paths) is the addition of those waves. For nonlin-ear elastic materials, the frequency of the received signal dif-fers from the frequency of the emitted signal(s), [i.e., fromthe frequency of the wave generated by the sending trans-ducer(s)] implying that a nonlinear transformation of theultrasonic wave energy by the medium has occurred (e.g.,harmonic generation26–29). Superposition does not hold fornonlinear elastic materials due to the presence of higher-order terms in the nonlinear equations of motion. For thisclass of materials, when two waves cross paths, a thirdwave (i.e., a scattered wave) may be generated. In order fora strong scattered wave to be generated, resonance andpolarization conditions must be met.30–43
The third-order nonlinear equations of motion were devel-oped by Murnaghan30 by using equilibrium conditions andvirtual work. He proposed a set of third-order elastic con-stants (TOECs), which are commonly referred to as l, m,and n. Landau and Lifshitz31 suggested using the relationshipbetween the stress tensor and the elastic energy function asthe basis for deriving the nonlinear equations of motion andproposed a different set of TOECs A, B, and C; the derivationwas carried out by Gol’dberg.32 The two sets of TOECs arelinear combinations of each other. Jones and Kobett33 solvedthe third-order nonlinear elastic equations of motion anddeveloped criteria for the occurrence of a scattered wave.Experimentally, elastic nonlinear behavior has beenobserved for a variety of materials using the noncollinearwave mixing approach for a broad range of ultrasonicfrequencies.34–42 Noncollinear wave mixing has proved use-ful in a variety of practical applications including the deter-mination of the higher-order elastic constants36 and detectionof material degradation such as plastic deformation andfatigue damage accumulation in metals43 or aging in poly-mers.39 Johnson et al.34,35 reported scattered waves as a resultof nonlinear interaction of two intersecting waves of differentfrequencies in crystalline rock, and developed criteria toassure that the scattered wave is due to nonlinearities in
the material response and is not caused by nonlinearitiesinherent to the used instrumentation.
Distributed damage such as damage induced by fatiguetypically consists initially of phenomena affecting thematerial at many locations in the form of local variationsin the material microstructure. In metals, such as aluminum,these local variations in microstructure consist of fatigue-induced entanglement of dislocation substructures such asside bands. These side bands, which accumulate at the grainboundaries, produce strain localization, which eventuallyleads to microcracking initiation with an increasing numberof fatigue cycles. While these local changes in microstructuredo not change macroscopic elastic moduli or change acousticlinear parameters, such as acoustic velocity and attenuation,the stress field(s) in the dislocation(s) create(s) a local non-linear stress–strain response in the localized volume of thedislocation(s). Before the initiation of a visible terminalcrack, these local variations in the microstructure at thescale of single grains develop. This more or less even deg-radation of the material significantly reduces the material’sresistance against crack growth later when microcrackingcoalescence occurs. The ultimate strength of most structuralmaterials is limited by the presence of these microscopicmicrostructural variations, i.e., defects, which can be pro-duced by mechanical or thermal loading, and subsequentlyserve as nuclei of the fracture process. Because these nuclei(local variations) are significantly shorter than the acousticwavelength at the frequencies normally used in ultrasonicnondestructive evaluation, linear acoustic parameters (i.e.,attenuation, velocities, and so on) are usually not sensitiveenough to this microscopic degradation of the material struc-tural integrity. However, the presence of an increasing num-ber of entangled forests of dislocations with an increase offatigue damage causes a nonlinear distortion in a propagat-ing wave.
The microstructure of limestone is of a brick and mortartype and consequently exhibits nonlinear mesoscopic elasticbehavior.44,45 In these materials, the bricks (i.e., grains,crystals, and impurities) interface with one another acrossa distinctive, elastic difference system, which behaves asthe mortar. In limestone, the mortar is a system of asperitiesthat provides the connectivity among the bricks, i.e., at thegrain/crystal boundaries. Given that most of the deformationoccurs in the mortar, this system of asperities that providesthe connectivity among grains is the source of most of theinherent nonlinear response in limestone. In addition, dam-age in limestone, (such as damage due to weathering) canhave several causes including freeze-thaw cycles, acid disso-lution, frost action, and salt crystallization, and develops inthe form of distributed microflaw populations.46 This degra-dation of the material significantly reduces the material’s re-sistance against crack growth later when microcrackingcoalescence occurs. The ultimate strength is limited by thepresence of these microflaw populations, which will thenserve as nuclei for the fracture process. As in metals, thepresence of these microflaw populations causes a nonlineardistortion in a propagating wave. Experimentally, limestonehas already been shown to exhibit nonlinear behavior usingan ultrasonic resonance technique.47 Here, the nonlinearresponse of limestone samples with increasing levels of arti-ficially induced weathering damage is investigated using anoncollinear wave mixing approach using two critically
Optical Engineering 011012-2 January 2016 • Vol. 55(1)
McGovern and Reis: Damage characterization in dimension limestone cladding. . .
refracted dilatational waves similar to the methodology usedby Johnson et al. 34,35
3 Preparation of Specimens with ControlledDamage, X-Ray Spectroscopy, and LinearUltrasonic Characterization
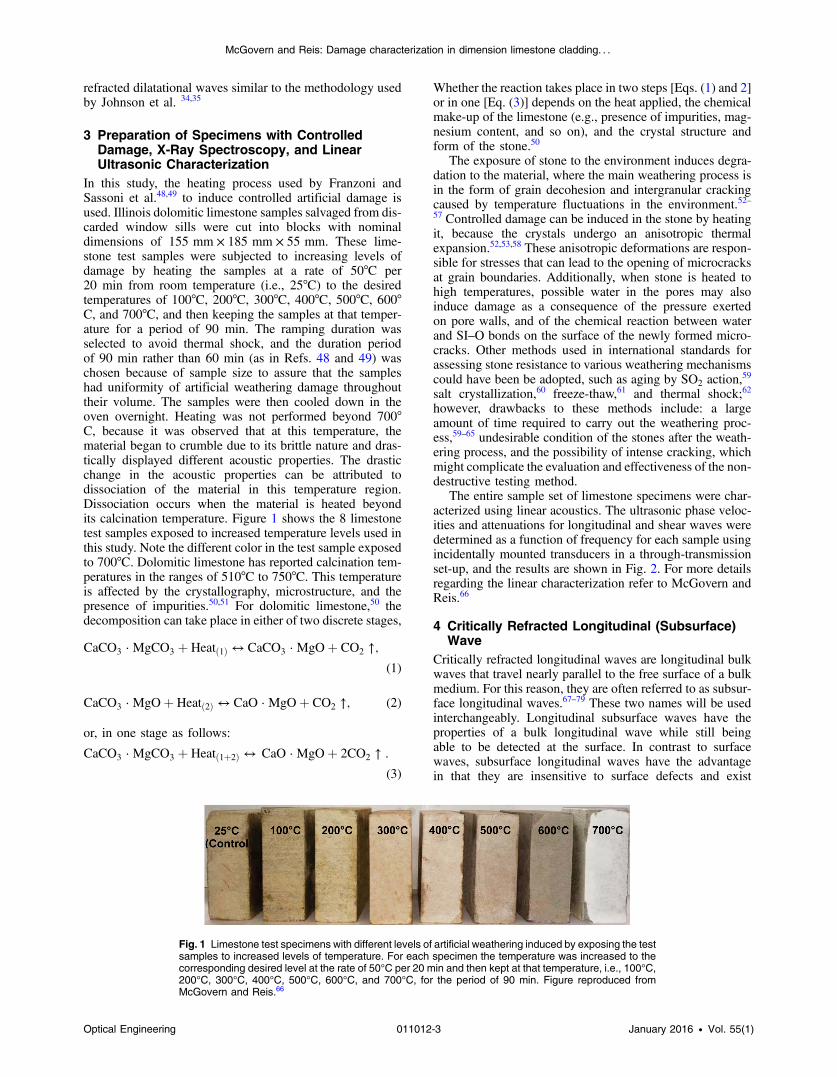
In this study, the heating process used by Franzoni andSassoni et al.48,49 to induce controlled artificial damage isused. Illinois dolomitic limestone samples salvaged from dis-carded window sills were cut into blocks with nominaldimensions of 155 mm × 185 mm × 55 mm. These lime-stone test samples were subjected to increasing levels ofdamage by heating the samples at a rate of 50°C per20 min from room temperature (i.e., 25°C) to the desiredtemperatures of 100°C, 200°C, 300°C, 400°C, 500°C, 600°C, and 700°C, and then keeping the samples at that temper-ature for a period of 90 min. The ramping duration wasselected to avoid thermal shock, and the duration periodof 90 min rather than 60 min (as in Refs. 48 and 49) waschosen because of sample size to assure that the sampleshad uniformity of artificial weathering damage throughouttheir volume. The samples were then cooled down in theoven overnight. Heating was not performed beyond 700°C, because it was observed that at this temperature, thematerial began to crumble due to its brittle nature and dras-tically displayed different acoustic properties. The drasticchange in the acoustic properties can be attributed todissociation of the material in this temperature region.Dissociation occurs when the material is heated beyondits calcination temperature. Figure 1 shows the 8 limestonetest samples exposed to increased temperature levels used inthis study. Note the different color in the test sample exposedto 700°C. Dolomitic limestone has reported calcination tem-peratures in the ranges of 510°C to 750°C. This temperatureis affected by the crystallography, microstructure, and thepresence of impurities.50,51 For dolomitic limestone,50 thedecomposition can take place in either of two discrete stages,
CaCO3 · MgCO3 þ Heatð1Þ ↔ CaCO3 · MgOþ CO2 ↑;
(1)
CaCO3 · MgOþ Heatð2Þ ↔ CaO · MgOþ CO2 ↑; (2)
or, in one stage as follows:
CaCO3 · MgCO3 þ Heatð1þ2Þ ↔ CaO · MgOþ 2CO2 ↑ :
(3)
Whether the reaction takes place in two steps [Eqs. (1) and 2]or in one [Eq. (3)] depends on the heat applied, the chemicalmake-up of the limestone (e.g., presence of impurities, mag-nesium content, and so on), and the crystal structure andform of the stone.50
The exposure of stone to the environment induces degra-dation to the material, where the main weathering process isin the form of grain decohesion and intergranular crackingcaused by temperature fluctuations in the environment.52–57 Controlled damage can be induced in the stone by heatingit, because the crystals undergo an anisotropic thermalexpansion.52,53,58 These anisotropic deformations are respon-sible for stresses that can lead to the opening of microcracksat grain boundaries. Additionally, when stone is heated tohigh temperatures, possible water in the pores may alsoinduce damage as a consequence of the pressure exertedon pore walls, and of the chemical reaction between waterand SI–O bonds on the surface of the newly formed micro-cracks. Other methods used in international standards forassessing stone resistance to various weathering mechanismscould have been be adopted, such as aging by SO2 action,
59
salt crystallization,60 freeze-thaw,61 and thermal shock;62
however, drawbacks to these methods include: a largeamount of time required to carry out the weathering proc-ess,59–65 undesirable condition of the stones after the weath-ering process, and the possibility of intense cracking, whichmight complicate the evaluation and effectiveness of the non-destructive testing method.
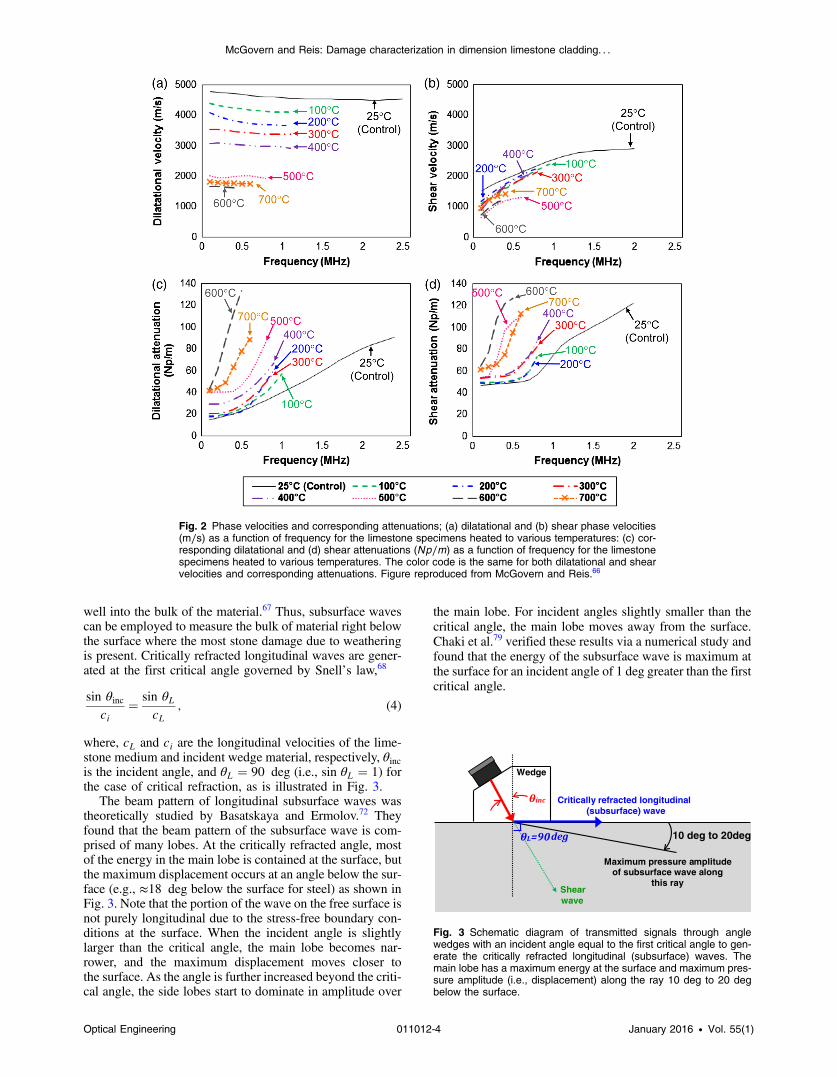
The entire sample set of limestone specimens were char-acterized using linear acoustics. The ultrasonic phase veloc-ities and attenuations for longitudinal and shear waves weredetermined as a function of frequency for each sample usingincidentally mounted transducers in a through-transmissionset-up, and the results are shown in Fig. 2. For more detailsregarding the linear characterization refer to McGovern andReis.66
4 Critically Refracted Longitudinal (Subsurface)Wave
Critically refracted longitudinal waves are longitudinal bulkwaves that travel nearly parallel to the free surface of a bulkmedium. For this reason, they are often referred to as subsur-face longitudinal waves.67–79 These two names will be usedinterchangeably. Longitudinal subsurface waves have theproperties of a bulk longitudinal wave while still beingable to be detected at the surface. In contrast to surfacewaves, subsurface longitudinal waves have the advantagein that they are insensitive to surface defects and exist
Fig. 1 Limestone test specimens with different levels of artificial weathering induced by exposing the testsamples to increased levels of temperature. For each specimen the temperature was increased to thecorresponding desired level at the rate of 50°C per 20 min and then kept at that temperature, i.e., 100°C,200°C, 300°C, 400°C, 500°C, 600°C, and 700°C, for the period of 90 min. Figure reproduced fromMcGovern and Reis.66
Optical Engineering 011012-3 January 2016 • Vol. 55(1)
McGovern and Reis: Damage characterization in dimension limestone cladding. . .
well into the bulk of the material.67 Thus, subsurface wavescan be employed to measure the bulk of material right belowthe surface where the most stone damage due to weatheringis present. Critically refracted longitudinal waves are gener-ated at the first critical angle governed by Snell’s law,68
sin θincci
¼ sin θLcL
; (4)
where, cL and ci are the longitudinal velocities of the lime-stone medium and incident wedge material, respectively, θincis the incident angle, and θL ¼ 90 deg (i.e., sin θL ¼ 1) forthe case of critical refraction, as is illustrated in Fig. 3.
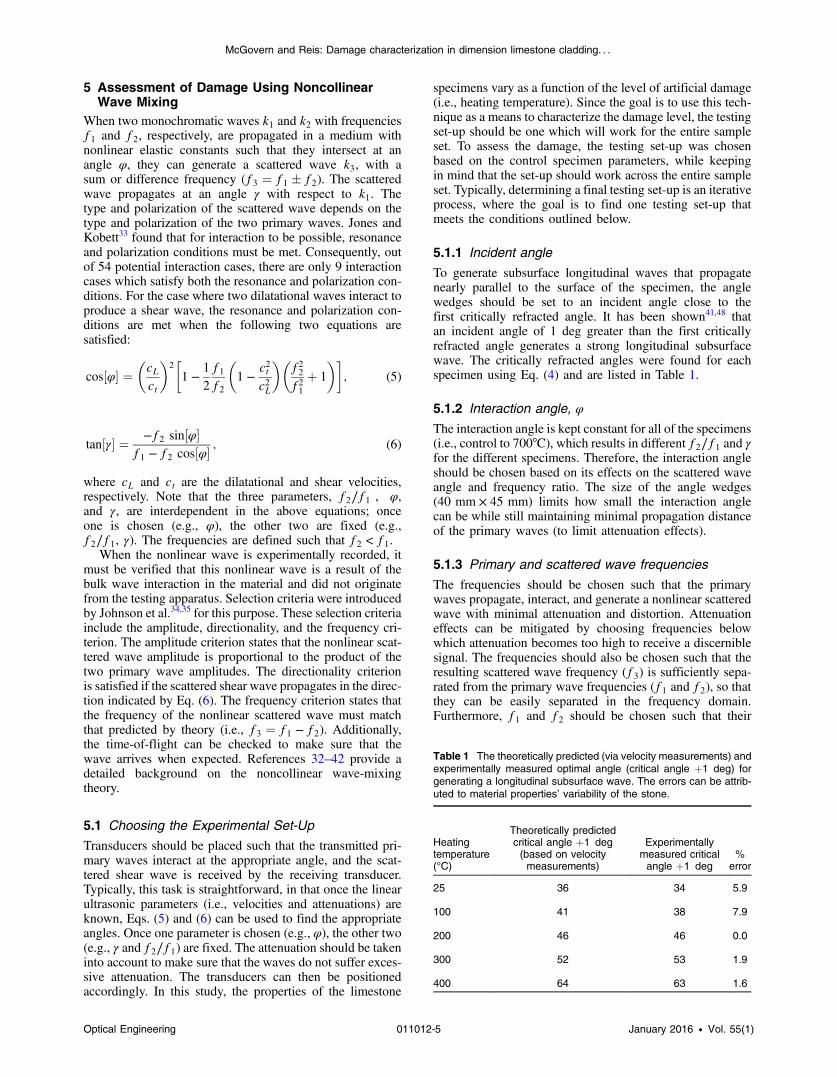
The beam pattern of longitudinal subsurface waves wastheoretically studied by Basatskaya and Ermolov.72 Theyfound that the beam pattern of the subsurface wave is com-prised of many lobes. At the critically refracted angle, mostof the energy in the main lobe is contained at the surface, butthe maximum displacement occurs at an angle below the sur-face (e.g., ≈18 deg below the surface for steel) as shown inFig. 3. Note that the portion of the wave on the free surface isnot purely longitudinal due to the stress-free boundary con-ditions at the surface. When the incident angle is slightlylarger than the critical angle, the main lobe becomes nar-rower, and the maximum displacement moves closer tothe surface. As the angle is further increased beyond the criti-cal angle, the side lobes start to dominate in amplitude over
the main lobe. For incident angles slightly smaller than thecritical angle, the main lobe moves away from the surface.Chaki et al.79 verified these results via a numerical study andfound that the energy of the subsurface wave is maximum atthe surface for an incident angle of 1 deg greater than the firstcritical angle.
Fig. 2 Phase velocities and corresponding attenuations; (a) dilatational and (b) shear phase velocities(m∕s) as a function of frequency for the limestone specimens heated to various temperatures: (c) cor-responding dilatational and (d) shear attenuations (Np∕m) as a function of frequency for the limestonespecimens heated to various temperatures. The color code is the same for both dilatational and shearvelocities and corresponding attenuations. Figure reproduced from McGovern and Reis.66
Wedge
Shear wave
10 deg to 20deg
Critically refracted longitudinal (subsurface) wave
Maximum pressure amplitudeof subsurface wave along
this ray
Fig. 3 Schematic diagram of transmitted signals through anglewedges with an incident angle equal to the first critical angle to gen-erate the critically refracted longitudinal (subsurface) waves. Themain lobe has a maximum energy at the surface and maximum pres-sure amplitude (i.e., displacement) along the ray 10 deg to 20 degbelow the surface.
Optical Engineering 011012-4 January 2016 • Vol. 55(1)
McGovern and Reis: Damage characterization in dimension limestone cladding. . .
5 Assessment of Damage Using NoncollinearWave Mixing
When two monochromatic waves k1 and k2 with frequenciesf1 and f2, respectively, are propagated in a medium withnonlinear elastic constants such that they intersect at anangle φ, they can generate a scattered wave k3, with asum or difference frequency (f3 ¼ f1 � f2). The scatteredwave propagates at an angle γ with respect to k1. Thetype and polarization of the scattered wave depends on thetype and polarization of the two primary waves. Jones andKobett33 found that for interaction to be possible, resonanceand polarization conditions must be met. Consequently, outof 54 potential interaction cases, there are only 9 interactioncases which satisfy both the resonance and polarization con-ditions. For the case where two dilatational waves interact toproduce a shear wave, the resonance and polarization con-ditions are met when the following two equations aresatisfied:
cos½φ� ¼�cLct
�2�1 −
1
2
f1f2
�1 −
c2tc2L
��f22f21
þ 1
��; (5)
tan½γ� ¼ −f2 sin½φ�f1 − f2 cos½φ� ; (6)
where cL and ct are the dilatational and shear velocities,respectively. Note that the three parameters, f2∕f1 , φ,and γ, are interdependent in the above equations; onceone is chosen (e.g., φ), the other two are fixed (e.g.,f2∕f1, γ). The frequencies are defined such that f2 < f1.
When the nonlinear wave is experimentally recorded, itmust be verified that this nonlinear wave is a result of thebulk wave interaction in the material and did not originatefrom the testing apparatus. Selection criteria were introducedby Johnson et al.34,35 for this purpose. These selection criteriainclude the amplitude, directionality, and the frequency cri-terion. The amplitude criterion states that the nonlinear scat-tered wave amplitude is proportional to the product of thetwo primary wave amplitudes. The directionality criterionis satisfied if the scattered shear wave propagates in the direc-tion indicated by Eq. (6). The frequency criterion states thatthe frequency of the nonlinear scattered wave must matchthat predicted by theory (i.e., f3 ¼ f1 − f2). Additionally,the time-of-flight can be checked to make sure that thewave arrives when expected. References 32–42 provide adetailed background on the noncollinear wave-mixingtheory.
5.1 Choosing the Experimental Set-Up
Transducers should be placed such that the transmitted pri-mary waves interact at the appropriate angle, and the scat-tered shear wave is received by the receiving transducer.Typically, this task is straightforward, in that once the linearultrasonic parameters (i.e., velocities and attenuations) areknown, Eqs. (5) and (6) can be used to find the appropriateangles. Once one parameter is chosen (e.g., φ), the other two(e.g., γ and f2∕f1) are fixed. The attenuation should be takeninto account to make sure that the waves do not suffer exces-sive attenuation. The transducers can then be positionedaccordingly. In this study, the properties of the limestone
specimens vary as a function of the level of artificial damage(i.e., heating temperature). Since the goal is to use this tech-nique as a means to characterize the damage level, the testingset-up should be one which will work for the entire sampleset. To assess the damage, the testing set-up was chosenbased on the control specimen parameters, while keepingin mind that the set-up should work across the entire sampleset. Typically, determining a final testing set-up is an iterativeprocess, where the goal is to find one testing set-up thatmeets the conditions outlined below.
5.1.1 Incident angle
To generate subsurface longitudinal waves that propagatenearly parallel to the surface of the specimen, the anglewedges should be set to an incident angle close to thefirst critically refracted angle. It has been shown41,48 thatan incident angle of 1 deg greater than the first criticallyrefracted angle generates a strong longitudinal subsurfacewave. The critically refracted angles were found for eachspecimen using Eq. (4) and are listed in Table 1.
5.1.2 Interaction angle, φ
The interaction angle is kept constant for all of the specimens(i.e., control to 700°C), which results in different f2∕f1 and γfor the different specimens. Therefore, the interaction angleshould be chosen based on its effects on the scattered waveangle and frequency ratio. The size of the angle wedges(40 mm × 45 mm) limits how small the interaction anglecan be while still maintaining minimal propagation distanceof the primary waves (to limit attenuation effects).
5.1.3 Primary and scattered wave frequencies
The frequencies should be chosen such that the primarywaves propagate, interact, and generate a nonlinear scatteredwave with minimal attenuation and distortion. Attenuationeffects can be mitigated by choosing frequencies belowwhich attenuation becomes too high to receive a discerniblesignal. The frequencies should also be chosen such that theresulting scattered wave frequency (f3) is sufficiently sepa-rated from the primary wave frequencies (f1 and f2), so thatthey can be easily separated in the frequency domain.Furthermore, f1 and f2 should be chosen such that their
Table 1 The theoretically predicted (via velocity measurements) andexperimentally measured optimal angle (critical angle þ1 deg) forgenerating a longitudinal subsurface wave. The errors can be attrib-uted to material properties’ variability of the stone.
Heatingtemperature(°C)
Theoretically predictedcritical angle þ1 deg(based on velocitymeasurements)
Experimentallymeasured criticalangle þ1 deg
%error
25 36 34 5.9
100 41 38 7.9
200 46 46 0.0
300 52 53 1.9
400 64 63 1.6
Optical Engineering 011012-5 January 2016 • Vol. 55(1)
McGovern and Reis: Damage characterization in dimension limestone cladding. . .
velocities match with the theory presented in Eqs. (5) and (6)[which assumes that k1 (f1) and k2 (f2) have the same veloc-ity]. Based on these considerations, the primary wavesshould be chosen within a frequency range of 100 to500 kHz, and the resulting scattered shear wave should bewithin a frequency range of 50 to 300 kHz.
5.1.4 Scattered wave angle, γ
Recall that the transducer placement is based on the controlspecimen’s parameters, and will remain the same for theentire sample set. Since the interaction angle is held constant,the scattered wave angle (k3 measured with respect to k1)will change with the amount of damage. The amount ofdeviation between the angle for which the receiving trans-ducer is placed and the actual scattered angles will affecthow well the nonlinear scattered wave is received. Forthis reason, a case should be found that minimizes the differ-ence in scattered wave angles between the control specimenand the other aged specimens so that even if the receivingtransducer is not oriented in the ideal location, it can stillreceive the nonlinear scattered wave. The face of the receiv-ing transducer used in this study was quite large (diameter≈44 mm), which allowed for the scattered wave angle for theaged specimens to deviate from the control scattered waveangle and still strike the transducer face.
5.1.5 Specimen dimensions
As shown in Fig. 2, the attenuation in the limestone speci-mens strongly increases with increasing damage, whichgreatly reduces the amplitudes of the primary and scatteredwaves as they propagate through the damaged specimens.This loss due to attenuation should be minimized by mini-mizing the distance through which the wave propagates toensure that the scattered nonlinear wave can be detectedby the receiver. However, the propagation distances shouldbe at least one wavelength long such that the waves are sta-bilized by the time they interact. For simplicity, k1 and k2 canbe chosen to have the same propagation distances.
5.2 Nonlinear Wave Generation Parameter, β.
Consider the case where two monochromatic, subsurfacelongitudinal waves, k1 and k2, propagate nearly parallel tothe free surface of a bulk medium and interact to generatea scattered shear wave k3. The amplitude of k3 will be pro-portional to the product of two primary wave amplitudes.33
To be consistent with the experimental set-up, letDk1 ¼ Dk2 ¼ D. Thus, the amplitude of k3 can be describedas
Að°CÞ ¼ βð°CÞAðk1ÞS Aðk2Þ
S e−½αðk1;Þþαðk2;Þ�De−αðk3;°CÞDk3 ; (7)
where βð°CÞ.The subscript °C denotes the temperature towhich the sample was heated. Since the waves are propagat-ing nearly parallel to the surface, the energy loss of the wavewill be mostly due to attenuation and beam spread.Normalizing the amplitude by the attenuation leads to
A�ð°CÞ ¼
Að°CÞe−½αðk1;°CÞþαðk2;°CÞ�De−αðk3;°CÞDk3
¼ βð°CÞAðk1ÞS Aðk2Þ
S :
(8)
Assuming consistent couplant conditions, Eq. (8) can beused to normalize the nonlinear wave amplitude by the non-linear wave amplitude of the control (i.e., 25°C) to yield
β
βo¼ βð°CÞ
βð25°CÞ¼
A�ð°CÞ
A�ð25°CÞ
: (9)
This normalized parameter is termed the normalized non-linear wave generation parameter, and it represents the effi-ciency of energy transfer from the primary waves to thescattered nonlinear wave; it also represents the level of dam-age of the specimen relative to the “undamaged” controlspecimen. This parameter should not be a function of thetesting set-up.
6 Experimental Set-Up and Data CollectionDilatational transducers (Panametrics V413, center fre-quency 500 kHz) mounted on variable plastic angle wedgeswere used to generate subsurface dilatational waves. The var-iable angle wedges (Panametrics ABWX-2001, longitudinalvelocity ¼ 2720 m∕s) were set at an incident angle whichcorresponded to 1 deg greater than the critically refractedangle for each specimen to ensure that subsurface dilatationalwaves were generated close to the surface. The angle wasmeasured using a digital protractor with an accuracy of1 deg. The incident angles were found using two differentmethods: (1) using velocity measurements obtained via athrough transmission set-up from a previous study (seeFig. 2) in conjunction with Snell’s law, and (2) using an iter-ative technique whereby the incident angle was varied untilthe amplitude of the detected subsurface wave was maxi-mum. For the second method, care was taken to leave thecouplant conditions undisturbed (to the extent possible) asthe incident angle was varied.
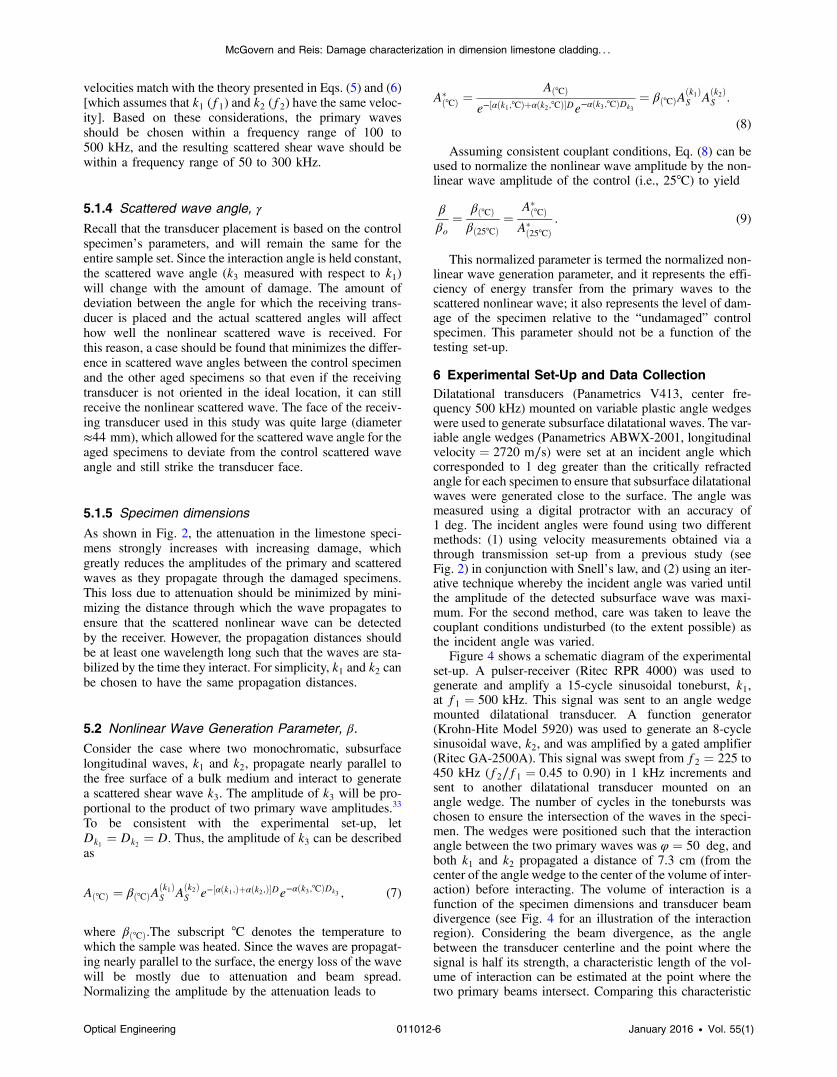
Figure 4 shows a schematic diagram of the experimentalset-up. A pulser-receiver (Ritec RPR 4000) was used togenerate and amplify a 15-cycle sinusoidal toneburst, k1,at f1 ¼ 500 kHz. This signal was sent to an angle wedgemounted dilatational transducer. A function generator(Krohn-Hite Model 5920) was used to generate an 8-cyclesinusoidal wave, k2, and was amplified by a gated amplifier(Ritec GA-2500A). This signal was swept from f2 ¼ 225 to450 kHz (f2∕f1 ¼ 0.45 to 0.90) in 1 kHz increments andsent to another dilatational transducer mounted on anangle wedge. The number of cycles in the tonebursts waschosen to ensure the intersection of the waves in the speci-men. The wedges were positioned such that the interactionangle between the two primary waves was φ ¼ 50 deg, andboth k1 and k2 propagated a distance of 7.3 cm (from thecenter of the angle wedge to the center of the volume of inter-action) before interacting. The volume of interaction is afunction of the specimen dimensions and transducer beamdivergence (see Fig. 4 for an illustration of the interactionregion). Considering the beam divergence, as the anglebetween the transducer centerline and the point where thesignal is half its strength, a characteristic length of the vol-ume of interaction can be estimated at the point where thetwo primary beams intersect. Comparing this characteristic
Optical Engineering 011012-6 January 2016 • Vol. 55(1)
McGovern and Reis: Damage characterization in dimension limestone cladding. . .
length with the number of possible signal wavelengthswithin the region of interaction, the characteristic lengthof the volume of interaction is always greater than fourtimes the largest signal wavelength, i.e., k2, for the entiresample set.
A third longitudinal transducer (Panametrics V1011,center frequency 100 kHz) was mounted incidentally onthe specimen surface in the path of k3 (γ ¼ −43 deg withrespect to k1), such that the scattered nonlinear wave propa-gated a distance of 3.5 cm from the center of the volume ofinteraction to the center of the transducer face. The receivedscattered shear wave was filtered using a 4-pole Butterworthfilter (Krohn-Hite model 3945), amplified, and sent to thecomputer for data acquisition.
The placement of the sending/receiving transducers werebased on the angles (φ and γ) calculated using the controlspecimen properties. The same transducer placement wasused for the entire sample set. Table 2 contains the theoreticalvalues for all of the specimens. The velocities used to calcu-late the velocity ratio were computed using the mean veloc-ities across 300 to 500 kHz. A plastic template was created
using a three-dimensional printer to ensure the reproducibil-ity of transducer placement between tests.
The generated scattered nonlinear wave is very small inamplitude due to the low conversion efficiency of the pri-mary wave energy used to generate the scattered wave14,15
and the relative high attenuation in damaged limestone.Furthermore, the time-of-flight is such that much of the scat-tered nonlinear wave is superimposed with the primarywaves. To extract the nonlinear scattered wave, the followingsteps were taken during data acquisition: (1) data was col-lected while the two sending transducers were simultane-ously operated, (2) data was collected while one sendingtransducer was individually operated, and (3) data was col-lected while the other sending transducer was individuallyoperated. The nonlinear signal was obtained by subtractingthe signals from steps (2) and (3) from the signal obtained instep (1). The signal remaining (i.e., the difference signal)should be the nonlinear scattered wave; however, the subtrac-tion is imperfect because a portion of the energy from theprimary waves is used to create the scattered nonlinearwave. Therefore, the signal obtained from simultaneous
A/D
Ritecgated RF amplifier
Krohn-hite function generator
Ritec pulser
receiver RPR-4000
Krohn-hite Filter / amplifier
Trigger
Volume of interaction
-
k2k3
k1
Fig. 4 Schematic diagram of data acquisition system and sensor placement for noncollinear interactionmeasurements. The dilatational transducers were mounted on shear wedges to generate criticallyrefracted longitudinal waves that intercept each other at an angle φ ¼ 50 deg. A dilatational receivingsensor was placed on top in the path of the scattered nonlinear wave.
Table 2 Average dilatational and shear velocities (between 300 and 500 kHz), corresponding frequency ratios f 2∕f 1 and scattered wave angles γfor an interaction angle φ of 50 deg. For time-of-flight calculations, the shear velocity at the scattered wave frequency f 3 is also presented.
Heatingtemperature(°C)
Dilatationalvelocity mean
(300 to 500 kHz)cL (m∕s)
Shear velocitymean (300 to500 kHz)cS (m∕s)
Velocityratio cS∕cL
Interactionangle φ (deg)
Frequencyratio f 2∕f 1
Angle of scatteredwave γ (deg)
Scattered wavefrequencyf 3 ¼ f 1 − f 2
(kHz)Shear velocity at
f 3 cS (m∕s)
25 (control) 4715 1916 0.406 50a 0.688 −43a 156 1604
100 4251 1588 0.374 0.713 −45 144 1175
200 3832 1746 0.456 0.651 −41 175 1336
300 3482 1624 0.467 0.642 −40 179 1230
400 3050 1684 0.552 0.575 −35 212 1261
aCare was taken to find a case where the difference in the scattered wave angle was minimal (i.e., γ400 − γControl ¼ 8 deg) so that the receivingtransducer could detect the scattered wave for all specimens. Keeping the angles constant causes the frequency ratio at which the nonlinear waveinteraction occurs to shift.
Optical Engineering 011012-7 January 2016 • Vol. 55(1)
McGovern and Reis: Damage characterization in dimension limestone cladding. . .
operation of the transducers has an amplitude slightly lowerthan the sum of the signals obtained when the transducerswere operated individually. As a result of the imperfect sub-traction, a portion of the primary waves is in the subtractedsignal. This was addressed by applying a filter to the differ-ence signal to filter much of the primary wave contribution.To maximize the ability to detect the scattered wave, an aver-age of 300 waveforms was taken to mitigate scatteringeffects. To avoid trigger jitter, a high sample rate(50 MHz) was used.34,35 Ten independent measurementswere taken for each specimen. Each independent measure-ment consisted of removing the sensors/wedges and cou-plant, applying a new couplant, and placing the sensors/wedge back into position.
Subsequent to the nonlinear ultrasonic testing, four-pointbending tests were carried out to estimate the relative reduc-tion in flexure strength caused by the relative increase in arti-ficial weathering damage. Five beam samples were cut fromeach of the seven heated specimens for a total of 35 beamsamples. The nominal dimensions of the beam sampleswere 55 mm wide by 15 mm thick by 180 mm long. Thedimensions were chosen such that the beam theory (i.e.,h ≤ 10 L) was satisfied. Prior to running any flexure tests,the beam specimens were conditioned by placing them in anoven at 60°C for 15 h. At the 13th, 14th, and 15th hour, thespecimens were weighed to ensure that the weight remainedconstant and the specimens were fully dry.
The specimens were loaded in four-point bending with asupporting span of 160 mm and a loading span of 40 mm.The displacement rate was set at 0.05 mm∕min. Load anddisplacement measurements were recorded until the speci-mens fractured. The testing set-up and procedure conformed(to the extent possible) to the ASTM C880-09 standard.12
The width of the sample did not conform to the standard,as the dimensions were limited by the original sample geom-etry. The reduction in strength was assessed with respect tothe control specimen so that the damage could be character-ized in terms of a percentage reduction in strength.
7 Experimental ResultsPrior to data collection, the critical angles were found via twoseparate methods. The first method was based upon theexperimentally measured velocities and the Snell’s law.The velocity measurements were taken using a through trans-mission technique where sending and receiving transducerswere mounted on opposite parallel faces of the specimen.66
These measurements were performed in a different locationon the specimen than the noncollinear measurements in orderto avoid saturating the specimen with couplant. For the sec-ond method, an iterative technique was used, whereby thecritical angle was (directly) experimentally measured.Table 1 shows the incident angles determined via both meth-ods for each specimen. Discrepancies between the anglesmeasured via these two methods can be attributed to variabil-ity in material properties within each of the limestone spec-imens. The experimentally measured angles are moreindicative of the actual critical angles because these measure-ments were performed in the location where the noncollinearwave-mixing measurements took place. Once the criticalangles were determined, noncollinear wave-mixing measure-ments were carried out using incident angles set to the criticalangles found with both methods.
The angle wedges could not be used for the samplesheated to a temperature beyond 400°C, because their ultra-sonic velocities are lower than the wedge velocity. Based onSnell’s law, it is not possible to generate critically refractedlongitudinal waves (i.e., θL ≈ 90°C) with the current wedges.To generate subsurface waves for samples heated beyond400°C, angle wedges with a sufficiently low (i.e., lowerthan the dilatational velocity of the specimen) ultrasonicvelocity would be required.
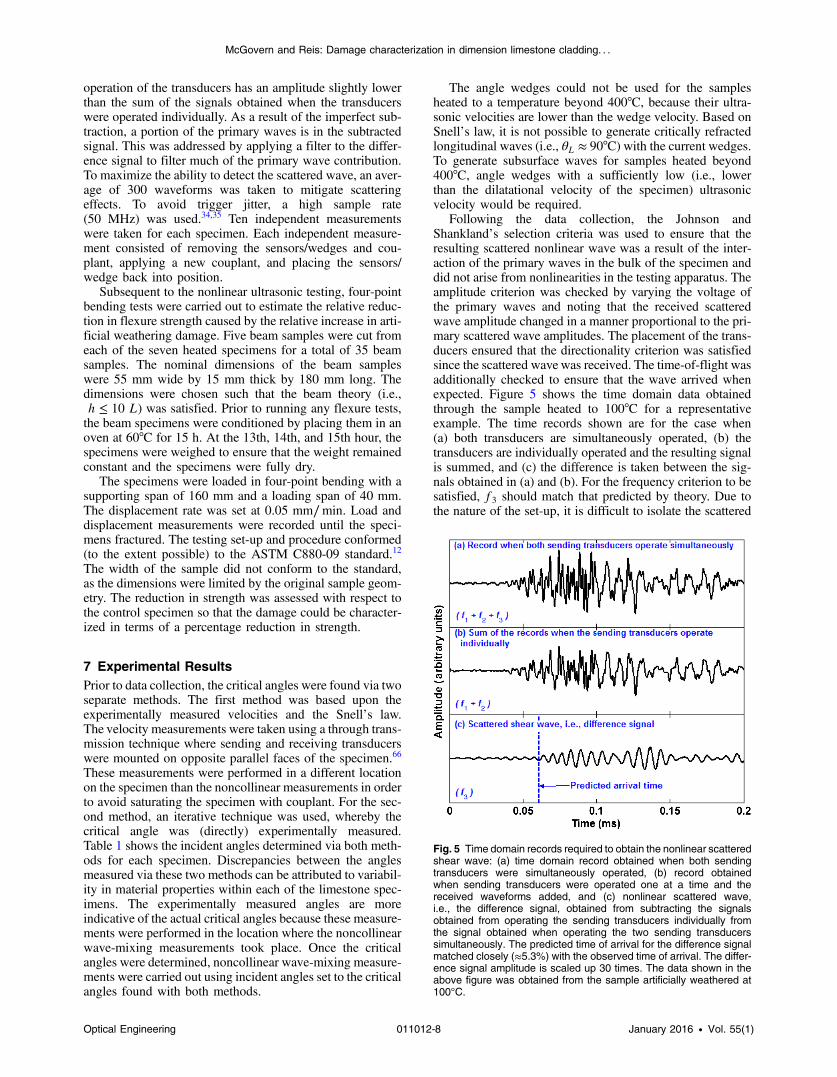
Following the data collection, the Johnson andShankland’s selection criteria was used to ensure that theresulting scattered nonlinear wave was a result of the inter-action of the primary waves in the bulk of the specimen anddid not arise from nonlinearities in the testing apparatus. Theamplitude criterion was checked by varying the voltage ofthe primary waves and noting that the received scatteredwave amplitude changed in a manner proportional to the pri-mary scattered wave amplitudes. The placement of the trans-ducers ensured that the directionality criterion was satisfiedsince the scattered wave was received. The time-of-flight wasadditionally checked to ensure that the wave arrived whenexpected. Figure 5 shows the time domain data obtainedthrough the sample heated to 100°C for a representativeexample. The time records shown are for the case when(a) both transducers are simultaneously operated, (b) thetransducers are individually operated and the resulting signalis summed, and (c) the difference is taken between the sig-nals obtained in (a) and (b). For the frequency criterion to besatisfied, f3 should match that predicted by theory. Due tothe nature of the set-up, it is difficult to isolate the scattered
Fig. 5 Time domain records required to obtain the nonlinear scatteredshear wave: (a) time domain record obtained when both sendingtransducers were simultaneously operated, (b) record obtainedwhen sending transducers were operated one at a time and thereceived waveforms added, and (c) nonlinear scattered wave,i.e., the difference signal, obtained from subtracting the signalsobtained from operating the sending transducers individually fromthe signal obtained when operating the two sending transducerssimultaneously. The predicted time of arrival for the difference signalmatched closely (≈5.3%) with the observed time of arrival. The differ-ence signal amplitude is scaled up 30 times. The data shown in theabove figure was obtained from the sample artificially weathered at100°C.
Optical Engineering 011012-8 January 2016 • Vol. 55(1)
McGovern and Reis: Damage characterization in dimension limestone cladding. . .
wave due to interference with the primary waves. Recall thatf2 was swept as f1 was held constant; thus, as the f2∕f1approaches the theoretical f2∕f1 value, the amplitude ofthe nonlinear scattered wave (i.e., the difference signalwas passed through a bandpass filter about f3) shouldreach a maximum. Likewise, as f2 is swept away fromthe theoretical value, the amplitude of the scattered nonlinearwave decreases.
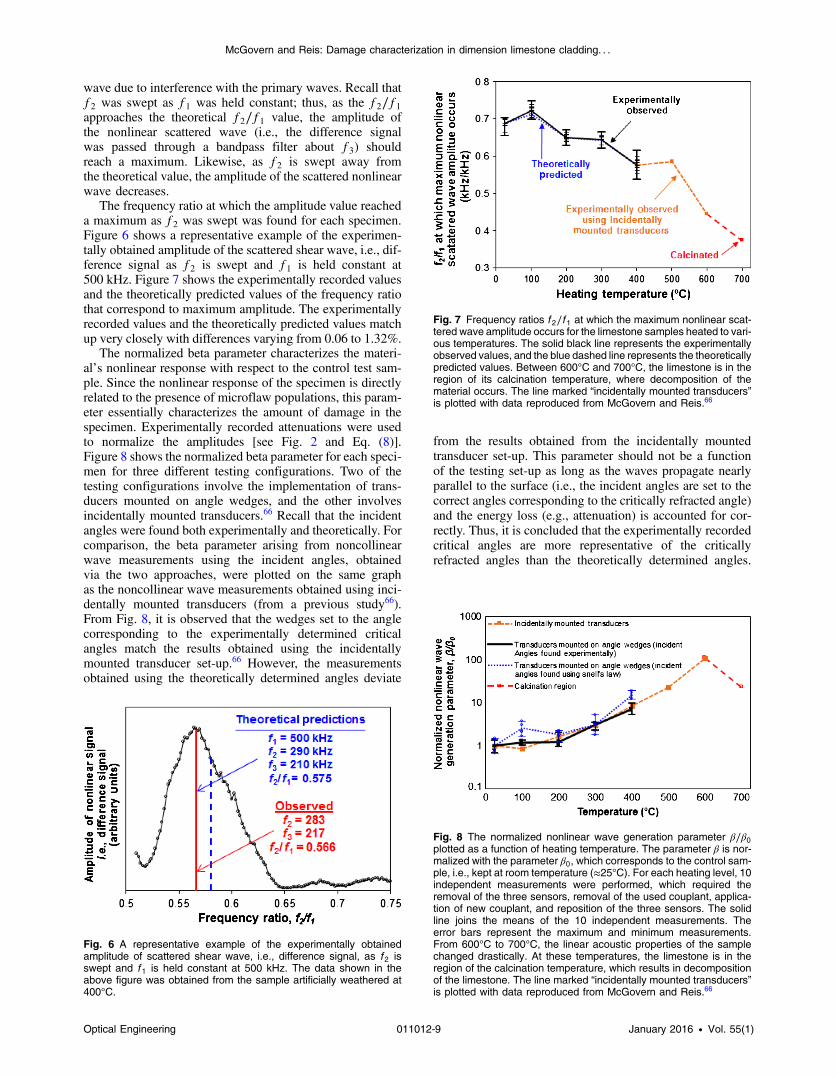
The frequency ratio at which the amplitude value reacheda maximum as f2 was swept was found for each specimen.Figure 6 shows a representative example of the experimen-tally obtained amplitude of the scattered shear wave, i.e., dif-ference signal as f2 is swept and f1 is held constant at500 kHz. Figure 7 shows the experimentally recorded valuesand the theoretically predicted values of the frequency ratiothat correspond to maximum amplitude. The experimentallyrecorded values and the theoretically predicted values matchup very closely with differences varying from 0.06 to 1.32%.
The normalized beta parameter characterizes the materi-al’s nonlinear response with respect to the control test sam-ple. Since the nonlinear response of the specimen is directlyrelated to the presence of microflaw populations, this param-eter essentially characterizes the amount of damage in thespecimen. Experimentally recorded attenuations were usedto normalize the amplitudes [see Fig. 2 and Eq. (8)].Figure 8 shows the normalized beta parameter for each speci-men for three different testing configurations. Two of thetesting configurations involve the implementation of trans-ducers mounted on angle wedges, and the other involvesincidentally mounted transducers.66 Recall that the incidentangles were found both experimentally and theoretically. Forcomparison, the beta parameter arising from noncollinearwave measurements using the incident angles, obtainedvia the two approaches, were plotted on the same graphas the noncollinear wave measurements obtained using inci-dentally mounted transducers (from a previous study66).From Fig. 8, it is observed that the wedges set to the anglecorresponding to the experimentally determined criticalangles match the results obtained using the incidentallymounted transducer set-up.66 However, the measurementsobtained using the theoretically determined angles deviate
from the results obtained from the incidentally mountedtransducer set-up. This parameter should not be a functionof the testing set-up as long as the waves propagate nearlyparallel to the surface (i.e., the incident angles are set to thecorrect angles corresponding to the critically refracted angle)and the energy loss (e.g., attenuation) is accounted for cor-rectly. Thus, it is concluded that the experimentally recordedcritical angles are more representative of the criticallyrefracted angles than the theoretically determined angles.
Fig. 6 A representative example of the experimentally obtainedamplitude of scattered shear wave, i.e., difference signal, as f 2 isswept and f 1 is held constant at 500 kHz. The data shown in theabove figure was obtained from the sample artificially weathered at400°C.
Fig. 7 Frequency ratios f 2∕f 1 at which the maximum nonlinear scat-tered wave amplitude occurs for the limestone samples heated to vari-ous temperatures. The solid black line represents the experimentallyobserved values, and the blue dashed line represents the theoreticallypredicted values. Between 600°C and 700°C, the limestone is in theregion of its calcination temperature, where decomposition of thematerial occurs. The line marked “incidentally mounted transducers”is plotted with data reproduced from McGovern and Reis.66
Fig. 8 The normalized nonlinear wave generation parameter β∕β0plotted as a function of heating temperature. The parameter β is nor-malized with the parameter β0, which corresponds to the control sam-ple, i.e., kept at room temperature (≈25°C). For each heating level, 10independent measurements were performed, which required theremoval of the three sensors, removal of the used couplant, applica-tion of new couplant, and reposition of the three sensors. The solidline joins the means of the 10 independent measurements. Theerror bars represent the maximum and minimum measurements.From 600°C to 700°C, the linear acoustic properties of the samplechanged drastically. At these temperatures, the limestone is in theregion of the calcination temperature, which results in decompositionof the limestone. The line marked “incidentally mounted transducers”is plotted with data reproduced from McGovern and Reis.66
Optical Engineering 011012-9 January 2016 • Vol. 55(1)
McGovern and Reis: Damage characterization in dimension limestone cladding. . .
The difference is mainly due to the variability of materialproperties within the test specimens.
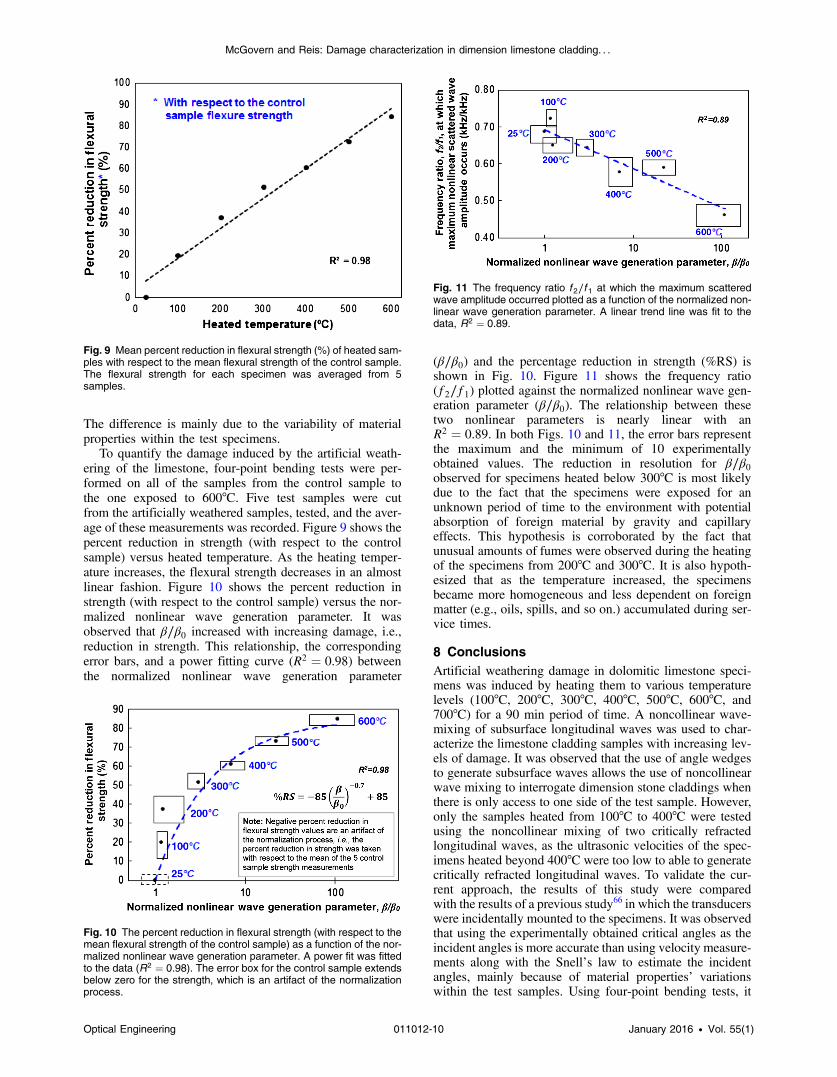
To quantify the damage induced by the artificial weath-ering of the limestone, four-point bending tests were per-formed on all of the samples from the control sample tothe one exposed to 600°C. Five test samples were cutfrom the artificially weathered samples, tested, and the aver-age of these measurements was recorded. Figure 9 shows thepercent reduction in strength (with respect to the controlsample) versus heated temperature. As the heating temper-ature increases, the flexural strength decreases in an almostlinear fashion. Figure 10 shows the percent reduction instrength (with respect to the control sample) versus the nor-malized nonlinear wave generation parameter. It wasobserved that β∕β0 increased with increasing damage, i.e.,reduction in strength. This relationship, the correspondingerror bars, and a power fitting curve (R2 ¼ 0.98) betweenthe normalized nonlinear wave generation parameter
(β∕β0) and the percentage reduction in strength (%RS) isshown in Fig. 10. Figure 11 shows the frequency ratio(f2∕f1) plotted against the normalized nonlinear wave gen-eration parameter (β∕β0). The relationship between thesetwo nonlinear parameters is nearly linear with anR2 ¼ 0.89. In both Figs. 10 and 11, the error bars representthe maximum and the minimum of 10 experimentallyobtained values. The reduction in resolution for β∕β0observed for specimens heated below 300°C is most likelydue to the fact that the specimens were exposed for anunknown period of time to the environment with potentialabsorption of foreign material by gravity and capillaryeffects. This hypothesis is corroborated by the fact thatunusual amounts of fumes were observed during the heatingof the specimens from 200°C and 300°C. It is also hypoth-esized that as the temperature increased, the specimensbecame more homogeneous and less dependent on foreignmatter (e.g., oils, spills, and so on.) accumulated during ser-vice times.
8 ConclusionsArtificial weathering damage in dolomitic limestone speci-mens was induced by heating them to various temperaturelevels (100°C, 200°C, 300°C, 400°C, 500°C, 600°C, and700°C) for a 90 min period of time. A noncollinear wave-mixing of subsurface longitudinal waves was used to char-acterize the limestone cladding samples with increasing lev-els of damage. It was observed that the use of angle wedgesto generate subsurface waves allows the use of noncollinearwave mixing to interrogate dimension stone claddings whenthere is only access to one side of the test sample. However,only the samples heated from 100°C to 400°C were testedusing the noncollinear mixing of two critically refractedlongitudinal waves, as the ultrasonic velocities of the spec-imens heated beyond 400°C were too low to able to generatecritically refracted longitudinal waves. To validate the cur-rent approach, the results of this study were comparedwith the results of a previous study66 in which the transducerswere incidentally mounted to the specimens. It was observedthat using the experimentally obtained critical angles as theincident angles is more accurate than using velocity measure-ments along with the Snell’s law to estimate the incidentangles, mainly because of material properties’ variationswithin the test samples. Using four-point bending tests, it
Fig. 9 Mean percent reduction in flexural strength (%) of heated sam-ples with respect to the mean flexural strength of the control sample.The flexural strength for each specimen was averaged from 5samples.
Fig. 10 The percent reduction in flexural strength (with respect to themean flexural strength of the control sample) as a function of the nor-malized nonlinear wave generation parameter. A power fit was fittedto the data (R2 ¼ 0.98). The error box for the control sample extendsbelow zero for the strength, which is an artifact of the normalizationprocess.
Fig. 11 The frequency ratio f 2∕f 1 at which the maximum scatteredwave amplitude occurred plotted as a function of the normalized non-linear wave generation parameter. A linear trend line was fit to thedata, R2 ¼ 0.89.
Optical Engineering 011012-10 January 2016 • Vol. 55(1)
McGovern and Reis: Damage characterization in dimension limestone cladding. . .
was observed that the samples exposed to 400°C and 600°Chad a strength reduction of 60% and 90%, respectively, whencompared with the strength of the virgin sample. It was alsoobserved that results from noncollinear wave mixingapproach correlate well (R2 ¼ 98%) with the destructivelyobtained percentage of strength reduction values.
AcknowledgmentsThe authors wish to thank Ms. Shari J. McGovern for pro-viding the limestone specimens. Her continued enthusiasmduring this study was appreciated. Dr. David Farrow’s assis-tance in the heating and flexural testing of the specimens wasgreatly appreciated.
References
1. M. Kuzvart, Industrial Minerals and Rocks, Vol. 18, Elsevier, NewYork (1984).
2. R. C. Freas, J. S. Hayden, and C. A. Pryor Jr, “Limestone and dolo-mite,” in Industrial Minerals and Rocks: Commodities, Markets, andUses, J. E. Kogel et al., Eds., 7th ed., pp. 581–597, Society for Mining,Metallurgy, and Exploration, Inc., Colorado (2006).
3. J. Ashurst and F. G. Dimes, Eds., Conservation of Building andDecorative Stone, Vol. 1, p. 19, John Butterworth-Heinemann,London, England (2000).
4. B. Fletcher, A History of Architecture, pp. 213–219, University ofLondon, Athone Press (1975).
5. M. J. Scheffler and D. S. Kneezel, “Testing of composite stone facedaluminum honeycomb panels,” in Dimension Stone Cladding: Design,Construction, Evaluation, and Repair, ASTM 1499, K. R. Hoigard andM. J. Scheffler, Eds., pp. 11–24, American Society for Testing andMaterials, West Conshohocken, Pennsylvania (2007).
6. I. R. Chin, “Common causes of failures of stone claddings onbuildings,” in Dimension Stone Cladding: Design, Construction,Evaluation, and Repair, ASTM 1394, K. R. Hoigard Ed., pp. 151–160,American Society for Testing and Materials, West Conshohocken,Pennsylvania (2000).
7. B. T. Lammert and K. R. Hoigard, “Material strength considerations indimension stone anchorage design,” in Dimension Stone Cladding:Design, Construction, Evaluation, and Repair, ASTM 1499, K. R.Hoigard and M. J. Scheffler, Eds., pp. 40–57, American Society forTesting and Materials, West Conshohocken, Pennsylvania (2007).
8. ASTM Standard C 1354, “Standard test method for strength of indi-vidual stone anchorages in dimension stone,” in Annual Book ofStandards, Vol. 4, No. 7, ASTM International, West Conshohocken,Pennsylvania (2001).
9. K. Conroy and K. R. Hoigard, “Stiffness considerations in dimensionstone anchorage design,” in Dimension Stone Cladding: Design,Construction, Evaluation, and Repair, ASTM 1499, K. R. Hoigardand M. J. Scheffler, Eds., pp. 58–68, American Society for Testingand Materials, West Conshohocken, Pennsylvania (2007).
10. ASTM Standard E 2128-01, “Standard guide for evaluating water leak-age of building walls,” in Annual Book of Standards, ASTMInternational, West Conshohocken, Pennsylvania (2001).
11. S. G. Naggatz and E. A. Gerns, “Full-scale flexural strength testing forstone cladding design,” in Dimension Stone Cladding: Design,Construction, Evaluation, and Repair, ASTM 1499, K. R. Hoigardand M. J. Scheffler, Eds., pp. 3–10, American Society for Testingand Materials, West Conshohocken, Pennsylvania (2007).
12. ASTM Standard C 880-06, “Standard test method for flexure strengthof dimension stone,” in Annual Book of Standards, Vol. 4.07, ASTMInternational, West Conshohocken, Pennsylvania (2007).
13. ASTM Standard C 170, “Standard test method for compressivestrength in natural building stone,” in Annual Book of Standards,Vol. 15.06, ASTM International, West Conshohocken, Pennsylvania(2001).
14. ASTM Standard C 99, “Standard test method for modulus of rupture innatural building stone,” in Annual Book of Standards, Vol. 15.06,ASTM International, West Conshohocken, Pennsylvania (2001).
15. ASTM Standard C 1201, “Standard test method for structural perfor-mance of exterior dimension stone cladding systems by uniform staticair pressure difference,” in Annual Book of Standards, Vol. 4, No. 7,ASTM International, West Conshohocken, Pennsylvania (2001).
16. Proc. Seminar on Recladding of the Amoco Building in Chicago,Chicago Committee on High Rise Buildings, Chicago, Illinois,Report No. 15, pp. 3–5 (1995).
17. B. Schouenborg, B. Grelk, and K. Malage, “Testing and assessment ofmarble and limestone (TEAM)—important results from a largeEuropean research project on cladding panels,” in Dimension StoneCladding: Design, Construction, Evaluation, and Repair, ASTM1499, K. R. Hoigard and M. J. Scheffler, Eds., pp. 124–137,
American Society for Testing and Materials, West Conshohocken,Pennsylvania (2007).
18. J. J. Feddema and T. C. Meierding, “Marble weathering and airpollution in Philadelphia,” Atmos. Environ. 21(1), 143–157 (1987).
19. R. U. Cooke, “Using gravestones to assess changing rates of weath-ering in the United Kingdom,” Earth Surf. Processes Landforms 20,531–54 (1995).
20. S. Y. Srinivas, “Weathering rates of marble in laboratory and outdoorconditions,” J. Environ. Eng. 122(9), 856–863 (1996).
21. D.W. Kessler, “Physical and chemical tests on the commercial marblesof the United States,” in Technological Papers of the Bureau ofStandards, No. 123, National Institute of Standards andTechnology, Gaithersburg, Maryland (1919).
22. W.-D. Grimm, “Observations of reflections on the deformation of mar-ble objects cause by structural breaking up,” Z. Dtsch. Geol. Ges.150(2), 195–235 (1999).
23. E. M. Winkler, “Buttress expansion in granite rocks in the field and onbuildings,” in Proc. 4th Int. Kolloquium Werkstoffwissenschaften andBauinstandsetzen, pp. 537–542, Technical Academy of Esslingen,Fraunhofer IRB Verlag (1999).
24. A.Mauco et al., “Deterioration of thegranodeorite natural stone façade—case example Maximarket, Ljubljana,” RMZ Mater. Geoenviron. 53(1),23–37 (2006).
25. TEAM, “Testing and assessment of marble and limestone,” FinalTechnical Report, EC-Project: TEAM-G5RD-CT-2000-00233 (2005).
26. J. H. Cantrel and H. Salama, “Acoustoelastic characterization of mate-rials,” Int. Mater. Rev. 36, 125–145 (1991).
27. J. H. Cantrel and W. T. Yost, “Nonlinear ultrasonic characterization offatigue microstructures,” Int. J. Fatigue 23, 487–490 (2001).
28. J. Kim et al., “Experimental characterization of fatigue damagein nickel-base super alloy using nonlinear ultrasonic waves,”J. Acoust. Soc. Am. 120, 1266–1273 (2006).
29. C. Pruell et al., “Evaluation of plasticity driven material damage usinglamb waves,” Appl. Phys. Lett. 91, 231911 (2007).
30. F. D. Murnaghan, Finite Deformation of an Elastic Solid, John Wiley& Sons, Inc., New York (1951).
31. L. D. Landau and E. M. Lifshitz, Eds., Theory of Elasticity, 2nd ed,Pergamon Press, New York (1970).
32. Z. A. Gol’dberg, “Interaction of plane longitudinal and transverse elas-tic waves,” Sov. Phys. Acoust. 6(3), 306–310 (1960).
33. G. L. Jones and D. R. Kobett, “Interaction of elastic waves in an iso-tropic solid,” J. Acoust. Soc. Am. 35(1), 5–10 (1963).
34. P.A. Johnson et al., “Nonlinear generation of elastic waves in crystal-line rock,” J. Geophys. Res. 92(B5), 3597–3602 (1987).
35. P. A. Johnson and T. J. Shankland, “Nonlinear generation of elasticwaves in granite and sandstone: continuous wave and travel timeobservations,” J. Geophys. Res. 94(B12), 17729–17733 (1989).
36. L. H. Taylor and F. R. Rollins, “Ultrasonic study of three-phonon inter-actions. I. Theory,” Phys. Rev. 136(3A), A591–A596 (1964).
37. F. R. Rollins, L. H. Taylor, and P. H. Todd, “Ultrasonic study of three-phonon interactions. II. Experimental results,” Phys. Rev. 136(3A),A597–A601 (1964).
38. A. J. Croxford et al., “The use of non-collinear mixing for nonlinearultrasonic detection of plasticity and fatigue,” J. Acoust. Soc. Am.126(5), EL117–EL122 (2009).
39. A. Demcenko et al., “Non-collinear wave mixing for nonlinear ultra-sonic detection of physical aging in PVC,” NDT & E Int. 49, 34–39(2012).
40. F. R. Rollins, “Phonon interactions and ultrasonic frequencies,” Proc.IEEE 53(10), 1534–1539 (1965).
41. R. W. Dunham and H. B. Huntington, “Ultrasonic beam mixing as ameasure of the nonlinear parameters of fused silica and single-crystalNaCl,” Phys. Rev. 2(4), 1098–1107 (1970).
42. K. L. Zarembo and V. A. Krasil’nikov, “Nonlinear phenomena in thepropagation of elastic waves in solids,” Sov. Phys. 13(6), 778–797(1971).
43. P. B. Nagy, “Fatigue damage assessment by nonlinear ultrasonic mate-rials characterization,” Ultrasonics 36, 375–381 (1998).
44. R. A. Guyer and P. A. Johnson, Nonlinear Mesoscopic Elasticity: TheComplex Behavior of Granular Media Including Rocks and Soil,Wiley, Weinheim (2009).
45. R. A. Guyer and P. A. Johnson, “Nonlinear mesoscopic elasticity: evi-dence for a new class of materials,” Phys. Today 52(4), 30–36 (1999).
46. B. F. Miglio et al., “Assessment of the durability of porous limestones:specification and interpretation of test data in UK practice,” inDimension Stone Cladding: Design, Construction, Evaluation, andRepair, ASTM STP 1394, K. R. Hoigard, Ed., ASTM, W.Conshohocken, Pennsylvania (2000).
47. P. A. Johnson, B. Zinszner, and P. N. J. Rasolofosaon, “Resonance andelastic nonlinear phenomena in rock,” J. Geophys. Res. 101(B5),11553–11564 (1996).
48. E. Franzoni et al., “Artificial weathering of stone by heating,”J. Culture Heritage 14S, e85–e93 (2013).
49. E. Sassoni, S. Naidu, and G. W. Scherer “The use of hydroxyapatiteas a new inorganic consolidant for damaged carbonated stones,”J. Culture Heritage 12, 346–355 (2011).
Optical Engineering 011012-11 January 2016 • Vol. 55(1)
McGovern and Reis: Damage characterization in dimension limestone cladding. . .
50. G. S. Kumar, A. Ramakrishnan, and Y.-T. Hung, “Lime calcination,” inAdvanced Physicochecmial Treatment Technologies Handbook ofEnvironmental Engineering, L. K Wang, Y.-T. Hung, and N. K.Shammas, Eds., Vol. 5, pp. 611–633, Humana Press, New Jersey(2007).
51. H. T. S. Britton, S. J. Gregg, and G. W. Winsor, “The calcination ofdolomite: part II. The thermal decomposition of dolomite,” Trans.Faraday Soc. 48, 70–75 (1952).
52. S. Siegesmund et al., “Physical weathering of marbles caused by aniso-tropic thermal expansion,” Int. J. Earth Sci. 89, 170–182 (2000).
53. J. M. Logan, “Laboratory and case studies of thermal cycling andstored strain on the stability of selected marbles,” Environ. Geol.46, 456–467 (2004).
54. G. Royer-Carfagni, “Some considerations on the warping of marblefacades: the example of Alvar Aalto’s Finland Hall in Helsinki,”Constr. Build. Mater. 13, 449–457 (1999).
55. A. M. Ferrero, M. Migliazza, and A. Spagnoli, “Theoretical modellingof bowing in cracked marble slabs under cyclic thermal loading,”Constr. Build. Mater. 23, 2151–2159 (2009).
56. S. Chatterji, “Aspects of generation of destructive crystal growthpressure,” J. Cryst. Growth 277, 566–577 (2005).
57. V. Shushakova, E. R. Fuller, Jr., and S. Siegesmund, “Influence ofshape fabric and crystal texture on marble degradation phenomena:simulations,” Environ. Earth Sci. 63, 1587–1601 (2011).
58. S. Chaki, M. Takarli, and W. P. Agbodjan, “Influence of thermal dam-age on physical properties of a granite rock: porosity, permeability andultrasonic wave evolutions,” Constr. Build. Mater. 22, 1456–1461(2008).
59. European Standard EN 13919, Natural Stone Test Methods–Determination of Resistance to Ageing by SO2 Action in the Presenceof Humidity (2004).
60. European Standard EN 12370, Natural Stone Test Methods–Determination of Resistance to Salt Crystallization (2001).
61. European Standard EN 12371, Natural Stone Test Methods–Determination of Frost Resistance (2010).
62. European Standard EN 14066, Natural Stone Test Methods–Determination of Resistance to Ageing by Thermal Shock (2004).
63. D. T. Nicholson, “Pore properties as indicators of breakdownmechanisms in experimentally weathered limestones,” Earth Surf.Processes and Landforms 26, 819–838 (2001).
64. H. Yavuz, “Effect of freeze-thaw and thermal shock weathering on thephysical and mechanical properties of an andesite stone,” Bull. Eng.Geol. Environ. 70, 187–192 (2011).
65. J. Martinez-Martinez, D. Benavente, and M. A. Garcia-del-Cura,“Spatial attenuation: the most sensitive ultrasonic parameter fordetecting petrographic features and decay processes in carbonaterocks,” Eng. Geol. 119, 84–95 (2011).
66. M.E. McGovern and H. Reis, “Linear and nonlinear characterization oflimestone,” Proc. SPIE 9064, 906404(2014).
67. D. E. Bray and R. K. Stanley, Nondestructive Evaluation—A Toolin Design, Manufacturing, and Service, CRC Press, New York(1997).
68. L. E. Kinsler et al., Fundamentals of Acoustics, 3rd ed., John Wiley &Sons, New York (1984).
69. J. Couchman, B. Yee, and F. Chang, “Energy partitioning of ultrasonicwaves beyond the critical angle flat boundaries,” Ultrasonics 12(2),69–71 (1974).
70. M. Breazeale and L. Bjorno, “Forward and backward displacement ofultrasonic waves reflected from a water-sediment interface,” in Proc.Ultrasonics Intern 1977, pp. 440–447, IPC Science and TechnologyPress (1977).
71. J. Couchman and J. Bell, “Prediction, detection, and characterizationof a fast surface wave produced near the first critical angle,”Ultrasonics 16(6), 272–274 (1978).
72. L. Basatskaya and I. Ermolov, “Theoretical study of ultrasonic longi-tudinal subsurface waves in solid media,” Sov. J. Nondestr. Test. 16,524–530 (1981).
73. A. Pilarski and J. Rose, “Utility of subsurface longitudinal waves incomposite material characterization,” Ultrasonics 27, 226–233 (1989).
74. K. Langenberg, P. Fellinger, and R. Marklein, “On the nature of the so-called subsurface longitudinal wave and/or the subsurface longitudinal‘creeping’ wave,” Res. Nondestr. Eval. 2, 59–81 (1990).
75. P. Junghans and D. Bray, “Beam characteristics of high angle longi-tudinal wave probes,” in NDE: Applications, Advanced Methods, andCodes and Standards, R. N. Pangborn, Ed., Proc. Pressure Vesselsand Piping Conference, Vol. 216 of PVP, Vol. 9 of NDE, pp. 39–44,ASME (1991).
76. T. Leon-Salamanca and D. Bray, “Residual stress measurement in steelplates and welds using critically refracted longitudinal (LCR) waves,”Res.Nondestr. Eval. 7, 169–184 (1996).
77. D. Bray and M. Dietrich, “Stress evaluation in high speed rotatingmachinery with the lcr ultrasonic technique,” in Proc. 26th TurboMachinery Symp., pp. 143–149 (1997).
78. D. Bray and W. Tang, “Subsurface stress evaluation in steel plates andbars using the LCR ultrasonic wave,” Nucl. Eng. Des. 207, 231–240(2001).
79. S. Chaki, W. Ke, and H. Demouveau, “Numerical and experimentalanalysis of the critically refracted longitudinal beam,” Ultrasonics53, 65–69 (2013).
Megan McGovern is a doctoral student affiliated with the Departmentof Industrial and Enterprise Systems Engineering at the University ofIllinois at Urbana-Champaign. Her main research interests are in non-destructive testing and evaluation of materials and structures, materi-als characterization, and structural health monitoring.
Henrique Reis is affiliated with the Department of Industrial andEnterprise Systems Engineering at the University of Illinois atUrbana-Champaign. His main research interests are in nondestruc-tive testing and evaluation of materials and structures, materials char-acterization, and structural health monitoring.
Optical Engineering 011012-12 January 2016 • Vol. 55(1)
McGovern and Reis: Damage characterization in dimension limestone cladding. . .


