Damage Investigation of a Tunnel Subjected to an Unplanned Surface Load Through Non-Linear Analysis Oriol Arnau, Researcher; Climent Molins, Assoc. Prof.; Antonio Marí, Prof., Department of Civil and Environmental Engineering, Universitat Politecnica de Catalunya, Barcelona, Spain. Contact: [email protected]DOI: 10.2749/sei.1362 Abstract A description of the deformations and damage that occurred in a segmental tunnel lining as a consequence of an unplanned surface load is presented, as well as the numerical analyses per- formed for its safety assessment. The tunnel in study is located in soft soil conditions and presents a low overbur- den. Few months after tunnel drilling, a new bridge was constructed at surface level, placing an access embankment over the tunnel path. Monitoring points were installed along the affected section which recorded the deformation of the tunnel caused by the embank- ment weight. More worryingly, despite no additional loads were introduced, the deformation of the lining continued increasing significantly along the next months, indicating the existence of soil consolidation phenomena. As a conse- quence, structural cracks emerged along the affected section. Non-linear finite element models that realistically simu- late the behaviour of the non-linear segment joints and the concrete crack- ing were used to characterize the actual response and strength of the lining. The results showed that most significant damages should occur at the non-visible extrados side, and characterized how they evolve along the soil consolidation process. Finally, the adopted tunnel strengthening procedure is described. Keywords: forensic engineering; segmental tunnel lining; soft soil; structural damage; non-linear analysis; soil–structure interaction; structural strengthening. Introduction When an abnormal response or a damage is detected in a structure it is of paramount importance to deter- mine the causes and the possible implications. Moreover, it is essential to answer key questions such as: whether the situation is stabilized or still evolving, if there exists a real risk of collapse and whether exceptional measures have to be taken in order to assure the structural stability. The engineering approach for finding an appropriate response to these essential questions can be based on the analysis of the sensors data that reported the irregular response and/or the observed damage. Usually, an additional and more specific monitor- ing set-up is placed in the affected zone, about which recorded data could lead to a better explanation and determination of the problem. But, depending on the type or configura- tion of the affected structure, it could exist in several parts that are not visi- ble or cannot be inspected, thus mak- ing impossible to adequately define the actual state of the structure. This situation is common in underground structures where it is not possible to directly evaluate the state of the extrados on direct contact with the ground, or in flooded structures in which service cannot be 100% inter- rupted like sewage tunnels or dams. Therefore, in these cases it would be necessary to estimate the possible damages in the un-surveyed zones in order to appropriately assess the actual state of the structure. The interest of obtaining the maximum possible information is clear: a better knowledge about the causes for the abnormal response and a more com- plete definition of the actual situation in terms of damage would allow taking more appropriate decisions about the necessity and urgency of structural interventions. Moreover, better suited interventions could be proposed in order to solve the disorder. Nowadays, modern modelling techni- ques can be used to study and compre- hend the complex response of underground structures, to determine the causes of the problem, and to esti- mate the damage at non-visible sides. Advanced non-linear finite element models allow to realistically reproduce the main phenomena involved in the actual response of the structures, being capable of considering the cracking and plasticity of reinforced concrete, the response of the joints between different members, or the influence of the soil– structure interaction. Consequently, they can be used to simulate complex damage processes, evaluate the stress redistributions, estimate the actual state and the remaining capacity of the structure, and to adequately design intervention or retrofitting processes. Additionally, their repeatability permits easy analysis of different sce- narios and conditions, allowing to determine the most influencing para- meters, or to test different parameter values in order to cover possible uncer- tainties (materials, loads, etc.). This paper presents the study and analysis of a Barcelona L9 tunnel section that presented significant movements that originated following the placement of a new bridge embankment on (Fig. 1). Initial defor- mation measurements continuously became larger over time despite no other loads were introduced on the surface, indicating a soil consolidation phenomenon. Consequently, large deformations were experienced by the segmental tunnel lining, also present- ing significant cracking at the intrados of the tunnel. The situation at the time of study is initially exposed, and the movements and damages registered are then described. Later, two- dimensional (2D) non-linear numeri- cal models that appropriately consid- ered the joints, the soil–structure interaction, and the inelastic response of constituent materials, are defined in order to reproduce the structural response of the segmental rings at the damaged section. Actual measure- ments and damage observations are used to validate the adopted model- ling strategies and values. Numerical model results are presented and dis- cussed, showing how they can contrib- ute towards comprehending the causes of damages and the main gov- erning mechanisms, to characterize Peer-reviewed by international ex- perts and accepted for publication by SEI Editorial Board Paper received: August 8, 2016 Paper accepted: December 16, 2016 Structural Engineering International Nr. 3/2017 Technical Report 1
Transcript
Damage Investigation of a Tunnel Subjected to anUnplanned Surface Load Through Non-Linear AnalysisOriol Arnau, Researcher; Climent Molins, Assoc. Prof.; Antonio Marí, Prof., Department of Civil and Environmental
Engineering, Universitat Politecnica de Catalunya, Barcelona, Spain. Contact: [email protected]
DOI: 10.2749/sei.1362
Abstract
A description of the deformations anddamage that occurred in a segmentaltunnel lining as a consequence of anunplanned surface load is presented, aswell as the numerical analyses per-formed for its safety assessment. Thetunnel in study is located in soft soilconditions and presents a low overbur-den. Few months after tunnel drilling, anew bridge was constructed at surfacelevel, placing an access embankmentover the tunnel path. Monitoring pointswere installed along the affectedsection which recorded the deformationof the tunnel caused by the embank-ment weight. More worryingly, despiteno additional loads were introduced,the deformation of the lining continuedincreasing significantly along the nextmonths, indicating the existence of soilconsolidation phenomena. As a conse-quence, structural cracks emerged alongthe affected section. Non-linear finiteelement models that realistically simu-late the behaviour of the non-linearsegment joints and the concrete crack-ing were used to characterize the actualresponse and strength of the lining. Theresults showed that most significantdamages should occur at the non-visibleextrados side, and characterized howthey evolve along the soil consolidationprocess. Finally, the adopted tunnelstrengthening procedure is described.
When an abnormal response or adamage is detected in a structure it isof paramount importance to deter-mine the causes and the possible
implications. Moreover, it is essentialto answer key questions such as:whether the situation is stabilized orstill evolving, if there exists a real riskof collapse and whether exceptionalmeasures have to be taken in order toassure the structural stability.
The engineering approach for findingan appropriate response to theseessential questions can be based onthe analysis of the sensors data thatreported the irregular response and/orthe observed damage. Usually, anadditional and more specific monitor-ing set-up is placed in the affectedzone, about which recorded datacould lead to a better explanation anddetermination of the problem. But,depending on the type or configura-tion of the affected structure, it couldexist in several parts that are not visi-ble or cannot be inspected, thus mak-ing impossible to adequately definethe actual state of the structure. Thissituation is common in undergroundstructures where it is not possible todirectly evaluate the state of theextrados on direct contact with theground, or in flooded structures inwhich service cannot be 100% inter-rupted like sewage tunnels or dams.Therefore, in these cases it would benecessary to estimate the possibledamages in the un-surveyed zones inorder to appropriately assess theactual state of the structure.
The interest of obtaining the maximumpossible information is clear: a betterknowledge about the causes for theabnormal response and a more com-plete definition of the actual situationin terms of damage would allow takingmore appropriate decisions about thenecessity and urgency of structuralinterventions. Moreover, better suitedinterventions could be proposed inorder to solve the disorder.
Nowadays, modern modelling techni-ques can be used to study and compre-hend the complex response ofunderground structures, to determinethe causes of the problem, and to esti-mate the damage at non-visible sides.Advanced non-linear finite element
models allow to realistically reproducethe main phenomena involved in theactual response of the structures, beingcapable of considering the cracking andplasticity of reinforced concrete, theresponse of the joints between differentmembers, or the influence of the soil–structure interaction. Consequently,they can be used to simulate complexdamage processes, evaluate the stressredistributions, estimate the actualstate and the remaining capacity of thestructure, and to adequately designintervention or retrofitting processes.Additionally, their repeatabilitypermits easy analysis of different sce-narios and conditions, allowing todetermine the most influencing para-meters, or to test different parametervalues in order to cover possible uncer-tainties (materials, loads, etc.).
This paper presents the study andanalysis of a Barcelona L9 tunnelsection that presented significantmovements that originated followingthe placement of a new bridgeembankment on (Fig. 1). Initial defor-mation measurements continuouslybecame larger over time despite noother loads were introduced on thesurface, indicating a soil consolidationphenomenon. Consequently, largedeformations were experienced by thesegmental tunnel lining, also present-ing significant cracking at the intradosof the tunnel. The situation at the timeof study is initially exposed, and themovements and damages registeredare then described. Later, two-dimensional (2D) non-linear numeri-cal models that appropriately consid-ered the joints, the soil–structureinteraction, and the inelastic responseof constituent materials, are defined inorder to reproduce the structuralresponse of the segmental rings at thedamaged section. Actual measure-ments and damage observations areused to validate the adopted model-ling strategies and values. Numericalmodel results are presented and dis-cussed, showing how they can contrib-ute towards comprehending thecauses of damages and the main gov-erning mechanisms, to characterize
Peer-reviewed by international ex-perts and accepted for publicationby SEI Editorial Board
Paper received: August 8, 2016Paper accepted: December 16, 2016
Structural Engineering International Nr. 3/2017 Technical Report 1
OArnauD
Texto insertado
the tunnel surface
the actual state of the lining, and toestimate the damages at the non-visi-ble extrados side. Finally, the adoptedtunnel strengthening procedure isdescribed, and main conclusions arepresented.
Case Study
The studied section is located at Bar-celona’s Line 9 metro tunnel. The tun-nel was constructed by means of atunnel boring machine (TBM) andpresents an internal diameter of8.43 m. A 320 mm thick precast con-crete segmental tunnel lining was usedas a unique resisting structure, whichwas composed by six conventionalsegments plus one key segment. Theconstruction of the tunnel was finishedwithout remarkable incidences.
Few months after the tunnel drilling,a new road was planned in the casestudy zone, including a new bridgeand a new access from an existentroad. As it can be observed in Fig. 1,this new infrastructure implied theplacement of embankments over thetunnel path, which achieved a maxi-mum height of around 7 m over theoriginal level at the bridge access.
At the studied section, the tunnel runsthrough a geological layer of silt andclay (QL3), presenting an averagedepth of 25 to 30 m (see Fig. 1). Thetop of the tunnel is placed at the inter-face to a sand layer (QL2), which is pre-ceded by a thin silt–clay layer (QL1)and an initial fill layer (F). The totaloriginal overburden of the tunnel wasaround 15.3 m, whilst the groundwater
table was located at 4 m depth. Thebasic properties of the soil layers arelisted in Table 1.
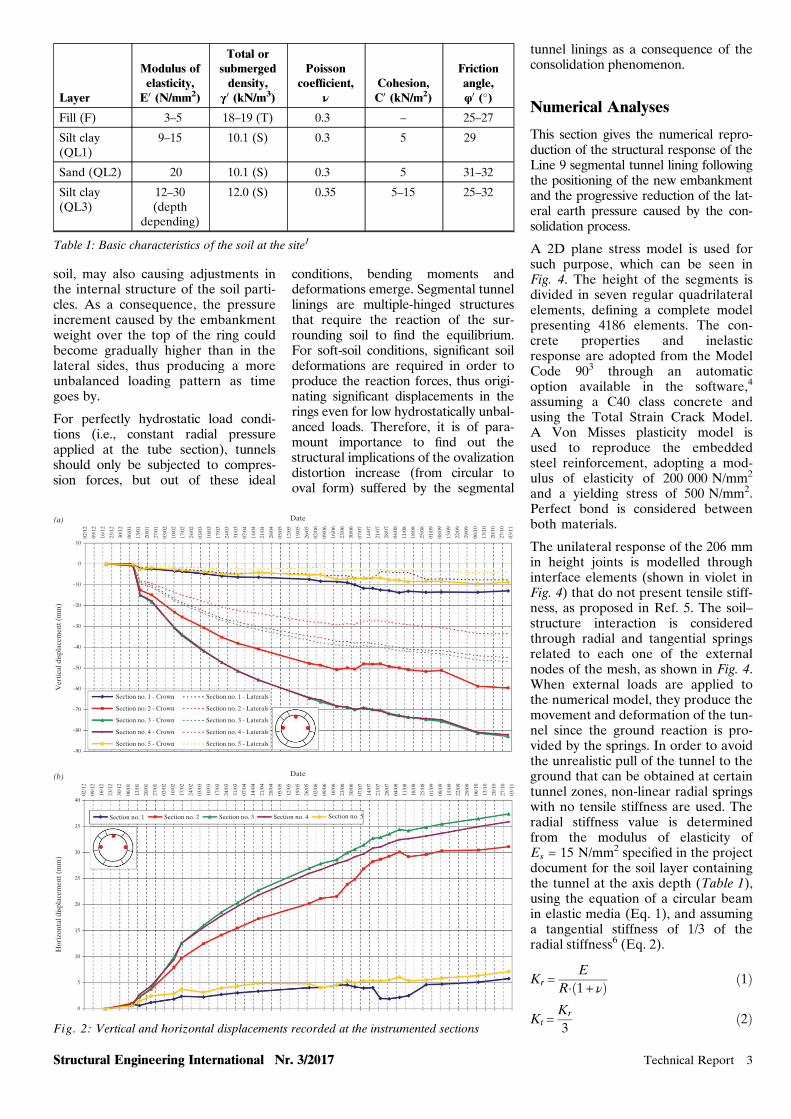
In order to record the movements ofthe tunnel during the embankmentsconstruction, five different sectionswere initially instrumented by meansof three topographic prisms (sectionsS1 to S5 in Fig. 1), located around thecrown and at the mid-height point ofthe tunnel (see Fig. 2 indicators). Themonitoring process started on 18December 2008 and the embankmentswere erected in January 2009 (as seenin Fig. 2). Two more prisms wereadded to the bottom part of the moni-tored sections (starting at 19 March2009) in order to obtain a more com-plete information about the increasingdeformation of the lining.
Displacement records clearly showedthat, despite no further loads wereapplied on the surface, the deformationof the lining was continuously increasingin the following months. As can beobserved in Fig. 2a, maximum verticalcrown movements increased fromaround 18 mm at the time of end of con-struction to above 80 mm 8 months later,thus defining an increase of over 300%in the lining deformation without per-forming any action. Slightly higher defor-mation increments were observed in thelateral deformation (Fig. 2b), increasingfrom around 4 mm to over 35 mm, anddefining an increment above 700%.
The segmental tunnel lining presenteda significant cracking at the crownintrados, as can be observed in Fig. 3for the rings compressed between the
instrumented sections S3 and S4 (seeFig. 1). Maximum crack widths werealways registered at the sectionsweakened by the lifting and groutingholes of the segments (indicated withcircles in Fig. 3), achieving a maxi-mum of 1 mm at ring 237 (the crackruns across the whole segment in thelongitudinal direction of the tunnel).Along the complete sections, crackwidths of 0.1 and 0.2 mm systemati-cally appeared, achieving 0.3 mmwidth in the majority of the ringsalong the affected zone (see rings232 and 235 in Fig. 3 as example).The maximum value registered at acomplete section was around 0.5 mm,as can be observed at the crown cen-tral part of ring 235 (Fig. 3).
The crack patterns registered alsoshowed different intensities andlocation depending on the position ofthe longitudinal joints, thus indicatinga clear influence of the ring configura-tion in the damage generation.
Studies performed by local geologicalspecialists indicated that the most fea-sible cause for the long-term deforma-tions experienced by the lining couldbe found in a consolidation phenome-non experimented by the soil, sinceno significant additional loads wereplaced at the surface. According tothe consolidation principle, when asaturated stratum like clayey soil issubjected to a stress increase (likethe one caused by the embankmentweight, or by the tunnel’s own defor-mation), the excess of pore waterpressure is slowly dissipated due tothe relatively low permeability of the
S1
9.07
8.43
11
1.3
40–
7
Tun
nel
Tun
nel
S2
Newembankments
QL1
QL2
QL3
Tunnel
S3
S4 New bridge
Existent r
oad
S5
Fig. 1: Description of the case study: top view and soil section (Unit: m)
2 Technical Report Structural Engineering International Nr. 3/2017
soil, may also causing adjustments inthe internal structure of the soil parti-cles. As a consequence, the pressureincrement caused by the embankmentweight over the top of the ring couldbecome gradually higher than in thelateral sides, thus producing a moreunbalanced loading pattern as timegoes by.
For perfectly hydrostatic load condi-tions (i.e., constant radial pressureapplied at the tube section), tunnelsshould only be subjected to compres-sion forces, but out of these ideal
conditions, bending moments anddeformations emerge. Segmental tunnellinings are multiple-hinged structuresthat require the reaction of the sur-rounding soil to find the equilibrium.For soft-soil conditions, significant soildeformations are required in order toproduce the reaction forces, thus origi-nating significant displacements in therings even for low hydrostatically unbal-anced loads. Therefore, it is of para-mount importance to find out thestructural implications of the ovalizationdistortion increase (from circular tooval form) suffered by the segmental
tunnel linings as a consequence of theconsolidation phenomenon.
Numerical Analyses
This section gives the numerical repro-duction of the structural response of theLine 9 segmental tunnel lining followingthe positioning of the new embankmentand the progressive reduction of the lat-eral earth pressure caused by the con-solidation process.
A 2D plane stress model is used forsuch purpose, which can be seen inFig. 4. The height of the segments isdivided in seven regular quadrilateralelements, defining a complete modelpresenting 4186 elements. The con-crete properties and inelasticresponse are adopted from the ModelCode 903 through an automaticoption available in the software,4
assuming a C40 class concrete andusing the Total Strain Crack Model.A Von Misses plasticity model isused to reproduce the embeddedsteel reinforcement, adopting a mod-ulus of elasticity of 200 000 N/mm2
and a yielding stress of 500 N/mm2.Perfect bond is considered betweenboth materials.
The unilateral response of the 206 mmin height joints is modelled throughinterface elements (shown in violet inFig. 4) that do not present tensile stiff-ness, as proposed in Ref. 5. The soil–structure interaction is consideredthrough radial and tangential springsrelated to each one of the externalnodes of the mesh, as shown in Fig. 4.When external loads are applied tothe numerical model, they produce themovement and deformation of the tun-nel since the ground reaction is pro-vided by the springs. In order to avoidthe unrealistic pull of the tunnel to theground that can be obtained at certaintunnel zones, non-linear radial springswith no tensile stiffness are used. Theradial stiffness value is determinedfrom the modulus of elasticity ofEs = 15 N/mm2 specified in the projectdocument for the soil layer containingthe tunnel at the axis depth (Table 1),using the equation of a circular beamin elastic media (Eq. 1), and assuminga tangential stiffness of 1/3 of theradial stiffness6 (Eq. 2).
Kr =E
R� 1 + νð Þ ð1Þ
Kt =Kr
3ð2Þ
Layer
Modulus ofelasticity,
E0 (N/mm2)
Total orsubmergeddensity,
γ0 (kN/m3)
Poissoncoefficient,
νCohesion,C0 (kN/m2)
Frictionangle,φ0 (�)
Fill (F) 3–5 18–19 (T) 0.3 – 25–27
Silt clay(QL1)
9–15 10.1 (S) 0.3 5 29
Sand (QL2) 20 10.1 (S) 0.3 5 31–32
Silt clay(QL3)
12–30(depth
depending)
12.0 (S) 0.35 5–15 25–32
Table 1: Basic characteristics of the soil at the site1
Fig. 2: Vertical and horizontal displacements recorded at the instrumented sections
Structural Engineering International Nr. 3/2017 Technical Report 3
In the absence of experimental evi-dences of the actual soil and waterpressures acting on the studied tunnelsection, the initial loading of the ringwas determined according to theground section and characteristics pre-sented in Fig. 1 and Table 1, respec-tively. The calculated vertical andhorizontal soil pressures are introducedin the model through nodal forcesapplied at the outer surface of the tun-nel. The original conditions are intro-duced in the first load step, whilst thepressure created by the embankment is
applied later. The initial lateral pres-sure produced by the embankment isdetermined by using a lateral earthpressure value of K0 = 0.58, associatedto a 25� friction angle soil. To repro-duce the ground consolidation phe-nomenon, the K0 applied to theembankment vertical load is progres-sively reduced up to 0, according towhat has been called “fictitious lateralearth pressure coefficient” (K0f). Theanalyses are performed in a finite ele-ments software, using a regular New-ton Raphson iterative procedure with a
convergence criterion of 0.05% inenergy.
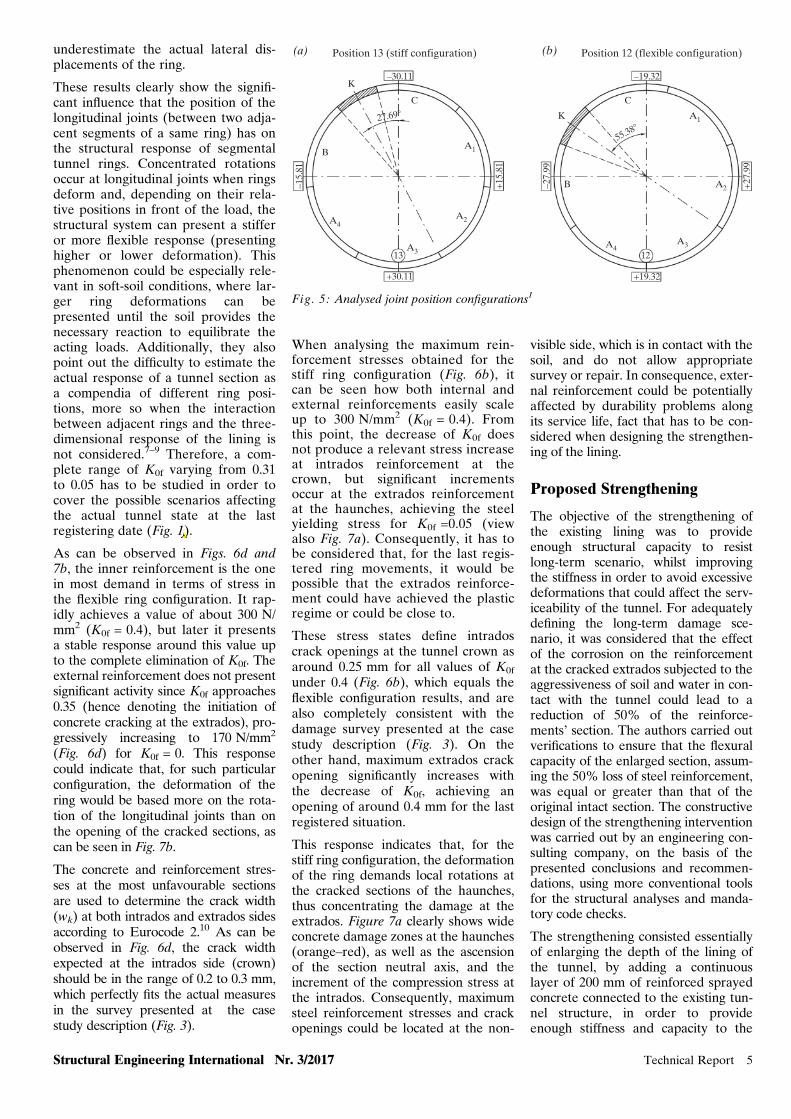
According to the definition of univer-sal ring type used in this section ofLine 9 tunnel, the ring presents a cer-tain conical form that producesvariable width of the ring. This geom-etry allows defining the tracking ofthe tunnel by modifying the relativeposition between the rings. In thisparticular case, 13 different ring place-ments are possible in order to createturns and depth variations. This origi-nates different possibilities of jointlocations in respect of the load posi-tion, as it can be observed in Fig. 5.Joints present a significant influencein the structural response of segmen-tal tunnel lings and, therefore, differ-ent structural responses can bepresented for different joint positions.A numerical study using linear mate-rial properties was carried out overthe most common configurations pre-sented along the damaged section.Position 13 (Fig. 5a) emerged as thejoint position configuration that repre-sents a stiffer response of the ring,thus providing the smallest displace-ments but the highest bending forces.Position 12 (Fig. 5b) behaves in theopposite way, thus defining the mostflexible option for the same loading.Consequently, non-linear analyseswere performed over both configura-tions in order to cover a wide range ofpossible responses.
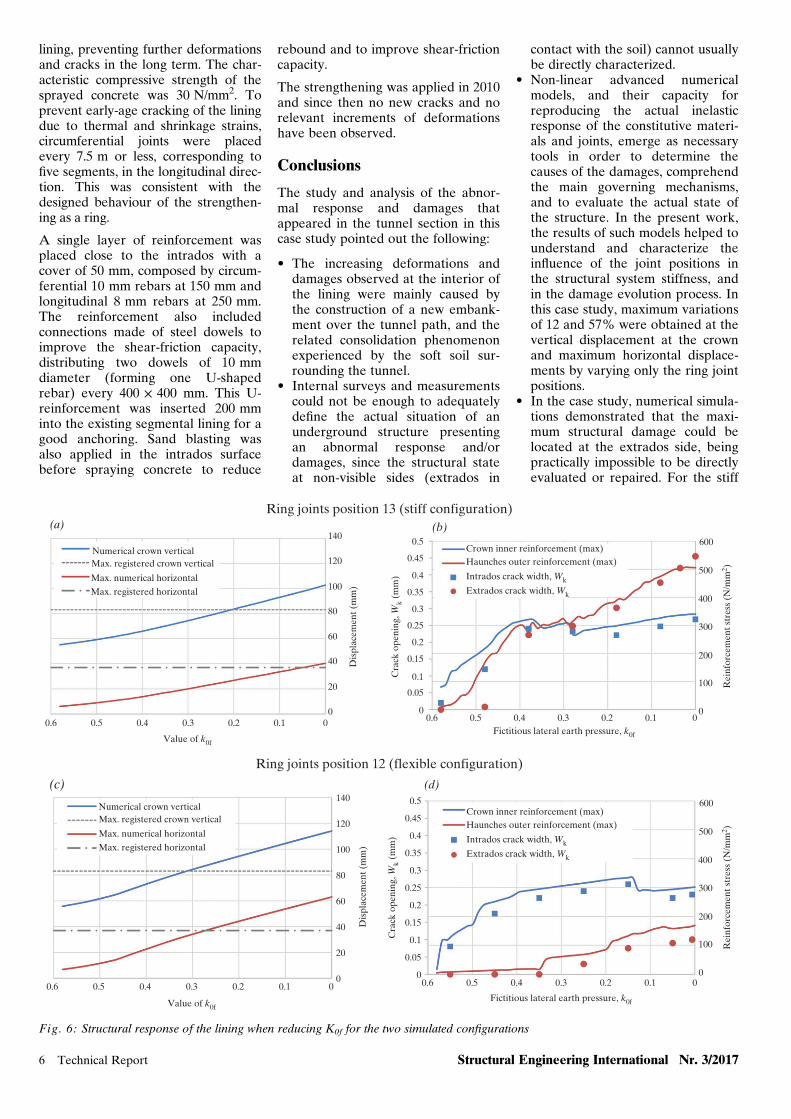
Figure 6a and c presents the verticaldisplacement at the crown and themaximum horizontal displacementnumerically obtained for jointpositions 13 and 12 (Fig. 5) whenreducing K0f. As can be observed, ringjoint position 12 presents a more flexi-ble response to the applied load thanposition 13, increasing 12% thevertical displacement at the crown(114 mm in front of 102 mm) and57% the maximum horizontal dis-placement (63 mm in front of40 mm) when K0f turns 0. Conse-quently, for the stiff ring configura-tion (Fig. 6a), the registered verticaldisplacement at the crown (Fig. 2)would be achieved at K0f = 0.2,whilst maximum horizontal displace-ment at K0f = 0.05. For the flexibleconfiguration (Fig. 6b), these pointsare found at K0f = 0.31 and K0f = 0.27respectively, thus indicating that theproposed load configuration forreproducing the complex consolida-tion phenomenon tends to slightly
Ring 238
Ring 237
Ring 236
Ring 235
Ring 234
Ring 233
Ring 232
Section 3
Section 4
Fig. 3: Survey of cracking of the rings between instrumented sections S3 and S42
Interfaceelements
Kr
Kt
Fig. 4: Segmental ring: numerical model
4 Technical Report Structural Engineering International Nr. 3/2017
OArnauD
Tachado
OArnauD
Texto insertado
c
underestimate the actual lateral dis-placements of the ring.
These results clearly show the signifi-cant influence that the position of thelongitudinal joints (between two adja-cent segments of a same ring) has onthe structural response of segmentaltunnel rings. Concentrated rotationsoccur at longitudinal joints when ringsdeform and, depending on their rela-tive positions in front of the load, thestructural system can present a stifferor more flexible response (presentinghigher or lower deformation). Thisphenomenon could be especially rele-vant in soft-soil conditions, where lar-ger ring deformations can bepresented until the soil provides thenecessary reaction to equilibrate theacting loads. Additionally, they alsopoint out the difficulty to estimate theactual response of a tunnel section asa compendia of different ring posi-tions, more so when the interactionbetween adjacent rings and the three-dimensional response of the lining isnot considered.7–9 Therefore, a com-plete range of K0f varying from 0.31to 0.05 has to be studied in order tocover the possible scenarios affectingthe actual tunnel state at the lastregistering date (Fig. 1).
As can be observed in Figs. 6d and7b, the inner reinforcement is the onein most demand in terms of stress inthe flexible ring configuration. It rap-idly achieves a value of about 300 N/mm2 (K0f = 0.4), but later it presentsa stable response around this value upto the complete elimination of K0f. Theexternal reinforcement does not presentsignificant activity since K0f approaches0.35 (hence denoting the initiation ofconcrete cracking at the extrados), pro-gressively increasing to 170 N/mm2
(Fig. 6d) for K0f = 0. This responsecould indicate that, for such particularconfiguration, the deformation of thering would be based more on the rota-tion of the longitudinal joints than onthe opening of the cracked sections, ascan be seen in Fig. 7b.
The concrete and reinforcement stres-ses at the most unfavourable sectionsare used to determine the crack width(wk) at both intrados and extrados sidesaccording to Eurocode 2.10 As can beobserved in Fig. 6d, the crack widthexpected at the intrados side (crown)should be in the range of 0.2 to 0.3 mm,which perfectly fits the actual measuresin the survey presented at the casestudy description (Fig. 3).
When analysing the maximum rein-forcement stresses obtained for thestiff ring configuration (Fig. 6b), itcan be seen how both internal andexternal reinforcements easily scaleup to 300 N/mm2 (K0f = 0.4). Fromthis point, the decrease of K0f doesnot produce a relevant stress increaseat intrados reinforcement at thecrown, but significant incrementsoccur at the extrados reinforcementat the haunches, achieving the steelyielding stress for K0f =0.05 (viewalso Fig. 7a). Consequently, it has tobe considered that, for the last regis-tered ring movements, it would bepossible that the extrados reinforce-ment could have achieved the plasticregime or could be close to.
These stress states define intradoscrack openings at the tunnel crown asaround 0.25 mm for all values of K0f
under 0.4 (Fig. 6b), which equals theflexible configuration results, and arealso completely consistent with thedamage survey presented at the casestudy description (Fig. 3). On theother hand, maximum extrados crackopening significantly increases withthe decrease of K0f, achieving anopening of around 0.4 mm for the lastregistered situation.
This response indicates that, for thestiff ring configuration, the deformationof the ring demands local rotations atthe cracked sections of the haunches,thus concentrating the damage at theextrados. Figure 7a clearly shows wideconcrete damage zones at the haunches(orange–red), as well as the ascensionof the section neutral axis, and theincrement of the compression stress atthe intrados. Consequently, maximumsteel reinforcement stresses and crackopenings could be located at the non-
visible side, which is in contact with thesoil, and do not allow appropriatesurvey or repair. In consequence, exter-nal reinforcement could be potentiallyaffected by durability problems alongits service life, fact that has to be con-sidered when designing the strengthen-ing of the lining.
Proposed Strengthening
The objective of the strengthening ofthe existing lining was to provideenough structural capacity to resistlong-term scenario, whilst improvingthe stiffness in order to avoid excessivedeformations that could affect the serv-iceability of the tunnel. For adequatelydefining the long-term damage sce-nario, it was considered that the effectof the corrosion on the reinforcementat the cracked extrados subjected to theaggressiveness of soil and water in con-tact with the tunnel could lead to areduction of 50% of the reinforce-ments’ section. The authors carried outverifications to ensure that the flexuralcapacity of the enlarged section, assum-ing the 50% loss of steel reinforcement,was equal or greater than that of theoriginal intact section. The constructivedesign of the strengthening interventionwas carried out by an engineering con-sulting company, on the basis of thepresented conclusions and recommen-dations, using more conventional toolsfor the structural analyses and manda-tory code checks.
The strengthening consisted essentiallyof enlarging the depth of the lining ofthe tunnel, by adding a continuouslayer of 200 mm of reinforced sprayedconcrete connected to the existing tun-nel structure, in order to provideenough stiffness and capacity to the
Position 13 (stiff configuration)(a) (b)
–30.11K
B
A4
A3
A2
A1
27.69°
C C
K
–15.
81
+15
.81
–27.
99
+27
.99
–19.32
+30.11
13
B
A4A3
A2
A1
55.38°
12
+19.32
Position 12 (flexible configuration)
Fig. 5: Analysed joint position configurations1
Structural Engineering International Nr. 3/2017 Technical Report 5
OArnauD
Tachado
OArnauD
Texto insertado
2
lining, preventing further deformationsand cracks in the long term. The char-acteristic compressive strength of thesprayed concrete was 30 N/mm2. Toprevent early-age cracking of the liningdue to thermal and shrinkage strains,circumferential joints were placedevery 7.5 m or less, corresponding tofive segments, in the longitudinal direc-tion. This was consistent with thedesigned behaviour of the strengthen-ing as a ring.
A single layer of reinforcement wasplaced close to the intrados with acover of 50 mm, composed by circum-ferential 10 mm rebars at 150 mm andlongitudinal 8 mm rebars at 250 mm.The reinforcement also includedconnections made of steel dowels toimprove the shear-friction capacity,distributing two dowels of 10 mmdiameter (forming one U-shapedrebar) every 400 × 400 mm. This U-reinforcement was inserted 200 mminto the existing segmental lining for agood anchoring. Sand blasting wasalso applied in the intrados surfacebefore spraying concrete to reduce
rebound and to improve shear-frictioncapacity.
The strengthening was applied in 2010and since then no new cracks and norelevant increments of deformationshave been observed.
Conclusions
The study and analysis of the abnor-mal response and damages thatappeared in the tunnel section in thiscase study pointed out the following:
• The increasing deformations anddamages observed at the interior ofthe lining were mainly caused bythe construction of a new embank-ment over the tunnel path, and therelated consolidation phenomenonexperienced by the soft soil sur-rounding the tunnel.
• Internal surveys and measurementscould not be enough to adequatelydefine the actual situation of anunderground structure presentingan abnormal response and/ordamages, since the structural stateat non-visible sides (extrados in
contact with the soil) cannot usuallybe directly characterized.
• Non-linear advanced numericalmodels, and their capacity forreproducing the actual inelasticresponse of the constitutive materi-als and joints, emerge as necessarytools in order to determine thecauses of the damages, comprehendthe main governing mechanisms,and to evaluate the actual state ofthe structure. In the present work,the results of such models helped tounderstand and characterize theinfluence of the joint positions inthe structural system stiffness, andin the damage evolution process. Inthis case study, maximum variationsof 12 and 57% were obtained at thevertical displacement at the crownand maximum horizontal displace-ments by varying only the ring jointpositions.
• In the case study, numerical simula-tions demonstrated that the maxi-mum structural damage could belocated at the extrados side, beingpractically impossible to be directlyevaluated or repaired. For the stiff
Fig. 6: Structural response of the lining when reducing K0f for the two simulated configurations
6 Technical Report Structural Engineering International Nr. 3/2017
ring configuration analysed, aver-age crack opening at the intradosside should be located around0.25 mm, which is fully consistentwith the information reported inthe damage survey. At the extradosside, the average crack opening forthe last registered deformationscould be located around 0.4 mm,obtaining a maximum reinforce-ment steel stress close to its yield-ing value. Therefore, for the lastregistered ring movements, extra-dos reinforcement steel could haveachieved the plastic regime or couldbe close.
• The most complete knowledgeabout the causes of the damage andabout the actual state of the
structure achieved by usingadvanced numerical models allowstaking appropriate decisions aboutfurther actions to take, more so todesign better interventions and ret-rofitting processes. In this casestudy, the conclusions about thepossible wide crack openings at theextrados side led to appropriatelyconsider the cracking and the long-term corrosion of the reinforcementin the design of the strengthenedsection.
Acknowledgements
The present work was carried out in theframework of the contract subscribed between
the Technical University of Catalonia (UPC)and the public company Infraestructures de laGeneralitat de Catalunya SAU for researchand innovation in the construction of Line 9 ofthe Metro of Barcelona.
References
[1] Line 9 Metro of Barcelona. Project docu-ments (in Catalan)
[2] COTCA. Damage categorization of a Line9 tunnel section (in Catalan), 2009.
[3] CEB-FIP. CEB-FIP Model Code 1990. Tho-mas Telford: London, 1993.
[5] Arnau O, Molins C. Experimental and ana-lytical study of the structural response of seg-mental tunnel linings based on an in situloading test. Part 2: Numerical simulation.Tunn. Undergr. Space Technol. 2011; 26:778–788.
[6] Molins C, Arnau O. Experimental and ana-lytical study of the structural response of seg-mental tunnel linings based on an in situloading test. Part 1: Test configuration andexecution. Tunn. Undergr. Space Technol. 2011;26: 764–777.
[7] Arnau O, Molins C. Three dimensionalstructural response of segmental tunnel linings.Eng. Struct. 2012; 44: 210–221.
[8] Arnau O, Molins C, Blom CBM,Walraven JC. Longitudinal-time dependentresponse of segmental tunnel linings. Tunn.Undergr. Space Technol. 2012; 28: 98–108.
[9] Arnau O, Molins C. Theoretical and numer-ical analysis of the three dimensional responseof segmental tunnel linings subjected to loca-lized loads. Tunn. Undergr. Space Technol.2015; 49: 384–399.
[10] CEN. EN 1992-1-1, Eurocode 2: Design ofConcrete Structures, Part 1-1: General Rules andRules for Buildings CEN: Brussels, 2004.
Could be considered to enlarge this figure 7 up to 3 column width in order to better appraise the colors indicating the reinforcement stresses?According to the empty space remaining at the end of the paper, maybe this enlargement can be introduced respecting the 7 page length of the paper.