Damage Mechanics of Porcine Flexor Tendon: Mechanical Evaluation and Modeling SARAH DUENWALD-KUEHL, 1 JACLYN KONDRATKO, 1,2 RODERIC S. LAKES, 2,3 and RAY VANDERBY JR. 1,2 1 Department of Orthopedics and Rehabilitation, University of Wisconsin-Madison, 1111 Highland Ave, WIMR 5059, Madison, WI 53705, USA; 2 Department of Biomedical Engineering, University of Wisconsin-Madison, Madison, WI, USA; and 3 Department of Engineering Physics, University of Wisconsin-Madison, Madison, WI, USA (Received 16 November 2011; accepted 23 February 2012; published online 8 March 2012) Associate Editor Michael R. Torry oversaw the review of this article. Abstract—Porcine flexor tendons underwent cyclic and stress relaxation testing before and after strain exceeding elastic limit (‘‘overstretch’’) to examine which mechanical parame- ters undergo changes following subfailure damage. From these data, we developed an ‘‘effective strain’’ damage model (in which the tendon is modeled as if being pulled to a lower strain). Damage was induced at three strain levels to determine the extent to which post-damage parameter changes were affected by overstretch strain level. We found that diffuse damage induced by overstretch decreased elastic and viscoelastic parameters obtained during testing. The stress response of tendon to strain is therefore altered following damage. We next compared the strain-dependent parameter behavior to damage-dependent behavior to deter- mine the effective strain for each parameter. Effects of damage became more pronounced as strain during over- stretch increased; following overstretch to 6.5, 9, or 13% strain, effective strain was 2.43 ± 0.33, 1.98 ± 0.3, or 0.88 ± 0.43% strain, respectively. By determining the effec- tive strain and using it to calculate predicted values of post- damage mechanical parameters, it was possible to predict the stress relaxation behavior of tendons with Schapery’s non- linear viscoelastic model. Using this approach, a single parameter predicts both elastic and viscoelastic compromise from known, strain-dependent behaviors. Keywords—Tendon, Damage, Mechanics, Equivalent strain. INTRODUCTION Tendons are essential to move joints, absorb impacts, and store energy during loading to facilitate efficient movement. The ability of tendons to per- form these functions is connoted by their mechanical properties. Though typically able to withstand normal movement and activities, tendons can be injured dur- ing abnormal movement or chronic loading. Tendons that have undergone subfailure damage have com- promised mechanical properties 8,9 and therefore have compromised ability to carry out normal functions (i.e., joint movement and stabilization). Biological and mechanical metrics can quantify damage 9 ; altered mechanical properties provide a direct measure of functional compromise. Therefore, by anticipating changes in mechanical properties resulting from such damage, it is possible to anticipate alterations in ten- don function. Tendons with subfailure damage have different biomechanical behavior than normal tissues, including both elastic and viscoelastic (or time-dependent) changes. Damage can lead to a drop in load for a given strain 4,13 or differences in viscoelastic properties. 9 ‘‘Damage’’ in this study is defined as changes in the microstructure of tendon that lead to a reduction in its mechanical strength, 4,13 and is caused by ‘‘over- stretch,’’ which is defined as the application of strain states that exceed the tendon’s elastic limit. 8 The elastic limit was determined to be 6% strain, as this is the highest strain at which we were able to perform repeatable testing 1 and is consistent with reported upper bounds on the physiologic range. 3,7 The healing response to damage can compromise function in many ways. Adhesions limit range of joint motion. Scar formation can alter load distribution and mechanical properties to potentially result in tearing of tendon, insertion sites, or even adjacent muscle tissue. Con- versely, increased laxity from overstretch could allow hypermobility of the joint or require altered neuro- muscular control to facilitate precise movements. Changes in viscoelastic properties could result in Address correspondence to Ray Vanderby Jr., Department of Orthopedics and Rehabilitation, University of Wisconsin-Madison, 1111 Highland Ave, WIMR 5059, Madison, WI 53705, USA. Elec- tronic mail: [email protected], [email protected]Annals of Biomedical Engineering, Vol. 40, No. 8, August 2012 (ȑ 2012) pp. 1692–1707 DOI: 10.1007/s10439-012-0538-z 0090-6964/12/0800-1692/0 ȑ 2012 Biomedical Engineering Society 1692
Transcript
Damage Mechanics of Porcine Flexor Tendon: Mechanical Evaluation
and Modeling
SARAH DUENWALD-KUEHL,1 JACLYN KONDRATKO,1,2 RODERIC S. LAKES,2,3 and RAY VANDERBY JR.1,2
1Department of Orthopedics and Rehabilitation, University of Wisconsin-Madison, 1111 Highland Ave, WIMR 5059, Madison,WI 53705, USA; 2Department of Biomedical Engineering, University of Wisconsin-Madison, Madison, WI, USA; and
3Department of Engineering Physics, University of Wisconsin-Madison, Madison, WI, USA
(Received 16 November 2011; accepted 23 February 2012; published online 8 March 2012)
Associate Editor Michael R. Torry oversaw the review of this article.
Abstract—Porcine flexor tendons underwent cyclic and stressrelaxation testing before and after strain exceeding elasticlimit (‘‘overstretch’’) to examine which mechanical parame-ters undergo changes following subfailure damage. Fromthese data, we developed an ‘‘effective strain’’ damage model(in which the tendon is modeled as if being pulled to a lowerstrain). Damage was induced at three strain levels todetermine the extent to which post-damage parameterchanges were affected by overstretch strain level. We foundthat diffuse damage induced by overstretch decreased elasticand viscoelastic parameters obtained during testing. Thestress response of tendon to strain is therefore alteredfollowing damage. We next compared the strain-dependentparameter behavior to damage-dependent behavior to deter-mine the effective strain for each parameter. Effects ofdamage became more pronounced as strain during over-stretch increased; following overstretch to 6.5, 9, or 13%strain, effective strain was 2.43 ± 0.33, 1.98 ± 0.3, or0.88 ± 0.43% strain, respectively. By determining the effec-tive strain and using it to calculate predicted values of post-damage mechanical parameters, it was possible to predict thestress relaxation behavior of tendons with Schapery’s non-linear viscoelastic model. Using this approach, a singleparameter predicts both elastic and viscoelastic compromisefrom known, strain-dependent behaviors.
Tendons are essential to move joints, absorbimpacts, and store energy during loading to facilitateefficient movement. The ability of tendons to per-form these functions is connoted by their mechanical
properties. Though typically able to withstand normalmovement and activities, tendons can be injured dur-ing abnormal movement or chronic loading. Tendonsthat have undergone subfailure damage have com-promised mechanical properties8,9 and therefore havecompromised ability to carry out normal functions(i.e., joint movement and stabilization). Biological andmechanical metrics can quantify damage9; alteredmechanical properties provide a direct measure offunctional compromise. Therefore, by anticipatingchanges in mechanical properties resulting from suchdamage, it is possible to anticipate alterations in ten-don function.
Tendons with subfailure damage have differentbiomechanical behavior than normal tissues, includingboth elastic and viscoelastic (or time-dependent)changes. Damage can lead to a drop in load for a givenstrain4,13 or differences in viscoelastic properties.9
‘‘Damage’’ in this study is defined as changes in themicrostructure of tendon that lead to a reduction in itsmechanical strength,4,13 and is caused by ‘‘over-stretch,’’ which is defined as the application of strainstates that exceed the tendon’s elastic limit.8 The elasticlimit was determined to be 6% strain, as this is thehighest strain at which we were able to performrepeatable testing1 and is consistent with reportedupper bounds on the physiologic range.3,7 The healingresponse to damage can compromise function in manyways. Adhesions limit range of joint motion. Scarformation can alter load distribution and mechanicalproperties to potentially result in tearing of tendon,insertion sites, or even adjacent muscle tissue. Con-versely, increased laxity from overstretch could allowhypermobility of the joint or require altered neuro-muscular control to facilitate precise movements.Changes in viscoelastic properties could result in
Address correspondence to Ray Vanderby Jr., Department of
Orthopedics and Rehabilitation, University of Wisconsin-Madison,
1111 Highland Ave, WIMR 5059, Madison, WI 53705, USA. Elec-
Annals of Biomedical Engineering, Vol. 40, No. 8, August 2012 (� 2012) pp. 1692–1707
DOI: 10.1007/s10439-012-0538-z
0090-6964/12/0800-1692/0 � 2012 Biomedical Engineering Society
1692
differences in how tendons cope with impact or pro-longed loading scenarios, or how they return potentialenergy to facilitate movement. Even subtle differencesin tendon mechanical behavior may predict accumu-lation of damage and pathologic sequelae.
The stress response of a tendon to strain is the fun-damental mechanical behavior of the tissue. A strain-based continuummechanics characterization of damagesuggests that the stress associated with the damagedstate under an applied strain is equivalent to the stressassociated with its undamaged state under effectivestrain.13 In other words, the strain-dependent mechan-ical behavior (constitutive functions) of the tendon areunaltered if one calculates the response based on theeffective strain rather than the applied strain (see Fig. 1).Therefore, if the relationship between the effective strainand the applied strain is known, as well as the strain-dependence of the mechanical parameters of interest, itis possible to anticipate the changes in mechanicalproperties resulting fromdamage and predict functionalcompromise.
In this study we set out to examine the effects ofdamage on the mechanical behavior of tendon bysubjecting tendons to cyclic and stress relaxation test-ing prior to and following overstretch damage. Thedamage mode, subfailure damage caused by overst-retching the tendon beyond its elastic limit, is repre-sentative of the strain and sprain injuries that affecttendons and ligaments during abnormal movementand flexion events. Studying and modeling the effectsof such damage allows for a better understanding ofthe compromised function of the tissues associatedwith the residual laxity following overstretch injuriesand may give insight to the high incidence of re-injury
and long recovery times. The overall goals are: (1)determine which viscoelastic and elastic mechanicalparameters can quantify subfailure damage in over-stretched tendon and (2) use these parameters to modelpost-damage behavior; specific objectives included inthis second goal include: (a) partnering strain-depen-dent parameter analysis with the mechanical results inorder to (b) determine the ‘‘effective strain’’ of eachparameter after each damage case, and (c) use theseresults to build a predictive model of damage behaviorbased on the effective strain principle. We hypothesizethat increasing strain during damage-causing over-stretch will lower the effective strain; in other words,increased damage in the tissue will lead to increasedtendon laxity, which results in parameter values similarto those at lower strains in pre-damage tests.
MATERIALS AND METHODS
Specimen Preparation
Thirty-five porcine digital flexor tendons (3rd and4th digit) were excised from 18 forelimbs obtainedfrom a local abattoir with care to leave the bonyinsertion sites intact at the distal ends of the tendons.Specimens were kept hydrated in physiologic bufferedsaline until loading into the mechanical test system.Bony ends were then potted in lightweight polyesterresin filler molded to fit inside a stainless steel boneblock. Unloaded cross-sectional area was measuredassuming an elliptical shape; long and short axeswere measured at three points along the tendon andaveraged.
Specimens were loaded into custom grips in a PBS-filled bath in the servohydraulic test system (Bionix858, MTS, Minneapolis, MN). The muscle end of thetendons was secured in a custom soft tissue grip, with apan for holding dry ice (freezing of the soft tissue endhelps prevent slippage) and a connection to the movingcrosshead of the servohydraulic machine. The pottedbony ends were enclosed in a stainless steel grip fixedto the test frame. Grip-to-grip displacement was con-trolled by the servohydraulic machine and load wasmeasured using a 1000 lb load cell (Honeywell,Morristown, NJ). Data were captured on a PC equip-ped with Labtech Notebook (Laboratory TechnologyCorporation, Fort Collins, CO).
Once in the test frame, specimens were preloaded to1 N (to remove slack in the tendon) and initial tendonlength, L0, was measured for strain calculations usingdigital calipers. Tendons were preconditioned using asinusoidal wave from 0 to 2% strain at 0.5 Hz for 20 s.Tendons were allowed to rest for 1000 s prior to fur-ther mechanical testing to allow for complete recovery.
FIGURE 1. Strain-based approach to damage description.The stress at the applied strain (eapplied) on the damagedstress–strain curve is equivalent to the stress at the effectivestrain (eeffective) on the normal stress–strain curve.
Damage Mechanics of Porcine Flexor Tendon 1693
Mechanical Testing: Objective 1
Specimens were randomly assigned to subfailure(n = 30) or strain-dependent (n = 5) testing. In thesubfailure testing, stress relaxation and cyclic testingwere performed prior to and following overstretchdamage to quantify the mechanical changes followingdamage. Stress relaxation (40 ms ramp, held 100 s,40 ms return to zero) and cyclic testing (0.5 Hz for 20 sbetween 0 and 4%) were performed on tendons with1000 s rest periods at zero strain between each test.Data were sampled at a rate of 10 Hz. Two relaxationtests and two cyclic tests were performed on eachspecimen prior to inducing damage, which was doneusing an overstretch pull (in % strain) to 6.5 (n = 10),9 (n = 10), or 13 (n = 10) in 1 s. These strains werechosen to fall outside of the normal maximum physi-ologic strain of 5–6%3,7 but below reported failurestrains of 15–20%.5,12 Following this overstretch (anda 1000 s rest period at zero strain), relaxation tests andcyclic tests were repeated.
Mechanical Testing: Objective 2a
In strain-dependent testing, five tendons wereselected to undergo stress relaxation testing at variousstrains in order to ascertain the strain dependence ofmechanical parameters associated with stress relaxa-tion. Tendons were subjected to stress relaxation at1, 2, 3, 4, 5, and 6% strain for 100 s (in random order)with 1000 s rest at zero strain between each relaxationtest to allow for viscoelastic recovery.
Parameter Calculation: Objective 1
To fulfill our primary goal (determining which vis-coelastic and elastic mechanical parameters can quan-tify subfailure damage in overstretched tendon)mechanical parameters were calculated from the gath-ered data. Force data (F) acquired by the servohydraulicsystem during stress relaxation testing were divided byoriginal cross-sectional area, a0, to calculate stress (r).
rðtÞ ¼ FðtÞ=a0 ð1Þ
Stress data were then used to calculate parametersof interest (Fig. 2a) such as the maximum stressreached during stress relaxation (rmax-rlx) and thereduction in stress during relaxation (rdecay-rlx), bothprior to and following damage. Stress data were alsoused to calculate E(t) (relaxation modulus) results bydividing stress by input strain;
EðtÞ ¼ rðtÞ=e0 ð2Þ
the resulting E(t) results were fit with a power law andparameters A and n were calculated before and afterdamage.
EðtÞ ¼ Atn ð3Þ
Time-dependent behaviors were fit with Schapery’sviscoelastic model,2,11 and model parameters he and h2were calculated. Schapery’s nonlinear viscoelasticmodel is defined as:
rðtÞ ¼ heEe þ h1
Z t
0�
DEðq� q0Þ dh2ds
ds ð4Þ
FIGURE 2. Mechanical parameters of interest from (a) stress relaxation testing: rmax-rlx (maximum stress reached) and rdecay-rlx
(decrease in stress over 100 s) and (b) cyclic testing: rpeak-cyc (peak stress reached) and rdecrease-cyc (decrease in peak stress over10 cycles).
DUENWALD-KUEHL et al.1694
where he, h1, and h2 are strain-dependent materialproperties related to Helmholtz free energy (specifi-cally, 3rd order and higher strain effects), DE is thetransient component of the modulus (defined byDE ” E(t) 2 Ee), Ee is the equilibrium or final value ofthe modulus (defined by Ee = E(¥)), and q and q¢ aredefined as follows:
q �Z t
0
dt0=ae½eðt0Þ� ðae>0Þ: ð5Þ
q0 � qðsÞ ¼Zs
0
dt0=ae½eðt0Þ�: ð6Þ
where ae is an additional strain-dependent materialproperty related to strain influences in free energy andentropy production.11 Physically, q can be regarded asan internal clock time which can depend on strain.Testing tendon and ligament in isothermal conditionsresults in h1 and ae becoming 1,11 so the equationbecomes:
rðtÞ ¼ heEe þ h2DEðt� taÞ½ �e ð7Þ
and the key parameters for model construction are heand h2.
Force data acquired during cyclic testing were alsoused to calculate stress data, and displacement datawere used to calculate strain as a function of time (bydividing grip-to-grip displacement by initial length,L0), such that stress–strain curves could be generatedprior to and following damage. Stress data were thenused to calculate parameters of interest (Fig. 2b) suchas the peak stress reached during cyclic testing (rpeak-cyc)and the decrease in peak stress from the first to lastcycle (rdecrease-cyc), prior to and following damage. Inaddition, the strain at initial loading (e0+) was calcu-lated by recording the strain required to increase theload (from the 1 N preload) by 0.06 N (the smallestload increment that can be distinguished from noise,based on the sensitivity of the load cell). The stress–strain curve from the first half-cycle (0–4% strain) wasthen fit with a 3rd-order polynomial (the lowest-orderpolynomial with R2 values consistently greater than0.9) such that the first and second derivatives (repre-senting slope and curvature, respectively) could becalculated at a point along the curve (2% strain waschosen as a point which had a reliably non-zero slope,even after the damage pull, and is a physically relevantstrain). Post-damage to pre-damage ratios were thencalculated for each parameter (values from the twotrials for each specimen were averaged) in order tocompare damage affects at each overstretch strainlevel.
Parameter Interrelationships: Objective 1
To examine the interrelationships, each pair ofparameters was plotted and fitted with a linear curve fitand the R2 value calculated. Correlation strength wasdefined by R2 values: strong correlations had R2 valuesgreater than 0.8, correlations greater than 0.6, andweak correlations greater than 0.4.
Effective Strain Calculation: Objective 2b
Parameter values calculated for each strain levelfrom mechanical data (see ‘‘Mechanical Testing:Objective 2a’’ section) were normalized by the value at4% strain (the strain at which pre- and post-damagecyclic and relaxation testing occurred) and averaged.Plots of normalized parameter versus strain were thengenerated, and the resulting curves were fit with athird-order polynomial (of the form y = ax3 +bx2 + cx + d), which was chosen for its ability to fitvarying parameter trends with high R2 values. Theresulting equations gave a relationship between strain(x) and normalized parameter ratio value (y).Mechanical data from experiments (post-damage valuenormalized by pre-damage value at 4% strain) werethen used as y values in the third-order polynomialequations to solve for x, which is the ‘‘effective strain’’value (see following section, Fig. 1). Effective strainsfor each overstretch strain level (6.5, 9, and 13%strain) were averaged across parameters.
Model Calculations: Objective 2c
Damage models in this study were built upon theidea that the stress in the tissue (and resulting param-eters) are a function of effective strain rather thanapplied strain. Effective strain can be related to appliedstrain through the following equation:
eeff ¼ ½1�D�eapp ð8Þ
where eeff refers to the effective strain, eapp refers to theapplied strain, and D is the damage parameter thatrelates to the damage state of the tissue. In the case ofstrains below the elastic limit of the tissue,D is equal to 0,and the effective strain is equal to the applied strain. Inthe case of strains above the elastic limit of the tissue, Dincreases with increased damage in the tissue, and thusthe effective strain is smaller than the applied strain.
The formation of damage parameters has beenachieved in many ways. Some relate damage to thereduction of structural support, based on the amountof remaining intact material. For example, Nataliet al.8 defined damage in tendon, Df, as a ratio of thenumber of fibers that had failed at a given stretch tothe total number of fibers in the tissue:
Damage Mechanics of Porcine Flexor Tendon 1695
Df ¼# fibers failed at stretch
total # fibers in tissueð9Þ
Additionally, Lemaitre defined a damage variableassociatedwith the normal direction,Dn, as the differencebetween the overall area of the material and the effectiveresisting area divided by the overall area of the material6:
Dn ¼S� �S
Sð10Þ
where S is the overall area of the material section and �Sis the effective resisting area.
Others relate damage to altered mechanical perfor-mance, based on post-damage mechanical response toload. For example, a structural damage parameter, Ds,was defined by Provenzano et al.,10 which related theinitial length of tendon (at preload) to the length oftendon (at preload) following damage:
Ds ¼ 100Ls � L0
L0
� �ð11Þ
where Ls is the length of the tendon following damageand L0 is the initial length of the tendon.
The damage parameter in Eq. (9) is well suited forcomputer models of tendon behavior, with histologicinput. However, it is difficult to know the exact numberof fibers in a specimen as well as the number of fibersthat have failed during practical mechanical testing,and it would require the use of certain imagingmodalities (i.e., TEM and SEM) to help form estimatesof fiber numbers. Likewise, the parameter in Eq. (10)could be readily computed using a computer model or,alternatively, if damage was induced by cutting througha portion of the cross-sectional area (thus leaving awell-defined intact effective resisting area). Diffusedamage, however, leaves a less easily calculated effec-tive resisting area (again, requiring imaging modalitiesto help form estimates of intact area). Conversely, thedamage parameter in Eq. (11) is easy to relate directlyto mechanical testing outcomes, particularly if testing isdone in a load-controlled manner. A similar construc-tion of the damage parameter was used in this study.
When a controlled experiment is performed, theinput strain is known, and therefore one metric withwhich damage can be predicted is the input strain itself,provided the elastic limit is known or can be deter-mined. Therefore, an empirical damage parameter is:
for e� elastic limit Dempirical ¼ 0
for e>elastic limit...
Dempirical ¼ C input strainð Þð12Þ
where C is a constant that needs to be calculatedempirically (in this case, by plotting the ratio ofeffective strain to applied strain).
If the input strain is not known, the stress–straincurve following damage can be compared to the pre-damage curve (or a reference curve for the tissue)provided the curves were constructed under the sameconditions (i.e., same strain rate) to predict themechanical properties following damage. If the slopesof the stress–strain curves are compared (in this case,the slope is taken at 2%), the resulting damageparameter can be calculated:
for e � elastic limit Dslope ¼ 0
for e>elastic limit...
Dslope ¼ 1�d0j2%;post-damage
d0j2%;pre-damage
ð13Þ
where d¢|2% represents the slope of the stress–straincurve at 2% strain.
So, for the model calculations in this study, we have:
eeff ¼ 0:04 1� C input strainð Þ½ � ð14Þ
and
eeff ¼ 0:04d0j2%;post-damage
d0j2%;pre-damage
" #ð15Þ
to describe post-damage effective strain levels. Thestrain-dependence information about the parameterscan then be used to calculate post-damage parametersfor use in Schapery’s nonlinear viscoelastic constitutivemodel (Eqs. 4–7). For more information about theuse of Schapery’s nonlinear viscoelastic model, seeDuenwald et al.2 and Schapery.11
Statistical Analysis
Post-damage to pre-damage ratios of parametersfollowing overstretch to 6.5, 9, and 13% strain werecompared using a repeated measures ANOVA. Per-cent errors for each Schapery model prediction (data-based, empirical-model-based, and slope-model-based) were compared using a repeated measuresANOVA. Statistical significance was chosen to bep £ 0.05.
RESULTS
Mechanical Evaluation: Objective 1
Subjecting tendons to overstretch strains led todiffuse damage in the tissue manifested in themechanical testing as reduced stress at a given strain inthe stress–strain curve (Fig. 3a), a rightward shift inthe stress–strain curve and increased strain at initialloading (Fig. 3b), reduced stress levels and reduced
DUENWALD-KUEHL et al.1696
stress decrease during cyclic testing (Fig. 3c), andreduced stress levels and reduced stress decay duringstress relaxation testing (Fig. 3d).
The cyclic testing parameters rdecrease-cyc and rpeak-cycboth decreased following damage (Fig. 4a). Post-damage to pre-damage ratios of rdecrease-cyc (mean ±
standard deviation) were 0.23 ± 0.07, 0.15 ± 0.05, and0.04 ± 0.02 following overstretch at 6.5, 9, and 13%strain, respectively; each overstretch strain level wassignificantly different than the others (p = 0.0094).Post-damage to pre-damage ratios of rpeak-cyc follow-ing 6.5, 9, and 13% strain were 0.56 ± 0.09, 0.34 ±
0.10, and 0.12 ± 0.05, respectively, and each
overstretch level was significantly different than theothers (p = 0.0039).
Stress relaxation parameters rmax-rlx and rdecay-rlxdecreased following overstretch (Fig. 4b). Post-damageto pre-damage ratios of rmax-rlx following pull to 6.5,9, and 13% strain were 0.66 ± 0.08, 0.43 ± 0.10, and0.14 ± 0.07, respectively, and each overstretch levelwas significantly different than the others (p =
0.0031). Similarly, the post-damage to pre-damageratios of rdecay-rlx following pull to 6.5, 9, and 13%strain were 0.64 ± 0.10, 0.41 ± 0.10, and 0.14 ±
0.09, respectively. Each overstretch strain level wassignificantly different than the others (p = 0.0037).
FIGURE 3. Representative pre-damage and post-damage results for a specimen subjected to an overstretch at 9% strain; damageis manifested in (a) lower stresses and less curvature in the stress–strain curve, (b) rightward shift in initial loading curve, (c) lowerstresses during cyclic testing at 4% strain, and (d) lower stresses during stress relaxation testing at 4% strain. Data in Fig. 3b isfrom the same set as in Fig. 3a (focused in at the initial loading, or first few data points, to emphasize the rightward shift).
Damage Mechanics of Porcine Flexor Tendon 1697
FIGURE 4. Post-damage to pre-damage ratio of mechanical parameters from cyclic (a, c, e) and relaxation (b, d, f) testing. (a)Cyclic testing parameters stress decrease (stress drop from first to tenth cycle) and peak stress (peak stress reached during cyclictesting to 4% strain); (b) relaxation testing parameters stress decay (stress decay over 100 s of relaxation testing) and max stress(maximum stress reached during step strain input of 4%); (c) stress–strain curve parameter strain at initial load (first strain value atwhich a nonzero load is reached); (d) power law fit parameters A and n (scalar multiplier and exponential from power law equation);(e) stress–strain curve parameters d¢|2% (first derivative of the stress–strain curve equation evaluated at 2% strain) and d¢¢|2%
(second derivative of the stress–strain curve equation evaluated at 2% strain); (f) Schapery model parameters he and h2 (ther-modynamic parameters used in the calculation of the Schapery model).12 Error bars represent one standard deviation.
DUENWALD-KUEHL et al.1698
Stress–strain curve parameter e0+, representing thestrain at which loading begins (and is therefore ameasure of laxity), increases following overstretch(Fig. 4c). The post- to pre-damage ratios followingoverstretch to 6.5, 9, and 13% strain were 2.82 ± 2.08,8.09 ± 4.09, and 13.26 ± 3.51, respectively. Parame-ters from each overstretch strain were significantlydifferent than the others (p = 0.0311). The otherstress–strain curve parameters, d¢|2% and d¢¢|2%, rep-resenting the slope of the stress–strain curve (firstderivative) as well as its curvature (second derivative),both decreased following overstretch (Fig. 4e). Post- topre-damage ratios of d¢|2% were 0.72 ± 0.13,0.48 ± 0.15, and 0.11 ± 0.06 following 6.5, 9, and13% strain, respectively. Parameters at each of theoverstretch strains was significantly different than theothers (p = 0.0005). Similarly, post- to pre-damageratios of d¢¢|2% were 0.34 ± 0.10, 0.18 ± 0.06, and0.04 ± 0.02 following overstretch to 6.5, 9, and 13%,respectively. Again, parameters for each overstretchlevel were significantly different from each other(p = 0.0012).
Power law fit parameters from the relaxation curve,A and n, both decrease following overstretch damage(Fig. 4d). Post- to pre-damage ratios following pull to6.5, 9, and 13% strain for A were 0.67 ± 0.07,0.38 ± 0.16, and 0.14 ± 0.08; parameters for eachoverstretch level were significantly different from eachother (p = 0.0003). Post- to pre-damage ratios for nwere 0.86 ± 0.04, 0.84 ± 0.07, and 0.60 ± 0.24 for 6.5,9, and 13% conditions. Parameters for each over-stretch condition were significantly different from eachother (p = 0.0078).
Schapery model parameter he decreases followingoverstretch while the model parameter h2 increases
following overstretch (Fig. 4f). Ratios of post- to pre-damage parameter values for he were 0.89 ± 0.07,0.87 ± 0.07, and 0.76 ± 0.08 following pulls to 6.5, 9,and 13% strain, and parameters for each overstretchlevel were significantly different from each other(p = 0.0082). Post- to pre-damage parameter valuesfor h2 had the opposite trend, with ratios of1.07 ± 0.05, 1.09 ± 0.09, and 1.34 ± 0.16. Parametersagain were significantly different at each overstretchlevel (p = 0.0379).
Parameter Interrelationships: Objective 1
Interrelationships between parameters are displayedin Table 1. Strong correlations occurred between Aand rmax-rlx, rdecay-rlx, rpeak-cyc, and d¢|2%; betweenrmax-rlx and rdecay-rlx, rpeak-cyc, and d¢|2%; betweenrdecay-rlx and rpeak-cyc; between rdecrease-cyc and d¢|2%and d¢¢|2%; and between d¢|2% and d¢¢|2%. Correlationsexisted between A and rdecrease-cyc, and d¢¢|2%; betweenrmax-rlx and rdecrease-cyc, and d¢¢|2%; between rdecay-rlxand rdecrease-cyc, d¢|2%, and d¢¢|2%; between rpeak-cycand rdecrease-cyc, d¢|2%, and d¢¢|2%; and between he andh2. Weak correlations existed between n and rmax-rlx,rdecay-rlx, and he; between rmax-rlx and he; and betweend¢|2% and he. Examples of parameter correlations forcyclic (Fig. 5a), stress relaxation (Fig. 5b), derivative(Fig. 5c), and Schapery model (Fig. 5d) ratios areshown in Fig. 5.
Strain Dependence: Objective 2a
Power law fit parameters A and n increased withstrain (Figs. 6a and 6b), Schapery model parameter heincreased with strain (Fig. 6c) while model parameter h2
TABLE 1. Parameter relationships represented by R2 values of parameter–parameter plots.
A n rmax-rlx rdecay-rlx rpeak-cyc rdecrease-cyc d¢|2% d¢¢|2% e0+ he h2
decreasedwith strain (Fig. 6d),maximum stress reachedduring relaxation increasedwith strain (Fig. 6e), and thestress decay over 100 s of relaxation decreased withstrain (Fig. 6f). In each case, the trend for decreasingstrain matched the trend for increasing ‘‘damage strain’’(strain input during overstretch).
Equivalent Strain Calculations: Objective 2b
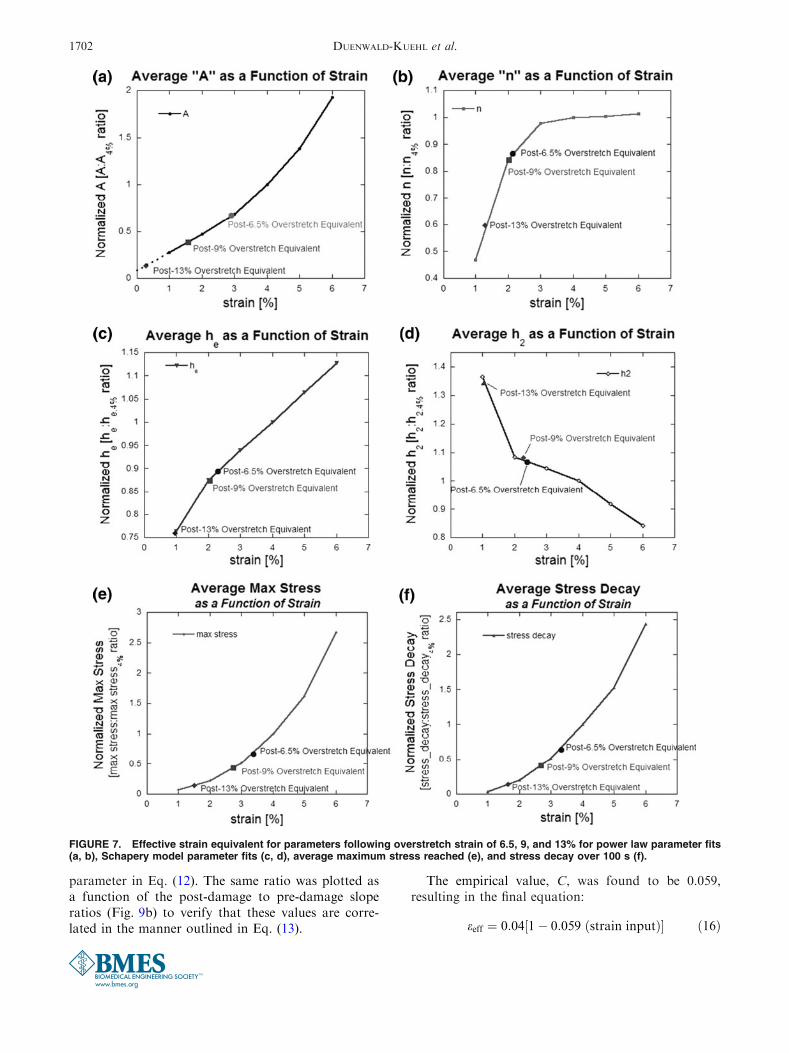
The effective strain equivalent for each parameter,plotted in Fig. 7, was reduced from the applied strain(4%) in each case, and was reduced the most followingthe greatest overstretch strain input (13%), least fol-lowing the least overstretch strain input (6.5%).
When averaged across all of the modeling param-eters, the average effective strains were 2.43 ± 0.33,1.98 ± 0.3, and 0.88 ± 0.43% following overstretchstrain inputs of 6.5, 9, and 13%. All model param-eter values (A, n, he, and h2) were within a stan-dard deviation of the mean effective strain value(Fig. 8).
Model Calculations: Objective 2c
The ratio of effective strain to applied strain as afunction of overstretch strain was plotted (Fig. 9a) toempirically determine the constant, C, for the damage
FIGURE 5. Parameter relationship plots for (a) cyclic ratios (rpeak-cyc and rdecrease-cyc), (b) stress relaxation ratios (rmax-rlx andrdecay-rlx), (c) derivative ratios (d ¢|2% and d ¢¢|2%), and (d) Schapery model ratios (he and h2). For a complete list of correlations, seeTable 1.
DUENWALD-KUEHL et al.1700
FIGURE 6. Normalized (by 4% strain test values) parameters as a function of strain and fitted with third-order polynomial (of theform M0x3 + M1x2 + M2x + M3), including power law parameter fits (a, b), Schapery model parameter fits (c, d), average maximumstress reached (e), and stress decay over 100 s (f). Error bars indicate standard error (n 5 5).
Damage Mechanics of Porcine Flexor Tendon 1701
parameter in Eq. (12). The same ratio was plotted asa function of the post-damage to pre-damage sloperatios (Fig. 9b) to verify that these values are corre-lated in the manner outlined in Eq. (13).
The empirical value, C, was found to be 0.059,resulting in the final equation:
eeff ¼ 0:04 1� 0:059 ðstrain inputÞ½ � ð16Þ
FIGURE 7. Effective strain equivalent for parameters following overstretch strain of 6.5, 9, and 13% for power law parameter fits(a, b), Schapery model parameter fits (c, d), average maximum stress reached (e), and stress decay over 100 s (f).
DUENWALD-KUEHL et al.1702
This equation was used to calculate the ‘‘empirical’’model, while Eq. (13) was used to calculate the ‘‘slope’’model. Calculated parameter values are plotted withactual data values in Fig. 10.
The models calculated using these parameters, aswell as a Schapery model fit from the post-damagedata, is plotted in Fig. 11. All models characterized the
stress relaxation behavior reasonably well followingoverstretch to 6.5 (Fig. 11a), 9 (Fig. 11b), and 13%(Fig. 11c); the Schapery model fit constructed fromactual data values had the least error (Fig. 11d;Table 2), as would be anticipated, but the averagepercent error was not significantly different betweenmodels for any overstretch damage case (post-6.5%,p = 0.181; post-9%, p = 0.521; post-13%, p = 0.227;overall, p = 0.856).
DISCUSSION
Despite their uniaxial loading and simple appear-ance, tendons are natural composite materials withintricate microstructures and complex mechanicalbehaviors. Understanding how these behaviors changefollowing damage is critical for understanding mechani-cal function, quantifying compromise with subfailuredamage, and benchmarking normal functional behav-iors to evaluate the efficacy of injury treatments.Understanding changes in laxity experienced by post-damage tendons better helps elucidate how musclesmust compensate, as well as anticipate the potential forabnormal neuromuscular control of movements.
In this study, we found that elastic parameters rpeak-cycand rmax-rlx were decreased following overstretch(Fig. 2). This indicates that the tendon has less resis-tance to deformation after sustaining subfailure dam-age. Tendons and ligaments have a strain-stiffeningstress–strain curve, which leads to greater resistance todeformation as strain in the tendon increases; thisbehavior allows tendons and ligaments to control joint
FIGURE 8. Equivalent strain values for modeling parametersA (overall stiffness), n (relaxation slope), he, and h2. ‘‘Average(mean)’’ indicates the mean equivalent strain value across allparameters, ‘‘Average (high)’’ indicates the mean equivalentstrain value + 1 standard deviation, and ‘‘Average (low)’’indicates the mean equivalent 2 1 standard deviation. Errorbars indicate one standard deviation (of parameter equivalentstrain mean). Parameter equivalent strain values fall withinone standard deviation of the mean equivalent strain value.
FIGURE 9. Effective strain/applied strain ratio as a function of (a) overstretch strain and (b) post-damage to pre-damage sloperatio. The resulting value of C is 0.059. The relationship between effective strain and slope is confirmed.
Damage Mechanics of Porcine Flexor Tendon 1703
kinematics by resisting excessive movement of the jointas well as facilitating more efficient transfer frommuscle flexion to bone movement. Increased tendonlaxity resulting from subfailure damage thereforereduces the tendon’s ability to resist excessive move-ment, which increases the potential for further damageand ultimate tendon failure with time or chronicdegenerative joint disease.
Similarly, the viscoelastic parameters rdecay-rlx andrdecrease-cyc (Fig. 2) decreased following overstretchdamage. This means that the time-dependent proper-ties have been altered. Specifically, damage reduces therelaxation and the dynamic softening under cyclicload. This will affect the ability of the tendons torespond to loading situations over time. We also seethat energy absorption is reduced by damage. Func-tional implications of this are substantial. From amicrostructural and molecular perspective, alterations
in viscoelastic properties indicate changes in the inter-actions between the components within the tendon.
Parameters describing the shape of the stress–straincurve, d¢|2% (slope of stress–strain curve) and d¢¢|2%(curvature of stress–strain curve) also decreased fol-lowing overstretch damage. This is a quantifiablemeasure of the changes that occur in the stress–straincurve following damage, and is indicative of laxity inthe tissue. Another measure of the changes to thestress–strain curve is e0+, the strain at which the ten-don picks up load. An increase in this variable indi-cates a quantifiable rightward shift of the stress–straincurve, and another manifestation of laxity.
Relaxation curve power law fit parameters A and nconsistently decreased following overstretch, whichmeans the tendon became overall more compliant(lower A) and less viscoelastic (lower n). This is notsurprising, as stress reached and stress decay during
FIGURE 10. Parameter predictions based on empirical and slope models for (a) A, (b) n, (c) he, and (d) h2 values. The dotteddiagonal line has a slope of 1 and represents the point at which the model and data values are equivalent.
DUENWALD-KUEHL et al.1704
stress relaxation are decreased, and resulting curve fitsof the relaxation modulus would likely decreaseaccordingly. While A ratio values (representing overallstiffness) consistently correlated to other stress relax-ation parameters, as expected, n ratio values (repre-senting relaxation rate correlated weakly or not at allto other parameters. This is likely due in part to the
linear nature of the correlation (a nonlinear relation-ship would result in a poor linear correlation fit).
Schapery model parameter h2 consistently increasesfollowing overstretch, and parameter he consistentlydecreases following overstretch. This implies thatconstitutive models, given an understanding of howparameters change following damage and an estimateof damage level, can be altered to relate damage topost-damage stress and/or strain levels.
The amounts that each of these parametersdecreased depended on the strain during overstretch,indicating that the amount of diffuse damage in atendon can be varied by varying the strain used tocreate it. It also means that mechanical properties oftendon can be indicative of the level of damage in thetendon and implies that it may be possible to correlatemechanical parameters, both viscoelastic and elastic,
FIGURE 11. Schapery model calculated with parameters from data fit, empirical model, and slope model. All models fit the datafor (a) post-6.5% strain data, (b) post-9% strain data, and (c) post-13% data reasonably well, with (d) overall percent error less than10% for each model. For visibility, every 10th data point is shown.
TABLE 2. Percent error between Schapery model value andactual data value.
Percent error
Post-6.5% Post-9% Post-13% Overall
Data 2.69 1.80 2.05 2.18
Empirical 212.75 23.11 24.94 3.02
Slope 24.41 21.97 21.96 5.19
Damage Mechanics of Porcine Flexor Tendon 1705
to the damage state of the tissue. In this manner, itwould be possible to diagnose diffuse damage in thetissue while it is still intact and predict risk of addi-tional injury with continued function. With increasingpopularity and capabilities of noninvasive force mea-surements, there is potential for measurement of dif-fuse damage in vivo, which is currently not possibleusing imaging modalities such as conventional MRI orultrasound (unlike focal defect damages which arereadily visualized by such technologies).
The stress relaxation behavior of tendons wasmodeled by determining the equivalent strain experi-enced by the tendons following subfailure damageinduced by overstretch to 6.5, 9, or 13% strain. Usingthe calculated strain-dependent behaviors of the vari-ous parameters, the equivalent strain could be substi-tuted in for applied strain and thus the post-damageparameters could be calculated and used for modelcalculations. While this study only demonstrated theability to fit stress relaxation behavior with Schapery’sviscoelastic model, this ‘‘equivalent strain’’ approachcould be used in any constitutive model provided theparameter strain-dependence is known.
While this equivalent strain approach does a goodjob of modeling the mechanical compromise that existsimmediately after overstretch, it has a few inherentlimitations. First, it only considers the post-damagemechanical properties gathered in the time windowimmediately after damage (~17 min–1 h). We havepreviously shown that the recovery from moderateloading occurs slowly, requiring more time to fully re-cover from loading than the length of the loading test.1
It is not unreasonable to assume that the recovery fol-lowing large strains would require an even longer timeperiod (on the order of several hours or more) to fullyrecover the mechanical parameters. Thus, damagecould potentially be described as a function of time,with partial recovery of mechanical properties possibleover extended periods of time, independent of biologi-cal repair that would occur in vivo.
A second limitation is the lack of consideration ofthe biological response to overstretch, which is animportant factor in in vivo injury response. During theshort time period examined in this study, there wouldlikely be limited effects due to cellular response, butultimately the healing and remodeling response of thetendon would likely alter both the elastic and visco-elastic properties over time.
An interesting result is the fact that the magnitudeof the error between test data and the models is largerfollowing a pull to 13% strain than either 6.5 or 9%strain. This is likely due to the fact that as the failurestrain (reported to be 15–20%5,12) is approached, themodel moves from a subfailure, microdamage model
(seen after pulls to 6.5 or 9% strain) to a partial failure,macrodamage model. Due to biologic variation, sometendons may be nearly failed at 13% while others arestill only sustaining microdamage.
Diffuse damage induced by deforming tendons tostrains outside of normal activity (but less than failurestrain) affects a multitude of parameters. Elastic andviscoelastic parameters, obtained during stress relaxa-tion and cyclic testing, were significantly decreasedfollowing damage. Furthermore, these effects becomemore pronounced as the strain during the overstretchpull increases. The strain-dependent mechanical param-eters of tendons after subfailure damage behaved as ifthe tendon was being pulled to a lower strain level,validating the use of an effective strain model. Bydetermining the effective strain level and using it tocalculate predicted values of post-damage mechanicalparameters, it was possible using both the overstretchstrain value as well as the ratio of the post-damage topre-damage stress–strain curve slopes to predictthe stress relaxation behavior of the tendon with theSchapery nonlinear viscoelastic model. Thus, if thestrain-dependence of the parameters can be deter-mined, it is possible to anticipate the post-damagemechanical behavior of tendons. The slope-basedestimation of effective strain holds particular promise,as a stress–strain curve can be generated followingdamage induced by methods other than overstretch,and thus estimation of effective strain in this mannercan be pursued for damage caused by methods suchas repetitive loading or laceration. Additionally, asmethods for noninvasive loading and strain measure-ment improve, information from a stress–strain curvecan be used to estimate a multitude of mechanicalparameters to better assess tissue function followinginjury.
In conclusion, we have quantified how elastic andviscoelastic behaviors in tendon are altered as afunction of subfailure overstretch, how these behaviorchanges can be interpreted as damage, and how thesedamage-induced changes in parameters are interre-lated. This altered response can be described by theeffective strain model, in which the tendon is modeledas if it were being pulled to a lower (effective) strain.We have demonstrated that a single, measurableparameter (effective strain) can account for all of theelastic and viscoelastic changes with damage, androbustly be predictive of tendon behavior. Finally, wehave modeled these behavior changes with a nonlin-ear viscoelastic model (Schapery’s nonlinear visco-elastic model). Such experiments and modelingdevelop a better understanding of tendon mechanicsand better anticipate the sequelae of such eventsin vivo.
DUENWALD-KUEHL et al.1706
ACKNOWLEDGMENTS
This work was funded by NSF award 0553016. Theauthors would like to thank Ron McCabe for histechnical assistance.
REFERENCES
1Duenwald, S. E., R. Vanderby, and R. S. Lakes. Visco-elastic relaxation and recovery of tendon. Ann. Biomed.Eng. 37(6):1131–1140, 2009.2Duenwald, S. E., R. Vanderby, and R. S. Lakes. Stressrelaxation and recovery in tendon and ligament: experi-ment and modeling. Biorheology 47(1):1–14, 2010.3Gardiner, J. C., J. A. Weiss, and T. D. Rosenberg. Strain inthe human medial collateral ligament during valgus load-ing of the knee. Clin. Orthop. Relat. Res. 391:266–274,2001.4Hokanson, J., and S. Yazdani. A constitutive model of theartery with damage. Mech. Res. Commun. 24(2):151–159,1997.5Johnson, G. A., D. M. Tramaglini, R. E. Levine, K. Ohno,N. Y. Choi, and S. L. Woo. Tensile and viscoelastic
properties of human patellar tendon. J. Orthop. Res.12(6):796–803, 1994.6Lemaitre, J. How to use damage mechanics. Nucl. Eng.Des. 80(2):233–245, 1984.7Lochner, F. K., D. W. Milne, E. J. Mills, and J. J. Groom.In vivo and in vitro measurement of tendon strain in thehorse. Am. J. Vet. Res. 41(12):1929–1937, 1980.8Natali, A. N., P. G. Pavan, E. L. Carniel, M. E. Lucisano,and G. Taglialavoro. Anisotropic elasto-damage constitu-tive model for the biomechanical analysis of tendons. Med.Eng. Phys. 27(3):209–214, 2005.9Perry, S. M., C. L. Getz, and L. J. Soslowsky. After rotatorcuff tears, the remaining (intact) tendons are mechanicallyaltered. J. Shoulder Elbow Surg. 18(1):52–57, 2009.
10Provenzano, P. P., D. Heisey, K. Hayashi, R. Lakes, andR. Vanderby. Subfailure damage in ligament: a structuraland cellular evaluation. J. Appl. Physiol. 92(1):362–371,2002.
11Schapery, R. A. On the characterization of nonlinear vis-coelastic materials. Polym. Eng. Sci. 9(4):295–310, 1969.
12Shadwick, R. E. Elastic energy storage in tendons:mechanical differences related to function and age. J. Appl.Physiol. 68(3):1033–1040, 1990.
13Simo, J. C. On a fully three-dimensional finite-strain vis-coelastic damage model: formulation and computationalaspects. Comput. Methods Appl. Mech. Eng. 60(2):153–173,1987.


![Flexor Tendon Injuries[1]](https://static.documents.pub/doc/80x56/546eeaf2b4af9f8c068b465a/flexor-tendon-injuries1-558457890f347.jpg)


