Page 1
Proceedings of the 3rd International Conference on Civil, Structural and Transportation Engineering (ICCSTE'18)
Niagara Falls, Canada – June 10 – 12, 2018
Paper No. 103
DOI: 10.11159/iccste18.103
103-1
Damage Mitigation in Reinforced Concrete Shear Walls Detailed with SMA and SFRC
Mohammad Javad Tolou Kian, Carlos Cruz Noguez Department of Civil and Environmental Engineering, University of Alberta
116 St. and 85 Ave., Edmonton, Canada
[email protected] ; [email protected]
Abstract - Today, several studies are conducted to improve the performance of existing structural systems through overcoming the
intrinsic limitations of conventional materials and construction techniques. For instance, well-designed conventional structures exhibit
satisfactory resistance and ductility under seismic forces. However, they sustain significant damage, which can be identified through
two indicators – the amount permanent lateral deformations and the extent of sustained local damage.
The current paper presents the findings of an experimental study on reinforced concrete (RC) shear walls with improved damage
resilience properties. The study included testing of a shear wall reinforced with shape memory alloy (SMA) and conventional steel to
reduce residual deformations while maintaining acceptable levels of energy dissipation. Also, for further damage mitigation purposes,
the wall was cast with steel fibre reinforced concrete (SFRC), which has improved post-cracking behaviour over normal concrete. As
test results revealed, the innovative shear wall sustained less residual drift ratios and concrete damage in comparison to a
conventionally built RC specimen. The innovative shear wall also showed significant improvements in ultimate drift ratio due to the
elimination of the outmost rebar rupturing. The innovative wall had a higher initial stiffness with respect to the control wall. The wall
also dissipated significant amounts of energy.
Keywords: Reinforced concrete walls, Post-earthquake damage, Shape memory alloy (SMA), Steel fibre reinforced
concrete (SFRC).
1. Introduction Shape memory alloy (SMA) is an advanced material which can exhibits super-elastic properties upon un-loading. In
recent years, the application of SMA in structural engineering has appealed many researchers since the material can
enhance the post-earthquake performance of structural systems by reducing residual displacements. Saiidi et al. [1-3], and
Cruz Noguez and Saiidi [4] performed pilot studies on reinforced concrete (RC) bridge piers detailed with SMA bars. The
studies showed that the innovative piers had significantly reduced residual deformations after resisting seismic loads.
Alam et al. [5-6] studied the application of SMA reinforcement in RC frame buildings. The studies showed that steel-
SMA reinforced frames could effectively recover their inter-story and top-story residual drift ratios after being un-loaded.
Abdulridha et al. [7-8] studied a steel reinforced concrete shear wall detailed SMA bars. The results showed that the
innovative shear wall with a hybrid steel-SMA reinforcing system had notable self-centring while maintaining comparable
strength and maximum drift ratio to those of a conventional RC shear wall specimen.
It has also been shown through several experimental studies that fibre reinforcement can play a significant role in
damage mitigation of RC structural elements because of the contribution of the fibres bridging cracks in resisting tensile
stresses. Athanasopoulou and Parra-Montesinos [9] investigated the seismic behaviour of low-rise shear walls detailed with
high performance fibre reinforced concrete. Although the specimens had simplified reinforcement, they demonstrated less
critical strength degradation compared to conventional RC shear walls.
2. Experimental Program In this section, material properties and test specimens are discussed.
Page 2
103-2
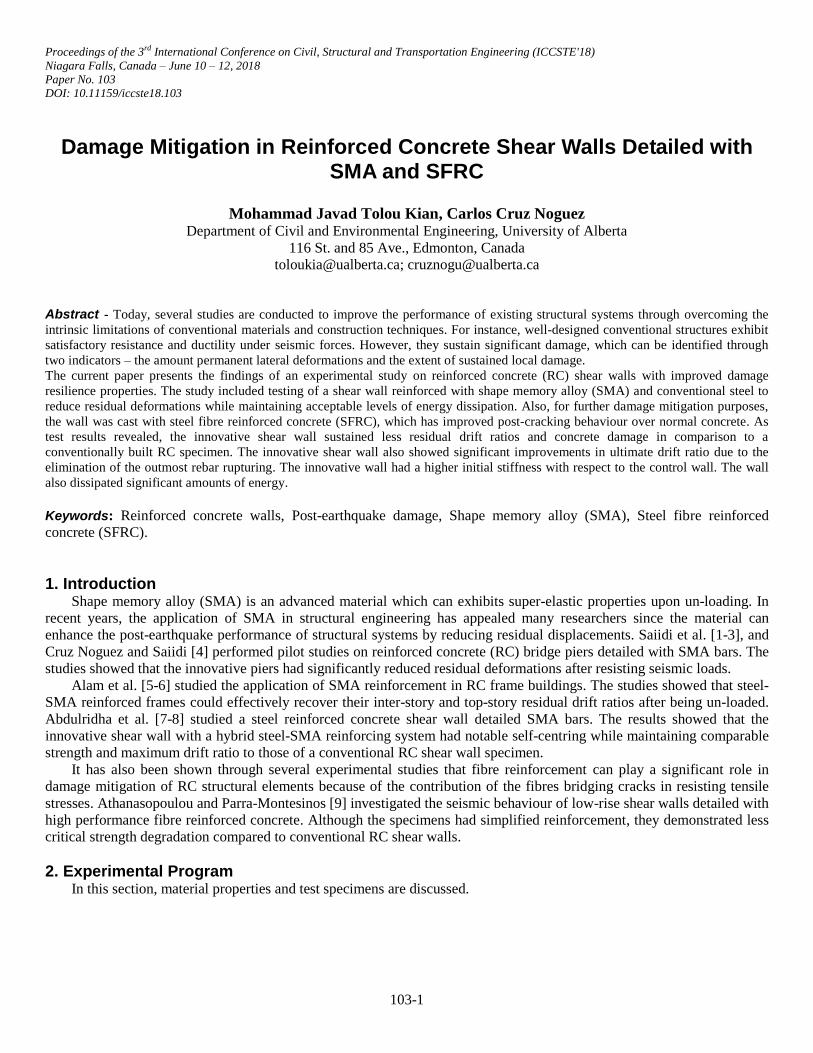
2.1. Material Properties The materials used in this study are classified into two categories – cementitious and reinforcing materials. The
cementitious materials included concrete and SFRC. The SFRC material incorporated hooked-end, 50 mm long steel fibres
with an aspect ratio of 55, and a volumetric fraction of 0.75. The compressive strengths of the concrete and the SFRC
materials were 48 MPa and 51 MPa respectively. To identify the tensile behaviour of SFRC, crack mouth opening
displacements (CMOD) of notched beams under four-point loading are studied as shown in Fig. 1(a). As can be seen the
material exhibited an improved post-cracking behaviour in comparison to typical concrete.
Figure 1(b) illustrates the results of two cyclic coupon tests performed on specimens of Nickel-Titanium (NiTi) and
mild steel rebars used in the construction of specimens. The test results revealed that NiTi bars had an upper plateau
strength of 330 MPa and a peak stress of 890 MPa. As illustrated in Fig. 1(b), the NiTi bars could almost recover strains of
6% upon un-loading. The steel bar had yielding and peak strengths of 421 MPa and 634 MPa respectively. Steel specimens
also showed significant amounts of residual strains after un-loading in comparison to NiTi specimens.
Fig. 1: Material properties (a) load-CMOD relationship of an SFRC beam specimen versus typical concrete (b) Cyclic stress-
strain relationship of an NiTi bar in comparison to a 10M steel rebar.
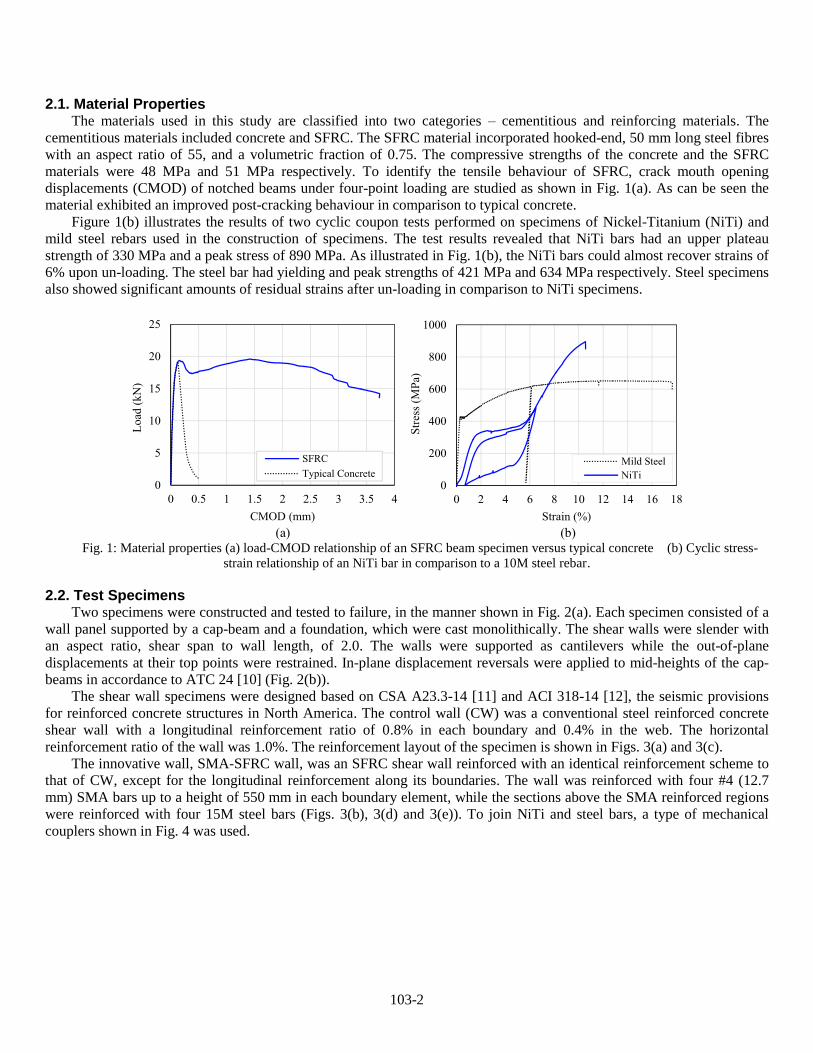
2.2. Test Specimens Two specimens were constructed and tested to failure, in the manner shown in Fig. 2(a). Each specimen consisted of a
wall panel supported by a cap-beam and a foundation, which were cast monolithically. The shear walls were slender with
an aspect ratio, shear span to wall length, of 2.0. The walls were supported as cantilevers while the out-of-plane
displacements at their top points were restrained. In-plane displacement reversals were applied to mid-heights of the cap-
beams in accordance to ATC 24 [10] (Fig. 2(b)).
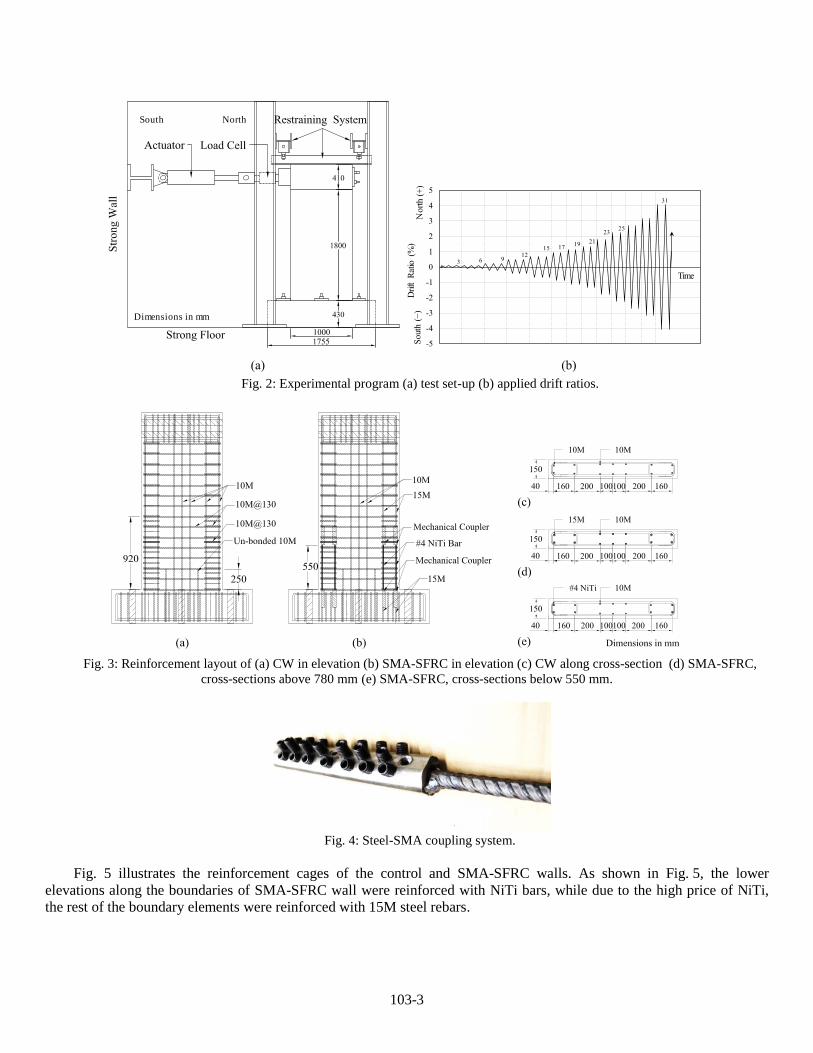
The shear wall specimens were designed based on CSA A23.3-14 [11] and ACI 318-14 [12], the seismic provisions
for reinforced concrete structures in North America. The control wall (CW) was a conventional steel reinforced concrete
shear wall with a longitudinal reinforcement ratio of 0.8% in each boundary and 0.4% in the web. The horizontal
reinforcement ratio of the wall was 1.0%. The reinforcement layout of the specimen is shown in Figs. 3(a) and 3(c).
The innovative wall, SMA-SFRC wall, was an SFRC shear wall reinforced with an identical reinforcement scheme to
that of CW, except for the longitudinal reinforcement along its boundaries. The wall was reinforced with four #4 (12.7
mm) SMA bars up to a height of 550 mm in each boundary element, while the sections above the SMA reinforced regions
were reinforced with four 15M steel bars (Figs. 3(b), 3(d) and 3(e)). To join NiTi and steel bars, a type of mechanical
couplers shown in Fig. 4 was used.
Page 3
103-3
Dimensions in mm
South North
Fig. 2: Experimental program (a) test set-up (b) applied drift ratios.
Fig. 3: Reinforcement layout of (a) CW in elevation (b) SMA-SFRC in elevation (c) CW along cross-section (d) SMA-SFRC,
cross-sections above 780 mm (e) SMA-SFRC, cross-sections below 550 mm.
Fig. 4: Steel-SMA coupling system.
Fig. 5 illustrates the reinforcement cages of the control and SMA-SFRC walls. As shown in Fig. 5, the lower
elevations along the boundaries of SMA-SFRC wall were reinforced with NiTi bars, while due to the high price of NiTi,
the rest of the boundary elements were reinforced with 15M steel rebars.
Page 4
103-4
(a) (b)
Fig. 5: Reinforcement cage at the base of (a) CW (b) SMA-SFRC.
3. Experimental Results In this section, damage propagation, hysteretic response and hysteretic properties of the specimens are discussed.
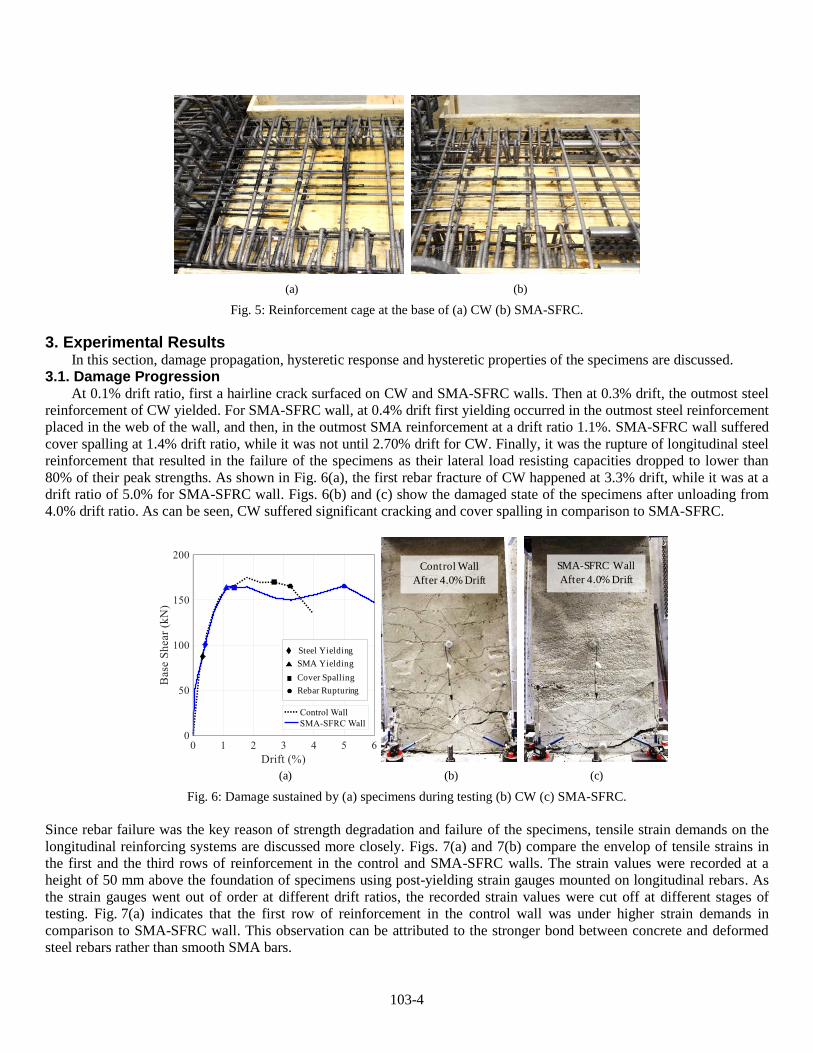
3.1. Damage Progression At 0.1% drift ratio, first a hairline crack surfaced on CW and SMA-SFRC walls. Then at 0.3% drift, the outmost steel
reinforcement of CW yielded. For SMA-SFRC wall, at 0.4% drift first yielding occurred in the outmost steel reinforcement
placed in the web of the wall, and then, in the outmost SMA reinforcement at a drift ratio 1.1%. SMA-SFRC wall suffered
cover spalling at 1.4% drift ratio, while it was not until 2.70% drift for CW. Finally, it was the rupture of longitudinal steel
reinforcement that resulted in the failure of the specimens as their lateral load resisting capacities dropped to lower than
80% of their peak strengths. As shown in Fig. 6(a), the first rebar fracture of CW happened at 3.3% drift, while it was at a
drift ratio of 5.0% for SMA-SFRC wall. Figs. 6(b) and (c) show the damaged state of the specimens after unloading from
4.0% drift ratio. As can be seen, CW suffered significant cracking and cover spalling in comparison to SMA-SFRC.
SMA-SFRC Wall
After 4.0% Drift
Steel Yielding
SMA Yielding
Cover Spalling
Rebar Rupturing
(a) (b) (c)
Control Wall
After 4.0% Drift
Fig. 6: Damage sustained by (a) specimens during testing (b) CW (c) SMA-SFRC.
Since rebar failure was the key reason of strength degradation and failure of the specimens, tensile strain demands on the
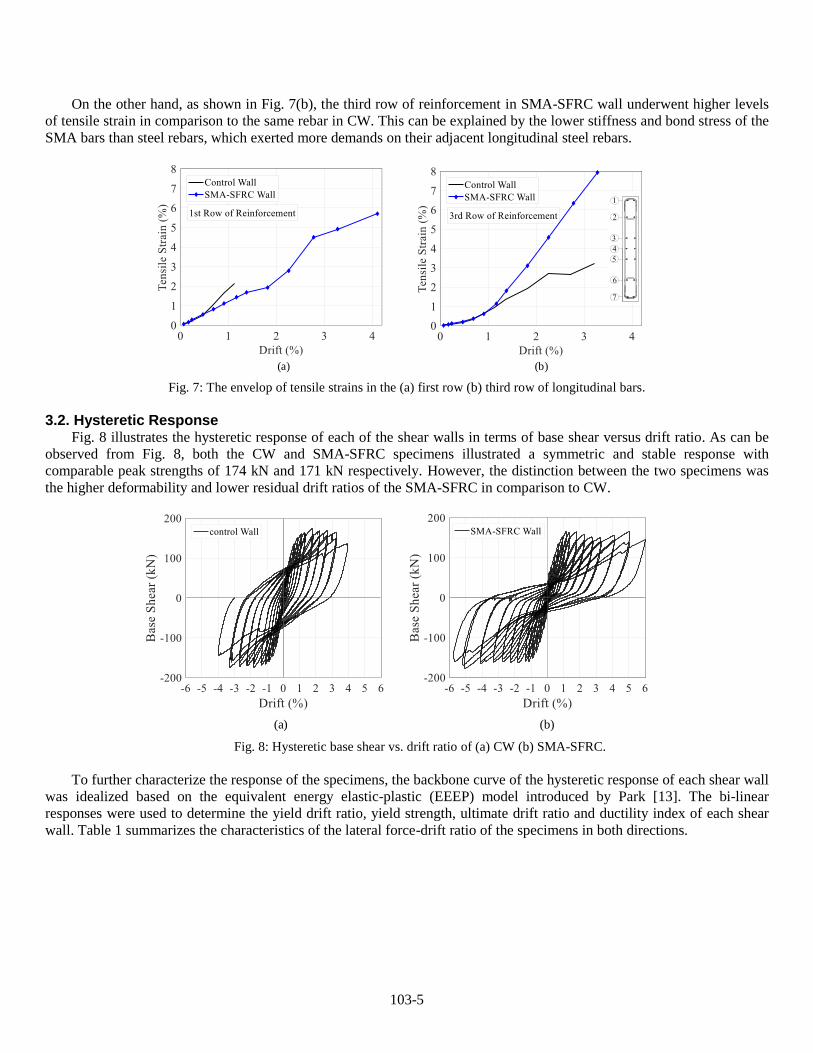
longitudinal reinforcing systems are discussed more closely. Figs. 7(a) and 7(b) compare the envelop of tensile strains in
the first and the third rows of reinforcement in the control and SMA-SFRC walls. The strain values were recorded at a
height of 50 mm above the foundation of specimens using post-yielding strain gauges mounted on longitudinal rebars. As
the strain gauges went out of order at different drift ratios, the recorded strain values were cut off at different stages of
testing. Fig. 7(a) indicates that the first row of reinforcement in the control wall was under higher strain demands in
comparison to SMA-SFRC wall. This observation can be attributed to the stronger bond between concrete and deformed
steel rebars rather than smooth SMA bars.
Page 5
103-5
On the other hand, as shown in Fig. 7(b), the third row of reinforcement in SMA-SFRC wall underwent higher levels
of tensile strain in comparison to the same rebar in CW. This can be explained by the lower stiffness and bond stress of the
SMA bars than steel rebars, which exerted more demands on their adjacent longitudinal steel rebars.
(a) (b)
Fig. 7: The envelop of tensile strains in the (a) first row (b) third row of longitudinal bars.
3.2. Hysteretic Response Fig. 8 illustrates the hysteretic response of each of the shear walls in terms of base shear versus drift ratio. As can be
observed from Fig. 8, both the CW and SMA-SFRC specimens illustrated a symmetric and stable response with
comparable peak strengths of 174 kN and 171 kN respectively. However, the distinction between the two specimens was
the higher deformability and lower residual drift ratios of the SMA-SFRC in comparison to CW.
(a) (b)
Fig. 8: Hysteretic base shear vs. drift ratio of (a) CW (b) SMA-SFRC.
To further characterize the response of the specimens, the backbone curve of the hysteretic response of each shear wall
was idealized based on the equivalent energy elastic-plastic (EEEP) model introduced by Park [13]. The bi-linear
responses were used to determine the yield drift ratio, yield strength, ultimate drift ratio and ductility index of each shear
wall. Table 1 summarizes the characteristics of the lateral force-drift ratio of the specimens in both directions.
Page 6
103-6
Table 1: Lateral force-drift characteristics of specimens.
Positive Drift Ratios Negative Drift Ratios
Specimen Yield
Drift (%)
Ultimate
Drift (%) Ductility
Yield
Strength
(kN)
Yield Drift
(%)
Ultimate
Drift (%) Ductility
Yield
Strength
(kN)
CW 0.48 3.92 8.13 159.9 −0.62 −3.98 6.42 −165.9
SMA-
SFRC 0.42 6.10 14.44 153.5 −0.40 −5.62 14.09 −159.7
3.2. Hysteretic Properties
Fig. 9(a) illustrates the peak-to-peak stiffness values of the specimens at different drift ratios. As demonstrated in the
figure, the control specimen, which was made of normal concrete, had a lower initial stiffness in comparison to the SMA-
SFRC wall. However, when SMA-SFRC wall was cracked, the specimen had a comparable level of stiffness to that of the
CW. In addition, lower stiffness values were associated with the second repetition of cycles as the specimens were more
damaged in comparison to the first cycles at each drift ratio.
Fig. 9(b) shows the residual drift ratios of specimens associated to the first and the second cycles at each target drift
ratio throughout testing. As can be seen from Fig. 9(b), the residual drift ratios in the first and the second cycles at each
drift ratio were almost the same. For drift ratios beyond −0.9% and 0.7%, SMA-SFRC wall started to have reduced
residual drift ratios with respect to the control wall. For instance, after drift ratios of 3.3% and −3.3%, SMA-SFRC wall
had permanent drift ratios of 1.4% and −1.7% respectively, which were associated to 35% and 24% decrease with respect
to CW.
(a) (b)
Fig. 9: Hysteretic properties of specimens (a) peak-to-peak stiffness (b) residual drift ratio.
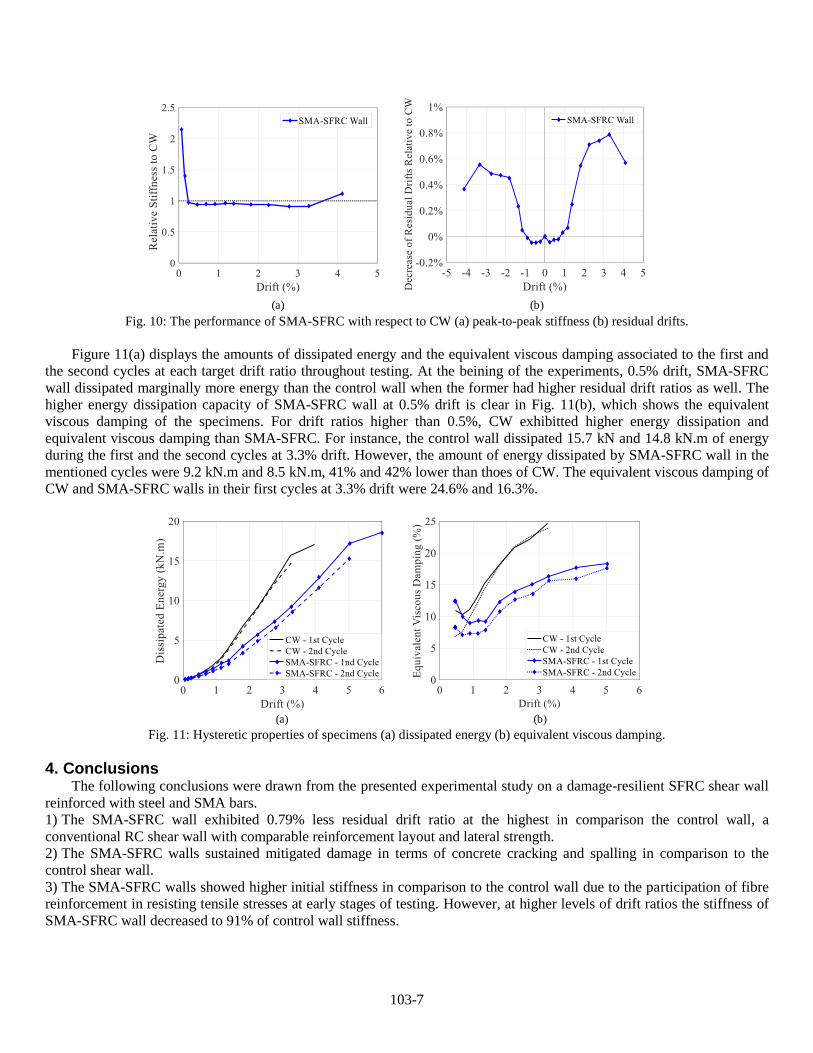
Fig. 10(a) shows the peak-to-peak stiffness of SMA-SFRC wall relative to that of CW in the first cycles at each target
drift ratio. As shown in Fig. 10(a), the innovative wall had a higher initial stiffness which decreased to just below of CW
stiffness after cracking. The minimum of the relative stiffness of SMA-SFRC wall to CW was 0.91, and occurred at a drift
ratio of 3.3%.
Fig. 10(b) illustrates the difference between the residual drift ratios of SMA-SFRC and CW in the first cycle at each
target drift ratio. As shown in Fig. 10(b), For drift ratios between −0.9% and 0.7% SMA-SFRC wall showed marginally
higher residual drifts than CW. However, SMA-SFRC wall started to have reduced residual drift ratios as testing
progressed. At a drift ratio of 3.3% the difference between residual drift ratios of SMA-SFRC and CW walls were 0.79%.
This number changed to 0.56% after un-loading from −3.3% drift ratio.
Page 7
103-7
(a) (b) Fig. 10: The performance of SMA-SFRC with respect to CW (a) peak-to-peak stiffness (b) residual drifts.
Figure 11(a) displays the amounts of dissipated energy and the equivalent viscous damping associated to the first and
the second cycles at each target drift ratio throughout testing. At the beining of the experiments, 0.5% drift, SMA-SFRC
wall dissipated marginally more energy than the control wall when the former had higher residual drift ratios as well. The
higher energy dissipation capacity of SMA-SFRC wall at 0.5% drift is clear in Fig. 11(b), which shows the equivalent
viscous damping of the specimens. For drift ratios higher than 0.5%, CW exhibitted higher energy dissipation and
equivalent viscous damping than SMA-SFRC. For instance, the control wall dissipated 15.7 kN and 14.8 kN.m of energy
during the first and the second cycles at 3.3% drift. However, the amount of energy dissipated by SMA-SFRC wall in the
mentioned cycles were 9.2 kN.m and 8.5 kN.m, 41% and 42% lower than thoes of CW. The equivalent viscous damping of
CW and SMA-SFRC walls in their first cycles at 3.3% drift were 24.6% and 16.3%.
(a) (b) Fig. 11: Hysteretic properties of specimens (a) dissipated energy (b) equivalent viscous damping.
4. Conclusions The following conclusions were drawn from the presented experimental study on a damage-resilient SFRC shear wall
reinforced with steel and SMA bars.
1) The SMA-SFRC wall exhibited 0.79% less residual drift ratio at the highest in comparison the control wall, a
conventional RC shear wall with comparable reinforcement layout and lateral strength.
2) The SMA-SFRC walls sustained mitigated damage in terms of concrete cracking and spalling in comparison to the
control shear wall.
3) The SMA-SFRC walls showed higher initial stiffness in comparison to the control wall due to the participation of fibre
reinforcement in resisting tensile stresses at early stages of testing. However, at higher levels of drift ratios the stiffness of
SMA-SFRC wall decreased to 91% of control wall stiffness.
Page 8
103-8
4) The SMA-SFRC wall exhibited substantial improvement over the control wall in terms of ultimate drift ratio as the
SMA bars along the boundaries of SMA-SFRC wall did not rupture during testing.
5) The SMA-SFRC wall had a lower energy dissipation capacity in comparison to the control wall as the hysteretic
response of the specimen was more pinched than that of the control wall.
References [1] M. S. Saiidi and H. Wang, “Exploratory study of seismic response of concrete columns with shape memory alloys
reinforcement,” ACI Struct. J., vol. 103, no. 3, pp. 436-443, 2006.
[2] M. S. Saiidi, M. Sadrossadat-Zadeh, C. Ayoub and A. Itani, “Pilot study of behavior of concrete beams reinforced
with shape memory alloys,” J. Mater. Civil Eng., vol. 19, no. 6, pp. 454-461, 2007.
[3] M. S. Saiidi, M. O’Brien and S. Z. Mahmoud, “Cyclic response of concrete bridge columns using superelastic
nitinol and bendable concrete,” ACI Struct. J., vol. 106, no. 1, pp. 69-77, 2009.
[4] C. A. Cruz Noguez and M. S. Saiidi, “Shake-table studies of a four-span bridge model with advanced materials,” J.
Struct. Eng., vol. 138, no. 2, pp. 183-192, 2012.
[5] M. S. Alam, M. Moni, and S. Tesfamariam, “Seismic overstrength and ductility of concrete buildings reinforced
with superelastic shape memory alloy rebar,” Eng. Struct., vol. 34, pp. 8-20, 2012.
[6] M. S. Alam, M. Nehdi and M. A. Youssef, “Seismic performance of concrete frame structures reinforced with
superelastic shape memory alloys,” Smart Struct. Syst., vol. 5, no. 5, pp. 565-585, 2009.
[7] A. Abdulridha, “Performance of superelastic shape memory alloy reinforced concrete elements subjected to
monotonic and cyclic loading,” Ph.D. dissertation, Dept. Civil Eng., Uni. Ottawa, Ottawa, ON.
[8] A. Abdulridha, D. Palermo, S. Foo and F. J. Vecchio, “Behavior and modeling of superelastic shape memory alloy
reinforced concrete beams,” Eng. Struct., vol. 49, pp. 893-904, 2013.
[9] A. Athanasopoulou and G. Parra-montesinos, “Experimental study on the seismic behavior of high- performance
fiber-reinforced concrete low-rise walls,” ACI Struct. J., vol. 110, no. 5, pp. 767-777, 2014.
[10] Applied Technology Council (ATC), Guidelines for cyclic seismic testing of components of steel structures. ATC
24, Redwood City, CA, 1992.
[11] Canadian Standards Association (CSA), Design of concrete structures. CSA A23.3-14, Mississauga, ON, 2014.
[12] American Concrete Institute (ACI), Building code requirements for structural concrete. ACI 318-14, Farmington
Hills, MI, 2014.
[13] R. Park, Ductility evaluation from laboratory and analytical testing. Ninth World Conference on Earthquake
Engineering, Tokyo-Kyoto, 1988, pp. 605-616.


![Time-dependent Analysis of Macro-synthetic FRC … · Time-dependent Analysis of Macro ... creep and shrinkage on the time-dependent behaviour of ... reinforced concrete (SFRC) [2],](https://static.documents.pub/doc/80x56/5ac593847f8b9a220b8d6ddd/time-dependent-analysis-of-macro-synthetic-frc-analysis-of-macro-creep-and.jpg)


