Page 1
American Institute of Aeronautics and Astronautics
1
Damping Effects of Drogue Parachutes on Orion Crew
Module Dynamics
Vanessa V. Aubuchon1 and D. Bruce Owens2
NASA Langley Research Center, Hampton, Virginia, 23681
Because simulations of the Orion Crew Module (CM) dynamics with drogue parachutes
deployed were under-predicting the amount of damping seen in free-flight tests, an attach-
point damping model was applied to the Orion system. A key hypothesis in this model is that
the drogue parachutes’ net load vector aligns with the CM drogue attachment point velocity
vector. This assumption seems reasonable and has historically produced good results, but has
never been experimentally verified. The wake of the CM influences the drogue parachutes,
which makes performance predictions of the parachutes difficult. Many of these effects are
not currently modeled in the simulations.
A forced oscillation test of the CM with parachutes was conducted in the NASA LaRC 20-
Ft Vertical Spin Tunnel (VST) to gather additional data to validate and refine the attach-point
damping model. A second loads balance was added to the original Orion VST model to
measure the drogue parachute loads independently of the CM. The objective of the test was
to identify the contribution of the drogues to CM damping and provide additional information
to quantify wake effects and the interactions between the CM and parachutes. The drogue
parachute force vector was shown to be highly dependent on the CM wake characteristics.
Based on these wind tunnel test data, the attach-point damping model was determined to be a
sufficient approximation of the parachute dynamics in relationship to the CM dynamics for
preliminary entry vehicle system design. More wake effects should be included to better model
the system.
Nomenclature
AF = axial force, lbs
CA = axial force coefficient
CD = drag coefficient
CF = parachute drogue line force coefficient
Cm = pitching moment coefficient
Cmα = longitudinal static stability, ∂Cm/∂α, deg-1
Cmq = pitching moment derivative, 𝜕𝐶𝑚
𝜕(𝑞∙𝐿𝑟𝑒𝑓/2𝑉∞)+
𝜕𝐶𝑚
𝜕(�̇�∙𝐿𝑟𝑒𝑓/2𝑉∞), rad-1
Cn = yawing moment coefficient
Cnr = yawing moment derivative, 𝜕𝐶𝑛
𝜕(𝑟∙𝐿𝑟𝑒𝑓/2𝑉∞)−
𝜕𝐶𝑛
𝜕(�̇�∙𝐿𝑟𝑒𝑓/2𝑉∞)cos 𝛼, rad-1
k = reduced frequency, ω*Lref/2V∞
Lref = model reference length, ft
NF = normal force, lbs
q = pitch rate, deg/ s
�̂�𝑚𝑎𝑥 = maximum non-dimensional pitch rate, 𝑞𝑚𝑎𝑥 ∙ 𝐿𝑟𝑒𝑓/2𝑉∞
�̅� = dynamic pressure, lbs/ft2
R = distance from CM center of gravity to parachute attach point
S = parachute laid-out-flat area, ft2
Sref = model reference area, ft2
V∞ = freestream velocity, ft/ s
α = angle of attack, deg
1 Aerospace Engineer, Flight Dynamics Branch, Mail Stop 308. 2 Aerospace Engineer, Flight Dynamics Branch, Mail Stop 308, Associate Fellow.
https://ntrs.nasa.gov/search.jsp?R=20160011468 2020-04-15T22:33:57+00:00Z
Page 2
American Institute of Aeronautics and Astronautics
2
β = angle of sideslip, deg
Δθ = angle between V∞ and the parachute force vector
ω = oscillatory frequency, rad/ s
I. Introduction
HE objective of the research presented in this paper is to examine clustered drogue parachute behavior in a blunt-
body reentry vehicle’s wake and the effect of the parachute behavior on the vehicle’s dynamics. Specifically, this
research is needed to validate a simple Apollo-era mathematical model of the drogue parachutes’ effects on Orion
Crew Module (CM) dynamics – called the attach-point damping model.
Because simulation predictions of the CM dynamics with drogue parachutes deployed were under-predicting the
amount of aerodynamic damping for the combined CM-drogue system compared to that seen in free-flight tests, the
attach-point damping model was applied to the Orion system. The model was applied to predict CM damping under
drogue parachutes for both NASA Langley 20-Foot Vertical Spin Tunnel (VST) sub-scale free flights and the Pad
Abort-1 full-scale flight test. Comparisons between the attach-point damping prediction method and test data are
favorable.
A key hypothesis in the attach-point damping model is that the drogue parachutes’ net load vector aligns with the
CM drogue attachment point velocity vector. This assumption seems reasonable and produces good results, but has
never been experimentally verified.
A forced oscillation test of the CM with parachutes was conducted in the VST to gather additional data to validate
and refine the attach-point damping model. A second loads balance was added to the original VST model to measure
the drogue parachute loads independently of the CM. The wake of the CM influences the drogue parachutes, which
makes performance predictions of the parachutes difficult. Significant interactions exist between the CM and the
drogue parachutes, which vary with CM angle of attack. Many of these effects are not currently modeled in the
simulations, and what is modeled is not anchored to configuration-specific test data. The objective of the test was to
identify the contribution of the drogues to total CM damping and provide additional information to quantify wake
effects and the interactions between the CM and parachutes. These results were used to improve simulation model
fidelity for CM flight with drogues deployed [1].
II. Overview
A. Overview of Orion Multi-Purpose Crew Vehicle (MPCV)
NASA’s plan for human space exploration consists of a series of increasingly challenging missions, eventually to
Mars [2] [3]. Orion will serve as the exploration vehicle that will carry the crew to space, provide emergency abort
capability, sustain the crew during the space travel, and provide safe re-entry from deep space return velocities. The
Orion Multi-Purpose Crew Vehicle (MPCV) is shown in Figure 1. The Launch Abort System, positioned above the
Crew Module, pulls the crew to safety and positions the module for a safe landing. The Crew Module is capable of
transporting four crew members beyond low-Earth orbit, providing a safe habitat from launch through landing and
recovery. The Service Module provides support to the Crew Module from launch through Crew Module separation
prior to entry and provides in-space propulsion capability for orbital transfer, attitude control, and high altitude ascent
aborts.
T
Page 3
American Institute of Aeronautics and Astronautics
3
Figure 1. Orion Multi-Purpose Crew Vehicle (MPCV) (Image credit: NASA).
During reentry, drogue parachutes provide damping of vehicle oscillations and drag to slow down the vehicle for
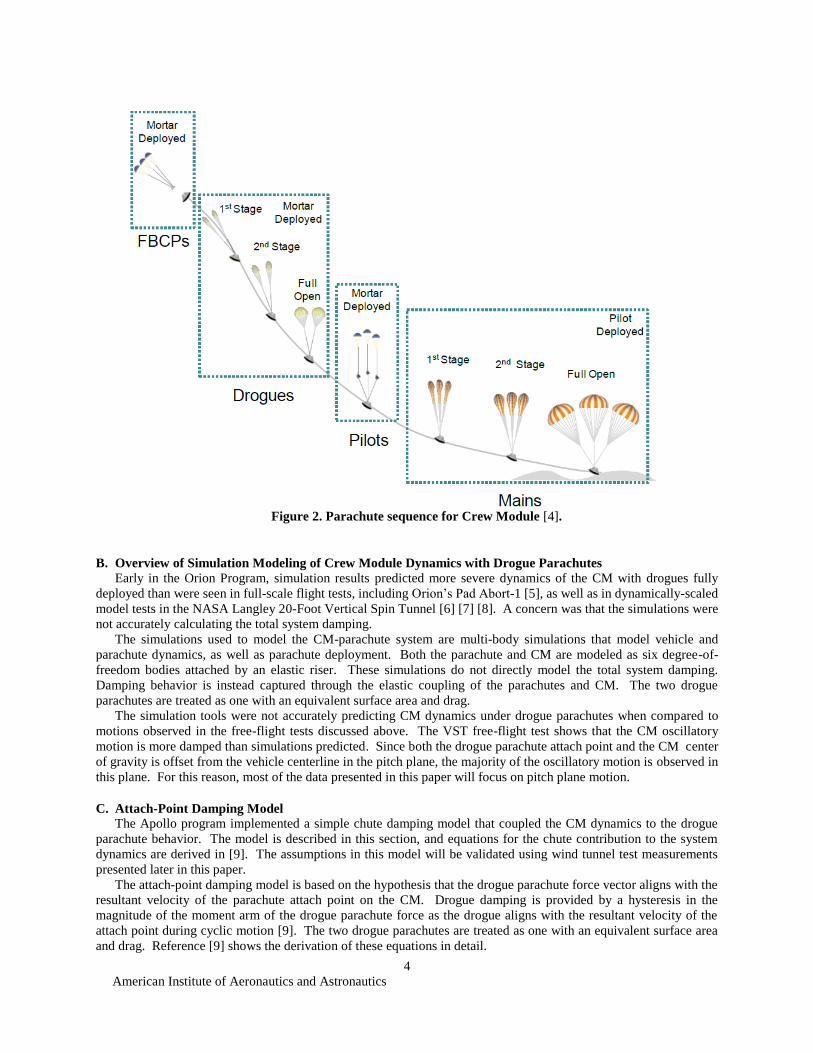
successful deployment of main parachutes. The reentry parachute sequence is presented in Figure 2. CM flight under
the drogue parachutes occurs both during nominal reentry and during descent after an abort from a failed launch. First,
a mortar is deployed and three Forward Bay Cover parachutes (FBCPs) are released to remove the Forward Bay Cover
(FBC). Then, a mortar deploys two drogue parachutes, which have two reefing stages before they are fully opened.
The drogues are released and the pilot chutes are deployed to pull out three large main parachutes. The main
parachutes go through two reefing stages before they are fully opened and slow the CM for a water landing. The fully-
open drogue parachute part of the sequence is the focus of this research.
Page 4
American Institute of Aeronautics and Astronautics
4
Figure 2. Parachute sequence for Crew Module [4].
B. Overview of Simulation Modeling of Crew Module Dynamics with Drogue Parachutes
Early in the Orion Program, simulation results predicted more severe dynamics of the CM with drogues fully
deployed than were seen in full-scale flight tests, including Orion’s Pad Abort-1 [5], as well as in dynamically-scaled
model tests in the NASA Langley 20-Foot Vertical Spin Tunnel [6] [7] [8]. A concern was that the simulations were
not accurately calculating the total system damping.
The simulations used to model the CM-parachute system are multi-body simulations that model vehicle and
parachute dynamics, as well as parachute deployment. Both the parachute and CM are modeled as six degree-of-
freedom bodies attached by an elastic riser. These simulations do not directly model the total system damping.
Damping behavior is instead captured through the elastic coupling of the parachutes and CM. The two drogue
parachutes are treated as one with an equivalent surface area and drag.
The simulation tools were not accurately predicting CM dynamics under drogue parachutes when compared to
motions observed in the free-flight tests discussed above. The VST free-flight test shows that the CM oscillatory
motion is more damped than simulations predicted. Since both the drogue parachute attach point and the CM center
of gravity is offset from the vehicle centerline in the pitch plane, the majority of the oscillatory motion is observed in
this plane. For this reason, most of the data presented in this paper will focus on pitch plane motion.
C. Attach-Point Damping Model
The Apollo program implemented a simple chute damping model that coupled the CM dynamics to the drogue
parachute behavior. The model is described in this section, and equations for the chute contribution to the system
dynamics are derived in [9]. The assumptions in this model will be validated using wind tunnel test measurements
presented later in this paper.
The attach-point damping model is based on the hypothesis that the drogue parachute force vector aligns with the
resultant velocity of the parachute attach point on the CM. Drogue damping is provided by a hysteresis in the
magnitude of the moment arm of the drogue parachute force as the drogue aligns with the resultant velocity of the
attach point during cyclic motion [9]. The two drogue parachutes are treated as one with an equivalent surface area
and drag. Reference [9] shows the derivation of these equations in detail.
Page 5
American Institute of Aeronautics and Astronautics
5
The equivalent chute pitching moment coefficient slope with angle of attack, Chute Cmα, is in (2.1), and can be
simply added to the CM pitching moment slope, CM Cmα, to produce a total CM-chute pitching moment, Total Cmα.
𝐶ℎ𝑢𝑡𝑒 𝐶𝑚𝛼 = −(𝐶𝐷𝑆)𝑐ℎ𝑢𝑡𝑒 ∗ �̅�𝑐ℎ𝑢𝑡𝑒 ∗ 𝑅
�̅�𝐶𝑀 ∗ (𝑆𝑟𝑒𝑓𝑙𝑟𝑒𝑓)𝐶𝑀
(2.1)
The equivalent chute pitch damping coefficient is in (2.2), and can be added to the CM pitch damping to produce
a total CM-chute pitch damping coefficient.
𝐶ℎ𝑢𝑡𝑒 𝐶𝑚𝑞 = −2(𝐶𝐷𝑆)𝑐ℎ𝑢𝑡𝑒 ∗ �̅�𝑐ℎ𝑢𝑡𝑒 ∗ 𝑅2
(�̅�𝑆𝑟𝑒𝑓𝑙𝑟𝑒𝑓2 )𝐶𝑀
(2.2)
These simple Cmα and Cmq equations for the drogue parachute contribution could be used in preliminary design
of drogue parachute damping systems. As demonstrated in Reference [9], simulation results show that using either of
these equations or the build-up of the moment resulting from Δα and Δθ produce the same results, verifying a correct
derivation.
The attach-point damping model has been compared to both the Pad Abort-1 and VST subscale free-flight test data
[9]. The simulation-predicted angle matches the measured angle very well with the exception of a small time bias and
magnitude bias. The time bias, or time shift, correction needed is 0.05 seconds. The magnitude bias, or pitch angle
bias, correction is 7°. Many factors could give rise to the need for these adjustments, one of which is the wake behind
the CM biasing the chutes.
The previous VST subscale free-flight tests were also compared to simulation results with the attach-point damping
model. A slight adjustment was made to the drogue attach point location to achieve the proper trim angle of attack.
One possible explanation for this adjustment is that the translational velocity of the model in free flight in the VST
was ignored in modeling, which impacts the calculated angle of attack. A bias in the parachute force vector will also
have an effect on the trim angle of attack.
The attach-point damping model produces CM dynamics that are more representative of the damped vehicle
oscillations seen in free-flight tests than the two-body parachute simulations (e.g., DSS) are currently producing. If
the attach-point damping model assumptions can be validated, the attach-point damping model can be used to enhance
the high-fidelity two-body simulations, such as DSS, so that the CM dynamics with drogue parachutes are more
accurately modeled.
D. Validation of Attach-Point Damping Model through Wind Tunnel Testing
In order to validate the attach-point damping model, a wind tunnel test of the CM-drogue system was conducted
in the VST. The purpose of this wind tunnel test was to quantify the combined, as well as individual components, of
the damping of the CM-drogue system (in the form of dynamic derivatives) using the forced oscillation technique.
The data obtained from this wind tunnel test were used to assess the effectiveness of the drogue chutes in providing
rate damping for the CM. Both static and dynamic aerodynamics, including the effect of sideslip, reduced frequency,
and non-dimensional angular rate, were collected. The parachute riser line force vector was measured to validate the
attach-point damping model assumptions. The Pressure Recovery Fraction (PRF), or drag loss of the parachutes
caused by the CM wake having a reduced dynamic pressure, was also measured to ensure correct modeling of
parachute drag in the simulation. The induced effect of drogues on CM aerodynamics was also assessed. In addition,
the test provided data to assess the static and dynamic effects of a one-drogue-out scenario and provided insight into
the caveats associated with modeling two drogues as one in the simulation. It is believed that this is the first time
since the Apollo program that dynamic aerodynamics of an integrated capsule-drogue system have been measured
directly [10].
The unique combination of dynamic testing capabilities and specialized technician skills at the VST were used to
quickly adapt an existing model and parachutes for this test. Note that the Reynolds number for this test was much
lower than the flight Reynolds number, and there is a Reynolds number effect on dynamic derivatives as discussed in
Ref. [11]. However, as the first step in correctly modeling the flight dynamics of the CM-drogue system, the data
gathered in this test is being used to aid in reproducing similar dynamics in a simulation as was seen in free flight tests
in the VST—utilizing the same tunnel, test conditions, model, and parachutes. The simulation is populated with static
and dynamic aerodynamic data gathered from this test. This allows a rapid, inexpensive method of potentially
identifying a simulation modeling problem that may also apply at higher Reynolds numbers. Utilizing the VST in this
Page 6
American Institute of Aeronautics and Astronautics
6
manner also allows for an inexpensive method of identifying challenges and best practices for working with the drogue
parachutes in a more expensive wind tunnel if necessary.
III. Wind Tunnel Test Setup
The experimental wind tunnel test was performed in the NASA Langley 20-Foot Vertical Spin Tunnel (VST). The
VST is a low speed, annular return tunnel that operates at atmospheric conditions. The closed, 12-sided test section
is 20 feet across and 25 feet high. The VST has provided key subsonic, dynamic stability data for many atmospheric
entry vehicles, including the Mercury, Gemini, and Apollo space capsules, as well as the Pioneer Venus, Stardust, and
planetary sample return concepts. The VST has more recently been utilized to assess subsonic dynamic stability of
the Orion Launch Abort System, CM, and drogue parachute performance. The tunnel’s rotary balance system has a
forced oscillation capability that is used to measure body axis rate damping characteristics [12].
A 1/16th-scale CM was modified from a free-flight model [8] to accept a 6-component strain gage balance. The
model was built using an automated polycarbonate fabrication system in the NASA Langley Research Center rapid
prototyping lab. The model with drogues attached is shown in Figure 3. The reference length and reference area used
to compute aerodynamic coefficients are based on capsule diameter.
Figure 3. Orion Crew Module with drogue parachutes in Langley 20-Foot Vertical Spin Tunnel (Image
credit: NASA).
The parachutes used for this test were acquired from an inventory at the VST that is used for airplane spin recovery
and entry vehicle drogue parachute testing. The 18-inch diameter flat, circular parachutes have a full-scale drag area
(CDS) of 221 ft2 based on a CD of 0.55, and are constructed of high permeability nylon that results in good stability
Page 7
American Institute of Aeronautics and Astronautics
7
and a near-zero trim angle. The model towline length—defined as the length from the attachment point to the canopy
skirt—was 62.5 inches (1,000 inches full-scale). The parachute towlines are attached to the zero-degree gusset, or the
gusset aligned with the +Z body axis as shown in Figure 4 [13], at the “down and out” attachment point (as it is called).
Figure 4. Coordinate system for the Orion Crew Module [13].
A six-component, 1.105-inch diameter strain gage balance was used to measure forces and moments on the model.
The balance was mounted on the axis of rotation at the center of gravity (CG) location.
A potentiometer was used to measure model angular position for the forced oscillation technique. The model sting
was rotated to set the model at the desired angle of attack and then oscillated about that point to obtain force and
moment time history data necessary to calculate damping derivatives.
Measurement of the drogue force vector to validate the attach-point damping model assumption of the force vector
aligning with the velocity at the drogue attachment point was accomplished with a small six-component balance
mounted at the drogue attachment point. The six-component balance is shown mounted in the CM in Figure 5.
Page 8
American Institute of Aeronautics and Astronautics
8
The majority of the test was focused on measuring the pitching moment. Some data were collected for the yaw
configuration as well, and a summary is presented in Reference [20]. Test data were gathered for the heatshield-
forward condition, which is the orientation that the vehicle is intended to descend through the atmosphere. Reduced
frequency and angular rates for the forced oscillation testing were chosen based on dynamics observed in model free-
flight tests of the CM with drogues [8].
The majority of the wind tunnel test was conducted at a dynamic pressure of 3 psf and a Reynolds number of
310,000 based on the CM diameter. A small portion of the test was performed at a dynamic pressure of 1.5 psf
(Reynolds number of 230,000 based on CM diameter) in order to achieve desired reduced frequency and non-
dimensional angular rate variations. Reduced frequency, k, and maximum non-dimensional angular rate, �̂�𝑚𝑎𝑥, are
two similarity parameters used to match frequency and rate of oscillations seen in free-flight.
The angle-of-attack range used in the test was 100° to 220°. Angle of attack of 180° is the heatshield forward
attitude for the CM. Sideslip angle was varied from -40° to 40° at various angles of attack. Sinusoidal motion with
amplitudes of up to ±40° and frequencies of up to 2 Hz was used for the forced oscillation technique.
IV. Wind Tunnel Test Results
The results of the wind tunnel test are organized in terms of the objectives of the research presented in this paper.
This section covers the first three objectives: 1) damping effects of drogue parachutes on the CM-parachute system,
2) upstream influence of the drogue parachutes on CM aerodynamics, and 3) drogue parachute drag reduction due to
CM wake. The fourth objective, measuring the riser line force vector, is presented in Section V, where the
experimentally obtained riser line force vector angle is compared to the attach-point damping model predictions.
A. Damping Effects of Drogue Parachutes on Crew Module Dynamics
Other than providing additional drag, a major purpose of the drogue chutes is to stabilize and orient the CM to
enable proper main parachute deployment and inflation. The results from this wind tunnel test show that the drogue
chutes are providing stability to the CM. However, the degree of stability is currently in question based on conflicting
data from flight tests and simulation results. The aerodynamic forces and moments are a build-up of the static and
dynamic components. The static aerodynamic results are discussed Reference [20]. The oscillatory motion of the
CM is defined by the oscillation frequency and amplitude growth or decay. The oscillation frequency is primarily
dependent on the vehicle inertia (drogue parachute inertia assumed negligible) and static aerodynamic moments. The
CM static and dynamic aerodynamics without parachutes are discussed in detail in References [14] and [15].
Figure 5. Crew Module with six-component balance to measure drogue force vector.
Drogue
Balance
Page 9
American Institute of Aeronautics and Astronautics
9
The damping characteristics of the CM-drogue system will be described in four sections: pitch damping, one
drogue out, oscillation frequency effects, and rate effects. Each of these sections describes a particular aspect of the
damping characteristics of the CM-drogue parachute system that is important in modeling the dynamics of the system.
Yaw damping characteristics are described in Reference [20].
The forced oscillation data were reduced using the “single point” method. The forced oscillation technique,
including data reduction, are described in detail in Ref. [14]. Stable damping is indicated by negative values of Cmq.
1. Quantitative Effect of Two Drogue Parachutes on Pitch Damping Derivatives
The pitch damping derivatives, Cmq, versus CM angle of attack for the CM without drogues and the CM with two
fully-deployed drogues is shown in Figure 6. The data plotted are for a frequency that is representative of VST free-
flight with drogues (reduced frequency of 0.125 and non-dimensional angular rate of 0.022). The CM-drogue system
exhibited this frequency of motion in the earlier free-flight test in the VST [8]. Larger amplitudes of oscillation were
desired but could not be achieved due to amplitude and frequency combination limitations of the forced oscillation
rig. A few calculated Cmq values in Figure 6 do not appear to follow the damping trend. There are several possible
explanations for this phenomenon, including sensitivity to the data reduction method and repeatability concerns due
to the unsteady nature of the drogues. The drogues have a relatively constant damping effect from an angle of attack
of 144° to 180°. Below 144°, the drogues significantly increase their contribution to system damping. With the two
drogues attached, the CM oscillates about its trim angle of about 151°.
Figure 6. Dynamic stability for CM alone and with two drogues (k = 0.125, �̂�𝒎𝒂𝒙 = 0.022).
2. Quantitative Effect of One Drogue Parachute on Pitch Damping
Examining one fully-deployed drogue parachute instead of two sheds light on a failure scenario where one drogue
does not deploy correctly, also called “one drogue out” and provides information necessary to confirm the validity of
modeling two parachutes as one in the simulations. Figure 7 shows the effect of one drogue out on dynamic pitch
stability. The data compared were computed from oscillations with a reduced frequency of 0.091 and non-dimensional
angular rate of 0.016. This is representative of the oscillation frequency seen in VST free-flight tests of the CM with
Page 10
American Institute of Aeronautics and Astronautics
10
one drogue. Cmq decreases for one drogue versus two, indicating the drag force from two drogues is more stabilizing
to the CM-drogue system than one drogue, as expected.
Figure 7. Effect of drogue out (k = 0.091, �̂�𝒎𝒂𝒙 = 0.016).
3. Effects of Oscillation Frequency on Pitch Damping Derivatives
Vehicle aerodynamic damping is dependent on oscillation frequency [15]. The natural oscillation frequency of
the CM is primarily dependent on the vehicle inertia and Cmα, with minimal dependence on damping. Frequencies
observed in VST free-flight tests with a dynamically scaled model were 1.4 Hz (k = 0.091) with one drogue parachute
and 2 Hz (k = 0.123) with two drogue parachutes. The effect of reduced frequency on damping of the CM-drogue
system is shown in Figure 8. The maximum non-dimensional angular rate (qmax) was held constant at 0.030. A
negligible effect is seen for reduced frequencies (k) of 0.087 and 0.130. For a reduced frequency of 0.044, damping
becomes highly unstable for the angle-of-attack range between 145° and 180°. A similar plot of frequency dependence
for the CM alone is shown in Figure 9. Frequency dependence is much more evident for this configuration. In the
trim region for the CM alone, about 167° angle of attack, damping becomes more unstable as frequency decreases. In
the trim region for the CM with drogues, about 151° angle of attack, damping has the opposite trend of decreasing
stability as frequency increases.
Page 11
American Institute of Aeronautics and Astronautics
11
Figure 8. Effect of oscillation frequency for CM with two drogues, �̂�𝒎𝒂𝒙=0.030.
Figure 9. Effect of oscillation frequency for CM alone, �̂�𝒎𝒂𝒙=0.030.
Page 12
American Institute of Aeronautics and Astronautics
12
These figures show a dependence of damping values on oscillation frequency, verifying the importance of
capturing dynamic derivative values at the correct reduced frequency in order to match motions observed in free flight
to motions predicted by simulations.
4. Effects of Pitch Rate on Pitch Damping Derivatives
The effect of maximum angular rate (�̂�𝑚𝑎𝑥) on damping of the CM-drogue system is shown in Figure 10. Reduced
frequency was held constant at 0.044. The frequencies and amplitudes chosen to capture the effects of reduced
frequency and angular rate were limited by the capability of the forced oscillation rig. It should be noted, however,
that the rig was capable of oscillating the model at the desired frequency to match free-flight motion in earlier VST
tests. In the region of trim for the CM with drogue parachutes, the total system damping becomes less stable (the
damping derivative increases in the positive direction) as the angular rate increases at this frequency. This trend
reverses at angles of attack less than about 145° and greater than 170°. This trend reversal effect is seen for the CM
alone in Figure 11, as well. In the trim region for the CM alone (about 167° angle of attack) the vehicle becomes more
unstable as pitch rate increases at this frequency. In the trim region for the total CM-drogue system (about 151° angle
of attack), the trend is reversed in that the vehicle is more damped as pitch rate increases. Also, the angles of attack
at which these trends reverse are 135° and 155°, which are different than the angles of attack for trend reversal for the
total CM-drogue system, shown in Figure 10.
Figure 10. Effect of pitch rate for CM with drogues, k = 0.044.
Page 13
American Institute of Aeronautics and Astronautics
13
Figure 11. Effect of pitch rate for CM alone, k = 0.044.
The dependence of the dynamic derivatives on pitch rate has been previously identified for this vehicle and is
currently being modeled in the CM aerodatabase. Capturing the effect of rate for the CM-drogue system may aid in
simulation modeling of the system, although not directly, since the rate effect at the full-scale flight frequency could
not be captured in this test.
B. Drogue Parachute Drag Reduction Due to CM Wake Deficit
The drogue parachute drag (non-dimensionalized with drogue parachute parameters) for a static CM is plotted in
Figure 12. The drogue parachute drag without the CM wake is shown, as well as the drag for one and two parachutes.
The dynamic pressure due to the CM wake decreases by 2-15% for two parachutes versus one. These values are
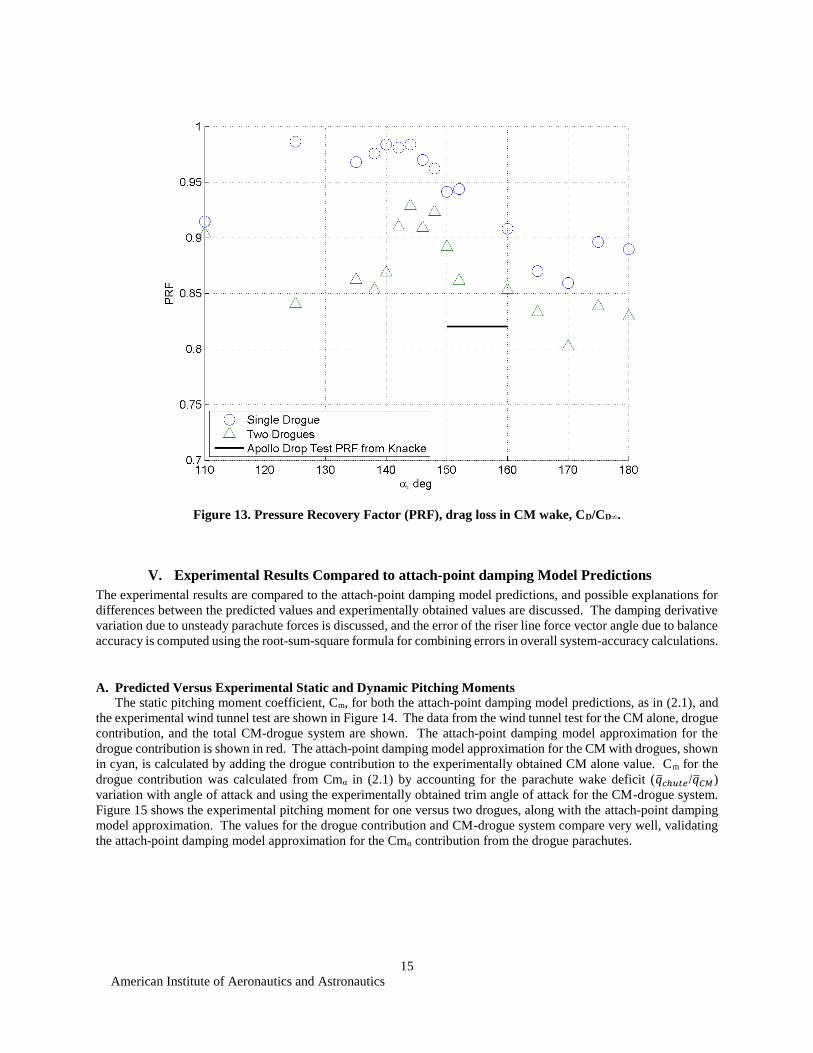
similar to the 10% reduction predicted by Knacke [16]. The Pressure Recovery Fraction (PRF) for one parachute
versus two parachutes is shown in Figure 13. PRF is calculated by dividing the drag of the parachutes in the wake of
the CM, CD, by the drag of the parachutes in clean flow, CD∞. The CM wake causes a maximum drag reduction of
approximately 15% for one drogue parachute and approximately 20% for two drogue parachutes. These maximum
drag reductions occur at an angle of attack of 170°. Near the trim angle of attack around 151°, the dynamic pressure
reduction is about 6% for one drogue and 14% for two drogues. The drag reduction for a single parachute is less than
the measured 12.4% drag reduction described in Ref. [17] for the CM at 160° angle of attack and less than the
approximately 40% predicted by CFD [17]. The PRF measurement is significant because the PRF variation with
angle of attack used in simulations is not anchored to test data [4]. The data collected in this test may be able to aid
in anchoring those values in simulations. Knacke reports a PRF of 0.82 from Apollo drop tests [16]. This is shown
by the line at PRF = 0.82 spanning the angles of attack from 150° to 160°, the approximate trim region for the Apollo
vehicle under drogue parachutes. The maximum parachute drag is in the angle of attack range between 140° to 150°.
The back shell angle of the CM is 32.5°. This means the flow will start to attach to the back shell around an angle of
attack of 147°, meaning a less turbulent wake behind the CM and a higher freestream velocity at the parachutes. The
attachment of flow to the backshell angle could occur at lower angles of attack due to the large shoulder radius on the
CM.
Page 14
American Institute of Aeronautics and Astronautics
14
Figure 12. The drogue parachute drag wake deficit versus CM angle of attack.
Page 15
American Institute of Aeronautics and Astronautics
15
Figure 13. Pressure Recovery Factor (PRF), drag loss in CM wake, CD/CD∞.
V. Experimental Results Compared to attach-point damping Model Predictions
The experimental results are compared to the attach-point damping model predictions, and possible explanations for
differences between the predicted values and experimentally obtained values are discussed. The damping derivative
variation due to unsteady parachute forces is discussed, and the error of the riser line force vector angle due to balance
accuracy is computed using the root-sum-square formula for combining errors in overall system-accuracy calculations.
A. Predicted Versus Experimental Static and Dynamic Pitching Moments
The static pitching moment coefficient, Cm, for both the attach-point damping model predictions, as in (2.1), and
the experimental wind tunnel test are shown in Figure 14. The data from the wind tunnel test for the CM alone, drogue
contribution, and the total CM-drogue system are shown. The attach-point damping model approximation for the
drogue contribution is shown in red. The attach-point damping model approximation for the CM with drogues, shown
in cyan, is calculated by adding the drogue contribution to the experimentally obtained CM alone value. Cm for the
drogue contribution was calculated from Cmα in (2.1) by accounting for the parachute wake deficit (�̅�𝑐ℎ𝑢𝑡𝑒/�̅�𝐶𝑀)
variation with angle of attack and using the experimentally obtained trim angle of attack for the CM-drogue system.
Figure 15 shows the experimental pitching moment for one versus two drogues, along with the attach-point damping
model approximation. The values for the drogue contribution and CM-drogue system compare very well, validating
the attach-point damping model approximation for the Cmα contribution from the drogue parachutes.
Page 16
American Institute of Aeronautics and Astronautics
16
Figure 14. attach-point damping model predicted versus experimental static pitching moment.
Figure 15. Attach-point damping model predicted versus experimental static pitching moment for one
versus two drogue parachutes.
Page 17
American Institute of Aeronautics and Astronautics
17
The pitch damping for both the attach-point damping model predictions, as in (2.2), and from the experimental
wind tunnel test are shown in Figure 16. The data from the wind tunnel test for the CM alone, drogue contribution,
and CM with drogues are shown. The attach-point damping model approximation for the drogue contribution is shown
in red. The attach-point damping model approximation for the CM with drogues, shown in cyan, is calculated by
adding the drogue contribution to the experimentally obtained CM alone value. Cmq for the drogue contribution took
the parachute wake deficit variation with angle of attack into account. The Cmq values are limited to ±25° about trim
due to limitations of the small angle theorem in the derivation of Cmq. The attach-point damping model predicts a
much more dynamically stable system than experimentally obtained. The drogue contribution to damping measured
in the wind tunnel test does not provide the level of dynamic stability indicated by the attach-point damping model.
Assuming that the CM alone pitch damping measurements are correct, the drogue riser line force vector should be
examined in detail. The fourth goal of the wind tunnel test was to measure this force vector, both the magnitude and
direction, or angle with respect to the freestream velocity. These data are shown in the next section.
Figure 16. Attach-point damping model predicted versus experimental pitch damping.
B. Riser Line Force Vector
A major objective of this wind tunnel test was to measure the riser line force vector, both magnitude and direction.
The magnitude of the force vector, or parachute drag, was discussed above in Chapter 3. The direction, or angle of
the force vector from the freestream velocity vector, is discussed in this section. This angle directly affects the total
system pitch damping. The attach-point damping model approximations do not match the experimentally obtained
pitch damping values for the CM-drogue system, as shown in Figure 16. This indicates that the major assumption of
the attach-point damping model of the drogue riser line force vector aligning with the velocity vector at the drogue
attach point is incorrect. In this section, this angle as measured in the wind tunnel test is shown and compared to the
attach-point damping model assumption.
Figure 17 shows a diagram of the CM-drogue system. The CM coordinate system is shown, along with the positive
directions of the drogue attach point forces as measured by the drogue balance at the attach point. Δθ is the angle
between the freestream velocity vector and the rotated parachute (described by the rotation of chute and riser line
Page 18
American Institute of Aeronautics and Astronautics
18
system about the attach point) due to the lag of the chute with respect to the CM angle of attack change. The predicted
Δθ is defined as in (5.1) [9].
The experimental Δθ is defined as in (5.2). The arctangent of the ratio of normal force (NFdrogues) to negative axial
force (AFdrogues) gives the drogue line force angle with respect to capsule vertical. The angle of attack of the CM, α,
subtracted from 180° gives the CM angle of attack with respect to vertical, or the angle of the freestream velocity
vector with respect to vertical. Subtracting these two angles gives the drogue force vector with respect to the
freestream velocity vector, or Δθ.
𝑡𝑎𝑛∆𝜃 =𝑅�̇�
𝑉∞
(5.1)
∆𝜃𝑒𝑥𝑝𝑒𝑟𝑖𝑚𝑒𝑛𝑡𝑎𝑙 = atan (𝑁𝐹𝑑𝑟𝑜𝑔𝑢𝑒𝑠
−𝐴𝐹𝑑𝑟𝑜𝑔𝑢𝑒𝑠
) − (180 − 𝛼) (5.2)
R
V
L
V
R
R-
-
x
y
+NF
+AF
Drogue Attach PtForces
Figure 17. Diagram of CM-drogue system with coordinate system and drogue force coordinate system.
A comparison of Δθ angle as predicted by the attach-point damping model assumption and the experimentally
obtained angle is shown in Figure 18. This is a time history of data collected from a forced oscillation run where the
model was oscillating at 2 Hz with a 10° amplitude about 152° angle of attack (k = 0.123, �̂�𝑚𝑎𝑥 = 0.021). Noticeable
in this time history is a bias in the angle and frequency content other than 2 Hz, which is the CM oscillation frequency
for this particular run. The extra frequency content is attributable to the unsteady wake behind the CM, perhaps an
indication of wake shedding frequency, and possible fluctuations in tunnel flow. The frequency content sources were
not thoroughly investigated as they were assumed to have little bearing on the overall damping qualities of the
parachutes. According to the attach-point damping model hypothesis, the drogue parachute force vector should be
oscillating about the freestream velocity vector as the CM oscillates about that vector. Therefore, as the predicted Δθ
Page 19
American Institute of Aeronautics and Astronautics
19
values show, the drogue force vector should be oscillating about zero. The experimental data show an obvious bias
of the parachutes from the freestream velocity vector.
Figure 18. Predicted versus experimental drogue chute Δθ time history
(k = 0.123, �̂�𝒎𝒂𝒙 = 0.021, α = 152°).
In Figure 19, Δθ is plotted versus the CM angle of attack. The bias becomes very apparent in this figure. Also
noticeable, is an additional lag in the force vector. If you introduce a lag in the predicted Δθ, you achieve a slanted
hysteresis loop as seen in Figure 19.
Figure 19. Δθ versus CM angle of attack (k = 0.123, �̂�𝒎𝒂𝒙 = 0.021, α = 152°).
The cycles from the time history are averaged to obtain a mean cycle, as shown by the red line in Figure 19. The
mean cycles of Δθ for each angle of attack that the model was oscillated about are shown in Figure 20 versus the
attach-point damping model predictions. The bias away from the freestream velocity vector varies with CM angle of
Page 20
American Institute of Aeronautics and Astronautics
20
attack. Also, based on the change in the shape of the mean cycles, the additional lag of the drogue force vector is
varying with angle of attack.
Figure 20. Predicted versus experimental Δθ mean cycles (k = 0.123, �̂�𝒎𝒂𝒙 = 0.021).
Modifications to the predicted Δθ were empirically made to closely replicate the experimental Δθ. There are three
necessary modifications: 1) time shift, 2) bias, and 3) scale factor. These parameters are similar to a steady-state error,
gain, and phase shift that are obtained from analyzing the frequency response of a linear time invariant system. The
modified predicted Δθ is shown in equation form in (5.3).
∆𝜃𝑝𝑟𝑒𝑑𝑚𝑜𝑑 = ∆𝜃𝑝𝑟𝑒𝑑
𝑆ℎ𝑖𝑓𝑡∗ 𝑆𝑐𝑎𝑙𝑒𝐹𝑎𝑐𝑡𝑜𝑟 + 𝐵𝑖𝑎𝑠 (5.3)
The phase shift is introduced to the predicted Δθ to imitate the additional time lag in the force vector that is seen
in the experimental data. The time shift is achieved by merely shifting the data over with respect to time until the
slope of the hysteresis loop matches that of the experimental data. This step is shown in Figure 21. The predicted Δθ
loops are now slanted in the same manner as the experimental Δθ. A bias is then introduced to the predicted Δθ to
imitate the bias seen in the experimental data. The effects of time shift and bias are shown in Figure 22. The final
modification is a scale factor adjustment. The scale factor is primarily required around the trim angle of attack to
reduce the magnitude of the loops. An increase in magnitude was also necessary near 180° angle of attack. The result
of applying all three modifications, time shift, bias, and scale factor, are shown in Figure 23.
Page 21
American Institute of Aeronautics and Astronautics
21
Figure 21. Time shift in predicted Δθ to replicate experimental Δθ (k = 0.123, �̂�𝒎𝒂𝒙 = 0.021).
Figure 22. Time shift and bias in predicted Δθ to replicate experimental Δθ (k = 0.123, �̂�𝒎𝒂𝒙 = 0.021).
80 100 120 140 160 180 200-3
-2
-1
0
1
2
3
4
5
, deg
,
deg
Predicted
Experimental Mean Cycle
Predicted Modified
80 100 120 140 160 180 200-3
-2
-1
0
1
2
3
4
5
, deg
,
deg
Predicted
Experimental Mean Cycle
Predicted Modified
Page 22
American Institute of Aeronautics and Astronautics
22
Figure 23. Time shift, bias, and scale factor in predicted Δθ to replicate
experimental Δθ (k = 0.123, �̂�𝒎𝒂𝒙 = 0.021).
The time shift, bias, and scale factor values are shown versus CM angle of attack in Figure 24. The time shift
values increase from a CM angle of attack of 180° to 110°. There is a necessary time shift of about 0.17 seconds at
the trim angle of attack to match the experimental data, which is about a half of the oscillation cycle of the CM. The
Δθ angle is scaled down in the angle of attack range of 140° to 152° to match the experimental data, and is scaled up
near an angle of attack of 180 °. The bias values are mostly positive with the exception of one negative value at 110°
angle of attack. The bias appears to be several degrees, between 2° and 4° for the most of the angle of attack range
tested, decreasing to 0° very close to an angle of attack of 180°.
80 100 120 140 160 180 200-3
-2
-1
0
1
2
3
4
5
, deg
,
deg
Predicted
Experimental Mean Cycle
Predicted Modified
Page 23
American Institute of Aeronautics and Astronautics
23
Figure 24. Time shift, bias, and scale factor parameters versus angle of attack
(k = 0.123, �̂�𝒎𝒂𝒙 = 0.021).
The bias from the freestream velocity vector for a static run is shown in Figure 25. The bias shows a similar trend
to the bias seen in a forced oscillation run. At 110° angle of attack, the bias is near zero, but at the rest of the angle of
attack range, the bias trends from 4° down to 1° at 180° angle of attack. In general, the bias for a static vehicle has a
positive increment over the bias for an oscillating vehicle due to unsteady wake effects from an oscillating CM.
100 110 120 130 140 150 160 170 180 1900
0.2
0.4
Tim
e S
hift,
sec
100 110 120 130 140 150 160 170 180 1900
0.5
1
1.5
Scale
Facto
r
100 110 120 130 140 150 160 170 180 190-2
0
2
4
, deg
Bia
s,
deg
Page 24
American Institute of Aeronautics and Astronautics
24
Figure 25. Bias from freestream velocity vector for a static run.
Evidence of this bias was seen in both the PA-1 test flight and the VST free-flight tests. Recall that in the
simulation matching to the PA-1 test flight data, a 7° magnitude bias, or pitch angle bias, correction was needed [9].
In the simulation matching of the VST free-flight test, slight adjustments were made to the drogue attach point location
to achieve a proper trim angle of attack. A bias in the parachute force vector will also have this effect on trim angle
of attack. There is sufficient evidence that the wake behind the CM is biasing the parachute force vector away from
the freestream velocity vector, indicating that a bias variation with CM angle of attack may need to be modeled in the
simulation.
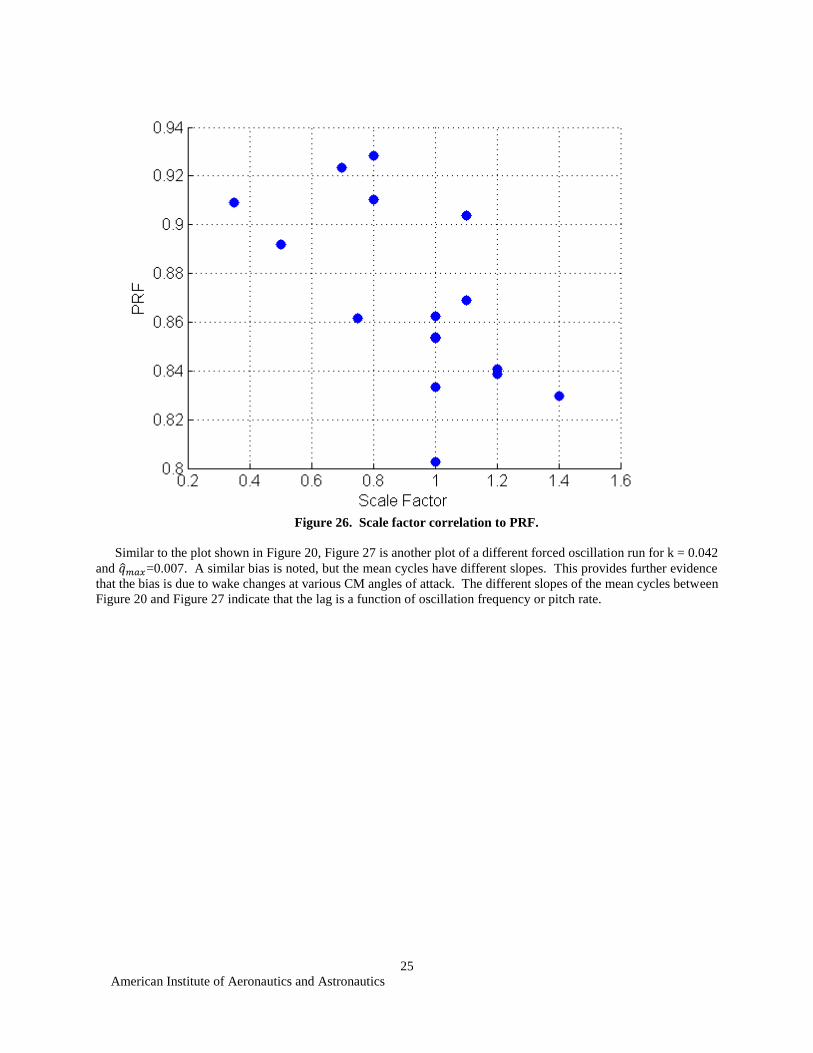
The scale factor can be correlated to PRF, as shown in Figure 26. As the drag of the drogue parachutes increases,
the predicted maximum and minimum values of Δθ need to be decreased in order to match the experimental Δθ. The
same relationship is evident in (5.1). As the velocity is increased in the denominator of the equation, Δθ decreases.
This indicates that the angle of the riser line is also a function of velocity in the wake of the CM, not only the freestream
velocity of the CM.
Page 25
American Institute of Aeronautics and Astronautics
25
Figure 26. Scale factor correlation to PRF.
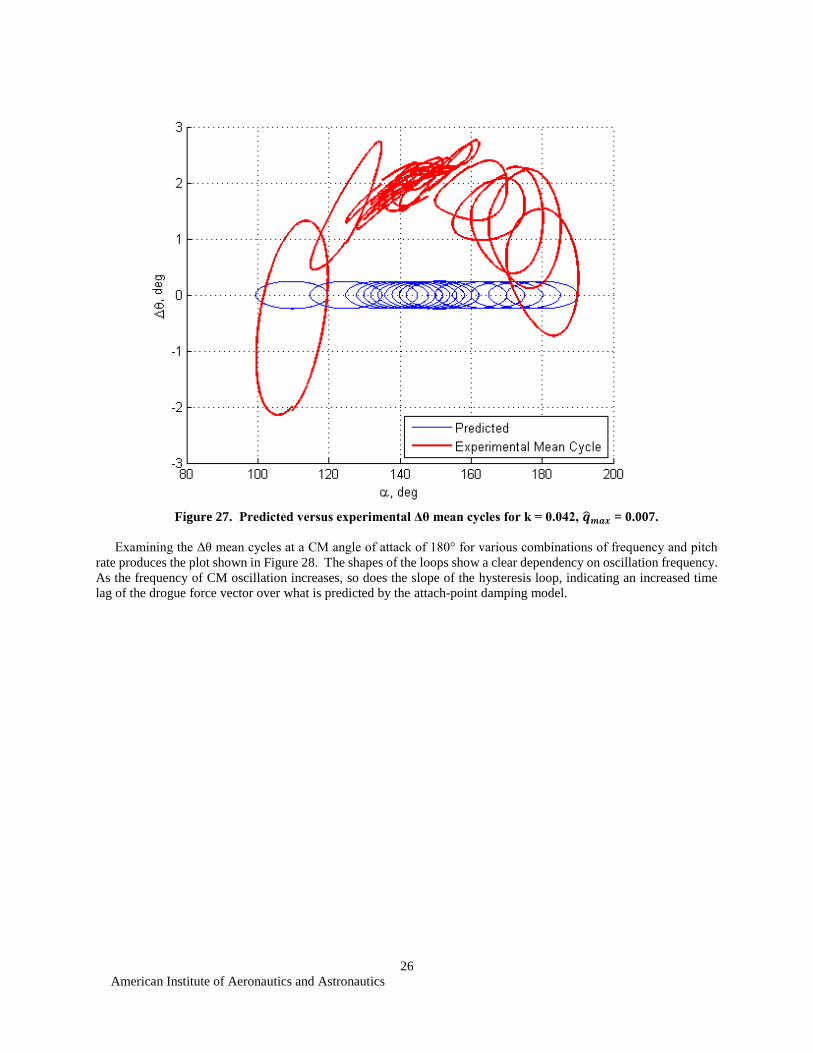
Similar to the plot shown in Figure 20, Figure 27 is another plot of a different forced oscillation run for k = 0.042
and �̂�𝑚𝑎𝑥=0.007. A similar bias is noted, but the mean cycles have different slopes. This provides further evidence
that the bias is due to wake changes at various CM angles of attack. The different slopes of the mean cycles between
Figure 20 and Figure 27 indicate that the lag is a function of oscillation frequency or pitch rate.
Page 26
American Institute of Aeronautics and Astronautics
26
Figure 27. Predicted versus experimental Δθ mean cycles for k = 0.042, �̂�𝒎𝒂𝒙 = 0.007.
Examining the Δθ mean cycles at a CM angle of attack of 180° for various combinations of frequency and pitch
rate produces the plot shown in Figure 28. The shapes of the loops show a clear dependency on oscillation frequency.
As the frequency of CM oscillation increases, so does the slope of the hysteresis loop, indicating an increased time
lag of the drogue force vector over what is predicted by the attach-point damping model.
Page 27
American Institute of Aeronautics and Astronautics
27
Figure 28: Δθ mean cycles for varying frequency-rate combinations at 180° angle of attack.
The time lag, converted to phase shift notation, over all angle of attack values for various vehicle oscillation
frequencies is shown in the plot in Figure 29. The lag is clearly dependent on vehicle angle of attack and oscillation
frequency. The angle of attack dependency is most likely due to varying wake effects at different CM angles of attack.
In Ref. [9], a small time lag in the riser line angle relative to the vehicle was also noted in the PA-1 flight test data.
The additional, unpredicted phase shift effect with frequency indicates that parachute motion relative to the CM is not
completely described by the attach-point damping model.
Page 28
American Institute of Aeronautics and Astronautics
28
Figure 29. Phase shift, or additional lag, as function of oscillation frequency and angle of attack, �̂�𝒎𝒂𝒙 =
𝟎. 𝟎𝟑𝟎.
C. Riser Line Force Vector for Single Drogue
The bias from the freestream velocity vector for one drogue parachute is shown in Figure 30. This bias is increased
from the bias for two drogue parachutes by about 0.5°. This difference may be caused by the single parachute settling
into a region of the wake that is least turbulent. When two parachutes are in the wake, one of them will be pushed out
of the region with less turbulent flow and cause the resultant force vector to align more with the freestream velocity
of the CM. Evidence of this behavior was seen in the wind tunnel test in VST. One parachute remains relatively
stationary in the CM wake, while the other oscillates at the same frequency as the CM.
Page 29
American Institute of Aeronautics and Astronautics
29
Figure 30. Bias from freestream velocity vector for a static run with one drogue parachute.
The phase shift from the attach-point damping model-predicted Δθ is shown in Figure 31. These values are very
similar to the phase shift for two drogue parachutes. A strong dependence on CM angle of attack and oscillation
frequency are noted.
Page 30
American Institute of Aeronautics and Astronautics
30
Figure 31. Phase shift, or additional lag, as function of oscillation frequency and angle of attack for one
drogue parachute, �̂�𝒎𝒂𝒙 = 𝟎. 𝟎𝟑𝟏.
D. Hysteresis in Parachute Force Magnitude
The attach-point damping model assumes a constant drag on the drogue parachutes even as they are traversing
through the wake of an oscillating CM. Figure 32 shows the drag of two drogue parachutes versus the CM angle of
attack for an oscillating CM. The drag is computed only in the pitch plane of the CM because the focus is on Cmq.
The force component in the yaw plane is neglected. The drag exhibits a hysteresis effect. The effect is a function of
the wake variation with CM angle of attack and the acceleration experienced by being pulled back and forth by the
oscillating CM.
Page 31
American Institute of Aeronautics and Astronautics
31
Figure 32. Drogue parachute drag versus CM angle of attack.
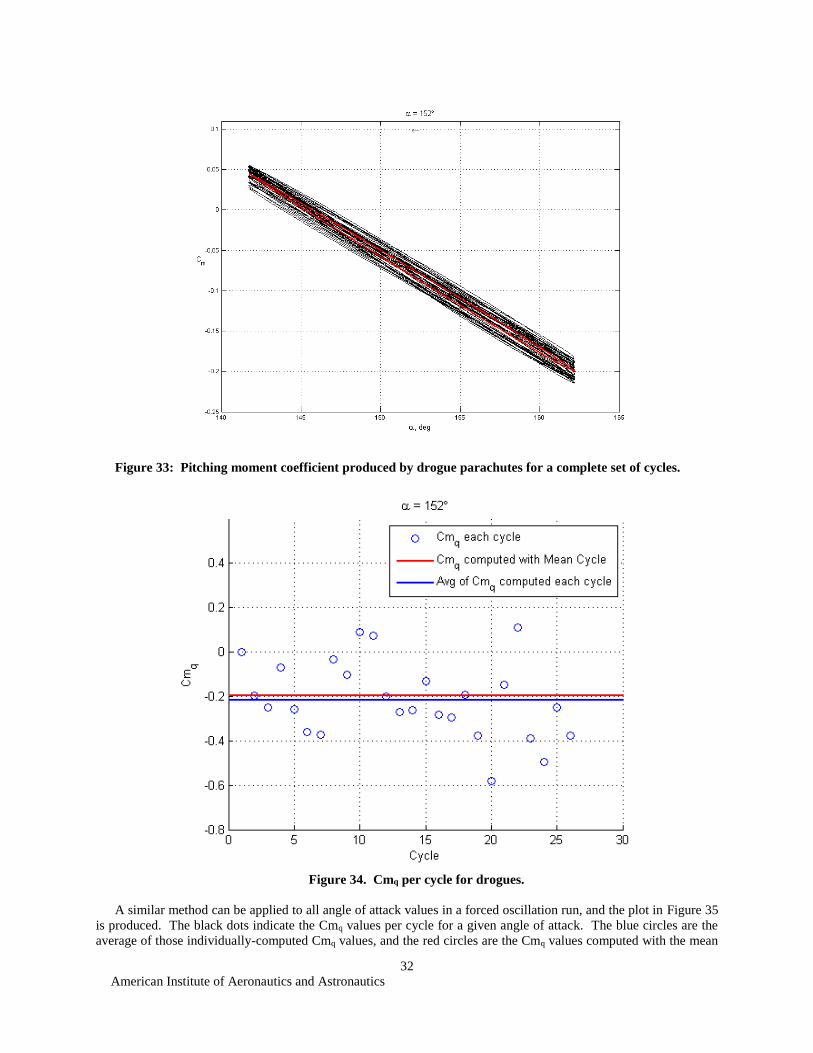
E. Cmq Variation due to Unsteady Drogue Parachute Forces
The unsteady nature of the drogue parachute forces in the CM wake produces a rather large variation of calculated
Cmq values per cycle in the forced oscillation method. Many cycles are measured about one angle of attack point, and
then the pitching moment is averaged to obtain a mean cycle from which to derive the Cmq value for that mean angle
of attack. The pitching moment coefficient produced by the drogue parachutes (non-dimensionalized with CM
reference area and length) versus angle of attack for a complete set of cycles is shown in Figure 33. The average, or
mean cycle, is shown in red. The standard method of computing Cmq is to use the mean cycle. However, if each
cycle is used individually to compute Cmq, the trend of Cmq with cycle number is shown in Figure 34. The blue line
shows the result of averaging each individual Cmq value, and the red line shows the result of using the mean cycle to
calculate Cmq. The difference between these two methods does not appear large for this angle of attack condition.
However, the variation of Cmq values per cycle is fairly large.
80 100 120 140 160 180 2000.78
0.8
0.82
0.84
0.86
0.88
0.9
0.92
0.94
0.96
, deg
CD
Page 32
American Institute of Aeronautics and Astronautics
32
Figure 33: Pitching moment coefficient produced by drogue parachutes for a complete set of cycles.
Figure 34. Cmq per cycle for drogues.
A similar method can be applied to all angle of attack values in a forced oscillation run, and the plot in Figure 35
is produced. The black dots indicate the Cmq values per cycle for a given angle of attack. The blue circles are the
average of those individually-computed Cmq values, and the red circles are the Cmq values computed with the mean
Page 33
American Institute of Aeronautics and Astronautics
33
cycle. The variation of Cmq values is quite large for most angle of attack values. The attach-point damping model
predicts Cmq values of approximately -0.5 near the trim angle of attack of 151°. The most negative values of Cmq in
this region do reach this value. If uncertainties were added to the calculated Cmq values to cover this broad range of
possible values, the level of damping predicted by the attach-point damping model would be included in the range. If
a Monte Carlo type analysis was used to cover this range of possible values, the overall performance of the system
would still be evaluated relative to a mean damping that is less damped than predicted by the attach-point damping
model but still stable.
Figure 35: Cmq contribution from drogues per cycle.
F. Error of Δθ Computed From Balance Accuracy Statistics
One more potential error is discussed in this section: the error of Δθ due to balance accuracy. The root-sum-square
(RSS) formula for combining of component error in overall system-accuracy calculations is used to calculate potential
errors from balance accuracy [18]. The uncertainties are very small—on the order of 0.2 degrees—compared to the
magnitude of the angle measurement, and, therefore, not a concern as far as compromising the drogue riser line vector
measurement.
Uncertainty analysis of other instrumentation used in the wind tunnel test was not completed for this research. The
balance used to measure forces and moments on the CM was assumed to have very small uncertainties and a negligible
effect on overall pitching moment measurements. The position potentiometer used to measure angular displacement
of the CM had a known error that steadily increased with time. The offset of the calibration was frequently updated
during the test to keep the error at less than 0.1°. The forced oscillation rig encoder, a separate instrument from the
position potentiometer, used to set the position of the model during a forced oscillation run was extremely accurate
when compared to the Angular Measurement System (AMS). Unfortunately, the signal from the encoder could not
be routed to the data acquisition system, so the potentiometer reading had to be used for the model position.
VI. Summary and Conclusions
Early in the Orion Program, simulation models were under-predicting the amount of CM damping while the CM
was flying under the drogue(s) as compared to flight tests. The attach-point damping model was resurrected and
Page 34
American Institute of Aeronautics and Astronautics
34
applied to the Orion system. The damping model provided very good predictions to flight data. A key hypothesis in
the attach-point damping analysis is that the drogue parachutes’ net load vector aligns with the CM drogue attachment
point velocity vector. This assumption is physically reasonable and has historically produced good results, but has
never been experimentally verified. A forced oscillation test of the CM with parachutes was conducted in the NASA
Langley 20-Ft Vertical Spin Tunnel (VST) to gather additional data to validate and refine the attach-point damping
model. A second loads balance was added to the original Orion VST model to measure the drogue parachute loads
independently of the CM.
The wake of the CM influences the drogue parachutes, which makes performance predictions of the parachutes
difficult. Significant interactions exist between the CM and the drogue parachutes, which vary with CM angle of
attack. Many of these individual effects are not currently modeled in the simulations. The effect is captured as a
system damping that is anchored to flight test data specific to that configuration. The objective of the test was to
identify the contribution of the drogues to CM damping and provide additional information to quantify wake effects
and the interactions between the CM and parachutes. The rate damping characteristics of the CM-drogue chute system
were quantified in the form of dynamic derivatives using the forced oscillation technique. The riser line force vector
was also measured to directly compare to the attach-point damping model assumptions. It is believed that this is the
first time since the Apollo program that unsteady aerodynamics of an integrated capsule-drogue system have been
measured directly.
The wind tunnel test results show that the CM-drogue system is dynamically stable at most combinations of
frequency and amplitude. The drogues have a relatively constant damping effect from an angle of attack of 144° to
180°. Below 144°, the drogues significantly increase the damping of the system. Aerodynamic damping decreases
from one drogue versus two, as expected. The data show the importance of capturing dynamic derivatives at the
correct oscillation frequency and angular rate, as the damping values are impacted by those dynamic scaling
parameters. A non-zero sideslip angle of 10° causes an insignificant change in drogue line force and total system
damping. Pitch and yaw damping values are similar near trim attitude, but pitch damping dramatically increases as
angle of attack departs from trim, whereas yaw damping only slightly increases. This difference is due to the drogues
being attached on the axis of rotation for yaw motion and offset from the axis of rotation for pitch motion.
Additionally, it was shown that the drogues have little upstream influence on CM aerodynamics (either statically or
dynamically).
The wake of the CM reduces the drogue riser line force due to the reduced wake dynamic pressure by
approximately 14% near the trim angle of attack for two drogues and 6% for one drogue. The drag reduction is a
strong function of CM angle of attack. The parachute drag loss measurements obtained in this test are significant
because the drag loss variation with angle of attack used in simulations are not currently anchored to test data. These
results may be used to aid in anchoring those data tables. Also, the drag loss affects the restoring moment provided
by the drogue parachutes, so it is important to accurately model that force.
The experimentally-obtained static pitching moment contribution from the drogue parachutes compares very well
to the attach-point damping model predictions. However, the magnitude of the damping derivatives obtained
experimentally does not match the attach-point damping model prediction. The attach-point damping model predicts
Cmq values near -0.5 for the drogue parachute contribution. Although still indicating dynamic stability, the wind
tunnel test data shows values closer to -0.2 near the CM trim angle of attack.
Inspection of the drogue parachute riser line force vector revealed differences between the predicted vector and
the experimentally obtained vector. The predicted angle of the riser line force vector relative to the freestream velocity
vector, Δθ, was modified using three parameters, time (or phase) shift, bias, and scale factor, in order to match the
experimental data. These parameters are similar to a steady-state error, gain, and phase shift that are obtained from
analyzing the frequency response of a linear time invariant system. These parameters indicate that the system is not
entirely described by the attach-point damping model equation. Potentially, a system identification technique could
be used to further define the parachute behavior in terms of the CM motion.
A bias is evident in the forced oscillation and static wind tunnel data, and the bias is a function of angle of attack
of the CM. The bias for one drogue parachute is greater than the bias for two drogue parachutes. This difference is
caused by the single parachute settling into a region of the wake that is least turbulent. When two parachutes are in
the wake, one of them will be pushed out of the region with less turbulent flow and cause the resultant force vector to
align more with the freestream velocity of the CM. Evidence of this behavior is seen in video of the CM with two
parachutes in the VST. One parachute remains relatively stationary in the CM wake, while the other oscillates at the
same frequency as the CM. Evidence of this bias was seen in both the PA-1 test flight and the VST free-flight tests.
The time lag, or phase shift, of the riser line angle relative to the freestream velocity is a function of CM angle of
attack and oscillation frequency. The trend in phase shift is similar for one drogue parachute versus two. The scale
Page 35
American Institute of Aeronautics and Astronautics
35
factor trend is correlated to PRF, indicating that the angle of the riser line is a function of velocity in the wake of the
CM, not the freestream velocity of the CM.
The drag of the drogue parachutes also exhibits a hysteresis effect. This effect is neglected in the attach-point
damping damping model, which assumes a constant drag of the parachutes. The effect is a function of the wake
variation with CM angle of attack and the acceleration experienced by traversing the wake of the oscillating CM.
The variation and uncertainty of the Cmq values were examined based on the error due to balance accuracy, as
well as the unsteady nature of the drogue parachutes. Uncertainty due to balance accuracy was determined to be
negligible. However, the variation of Cmq values due to the unsteady nature of the drogue parachutes is significant.
This variation does include the attach-point damping model predicted values, although marginally. If an uncertainty
range was added to the experimentally obtained values that covered this variation, the attach-point damping model
values would lie within that range.
The drogue parachutes were shown to provide damping from both a drag hysteresis effect and out-of-phase riser
line angle relative to the freestream velocity. Both the force and the angle are highly dependent on the CM wake
characteristics. Based on these wind tunnel data, the attach-point damping model was determined to be a sufficient
approximation of the parachute dynamics in relationship to the CM dynamics for preliminary entry vehicle system
design. More wake effects should be included to better model the system.
These results were used to improve simulation model fidelity of CM flight with drogues deployed [1]. The results
could also be used to improve the preliminary design equations for reentry vehicles under drogue parachutes derived
from the attach-point damping model. The understanding of CM wake effects on the drogue cluster was enhanced
and will contribute to the reentry parachute community’s knowledge base.
VII. Acknowledgements
The authors would like to thank Sue Grafton, Earl Harris, Clinton Duncan, Wes O’Neal, Lee Pollard, and Gene
Adams of the NASA Langley Flight Dynamics Branch for their technical support of the wind tunnel test.
Joe Gamble resurrected the Apollo chute damping model and provided his expertise.
Pete Macaluso and Reggie Riddle at AEDC navigated through the red tape and bureaucracy to loan us the hardware
instrumental in accomplishing this research.
References
[1] D. B. Owens, L. D. Cassady, J. M. Powell and P. C. Stuart, "Orion Crew Module and Parachute System Aerodynamic
Modeling," in AIAA Aviation 2016 Conference, Washington, D.C., AIAA-2016-3988.
[2] "Crew Exploration Vehicle Architecture Design Document," NASA CEV Document Number: CxP-72140, Jan. 2007.
[3] "Exploration Systems Architecture Study Final Report," NASA TM-2005-214062, Nov. 2005.
[4] "Capsule Parachute Assembly System (CPAS) Engineering Development Unit Operating Modeling Parameters Version 9,"
NASA Johnson Space Center, DRD CEV-G-036, JSC 65914 Revision D, April 2012.
[5] J. Idicula, P. S. Williams-Hayes and R. Stillwater, "A Flight Dynamics Perspective of the Orion Pad Abort One Flight
Test," in AIAA Atmospheric Flight Mechanics Conference, Chicago, Illinois, 2009.
[6] C. M. Fremaux, "Final Report for CEV Test 48-CD: Low Subsonic Dynamic Stability Test of the Orion Crew Module,"
NASA CEV Aerosciences Project Document Number: EG-CAP-08-122, June 2008.
[7] D. E. Hahne and C. M. Fremaux, "Low-Speed Flight Dynamic Tests and Analysis of the Orion Crew Module Drogue
Parachute System," in AIAA Atmospheric Flight Mechanics Conference and Exhibit, Honolulu, Hawaii, 2008.
[8] D. B. Owens, S. E. Riddick, D. A. Matz and C. M. Fremaux, "IDAT Drogue Parachute Assessment in the NASA LaRC
Vertical Spin Tunnel (VST) (Test 109-CD)," NASA CEV Aerosciences Project, 2010.
[9] K. M. Currin, J. D. Gamble, D. A. Matz and D. R. Bretz, "Evaluation of Drogue Parachute Damping Effects Utilizing the
Apollo Legacy Parachute Model," in 30th AIAA Applied Aerodynamics Conference, New Olreans, Louisiana, June 2012.
[10] "Data Report for Low Speed Wind Tunnel Tests of a 0.10-Scale Apollo Model (FDC-1) to Determine Dynamic Stability
Characteristics of the Command Module and Drogue Parachute Combination," NASA CR-116641, Aug. 1963.
[11] D. B. Owens and D. Tomek, "18-CD Subsonic-Transonic Crew Module Dynamic Stability Test in the NASA LaRC
Transonic Dynamics Tunnel," NASA CEV Aerosciences Program Document Number: EG-CEV-06-23, Feb. 2009.
[12] "20-Foot Vertical Spin Tunnel," NASA, 16 April 2008. [Online]. Available:
http://www.aeronautics.nasa.gov/atp/facilities/vst/. [Accessed 27 April 2013].
Page 36
American Institute of Aeronautics and Astronautics
36
[13] Orion Vehicle Simulation Data Book, CEV-MA-10-012: Orion Mission Analysis Department of Lockheed Martin Space
Systems Company - Human Space Flight, 2010.
[14] D. B. Owens, J. M. Brandon, M. A. Croom, C. M. Fremaux, E. H. Heim and D. D. Vicroy, "Overview of Dynamic Test
Techniques for Flight Dynamics Research and NASA LaRC," in 25th AIAA Aerodynamic Measurement Technology and
Ground Testing Conference, San Francisco, California, June 2006.
[15] D. B. Owens and V. V. Aubuchon, "Overview of Orion Crew Module and Launch Abort Vehicle Dynamic Stability," in
29th AIAA Applied Aerodynamics Conference, Honolulu, Hawaii, June 2011.
[16] T. W. Knacke, Parachute Recovery Systems Design Manual, Santa Barbara, CA: Para Publishing, 1992.
[17] J. Becker, S. Johnson and T. T. Yechout, "Investigation of NASA Orion Wake Effects on Drogue Chute Aerodynamic
Characteristics," in 21st AIAA Aerodynamic Decelerator Systems Technology Conference and Seminar, Dublin, Ireland,
May 2011.
[18] E. O. Doebelin, Measurement Systems: Application and Design, New York: McGraw-Hill, 2004.