56
1 DANGEROUS CLIMATE CHANGE IN BRAZIL Dangerous Climate A BRAZIL-UK ANALYSIS OF CLIMATE CHANGE AND DEFORESTATION IMPACTS IN THE AMAZON Change in Brazil
1DANGEROUS CLIMATE CHANGE IN BRAZIL
Dangerous Climate
A BrAzil-UK AnAlysis of ClimAte ChAnge And deforestAtion impACts in the AmAzon
Change in Brazil

3DANGEROUS CLIMATE CHANGE IN BRAZIL
April 2011
A collaborative project between theCentro de Ciência do Sistema Terrestre (CCST) of the Instituto Nacional de Pesquisas Espaciais (INPE), Brazil, and the Met Office Hadley Centre, UK
Dangerous Climate
A BrAzil-UK AnAlysis of ClimAte ChAnge And deforestAtion impACts in the AmAzon
Change in Brazil

4 DANGEROUS CLIMATE CHANGE IN BRAZIL
AUTHORS . BRAZIL
Jose A. Marengo(Coordinator) Ph.D,CCST-INPE,SãoPaulo,Brazil [email protected]
Carlos A. Nobre Ph.D,CCST-INPE,CEPED-MCT,SãoPaulo,[email protected]
Sin Chan Chou Ph.D,CPTEC-INPE,SãoPaulo,Brazil [email protected]
Javier Tomasella Ph.D,CCST-INPE,SãoPaulo,Brazil [email protected]
Gilvan Sampaio Ph.D,CCST-INPE,SãoPaulo,Brazil [email protected]
Lincoln M. Alves M.S,CCST-INPE,SãoPaulo,Brazil [email protected]
Guillermo O. Obregón Ph.D,CCST-INPE,SãoPaulo,Brazil [email protected]
Wagner R. Soares Ph.D,CCST-INPE,SãoPaulo,Brazil [email protected]
DANGEROUS CLIMATE CHANGE IN BRAZIL
AUTHORS . UK
Richard Betts(Coordinator) Ph.D,MetOfficeHadleyCentre [email protected]
Gillian Kay Ph.D,MetOfficeHadleyCentre [email protected]
COVER
AnaCíntiaGuazzelli(WWF)
www.metoffice.gov.uk
www.inpe.br
www.ccst.inpe.br

5DANGEROUS CLIMATE CHANGE IN BRAZIL
07 Preface JohnHirst,UKMetOffice
08 Preface GilbertoCâmara,INPE
09 Preface CarlosA.Nobre,MCT
10 Foreword
12 Part 1 | Context
1. Introduction ....................................................................................................... 17 2. Observed climate variability and tendencies ...................................................... 19 3. Seasonal extremes: droughts of 2005 and 2010, and floods of 2009 ............... 21 4. Global and regional climate change ................................................................... 25
31 Part 2 | New science and scientific development
1. How we model climate ...................................................................................... 33 2. Future climate and assessment of climate change uncertainty in Amazonia ..... 39 3. Deforestation, land use change and climate ...................................................... 43 4. Summary and conclusions................................................................................. 48
Photo:EduardoArraut/INPE
6 DANGEROUS CLIMATE CHANGE IN BRAZIL
Photo:LauraBorma/INPE
7DANGEROUS CLIMATE CHANGE IN BRAZIL
JohnHirstChief ExecutiveUK Met Office
Agreement for the UK and Brazil to work together on climate-change issues was reached when President Lula visited the UK in March 2006. Today, our two countries still work together, with the same sense of urgency his visit inspired, to assess the impacts of climate change on Brazil and the effects of deforestation on the Brazilian climate. This report highlights what has been achieved so far through the cooperation and expertise of INPE and the Met Office.
Global climate change is not in doubt, but of key importance for nations, communities and people everywhere is how the climate could be affected in their part of the world. In this project, INPE and the Met Office have combined their expertise in climate modelling and in the climate of Brazil to deepen understanding of how this may change in the future. Results show that there may be substantial increases in temperature and significant decreases in rainfall over large swathes of Brazil, including Amazonia. Among other possible impacts, this has the potential to exert pressure on the tropical forest. The threat of climate change cannot be understated, but a more immediate concern is the deforestation of Amazonia.
Forests around the world store huge amounts of carbon which is released to the atmosphere when they are cleared and burnt, accelerating climate change. Deforestation is the third largest cause of emissions after energy production and industry, placing it ahead of the transport sector. However, the Amazon forest is worth far more than the sum total of its carbon. Across the globe, we need to value our forests for all of the services they provide. A critical part of this process is developing a fuller understanding of the role of forests within the climate system, which forms a significant scientific challenge.
The INPE–Met Office collaboration has taken strides in addressing this question for Brazil by studying the effects of the loss of the Amazon forest on temperature and rainfall in the region. Model results suggest that deforestation could cause temperatures to warm over Amazonia, while the effect on rainfall could be towards drier conditions than those currently experienced. Importantly, a changing climate could interact with a fragmented and weakened forest to magnify these impacts.
The collaboration between INPE and the Met Office is critical to advancing understanding of the dual effects of climate change and deforestation in Brazil, and how these may impact upon ecosystems on which we all depend. Using this project as a foundation, together we continue to conduct cutting-edge science towards achieving these aims. Through shared research such as this, scientific challenges can be taken on and fresh insight brought to support decision-making today and for tomorrow.

8 DANGEROUS CLIMATE CHANGE IN BRAZIL
The UK-Brazil collaborative project on climate change in the Amazon is a prime example of the importance of international cooperation in 21st century science. Launched in 2006, through the joint efforts of the Hadley Centre and INPE, the project has produced significant results. Its research points out the Amazon rain forest is sensitive to climate change forces. Increases in temperature and decreases in rainfall may be higher in Amazonia than the average expected global variation.
The studies show the importance of Amazonia for the global climate and as a provider of environmental services for Brazil. They provide evidence about a tipping point in the rain forest ecosystem, beyond which there may be a partial collapse. INPE thanks the coordinators (Jose Marengo and Carlos Nobre from Brazil and Richard Betts from the UK) that motivated a dedicated team of scientists from the UK and Brazil.
Since the project started in 2006, deforestation in Amazonia changed. Through improved monitoring, strong legal actions and responsible market practices, forest clearing in Amazonia fell from 27,000 km2 in 2004 to 6,500 km2 in 2010. In the Copenhagen climate conference in 2009, the Brazilian government made an unconditional pledge to curb deforestation in Amazonia by 80% in 2020, compared to 2005. Recent data released by INPE shows that Brazil is keeping to its commitments.
By reducing deforestation in Amazonia, Brazil has averted an immediate threat. As shown by the project’s results, had the pace of deforestation continued the trend of the early 2000s, a medium-term collapse could have followed. However, Amazonia faces a menace that Brazil alone cannot avoid. If developed nations do not assume their historical responsibilities and reduce their per-capita greenhouse gas emissions, the Amazonian ecosystem could break down. The report thus carries a strong message and provides further evidence we must act to stop dangerous climate change.
GilbertoCâmaraGeneral Director of Brazil’s National Institute for Space Research, INPE, Brazil
Photo:LauraBorma/INPE

9DANGEROUS CLIMATE CHANGE IN BRAZIL
The Dangerous Climate Change in Brazil project represents a very worthwhile example of successful collaboration between the National Institute for Space Research (INPE) from Brazil and the UK Met Office-Hadley Centre. Throughout this project, we were able to build capacity for state-of-the-art climate change projections, directed to raising awareness among key stakeholders (research scientists and policy makers) about the impacts of climate change in Brazil. The aim is to empower policy makers with scientific evidence of climate change and its possible impacts in Brazil, South America and elsewhere in the world.
The experience of the UK Met Office Hadley Centre’s world leading in climate modeling, together with the experience of INPE in climate change studies on South America, have been combined in a way that allowed to identify possible climate change scenarios and impacts, making pioneering projections of the effects of anthropogenic climate change across South America. These early results indicated the likelihood of significant increases in drought conditions across parts of Brazil. Based on the new knowledge generated by this project, INPE has been developing efforts in South America to improve regional climate change scenarios, for applications in vulnerability and adaptation studies
The project made three crucial contributions in support of Brazilian involvement in the international climate change negotiations and in support of INPE´s research endeavors: • Building capacity within Brazil for policy-relevant climate change assessments.• Generation of specific policy-relevant information relating to issues of adapting to climate change and assessing risks of dangerous climate change across Brazil, both for the 2nd National Climate Change Communication and international negotiations and conventions• Improving the scientific collaboration on assessing the impacts of climate change in key sectors of society and economy.
Although the climate change projections generated by this collaboration covered all Brazil, the focus of this report is on Amazonia, a region of national, regional, and global concern.
As a legacy, this project has generated new methods for assessing the impacts of both climate change and the direct human impacts on the landscape and ecology of Brazil, and also a new land cover dataset for use in regional climate modeling was produced. This work will be continued as part of the scientific agendas of the National Institute of Science and Technology for Climate Change (INCT-Climate Change) from the Brazilian Research Council (CNPq), and the Brazilian Climate Change Network (Rede-CLIMA). Last, but not least, the project helped to strengthen scientific and cultural ties between the UK and Brazil.
CarlosA.NobreNational Secretary for R&D Policies and Programs. Ministry of Science and Technology of Brazil, MCT, Brasilia, Brazil

10 DANGEROUS CLIMATE CHANGE IN BRAZIL
Scientific and Societal
Contexts
Photo:LauraBorma/INPE

11DANGEROUS CLIMATE CHANGE IN BRAZIL
According to the Fourth Assessment Report of the Intergovernmental Panel on Climate Change (IPCC AR4 2007), it is very likely that the rise in global average temperatures observed over the last 50 years were caused mainly by anthropogenic increases in greenhouse gas concentrations. This change has been affecting climate, the hydrological cycle and extremes, with impacts on the availability of global and regional water resources. The Amazon forest plays a crucial role in the climate system, helping to drive atmospheric circulation in the tropics by absorbing energy and recycling about half of the rainfall that falls on it. Previous studies have characterized the variability of water resources over Amazonia and their dynamics with time and distribution over the region, but only due to natural climate variations and on interannual and decadal time scales. Furthermore, human economic activities such as urbanization, cattle growing and ranching, as well as agricultural development have affected vegetation coverage, and the changes in land use and land cover due to intensive large scale deforestation could have impacts on the regional and global climate.
As the agricultural front expands, changing land use leads to the alteration of Amazonian ecosystems. Deforestation and subsequent biomass burning result in the injection of large volumes of greenhouse gases and aerosols, and could exacerbate the changes already produced by natural climate variability. In addition to the foreseeable increased deforestation, the following are also a threat: extinction and/or reduced diversity of fish species in an area considered a fisheries hotspot; the accumulation in reservoirs of sediments and toxic levels of mercury; impacts on riverbank dwellers and indigenous peoples, as well as urban communities.
Amazonia can be categorized as a region at great risk due to climate variability and change. The risk is not only due to projected climate change but also through synergistic interactions with existing threats not related to climate change, such as land clearance, forest fragmentation and fire. Some model projections have shown that over the next several decades there is a risk of an abrupt and irreversible change over a part or perhaps the entirety of Amazonia, with forest being replaced by savanna-type vegetation with large-scale loss of biodiversity and loss of livelihoods for people in the region, and with impacts of climate in adjacent regions and worldwide. However, the uncertainties of this kind of modelling are still high.
The Earth System Science Center (CCST) of the Brazilian National Institute for Space Research (INPE) and the UK’s Met Office-Hadley Centre are working together on assessing the implications of global climate change for Brazil. They are also assessing the impact of deforestation on the Brazilian climate. The Dangerous Climate Change in Brazil project (DCC) uses a set of global and regional climate models developed by the Met Office and INPE to project the effects of greenhouse gas emissions on climate worldwide, and provide finer detail over Brazil. Although the projections covered all of Brazil, the focus of this report is on Amazonia, a region of national, regional, and global concern. The report is divided into two sections: the first providing context to the work, and the second detailing new science carried out and looking forward to further policy and planning-relevant scientific developments. The DCC project was funded by the UK Government’s Strategic Programme Fund, the former Global Opportunity Fund (GOF), and this work is continued as part of the scientific agendas of the National Institute of Science and Technology for Climate Change (INCT-Climate Change) from the Brazilian Research Council (CNPq), and the Brazilian Climate Change Network (Rede-CLIMA).
J. Marengo, R. Betts, C. Nobre, G. Kay, S. C. Chou, G. Sampaio
12 DANGEROUS CLIMATE CHANGE IN BRAZIL
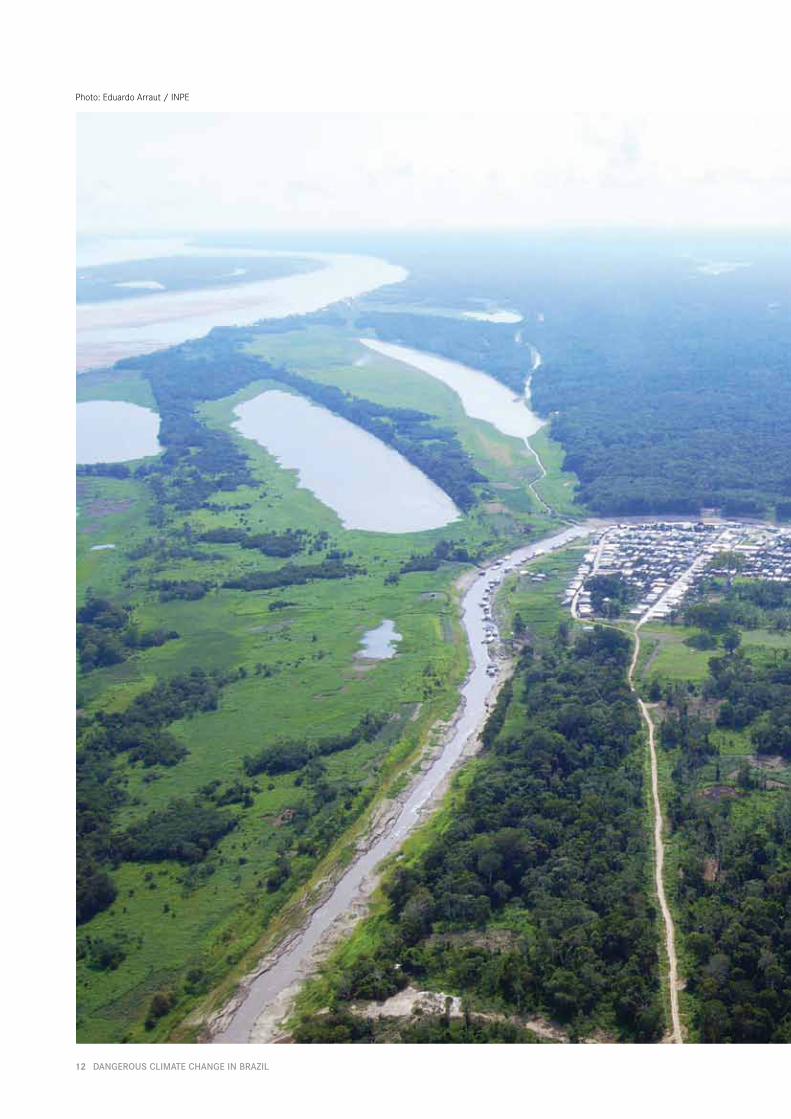
Photo:EduardoArraut/INPE
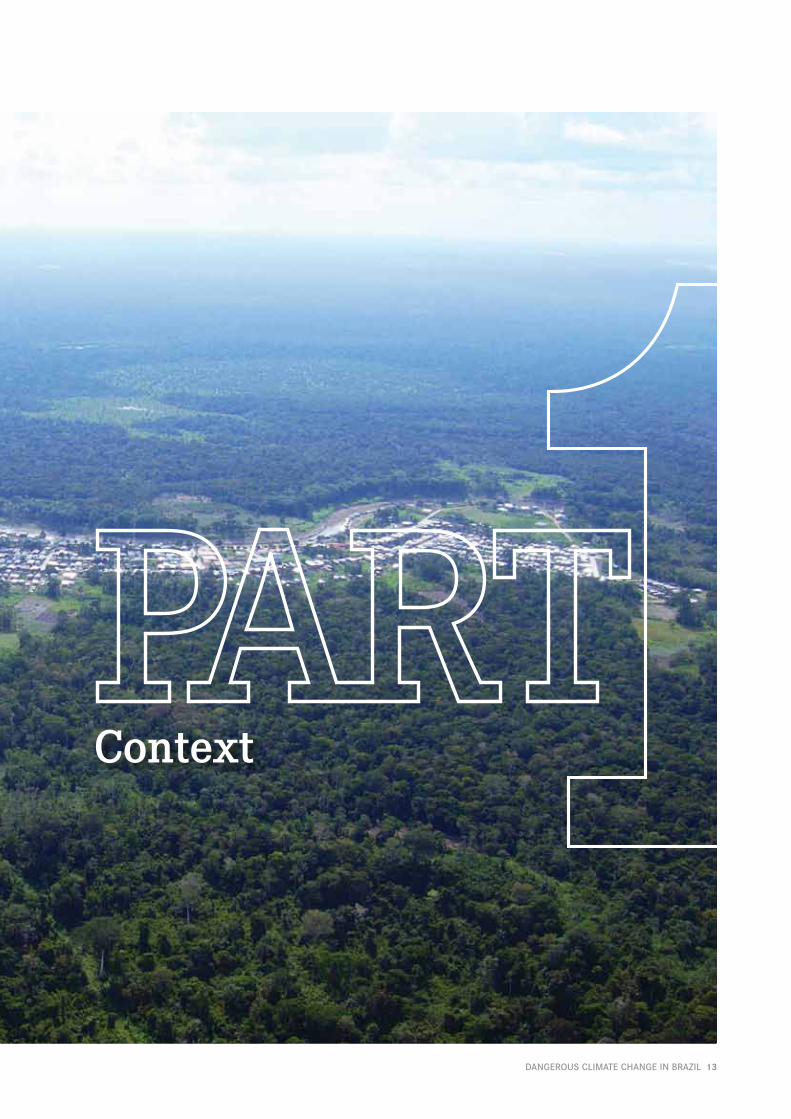
13DANGEROUS CLIMATE CHANGE IN BRAZIL
Context
14 DANGEROUS CLIMATE CHANGE IN BRAZIL
Brazil-UK partnership in climate science
The Earth System Science Center (CCST) of the Brazilian National Institute for Space Research (INPE) and the UK’s Met Office Hadley Centre have been working together on assessing the implications of global climate change for Brazil, and for Amazonia in particular – a region of national, regional and global concern. They have also assessed how deforestation within the Amazon may affect the local and regional climate.
The project has used a set of climate models developed by the Met Office and INPE to project the effects of greenhouse gas emissions and deforestation on the climate of Brazil. The Met Office global climate model was used to project climate changes worldwide, and the INPE regional climate model then provided finer detail over Brazil and Amazonia for different levels of global warming. Regional climate models were also used to assess the effects of deforestation in the Amazon on the local and regional climate.
ExecutiveSummary
Climate extremes and impacts in Amazonia
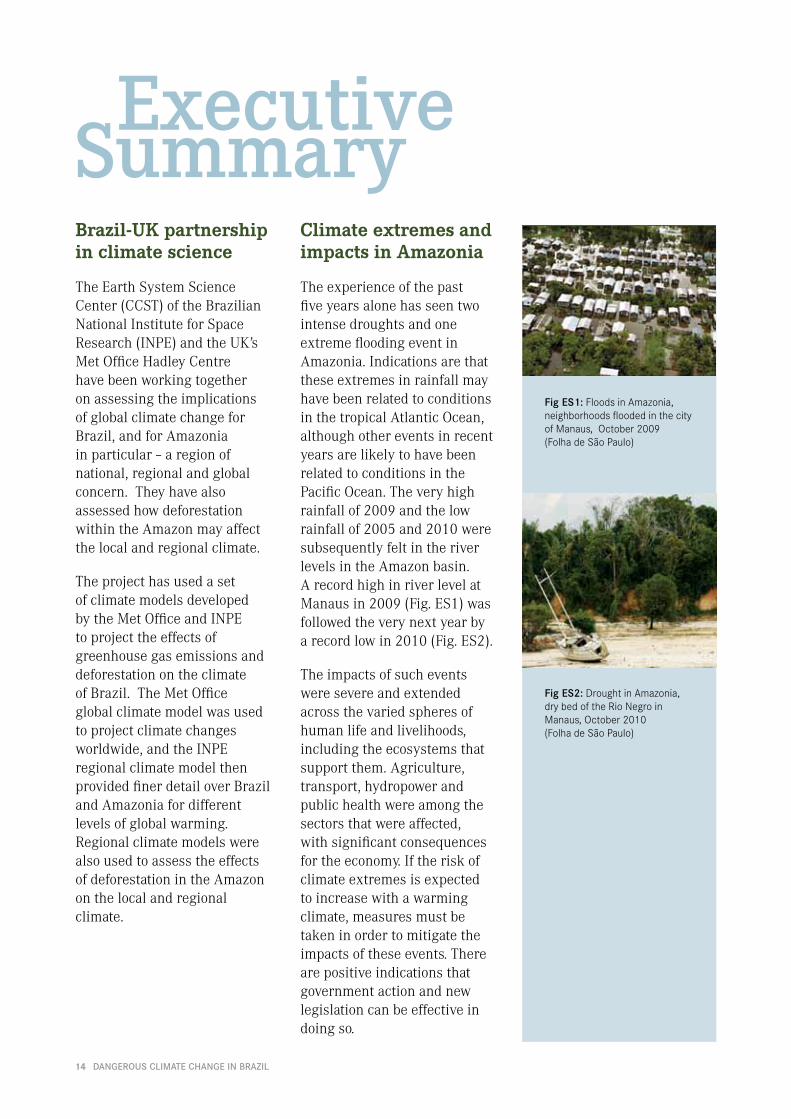
The experience of the past five years alone has seen two intense droughts and one extreme flooding event in Amazonia. Indications are that these extremes in rainfall may have been related to conditions in the tropical Atlantic Ocean, although other events in recent years are likely to have been related to conditions in the Pacific Ocean. The very high rainfall of 2009 and the low rainfall of 2005 and 2010 were subsequently felt in the river levels in the Amazon basin. A record high in river level at Manaus in 2009 (Fig. ES1) was followed the very next year by a record low in 2010 (Fig. ES2).
The impacts of such events were severe and extended across the varied spheres of human life and livelihoods, including the ecosystems that support them. Agriculture, transport, hydropower and public health were among the sectors that were affected, with significant consequences for the economy. If the risk of climate extremes is expected to increase with a warming climate, measures must be taken in order to mitigate the impacts of these events. There are positive indications that government action and new legislation can be effective in doing so.
Fig ES1:FloodsinAmazonia,neighborhoodsfloodedinthecityofManaus,October2009(FolhadeSãoPaulo)
Fig ES2:DroughtinAmazonia,drybedoftheRioNegroinManaus,October2010(FolhadeSãoPaulo)

15DANGEROUS CLIMATE CHANGE IN BRAZIL
Climate change in Amazonia: impact of different emissions scenarios
The global average temperature rose by approximately 0.7°C over the last century, and this warming will continue as a result of historical and ongoing greenhouse gas (GHG) emissions. The Met Office-INPE climate model projections are for large increases in air temperatures and percentage decreases in rainfall in Amazonia, with the changes becoming more prominent after 2040 (Fig ES3). The projected decreases in rainfall may be as a result of warmer waters in the Atlantic and Pacific Oceans causing changes in wind patterns and the transport of moisture across South America. This could lead to major economic impacts in Brazil: more than 70% of Brazil’s energy is derived from hydroelectric sources, so reduced rainfall may limit electricity supplies, affecting the industrial activities in the economically most important regions of Brazil.
However, these impacts can be mitigated if action is taken now to reduce emissions. Smaller increases in GHGs in the atmosphere lead to relatively lower levels of warming both globally and in Brazil, and to smaller impacts on rainfall and river flow. This provides further scientific evidence for the need to stabilise GHGs in the atmosphere.
RAINFALL CHANGE (%)ANNUAL MEAN TEMPERATURE CHANGE ( ºC )
Global Brazil
6.2+ 7.7+
4.8+ 6.0+
1.8+ 2.0+
Figure ES3. Projected climate change over Brazil by the 2080s relativeto 1961-1990 associated with different levels of global warming. Theseprojections used the Met Office global climate model and INPE regionalclimatemodeldrivenbydifferentemissionsscenariosusingdifferentmodelvariants to assess uncertainties in climate response. Projected globalwarmingiswithintherangeprojectedbyothermodels,andtheprojectionoffasterwarmingoverBrazilincomparisontotheglobalaveragewarmingisalsomadebyothermodels. Regionalrainfallresponsestoglobalwarmingvarywidelybetweendifferentmodels.IfthegeneralpatternisforglobalwarmingtodecreaserainfallinAmazonia(asshownherefortheDecember-January-February season), greater global warming results in greater reductions inrainfall. From top to bottom, the emissions scenarios are the IPCC SRESscenariosA1FI,A1B,andB1; theB1projectionshownhereusesamodelwithlowerclimatesensitivity.
16 DANGEROUS CLIMATE CHANGE IN BRAZIL
Impacts of deforestation on Brazilian climate
While climate change is a threat to the Amazon forest in the long term, through warming and potential rainfall reductions, deforestation is a more immediate threat. The Amazon is important globally for taking in and storing carbon from the atmosphere, and it also plays a crucial role in the climate of South America through its effect on the local water cycle.
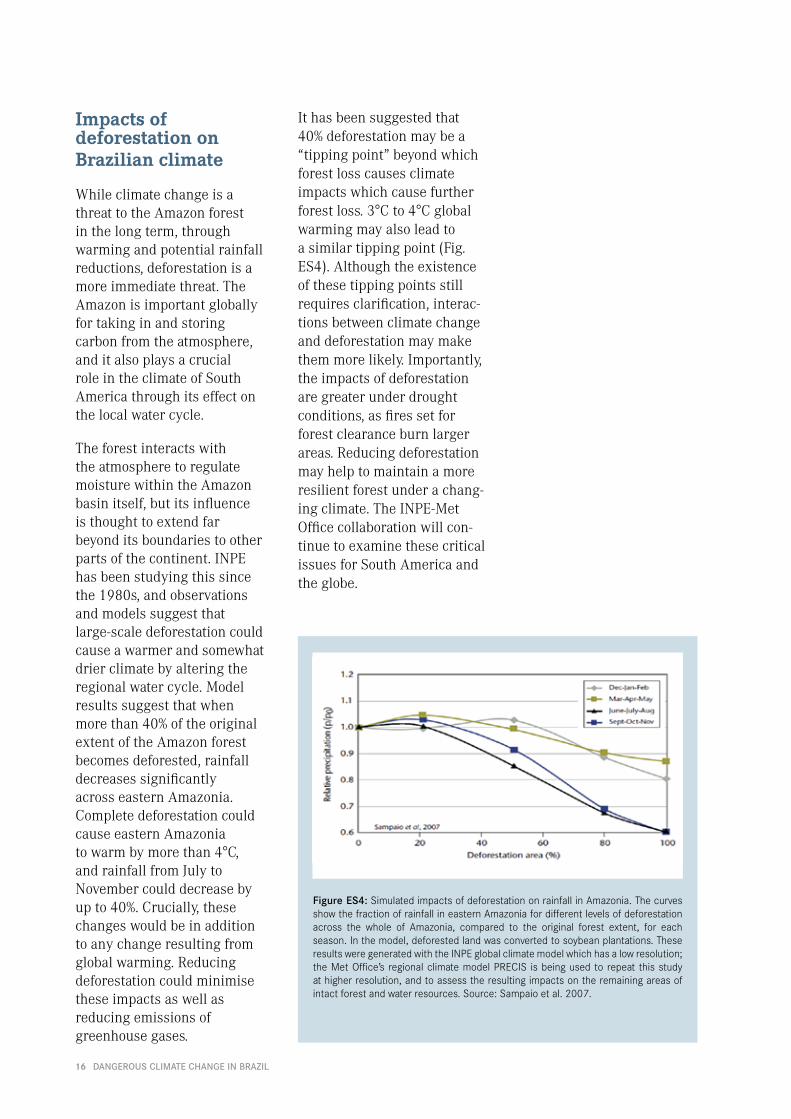
The forest interacts with the atmosphere to regulate moisture within the Amazon basin itself, but its influence is thought to extend far beyond its boundaries to other parts of the continent. INPE has been studying this since the 1980s, and observations and models suggest that large-scale deforestation could cause a warmer and somewhat drier climate by altering the regional water cycle. Model results suggest that when more than 40% of the original extent of the Amazon forest becomes deforested, rainfall decreases significantly across eastern Amazonia. Complete deforestation could cause eastern Amazonia to warm by more than 4°C, and rainfall from July to November could decrease by up to 40%. Crucially, these changes would be in addition to any change resulting from global warming. Reducing deforestation could minimise these impacts as well as reducing emissions of greenhouse gases.
Figure ES4:SimulatedimpactsofdeforestationonrainfallinAmazonia.ThecurvesshowthefractionofrainfallineasternAmazoniafordifferentlevelsofdeforestationacross the whole of Amazonia, compared to the original forest extent, for eachseason.Inthemodel,deforestedlandwasconvertedtosoybeanplantations.TheseresultsweregeneratedwiththeINPEglobalclimatemodelwhichhasalowresolution;theMetOffice’s regionalclimatemodelPRECIS isbeingused to repeat thisstudyathigherresolution,andtoassesstheresultingimpactsontheremainingareasofintactforestandwaterresources.Source:Sampaioetal.2007.
It has been suggested that 40% deforestation may be a “tipping point” beyond which forest loss causes climate impacts which cause further forest loss. 3°C to 4°C global warming may also lead to a similar tipping point (Fig. ES4). Although the existence of these tipping points still requires clarification, interac-tions between climate change and deforestation may make them more likely. Importantly, the impacts of deforestation are greater under drought conditions, as fires set for forest clearance burn larger areas. Reducing deforestation may help to maintain a more resilient forest under a chang-ing climate. The INPE-Met Office collaboration will con-tinue to examine these critical issues for South America and the globe.

17DANGEROUS CLIMATE CHANGE IN BRAZIL
Introduction
With global temperatures projected to increase over the coming century,1 the associated impacts of climate change will be felt around the world and are likely to have profound implications for human populations. A priority therefore is to develop understanding of how regional climate may change, and assess regional climate change risk associated with different levels of greenhouse gas emissions. This information is critical to support decision-making systems for mitigation strategy and adaptation planning.
Existing global climate change projections indicate that like most regions of the world, Brazil will be exposed to a changing climate. With Brazilian population and activities already sensitive to the climate, the nature and degree of changes in the future could be very important to life in the country. Some studies have shown that changes in climate could possibly lead to a die-back of the Amazon rainforest, that rich centre of biodiversity, oxygen, and fresh water. However, the regional signature of global climate change is not the only process to act upon the forest. Direct deforestation is a more immediate threat, and may have implications for the climate within the Amazon basin and beyond.
(J. Marengo, R. Betts - coordinators of the GOF DCC Project)
The Amazon in the regional and global earth systems
The Amazon is important to the global carbon budget through its role in taking in and storing carbon from the atmosphere within the trees and the soil. The global forestry industry currently accounts for approximately 17% of greenhouse gas emissions, behind only energy supply (26%) and industry (19%).2 But it is not just at the global scale that it is important. The Amazon forest also plays a crucial role in the climate of South America through its effect on the regional water cycle. The forest interacts with the atmosphere to regulate moisture within the basin. Moisture is transported into the Amazon region from the tropical Atlantic by the trade winds. After the rain falls, intense evaporation and recycling of moisture is performed by the tropical forest, and then a large part of this evaporation is returned to the Amazon region as rain (Fig. 1). It is estimated that between 30% and 50% of the rainfall within the Amazon Basin to consist of recycled evaporation.3 Furthermore, moisture originating in the Amazon basin is transported by the winds to other parts of the continent, and is thought to be important in feeding rainfall in regions remote from the Amazon itself.4
1. IPCC2007a2. IPCC2007b3. Molion1975;Salati1987;EltahirandBras19984. Marengoetal.2004

18 DANGEROUS CLIMATE CHANGE IN BRAZIL
Both direct deforestation and climate change have the potential to seriously hamper the functioning of the Amazon as a forest ecosystem, reducing its capacity to retain carbon, disrupting the regional water cycle, increasing its soil temperature and eventually forcing the Amazon through a gradual process of savannization. The issue of Amazon die-back leapt from climate change projection to global environmental concern with the intense Amazonian droughts of 2005 and 2010. Droughts and floods are part of the natural climate variability of the Amazon Basin and individual events cannot be attributed directly to climate change or assumed to be a consequence of large scale deforestation in the basin.
However, these droughts and floods and associated loss of life and livelihoods serve as reminders of why research such as the DCC project is crucially important.
Figure 1:RegionalhydrologicalcycleintheAmazonregion
The forest-climate
system is complex and inter-
connected, and demands a
better understanding of how
it functions, and how that may
change in the future in the
face of human action including
climate and land use change.
Only then can informed
decisions be made.

19DANGEROUS CLIMATE CHANGE IN BRAZIL
Observed climate variability and tendencies
Brazil has warmed by about 0.7 °C over the last 50 years, which is higher than the best estimate of the global average increase of 0.64 °C. 5 Con-sidering the trend in the Brazilian winter season temperatures alone, the trend is even greater at 1 °C. For the Amazon region, where observations are available, increasing temperatures have similarly been measured in day- and night-time temperatures. The exact trends vary depending on the beginning and end of the observing pe-riod,6 but all records show a detectable increase.
Observational research has shown no clear signs of negative trends in rainfall in Amazonia,7 although one study8 did detect a significant trend towards drier conditions in the southern Amazon region over the last thirty years of the 20th century. However, the detection of any unidi-rectional trend may depend of the length of time series. Figure 2 shows annual rainfall trends in some stations in the Amazon region using records from stations for which data were avail-able: 1951-2005 and 1981-2005. It is difficult to detect trends at regional level, but from what these data show, at a local, station scale, there are more cases where a slight increase in rain-fall has been measured since 1980 in northern Amazonia, while a rainfall decrease is more of a feature in southern Amazonia (Fig. 2b). These trends are consistent with previous studies.9 Over the longer term, 1951-2005 (Fig. 2a), the sparse nature of the measurements as well as the mixture in tendency towards wetter or drier
(G. Obregon, J. Marengo)
5. IPCC2007a6. Victoriaetal.1998;Marengo20037. Marengo2004;2009;ObregonandMarengo2007;Satyamurtyetal.20098. Lietal.20089. Marengo2004;2009;ObregonandMarengo2007;Satyamurtyetal.2009
Figure 2:Trendsofrainfall inAmazonia.a)Annualrainfallin percent, related to their average value, for 1951-2005;b)Annualrainfallinpercent,relatedtotheiraveragevalue,for 1981-2005. Black edging to the triangles indicatesstatistically significant trends at the 95% confidence level.Notethatthescaleisdifferentinthetwodiagrams.
conditions make it difficult to draw conclusions about trends across Amazonia.

20 DANGEROUS CLIMATE CHANGE IN BRAZIL
The studies demonstrate that there is no consistent signal towards either wetter or drier conditions over the Amazon region over the observational record. In general, the size and direction of the trends depend on the rainfall data sets: how long they are, if there are breaks in the recording, and if and how they are aggregated. In a region where measurements are very scarce, the uncertainty in the size and direction of any trends must be high.
10. Marengo2004;200911. Lietal.200812. ObregónandNobre2003;Marengo200413. ObregónandNobre2003;Marengo200414. Ronchailetal.2002;Marengo2004;Marengoetal.2008a15. INPE201016. Coxetal.2008;Goodetal.2008;Marengoetal.2008a;b; Tomasellaetal.2010a;b17. Fuetal.200118. Chenetal.200119. Collinsetal.201020. Coxetal.2008;Goodetal.2008;Marengoetal.2008a;b; Tomasellaetal.2010a;b
Other studies have suggested that for Amazonia, more important than any linear trend is the presence of decade to decade variations in the rainfall,10 known as decadal scale rainfall variability. Decadal variability may help to explain some of the tendencies towards wetter or drier conditions that have been recorded. For example, the period 1945-1976 was relatively wet, and 1977-2000 relatively dry in Amazonia. Measurements taken over this period would show a transition from wetter to drier conditions over this period, and may help to explain the apparent short-term drying trend in southern Amazonia in the study described above.11 It has been shown that the strong rainfall reductions over western Amazonia observed between 1951 and 1990 was modulated by a decadal oscillation.12 Variations in rainfall such as these are thought to be related to decadal scale climate variability in the Pacific Ocean,13 which affects rainfall in the Amazon through changes to the atmospheric circulation. Decadal variability in climate occurs naturally in the absence of human-induced changes to climate or to the land.
As well as decadal variability in rainfall in the Amazon, there are also year to year variations, known as interannual climate variability. At interannual time scales, the El Niño-Southern Oscillation (ENSO) phenomenon, which is centred in the tropical Pacific Ocean but has worldwide reach, has been recognized as one of the major patterns that affect climate in Amazonia. Droughts have been reported during some intense El Niño
Obtaining reliable estimates
of the size and direction of trends
in rainfall across Amazonia is a
significant challenge in a region
where measurements are very scarce.
events, as in 1912, 1926, 1983 and 199814. The 2010 drought began during an El Niño event in early austral summer of 2010 and then became more intense during a La Niña event. It was the below average summer rainfall, which may be associated with the El Niño, that caused the low river levels experienced in the austral autumn.15
However, during the 2010 drought, there were also higher than normal sea surface temperatures in the tropical North Atlantic, which have previously been associated with drought events that occurred during non-El Niño years such as 1964 and 2005.16 The Amazon is connected to, influences, and is influenced by the global climate system. Climate variability in other parts of the planet, but particularly in the tropical Pacific or Atlantic Oceans, can potentially force variations in the climate of the Amazon.17
It is still unclear whether these naturally-occurring variations in the climate of the Amazon can offset or overshadow the effects of deforestation or human-induced climate change.18 There is no reason to expect the naturally-occurring variations to operate independently of human-induced climate change. It could be that the natural variations are superimposed upon a trend in climate, or that climate change could affect the characteristics of the cycles of climate variability. For example, climate change is likely to affect the processes that control the behaviour of ENSO, which could modify aspects such as the magnitude, the frequency or the timing of El Niño/La Niña episodes. Climate change could also affect the manner in which remote influences such as ENSO connect with rainfall over the Amazon. However, the ways in which the processes that control ENSO behaviour and impacts interact are complex, and may enhance or counterbalance each other. As yet, it is not clear how ENSO will behave in the future.19 The relationships between climate change and systems of climate variability, as well as their impacts on drought behaviour in Amazonia,20 for example, are questions that are the subject of ongoing research.

21DANGEROUS CLIMATE CHANGE IN BRAZIL
Seasonal extremes: droughts of 2005 and 2010, and floods of 2009
21. Zengetal.2008;Marengoetal.2008a,b;Coxetal.200822. Saleskaetal.2007;Philipsetal.2009;Samantaetal.201023. Tomasellaetal.2010a24. Brownetal.2006;Aragãoetal.2008;Boyd2008;Tomasellaetal.2010b
Drought of 2005
The 2005 drought has been studied from meteorological,21 ecological,22 hydrological23 and human perspectives.24 Large sections of southwestern Amazonia experienced one of the most intense droughts of the last hundred years. The drought did not affect central or eastern Amazonia, a pattern different from the El Niño-related droughts of 1926, 1983 and 1997/1998, and instead has been related to high sea temperatures in the tropical North Atlantic, which effectively pull the trade winds — and all of the moisture they carry — to the north, away from the Amazon. Figure 3 shows that rainfall anomalies in western and southern Amazonia approached 100 mm per month below the long term average of 200-400 mm/month during the austral summer of 2005 in southern Amazonia, while in the same region, excesses of above 100 mm per month were detected during the extreme wet summer of 2009 (Fig. 4).
Figure 3: Monthly rainfall anomalies (in mm/month, difference from 1961-2009long-termaverage)duringdroughtofNovember2004toOctober2005.Redcoloursindicatedrierconditionsthannormal;bluecoloursindicatewetterconditions.Source:GPCC
(J. Marengo, J. Tomasella, L. Alves, W. Soares)
22 DANGEROUS CLIMATE CHANGE IN BRAZIL
25. Marengoetal.2008b
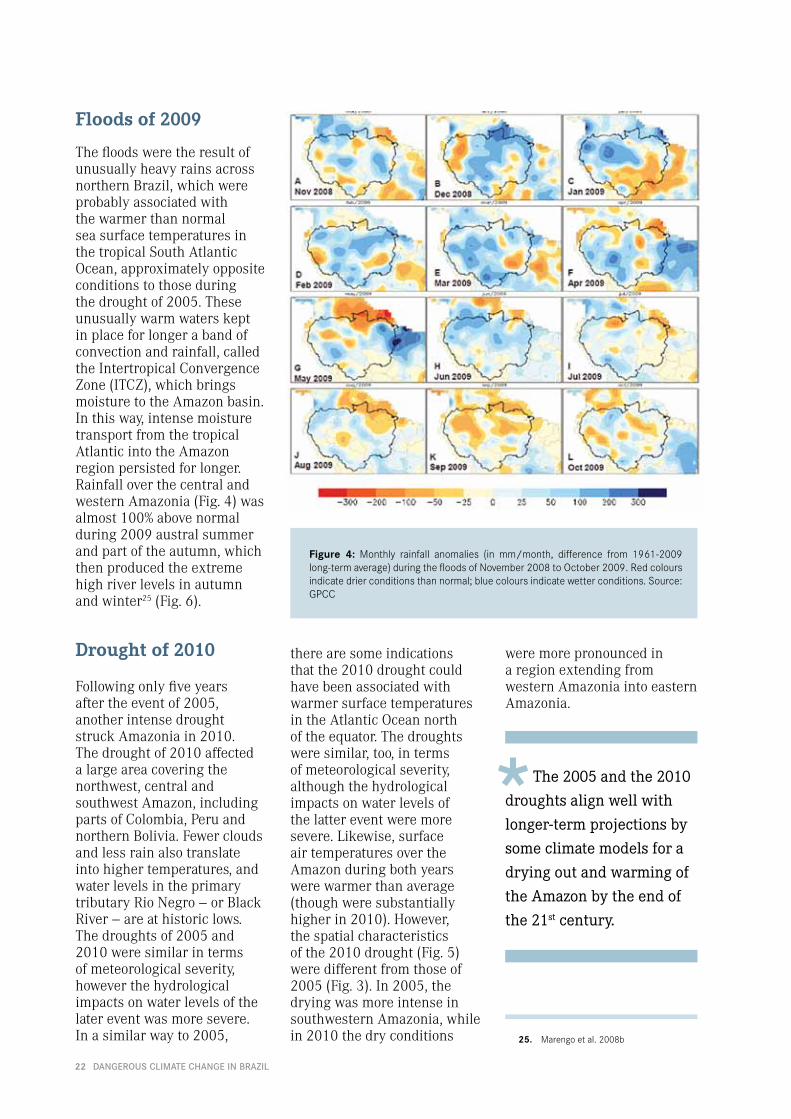
Figure 4: Monthly rainfall anomalies (in mm/month, difference from 1961-2009long-termaverage)duringthefloodsofNovember2008toOctober2009.Redcoloursindicatedrierconditionsthannormal;bluecoloursindicatewetterconditions.Source:GPCC
Floods of 2009
The floods were the result of unusually heavy rains across northern Brazil, which were probably associated with the warmer than normal sea surface temperatures in the tropical South Atlantic Ocean, approximately opposite conditions to those during the drought of 2005. These unusually warm waters kept in place for longer a band of convection and rainfall, called the Intertropical Convergence Zone (ITCZ), which brings moisture to the Amazon basin. In this way, intense moisture transport from the tropical Atlantic into the Amazon region persisted for longer. Rainfall over the central and western Amazonia (Fig. 4) was almost 100% above normal during 2009 austral summer and part of the autumn, which then produced the extreme high river levels in autumn and winter25 (Fig. 6).
Drought of 2010
Following only five years after the event of 2005, another intense drought struck Amazonia in 2010. The drought of 2010 affected a large area covering the northwest, central and southwest Amazon, including parts of Colombia, Peru and northern Bolivia. Fewer clouds and less rain also translate into higher temperatures, and water levels in the primary tributary Rio Negro — or Black River — are at historic lows. The droughts of 2005 and 2010 were similar in terms of meteorological severity, however the hydrological impacts on water levels of the later event was more severe. In a similar way to 2005,
there are some indications that the 2010 drought could have been associated with warmer surface temperatures in the Atlantic Ocean north of the equator. The droughts were similar, too, in terms of meteorological severity, although the hydrological impacts on water levels of the latter event were more severe. Likewise, surface air temperatures over the Amazon during both years were warmer than average (though were substantially higher in 2010). However, the spatial characteristics of the 2010 drought (Fig. 5) were different from those of 2005 (Fig. 3). In 2005, the drying was more intense in southwestern Amazonia, while in 2010 the dry conditions
were more pronounced in a region extending from western Amazonia into eastern Amazonia.
The 2005 and the 2010
droughts align well with
longer-term projections by
some climate models for a
drying out and warming of
the Amazon by the end of
the 21st century.

23DANGEROUS CLIMATE CHANGE IN BRAZIL
Figure 5: Monthly rainfall anomalies (in mm/month, difference from 1961-2009long-term average) during the drought of November 2009 to October 2010. Redcoloursindicatedrierconditionsthannormal;bluecoloursindicatewetterconditions.Source:GPCC
Figure 6: AnnualvaluesofthelevelsoftheRioNegroinManaus,Brazil(inmeters),forsomeextremedryyears(1964,2005,1998,and2010)ascomparedtothelongtermaverage1903-1986.Source:CPRM
Impacts of these extremes
In July of 2009, flooding in the Brazilian Amazon reached an all-time high since records began in 1903, displacing thousands of people across the region. Water levels were measured at 29.75m at a station on the Rio Negro in Manaus, the Amazon’s largest city, which exceeded the previous record of 29.69m set in 1953.26 The 2009 flooding came just five years after the severe 2005 drought, where low levels of the Rio Negro in Manaus were reported (Fig. 6). The communities living on the river banks or in the urban areas of cities like Manaus suffered the direct and delayed impacts of the rising waters on their lives, their health, and the economy. There were severe public health issues such as leptospirosis and water-borne diseases, damage to infrastructure and property, and education suffered as children and teachers were unable to get to school. Affected also was the biodiversity of the Amazon and many endangered species were put under pressure.27
The very next year, 2010, brought another intense drought, and from its record high in 2009, the level of the Rio Negro fell to an all time low of 13.63 m at Manaus on 24 October, falling just further than the previous record low of 13.64 m in 1963.28 Fishing activity and water supplies in the region were seriously affected due to the extreme low river levels. Local newspapers reported that fishing production, which is normally about 10 Tons/month, dropped to 1 Ton/month due to the drought. Studies analysing the impacts of the drought of 2010 are ongoing, but if
26. Marengoetal.2010a27. INPE201028. CPRM2010

24 DANGEROUS CLIMATE CHANGE IN BRAZIL
29. Tomasellaetal.2010b30. NegrónJuárezetal.201031. Marengoetal.2008b32. Marengoetal.2010a33. IPCC2007c
The 2005 drought left thousands of people in want of food. Transportation networks, agriculture and livelihoods were seriously affected, and hydropower generation compromised. The drought had immediate impacts, but also brought indirect and delayed problems to the populations and ecosystems.
the experience of the 2005 drought can be regarded as an indicator, the impacts are likely to have been substantial.
The drought of 2005 had devastating effects upon the human populations along the main channel of the Amazon River and its western and southwestern tributaries: the Solimões (also known as the Amazon River in the other Amazon countries) and the Madeira Rivers, respectively. The river levels fell to historic lows and navigation along these channels had to be suspended. The drop in river levels and drying of floodplain lakes led to high fish mortality, which then affected local populations for whom fishing forms an important component of their livelihoods. The 2005 drought was more severe in this respect than that associated with the 1997/98 El Niño, because the underlying meteorological conditions favoured more intense evaporation, enhancing the desiccation of the lakes.29
The very dry conditions had direct impact on the Amazon forest itself, causing tree mortality, but degradation of the forest caused by climate extremes could then be exacerbated by increased vulnerability to stresses such as wind, storm or fire damage. To give one example, a cluster of storms travelling across Amazonia in 2005 was estimated to have killed between 0.3 and 0.5 million trees in the Manaus region alone, equivalent to 30% of the observed deforestation reported in 2005 over the same area.30 In addition, the dry conditions were ideal
Comparing the drought events of 2005 and 2010 with a previous one in 1996/97, it has been apparent that the social and economical impacts on the local population of the more recent droughts have been less intense (although the full impacts of the 2010 drought are yet to be comprehensively assessed). This may be attributed to more effective government action and new legislation. For effective management, there must be good information about the regional climate now and how it may change in the future.
for the spread of wildfires, which destroyed hundreds of thousands of hectares of forest. The extensive smoke emanating from the fires caused health problems in people and closed airports.31
The 2005 drought left thousands of people in want of food. Transportation networks, agriculture and livelihoods were seriously affected, and hydropower generation compromised.32 The drought had immediate impacts, but also brought indirect and delayed problems to the populations and ecosystems.
In sum, the Amazon region has experienced two extreme dry spells in just 5 years. This does not include the drought of 2006-2007, which affected only the southeastern Amazon and which left 10 thousand km2 of forest scorched in the region (Tomasella et al 2010a). Within the same period the population has also had to contend with the record flooding of 2009. The Amazon is periodically subject to floods and droughts, but these recent examples highlight the vulnerability to today’s extremes of climate of the human populations and the ecosystems upon which they depend. If the risk of climate extremes is expected to increase with a warming climate, discussed in greater detail in Section 4, the kinds of impacts outlined here would be expected on a more frequent basis.33 However, the magnitude of an event does not necessarily map to a set of impacts in a straightforward manner. Aside from the particular physical characteristics of an event
(magnitude, spatial signature, preceding conditions etc.), the severity of impacts can depend on the structures put in place to manage the event and its aftermath.

25DANGEROUS CLIMATE CHANGE IN BRAZIL
Global and regional climate change(C. Nobre, J. Marengo, G. Sampaio, R. Betts, G. Kay)
What is climate change?
Throughout history, the Earth’s climate has been changing as a result of natural processes such as orbital variations, volcanic eruptions and changes in solar output. And even if these factors were constant, there would still be variability in the climate system. There is natural variability in climate on time scales from seasons to centuries – such as the droughts and floods described in the previous section – which means that we never expect one year or decade to be the same as the next. But in the last century or so there have been rapidly increasing levels of greenhouse gases in the atmosphere. The ‘greenhouse effect’ is a natural process. After absorbing energy from the sun, the earth emits heat towards space, some of which is absorbed by gases in the atmosphere. Without this natural greenhouse effect, global average temperatures would be much colder than they are today, and life on this planet
would not exist as we know it. Human activities such as power generation based on fossil fuels and deforestation have enhanced this natural process by introducing extra greenhouse gases into the atmosphere, which then absorb more heat. So, with rising concentrations of greenhouse gases in the atmosphere, global temperatures have likewise increased. Because of the longevity of previously-emitted greenhouse gases in the atmosphere, as well as some inertia within the earth system, there is already a commitment to some level of climate change into the future regardless of how emissions evolve. If emissions continue, larger climate changes may be expected. Climate models are the most credible tools available for making projections of the future climate. They enable projections to be made not only of how global average temperatures may rise over the 21st century, but also how these changes may play out in the climates across the globe.
Photo:Stock.xchng

26 DANGEROUS CLIMATE CHANGE IN BRAZIL
Future climate change
The Intergovernmental Panel on Climate Change (IPCC) Fourth Assessment Report (AR4, 2007) brought together projections from more than twenty state-of-the-art climate models, which were developed by institutions around the world. The models were run according to different scenarios of greenhouse gases concentrations in the atmosphere – from high emissions to low (IPCC Special Report on Emissions Scenarios,34 SRES). Because we cannot predict the future greenhouse gas emissions trajectory – which will depend on factors such as demographic change and
34. Naki enovi etal.2000
energy production decisions – we must rely on scenarios, which represent different emissions pathways. Each climate model is different and therefore simulates a different version of a potential future climate. However, they demonstrate that under higher concentrations of greenhouse gases, larger changes may be expected and these are hence likely to lead to more severe impacts. All models simulate increases in global temperatures over the coming century. There are some noteworthy broad patterns of change that are common to each emissions scenario, but differ in intensity. For example, the Polar Regions are projected to warm more than other parts, owing to
radiation-ice feedbacks and atmospheric responses. Land masses are understood to warm more rapidly than the oceans due to the different radiative balance of land and water, and so we can generally expect any individual country - such as Brazil - to warm more than the global average. Projections of future rainfall present a rather more complicated picture, as there is some disagreement between the models as to the patterns or even, in some places, the direction of change. However, they do indicate that the changes will not be uniform across the globe, with modified circulation patterns leading to wetter conditions simulated in some areas, and drier in others.
Photo:Stock.xchng
27DANGEROUS CLIMATE CHANGE IN BRAZIL
Climate change and Amazonia
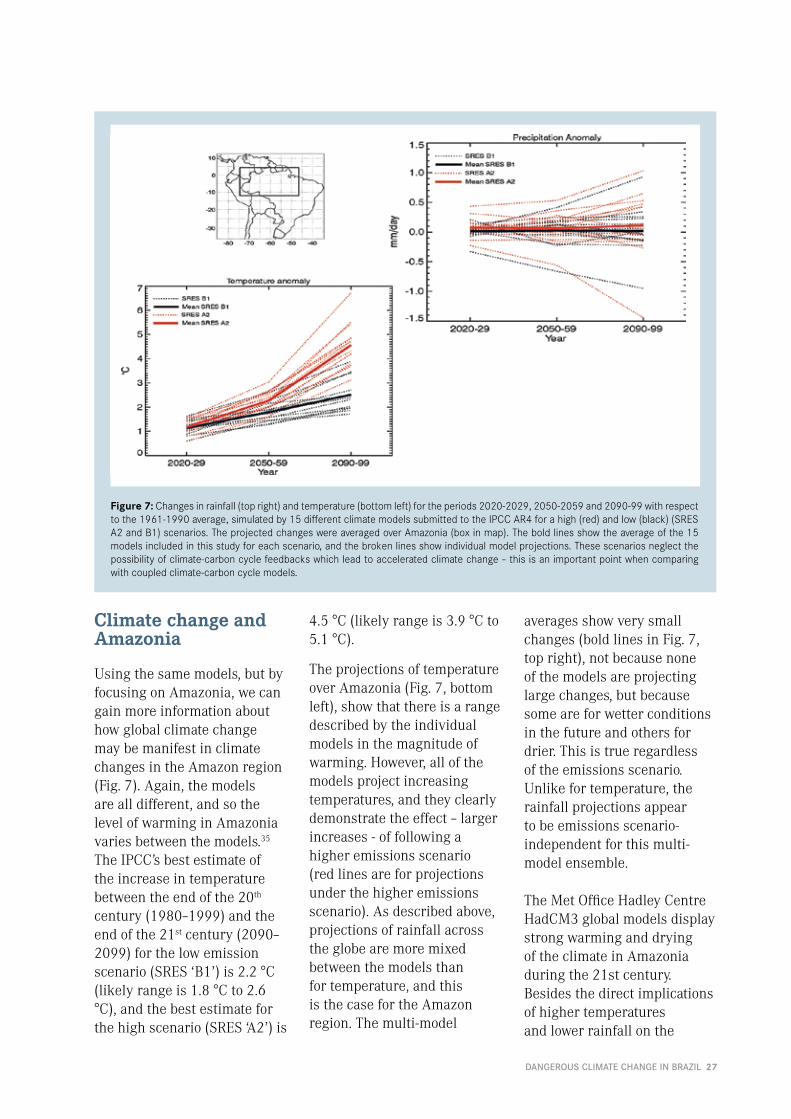
Using the same models, but by focusing on Amazonia, we can gain more information about how global climate change may be manifest in climate changes in the Amazon region (Fig. 7). Again, the models are all different, and so the level of warming in Amazonia varies between the models.35 The IPCC’s best estimate of the increase in temperature between the end of the 20th century (1980–1999) and the end of the 21st century (2090–2099) for the low emission scenario (SRES ‘B1’) is 2.2 °C (likely range is 1.8 °C to 2.6 °C), and the best estimate for the high scenario (SRES ‘A2’) is
Figure 7:Changesinrainfall(topright)andtemperature(bottomleft)fortheperiods2020-2029,2050-2059and2090-99withrespecttothe1961-1990average,simulatedby15differentclimatemodelssubmittedtotheIPCCAR4forahigh(red)andlow(black)(SRESA2andB1)scenarios.TheprojectedchangeswereaveragedoverAmazonia(boxinmap).Theboldlinesshowtheaverageofthe15modelsincludedinthisstudyforeachscenario,andthebrokenlinesshowindividualmodelprojections.Thesescenariosneglectthepossibilityofclimate-carboncyclefeedbackswhichleadtoacceleratedclimatechange–thisisanimportantpointwhencomparingwithcoupledclimate-carboncyclemodels.
4.5 °C (likely range is 3.9 °C to 5.1 °C).
The projections of temperature over Amazonia (Fig. 7, bottom left), show that there is a range described by the individual models in the magnitude of warming. However, all of the models project increasing temperatures, and they clearly demonstrate the effect – larger increases - of following a higher emissions scenario (red lines are for projections under the higher emissions scenario). As described above, projections of rainfall across the globe are more mixed between the models than for temperature, and this is the case for the Amazon region. The multi-model
averages show very small changes (bold lines in Fig. 7, top right), not because none of the models are projecting large changes, but because some are for wetter conditions in the future and others for drier. This is true regardless of the emissions scenario. Unlike for temperature, the rainfall projections appear to be emissions scenario-independent for this multi-model ensemble.
The Met Office Hadley Centre HadCM3 global models display strong warming and drying of the climate in Amazonia during the 21st century. Besides the direct implications of higher temperatures and lower rainfall on the

28 DANGEROUS CLIMATE CHANGE IN BRAZIL
Figure 8:Percentagechangeinforestcover by late 21st century comparedwith pre-industrial conditions, asmodelledusingHadleyCentrecoupledclimate-carbonmodelHadCM3LCwitha ‘businessasusual’ greenhousegasconcentration scenario. Red coloursindicate a reduction in forest cover.It demonstrates the ‘die-back’ of theforestresultingfromsimulatedwarmerand drier climate in the future. AfterCoxetal.2000
35. Coxetal.2000,200436. Bettsetal.2004,200837. Coxetal.200838. Marengoetal2010a,b
population, it is possible that there may be implications for the continued viability of the Amazon rainforest, and in turn, upon the regional and global climate.
A further version of the Hadley Centre model, called HadCM3LC, includes carbon cycle feedbacks and dynamic vegetation.35 This allows the climate to affect the forest, and any subsequent changes in the vegetation – such as release of carbon following tree death – to feed back to the global carbon budget and global and regional climate change. In this model, the projected changes in climate caused some initial forest death within the model, which then released into the atmosphere additional carbon
that had been stored by the trees and soil. Furthermore, less forest was subsequently available to take up carbon from the atmosphere. In all, this led to higher concentrations of atmospheric carbon dioxide (CO2) in the model, which further enhanced the greenhouse effect and associated changes in climate around the world. Over Brazil these in turn led to further forest death in a positive feedback loop (Fig. 8).36 The loss of forest also had effects on the local and regional climate, as described in Section 1.
It is not only how average temperatures and average rainfall may change in the future that is of interest, but
also the extreme events that have large impacts. Climate change is expected to increase the frequency and intensity of extreme rainfall events in Amazonia by the end of the 21st century,37particularly in western Amazonia38
. Using a Hadley Centre climate model projection, one study has estimated how the probability of a ‘2005-like’ year in Amazonia changes over time. It suggests that under present conditions, 2005 was an approximately 1-in-20-year event (one drought like 2005 would be expected in a 20-year period), but may become a 1-in-2-year event by 2025 and a 9-in-10-year event by 2060. In other words it may become the norm rather than extreme. If severe droughts like that of
29DANGEROUS CLIMATE CHANGE IN BRAZIL
If severe droughts like that of 2005 and 2010 become more frequent in the future, this demands adaptation measures to avoid the impacts felt that year happening more frequently with equal devastation. There is positive evidence that effective measures can be put in place by decision-makers to mitigate the effects of meteorological drought.
It should be kept in mind that these are projections only, and do not reflect a definitive outcome of climate change and impacts in Amazonia. The strong increase in tempera-ture and decrease in rainfall in the Hadley Centre HadCM3 models that could bring about die-back are not clear in other climate models; indeed, some models indicate that condi-tions are likely to get wetter
in Amazonia in the future. It should be recognized, how-ever, that the Hadley Centre models are among the best in simulating the climate of the present day and the recent past in the South America re-gion, and therefore the drying and warming of the climate that is projected for Amazonia must be regarded as plausible. But any projection of climate change is just that: a projec-tion, and must be treated with caution.
A further point to be taken into account is that the integration of vegetation models into full climate models is relatively immature and they provide a fairly crude representation of vegetation. The models that contributed to the IPCC Fourth Assessment Report did not include integrated dynamic vegetation models and only very few submitted to the next Assessment Report will incorporate this component. However, integrated carbon cycle models (that do not in-clude dynamic vegetation) are becoming standard for state-of-the-art earth system models, and some further integration of dynamic vegetation models should follow. An assessment of the behaviour of the Ama-zon rainforest and interaction with the global carbon budget and regional climate in models from other centres will be very informative.
2005 do become more frequent in the future, this demands adaptation measures to avoid the impacts felt that year happening more frequently with equal devastation. There is positive evidence that effective measures can be put in place by decision-makers, as discussed with respect to drought in Amazonia (Section 3). But in addition, cumulative impacts may build up. For example, it is possible that the process of ‘savannization’ which begins in eastern Amazonia could extend more rapidly into a drought-stricken western Amazonia.

30 DANGEROUS CLIMATE CHANGE IN BRAZIL
Photo:Stock.xchng
31DANGEROUS CLIMATE CHANGE IN BRAZIL
New science and scientific development
32 DANGEROUS CLIMATE CHANGE IN BRAZIL
How we model climate
Global climate modellingClimate models are the key tools for making projections of future climate. They represent numerically the climate system and inputs into that system from the sun and other sources. In a climate model, the world is divided into grid boxes, which extend across the surface of the planet, up through the atmosphere and down into the oceans. On this grid the model makes mathematical calculations based on well established physical laws that describe the movement of air, changes in pressure, temperature, the formation of rain. In other words: the weather and climate. In tandem with improvements in computational performance, climate models have been increasing in complexity over the years as more and more components are included, such as ocean dynamics, land surface exchanges and aerosols. Even so, it is not possible to represent all the detail that exists in the real world, and so certain processes have to be included in the model through approximations based on expert knowledge.
Many institutions around the world have developed climate models. Variations in configuration between the different models lead to differences in their simulations of climate variability and change as described in Section 4. Climate models are assessed on their ability to simulate current and past climate, with regards to average conditions and in variations in these. If a model simulates well the climate of
(R. Betts, C. Nobre, G. Kay, G. Sampaio, S. Chou)
the 20th century and up to the present day, the future climate projections may be regarded as plausible.
Regional climate modellingTo simulate the complex climate system, a climate model requires a very large amount of computer resources, which places a limit on the number of calculations that can be made and hence the size of the grid. Grid boxes within a global climate model are currently fairly coarse - to the order of 100-300 km square. Even at this resolution, they give a valuable picture of how large-scale changes may be manifest. But to see how country-level changes may occur, and how different levels of concentrations of greenhouse gases may affect any changes, there is a need for finer-scale information. One way this can be achieved is through increasing the spatial resolution of the climate model in the region of interest, such as South America, which is computationally feasible because of the limited size of the region. The finer spatial resolution allows a more realistic representation of features such as the coastline and mountains, and of smaller-scale atmospheric processes. Therefore there should be an improvement in the representation of a particular country’s climate in a regional climate model over a global model.
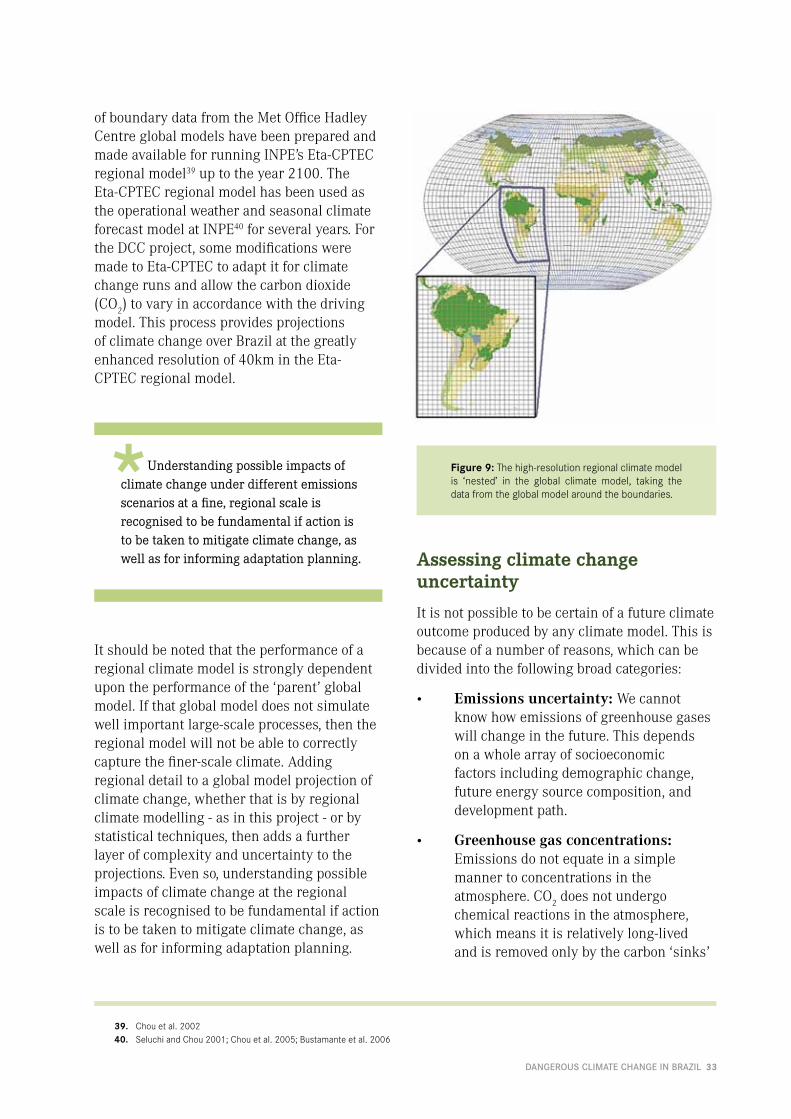
The finer-scale regional model is ‘nested’ in the global climate model (Fig. 9) and requires driving data from the GCM at the boundaries of the regional domain. Through this project, sets
33DANGEROUS CLIMATE CHANGE IN BRAZIL
39. Chouetal.200240. SeluchiandChou2001;Chouetal.2005;Bustamanteetal.2006
Understanding possible impacts of climate change under different emissions scenarios at a fine, regional scale is recognised to be fundamental if action is to be taken to mitigate climate change, as well as for informing adaptation planning.
of boundary data from the Met Office Hadley Centre global models have been prepared and made available for running INPE’s Eta-CPTEC regional model39 up to the year 2100. The Eta-CPTEC regional model has been used as the operational weather and seasonal climate forecast model at INPE40 for several years. For the DCC project, some modifications were made to Eta-CPTEC to adapt it for climate change runs and allow the carbon dioxide (CO2) to vary in accordance with the driving model. This process provides projections of climate change over Brazil at the greatly enhanced resolution of 40km in the Eta-CPTEC regional model.
It should be noted that the performance of a regional climate model is strongly dependent upon the performance of the ‘parent’ global model. If that global model does not simulate well important large-scale processes, then the regional model will not be able to correctly capture the finer-scale climate. Adding regional detail to a global model projection of climate change, whether that is by regional climate modelling - as in this project - or by statistical techniques, then adds a further layer of complexity and uncertainty to the projections. Even so, understanding possible impacts of climate change at the regional scale is recognised to be fundamental if action is to be taken to mitigate climate change, as well as for informing adaptation planning.
Figure 9:Thehigh-resolutionregionalclimatemodelis ‘nested’ in the global climate model, taking thedatafromtheglobalmodelaroundtheboundaries.
Assessing climate change uncertainty
It is not possible to be certain of a future climate outcome produced by any climate model. This is because of a number of reasons, which can be divided into the following broad categories:
• Emissionsuncertainty:We cannot know how emissions of greenhouse gases will change in the future. This depends on a whole array of socioeconomic factors including demographic change, future energy source composition, and development path.
• Greenhousegasconcentrations: Emissions do not equate in a simple manner to concentrations in the atmosphere. CO2 does not undergo chemical reactions in the atmosphere, which means it is relatively long-lived and is removed only by the carbon ‘sinks’

34 DANGEROUS CLIMATE CHANGE IN BRAZIL
– the oceans and vegetation. Therefore, projecting future concentrations of greenhouse gases depend on historical as well as future emissions, the modelling of carbon flows and sinks, and how these may change.
• Naturalvariabilityinweatherandclimate: The atmospheric system is chaotic in nature, meaning that it is sensitive to very small changes, which may not be measureable. How natural variations in climate develop within a model depend very much upon the precise conditions that initialise the climate model, which cannot be perfectly known. However, as we move further through the coming century, the precise starting point becomes unimportant with respect to the climate relative to the changes brought by increases in greenhouse gas concentration.
• Modellinguncertainty: Our knowledge and understanding of the climate system, and our ability to model it, is incomplete. Models constructed in different ways – for example in grid configuration or input parameters - produce different climate change magnitudes and patterns. Equally, making modifications to how processes are represented in a single model can produce a range of different climate futures.
These factors are termed ‘uncertainties’ by the scientific community, and are ubiquitous components of any projection of climate change. It is therefore important to assess the effects of the uncertainties listed above upon the magnitude and/or patterns of climate change. A way to do this is through designing or utilizing existing suites of model simulations – called ‘ensembles’ – through which the effects of different sources of uncertainty can be explored. In this project, the focus has been on assessing the effects on the climate over Brazil of following different emissions scenarios, and in modelling uncertainty.
‘Uncertainties’ are ubiquitous components of any projection of climate change. It is therefore important to assess the effects of uncertainties upon the magnitude and/or patterns of climate change.
The ‘Special Report Emission Scenarios-SRES’ Emission Scenarios
Of key relevance for future climate change is the quantity of greenhouse gas emissions. This will depend on the population, their lifestyle, and the way this is supported by the production of energy and the use of the land. These factors could vary in a multitude of ways; the international community is already examining how energy demand and production can be modified to cause lower emissions, but the implementation of this will depend on both the international political process and the actions of individuals. Even if no specific action is taken to reduce emissions, the future rates of emissions are uncertain since the future changes in population, technology and economic state are difficult if not impossible to forecast. Therefore, rather than make predictions of future emissions, climate science examines a range of plausible scenarios in order to explore the implications of each scenario and inform decisions on reducing emissions and/or dealing with their consequences.
The IPCC’s climate models have generally used a set of scenarios known as ‘SRES’ (Special Report on Emissions Scenarios41). These scenarios were grounded in plausible storylines of the human socio-economic future, with differences in economy, technology, and population but no explicit inclusion of emissions reductions policies. These scenarios extend out to 2100 and vary widely in their projected
41. Naki enovi etal.2000
35DANGEROUS CLIMATE CHANGE IN BRAZIL
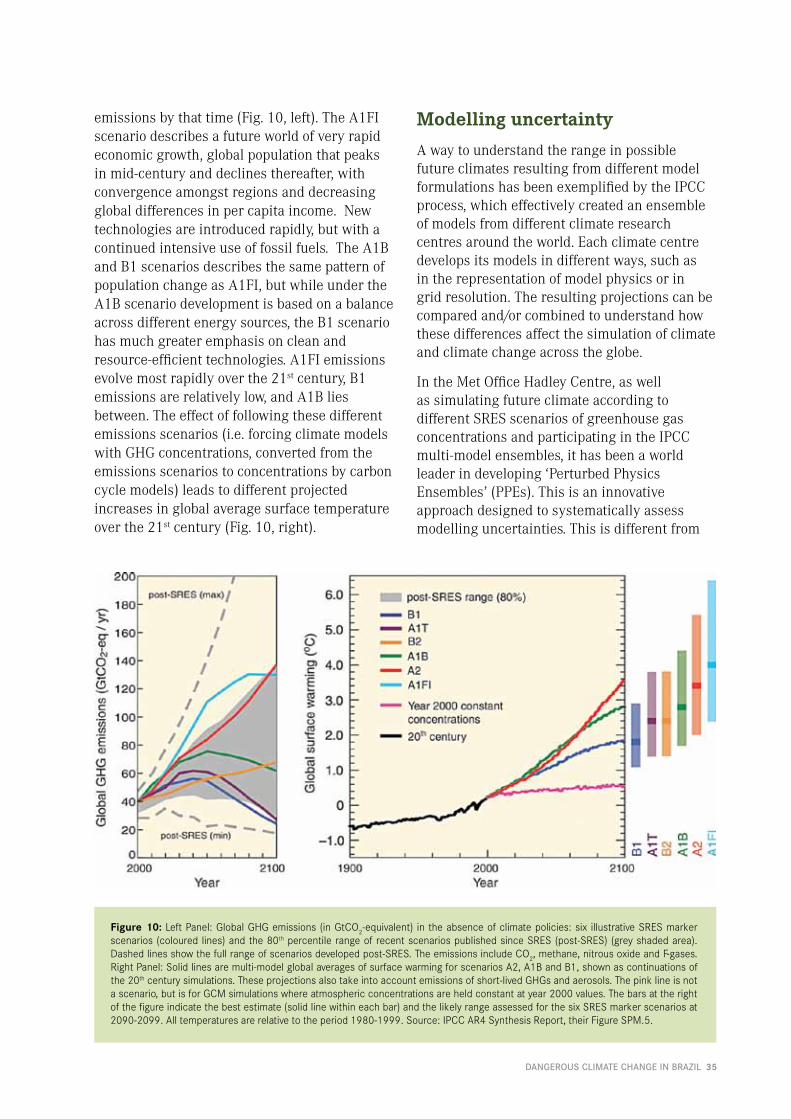
emissions by that time (Fig. 10, left). The A1FI scenario describes a future world of very rapid economic growth, global population that peaks in mid-century and declines thereafter, with convergence amongst regions and decreasing global differences in per capita income. New technologies are introduced rapidly, but with a continued intensive use of fossil fuels. The A1B and B1 scenarios describes the same pattern of population change as A1FI, but while under the A1B scenario development is based on a balance across different energy sources, the B1 scenario has much greater emphasis on clean and resource-efficient technologies. A1FI emissions evolve most rapidly over the 21st century, B1 emissions are relatively low, and A1B lies between. The effect of following these different emissions scenarios (i.e. forcing climate models with GHG concentrations, converted from the emissions scenarios to concentrations by carbon cycle models) leads to different projected increases in global average surface temperature over the 21st century (Fig. 10, right).
Figure 10:LeftPanel:GlobalGHGemissions (inGtCO2-equivalent) in theabsenceofclimatepolicies:six illustrativeSRESmarkerscenarios (coloured lines)andthe80thpercentile rangeof recentscenariospublishedsinceSRES(post-SRES) (greyshadedarea).Dashedlinesshowthefullrangeofscenariosdevelopedpost-SRES.TheemissionsincludeCO2,methane,nitrousoxideandF-gases.RightPanel:Solidlinesaremulti-modelglobalaveragesofsurfacewarmingforscenariosA2,A1BandB1,shownascontinuationsofthe20thcenturysimulations.Theseprojectionsalsotakeintoaccountemissionsofshort-livedGHGsandaerosols.Thepinklineisnotascenario,butisforGCMsimulationswhereatmosphericconcentrationsareheldconstantatyear2000values.Thebarsattherightofthefigureindicatethebestestimate(solidlinewithineachbar)andthelikelyrangeassessedforthesixSRESmarkerscenariosat2090-2099.Alltemperaturesarerelativetotheperiod1980-1999.Source:IPCCAR4SynthesisReport,theirFigureSPM.5.
Modelling uncertainty
A way to understand the range in possible future climates resulting from different model formulations has been exemplified by the IPCC process, which effectively created an ensemble of models from different climate research centres around the world. Each climate centre develops its models in different ways, such as in the representation of model physics or in grid resolution. The resulting projections can be compared and/or combined to understand how these differences affect the simulation of climate and climate change across the globe.
In the Met Office Hadley Centre, as well as simulating future climate according to different SRES scenarios of greenhouse gas concentrations and participating in the IPCC multi-model ensembles, it has been a world leader in developing ‘Perturbed Physics Ensembles’ (PPEs). This is an innovative approach designed to systematically assess modelling uncertainties. This is different from

36 DANGEROUS CLIMATE CHANGE IN BRAZIL
the IPCC process, which can be regarded as a more opportunistic way to explore uncertainty. Each PPE is composed of variants of a single global model. As stated previously, not all processes can be simulated in detail within a climate model, but their overall effects have to be approximated. A process (e.g. rate of ice fall through a cloud) is represented by a parameter which is defined by experts as a particular value, but in reality could lie within a range of plausible values. In a PPE, which is a particularly computationally-intense experimental design, the values of key parameters are adjusted within their plausible ranges, giving different parameter combinations. The effect of running the model with these different combinations results in variations in the projections of climate change. The model variants that are more sensitive to increasing greenhouse gas concentrations simulate larger increases in global temperature than the lower-sensitivity variants. This means that for a single SRES scenario of greenhouse gas concentrations, there is a range in level of global warming (Fig. 11).
Figure 11: Global average temperature increase (in °C, relative to a 1961-90 baseline) under three emissions scenarios: B1(left),A1B(centre)andA1FI(right).Thehistoricalportionofthesimulationsisidentical inallthreecases:emissionsscenariosareappliedfromthebeginningofthe21stcentury.Theindividuallinesindicatemodelsrunwithdifferentparametercombinations.Thereare17variantsof thesameclimatemodel (HadCM3),andeachof thesewas rununder the threeemissionsscenarios.Somevariantsdisplayhighersensitivity(i.e.greaterwarminggiventhesamegreenhousegasforcing)thanothers,producingthisspreadinwarming.Underhigherconcentrationscenarios,globalaveragetemperaturechangesaregreaterthanunderthelowerconcentrationscenarios.
Each Met Office PPE comprises the standard HadCM3 climate model together with 16 variants of this, providing 17-member ensembles. Three ensembles were produced, run according to a low (SRES B1), a medium (SRES A1B) and a high (SRES A1FI) greenhouse gas concentration scenario. Through this experiment design, uncertainty in both emissions trajectory and in model parameter settings can be explored.
The recognition and inclusion of uncertainties in projections of climate change does not negate their utility. On the contrary, they provide very valuable information if they are communicated effectively to users. Decision-makers routinely have to work with information that is uncertain or incomplete. For informed decisions to be made, it is therefore important that the sources of uncertainty are better understood. In addition, support should be supplied in assessing effects of these uncertainties, generating bounds upon the range of possible climate futures in order to express climate risk. Not only does including uncertainty represent more fairly the current state of knowledge about the future climate, but it provides the basis for making mitigation decisions as well as a framework for adaptation planning.

37DANGEROUS CLIMATE CHANGE IN BRAZIL
Assessing uncertainty in regional model projectionsAn Eta-CPTEC regional model simulation, driven by the Hadley Centre global model HadCM3, provides a plausible projection of climate change in the region at a spatial resolution that has the potential to be valuable for impacts assessments. The next stage is to consider the effects of known uncertainties on the climate change projections for Brazil.
One way to qualitatively assess the effects of uncertainties on the projections is to run ensembles of regional climate models. However, there are strong constraints on doing this associated with computational expense. In addition, because the regional model requires driving data from global models around the boundaries, it is reliant upon appropriate data at the correct temporal resolution being available.
Through the DCC project, a subset of four global models was selected from the Hadley Centre global model HadCM3 A1B PPE to drive the Eta-CPTEC regional model. These were selected during a visit by an INPE scientist to the Hadley Centre. First of all, they were selected from the A1B scenario only because driving data from the other scenarios were not available. Given that only one emissions scenario was available, it was important to choose models that spanned the range of uncertainty within that ensemble (Fig. 8), while still simulating reasonably well the present-day climate of Brazil. To this end, high-, medium-, and low-sensitivity models were chosen, along with the standard ‘unperturbed’ model.
Including uncertainty represents more fairly the current state of knowledge about the future climate, and also it provides the basis for making mitigation decisions as well as a framework for adaptation planning.
Pattern Scaling: Assessing implications of uncertainty in emissions and climate sensitivity
Alongside having a small ensemble of Eta-CPTEC regional model projections run according to the SRES A1B emissions scenario, this project sought to develop a way to place bounds upon the regional model projections that encompassed the full range of uncertainty in the global model PPEs. To do this, an efficient approach was adopted and developed in the uncertainty assessment of the regional projections of change. Termed ‘pattern scaling’, it is premised on the assumption that a regional pattern of change in some climate variable of interest – such as temperature or rainfall - is related to global average temperature change.42 Thus, if we change the level of global average warming, we can scale the regional response accordingly. It should be kept in mind that as a statistical technique, pattern scaling has shortcomings. One of these is that it may not reflect the range in regional response, and another is that it may not capture large nonlinearities or threshold behaviour in the earth system that might occur under global warming, such as large-scale land surface-atmosphere feedbacks. However, the use of pattern scaling techniques is growing, their applications are being defined and refined, and they are set to be used heavily in the next report of the IPCC (Fifth Assessment Report) to interpolate between global model simulations.
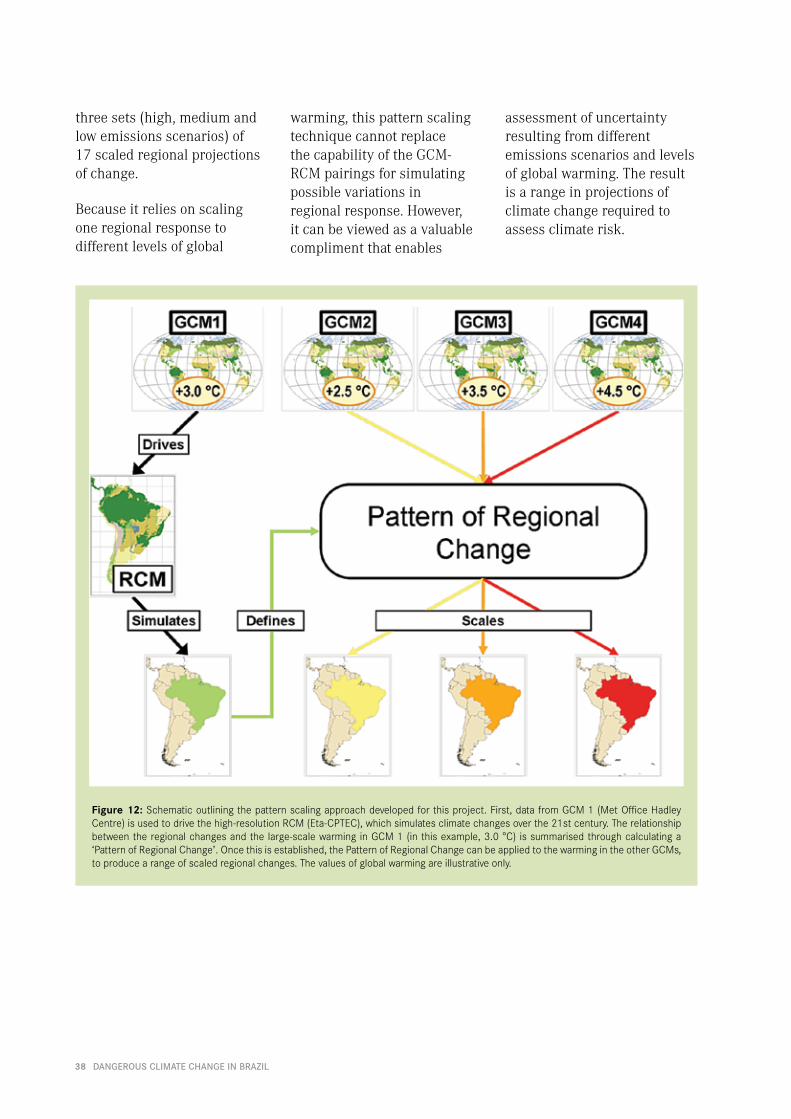
Available to this project was a range of global temperature changes from the three Met Office global model PPEs, which span uncertainty in emissions scenarios and in model parameter settings (Fig. 12). One of these global models (forced with the A1B greenhouse gas concentration scenario) was used to drive the regional model, and using the global temperature change in that model along with the regional changes simulated by Eta-CPTEC, a pattern of change that connects the two was derived. Next, that pattern was scaled to the global warming in the other models. This process, summarised in Figure 10, provides
42. HuntingfordandCox2000;Mitchell2003; Harrisetal.2006;Giorgi2008
38 DANGEROUS CLIMATE CHANGE IN BRAZIL
three sets (high, medium and low emissions scenarios) of 17 scaled regional projections of change.
Because it relies on scaling one regional response to different levels of global
Figure 12: Schematicoutliningthepatternscalingapproachdevelopedforthisproject.First,datafromGCM1(MetOfficeHadleyCentre)isusedtodrivethehigh-resolutionRCM(Eta-CPTEC),whichsimulatesclimatechangesoverthe21stcentury.Therelationshipbetweentheregionalchangesandthe large-scalewarming inGCM1(inthisexample,3.0°C) issummarisedthroughcalculatinga‘PatternofRegionalChange’.Oncethisisestablished,thePatternofRegionalChangecanbeappliedtothewarmingintheotherGCMs,toproducearangeof scaledregionalchanges.Thevaluesofglobalwarmingareillustrativeonly.
warming, this pattern scaling technique cannot replace the capability of the GCM-RCM pairings for simulating possible variations in regional response. However, it can be viewed as a valuable compliment that enables
assessment of uncertainty resulting from different emissions scenarios and levels of global warming. The result is a range in projections of climate change required to assess climate risk.
39DANGEROUS CLIMATE CHANGE IN BRAZIL
Future climate and assessment of climate change uncertainty in Amazonia
(J. Marengo, S. Chou, G. Kay, L. Betts, L. Alves)
Projections of climate change in Amazonia
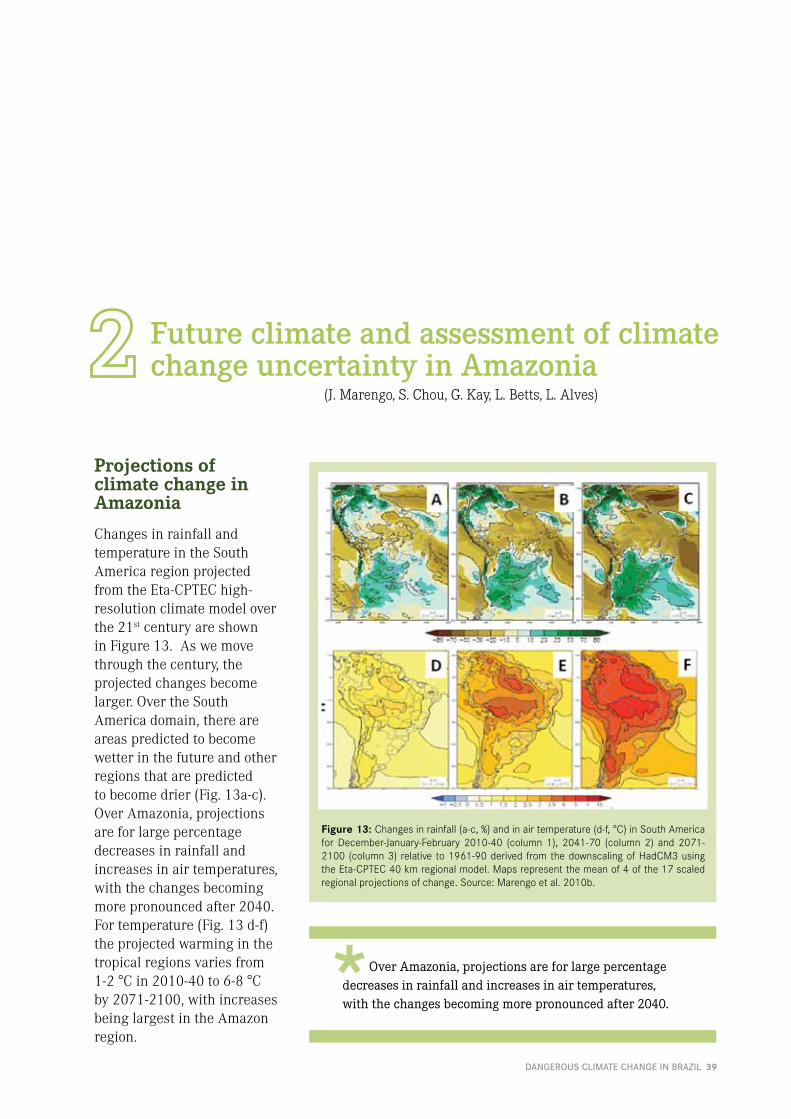
Changes in rainfall and temperature in the South America region projected from the Eta-CPTEC high-resolution climate model over the 21st century are shown in Figure 13. As we move through the century, the projected changes become larger. Over the South America domain, there are areas predicted to become wetter in the future and other regions that are predicted to become drier (Fig. 13a-c). Over Amazonia, projections are for large percentage decreases in rainfall and increases in air temperatures, with the changes becoming more pronounced after 2040. For temperature (Fig. 13 d-f) the projected warming in the tropical regions varies from 1-2 °C in 2010-40 to 6-8 °C by 2071-2100, with increases being largest in the Amazon region.
Figure 13: Changesinrainfall(a-c,%)andinairtemperature(d-f,°C)inSouthAmericafor December-January-February 2010-40 (column 1), 2041-70 (column 2) and 2071-2100 (column3) relative to1961-90derived fromthedownscalingofHadCM3usingtheEta-CPTEC40kmregionalmodel.Mapsrepresentthemeanof4ofthe17scaledregionalprojectionsofchange.Source:Marengoetal.2010b.
Over Amazonia, projections are for large percentage decreases in rainfall and increases in air temperatures, with the changes becoming more pronounced after 2040.

40 DANGEROUS CLIMATE CHANGE IN BRAZIL
Assessment of climate change uncertainty
The pattern scaling approach to assessing uncertainty described in Section 5 is applied here to Eta-CPTEC projections of climate change averaged over the Brazilian Amazon hydrological basin (Fig. 14).
Figure 14: The Brazilian Amazon river basin, over whichthe uncertainty analysis of climate change projections wasconducted.
The analysis yields four sets of 17 projections over the 21st century for the Brazilian Amazon basin. The diagram below (Fig. 15) shows chang-es in annual average, maximum and minimum temperatures relative to the average conditions simulated over the years 1961-90.
The examples presented here are changes in the annual average temperature, and increases are simulated in all cases for every season of the year. Maximum daytime temperatures are shown to increase more than minimum night time temperatures. Larger rises in temperature can be expected under the higher emissions scenarios than the lower. There is a certain degree of overlap between the projection ‘plumes’ (Fig. 15), meaning that the higher-sensitivity models of a lower emissions scenario give similar changes as the lower-sensitivity models of a higher emissions scenario. However, increasing the greenhouse gas concentrations should be regarded as effecting a shift in the whole set of projections.
Figure 15: Projected change in a) annual average tem-perature (°C), b) average daily maximum temperature andc)averagedailyminimumtemperature in theAmazonriverbasinoverthe21stcenturyexpressedrelativetothe1961-90baseline.Theblueplumeshowstherangegivenby the17modelsofthelow(B1)emissionsscenarioensemble,theorangeplumeshowsthemedium(A1B)emissionsscenarioandtheredplumeshowsthehigh(A1FI)emissionsscenario.The bars at the side represent the range in uncertainty ofprojections at the end of the 21st century, with the darkerhorizontallineindicatingtheensembleaveragevalue.
a)
b)
c)

41DANGEROUS CLIMATE CHANGE IN BRAZIL
Table 1: Lowerandupper limitsofrangeinprojectedincreasesinannual average temperature (°C) in Amazonia by the 2090s withrespecttothe1961-90baselineundereachemissionsscenario,asdisplayedinFig.15(a).
SCENARIO MINIMUM WARMING MAXIMUM WARMING
B1 2.3 4.8
A1B 3.6 7.0
A1Fl 4.9 8.9
Taking the example of increases in annual average temperature in the Amazon basin, the uncertainty in projected changes from model physics and emissions scenario together gives a range in possible increases by the end of the century of just over 2 °C above the baseline at the low end and 9 °C at the upper end (Table 1). Increases in temperature can begin to impact upon human activities and wellbeing at different thresholds, such as in health, infrastructure and electricity demand.
The analysis here gives a range in possible warming in Amazonia of just over 2 °C above the baseline by the end of the century at the low end and 9 °C at the upper end. Increases in temperature can begin to impact upon human activities and wellbeing at different thresholds, such as in health, infrastructure and electricity demand.
In addition to changes in temperature, information about possible future changes in rainfall with its implications for water resources is critically important in climate change management decisions. The direct output from this particular model (Fig. 13) indicates substantial percentage decreases in summer (December-February) rainfall by the end of the 21st century. However, decreases in rainfall are projected throughout the year, not just in summer. It is always important to put the results in the context of other model projections, it should be noted that the HadCM3 driving model simulates strong drying over Amazonia over the 21st century, while other GCMs do not. As Figure 7 demonstrates, the uncertainty in rainfall
projections for Amazonia is large, ranging from large increases in rainfall, to large decreases. HadCM3 lies on the extreme drying end of the multi-model group of projections.
Table 2: Table 2. Lower and upper limits of range in projectedpercentage changes in annual average rainfall in Amazonia by the2090swithrespecttothe1961-90baselineundereachemissionsscenario.
SCENARIO MINIMUM % RAINFALL CHANGE
MAXIMUM % RAINFALL CHANGE
B1 -11.4 -22.2
A1B -17.0 -31.8
A1Fl -22.5 -40.6
In the Amazon, decreases in annual rainfall lie between approximately 10% and 20% by the last decade of the century under the low emissions scenario. With A1FI scenario greenhouse gas concentrations, these numbers rise to between around 20% and 40% decreases in rainfall (Table 2). Figure 16 shows rainfall changes in Amazonia by the 2090s in a high sensitivity model (top) and a low sensitivity model (bottom) from the three ensembles (high, medium and low emissions scenarios) of scaled projections. These are displayed alongside the projection of global warming from the global model ensemble, and the corresponding scaled increase in temperature across Brazil. The notion described above of a shift in the ensemble of projections under a different emissions scenario is evident, with high-sensitivity models projecting larger changes within each emissions scenario than low-sensitivity models. Together, the figures demonstrate full range in the uncertainty explored in this work: from the ‘best case scenario’ (B1 scenario, low sensitivity model) to the ‘worst case scenario’ (A1FI scenario, high sensitivity model).
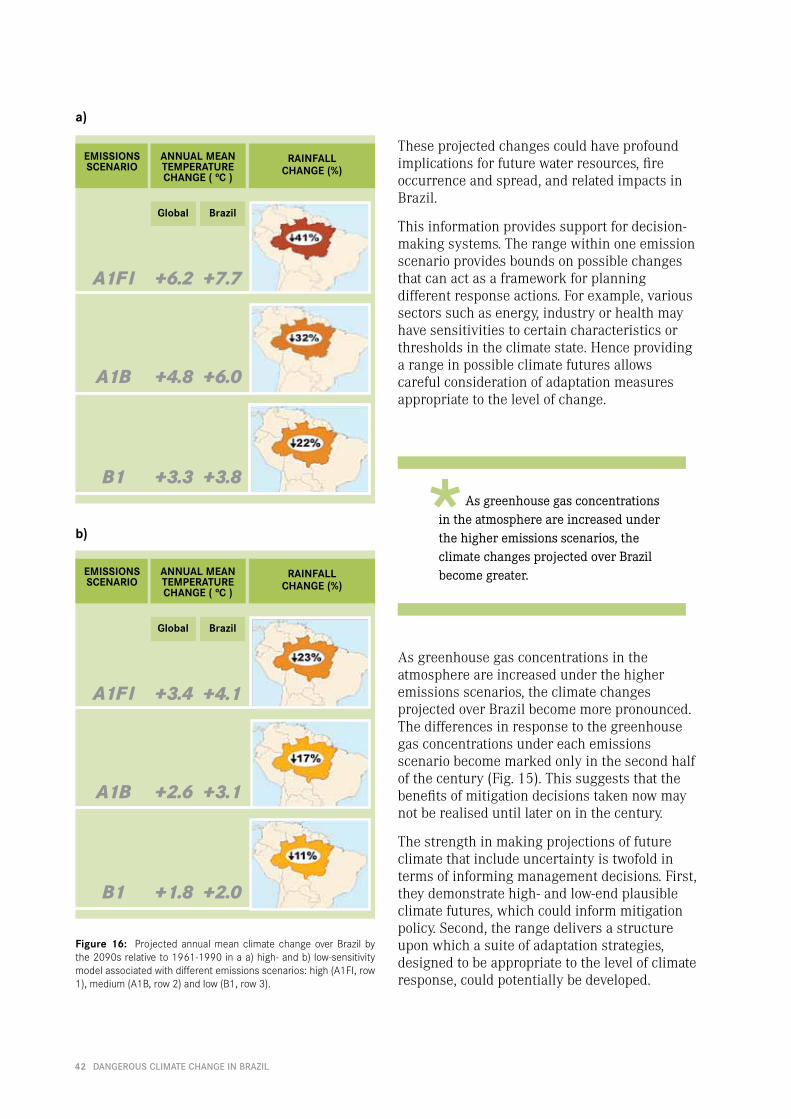
42 DANGEROUS CLIMATE CHANGE IN BRAZIL
a)
Figure 16: ProjectedannualmeanclimatechangeoverBrazil bythe2090srelativeto1961-1990inaa)high-andb)low-sensitivitymodelassociatedwithdifferentemissionsscenarios:high(A1FI,row1),medium(A1B,row2)andlow(B1,row3).
b)
These projected changes could have profound implications for future water resources, fire occurrence and spread, and related impacts in Brazil.
This information provides support for decision-making systems. The range within one emission scenario provides bounds on possible changes that can act as a framework for planning different response actions. For example, various sectors such as energy, industry or health may have sensitivities to certain characteristics or thresholds in the climate state. Hence providing a range in possible climate futures allows careful consideration of adaptation measures appropriate to the level of change.
As greenhouse gas concentrations in the atmosphere are increased under the higher emissions scenarios, the climate changes projected over Brazil become more pronounced. The differences in response to the greenhouse gas concentrations under each emissions scenario become marked only in the second half of the century (Fig. 15). This suggests that the benefits of mitigation decisions taken now may not be realised until later on in the century.
The strength in making projections of future climate that include uncertainty is twofold in terms of informing management decisions. First, they demonstrate high- and low-end plausible climate futures, which could inform mitigation policy. Second, the range delivers a structure upon which a suite of adaptation strategies, designed to be appropriate to the level of climate response, could potentially be developed.
As greenhouse gas concentrations in the atmosphere are increased under the higher emissions scenarios, the climate changes projected over Brazil become greater.
RAINFALL CHANGE (%)
ANNUAL MEAN TEMPERATURE CHANGE ( ºC )
Global Brazil
+7.7
EMISSIONSSCENARIO
+6.2A1Fl
+6.0+4.8A1B
+3.8+3.3B1
RAINFALL CHANGE (%)
ANNUAL MEAN TEMPERATURE CHANGE ( ºC )
Global Brazil
+4.1
EMISSIONSSCENARIO
+3.4A1Fl
+3.1+2.6A1B
+2.0+1.8B1

43DANGEROUS CLIMATE CHANGE IN BRAZIL
Deforestation, land use change and climate
Climate change, Amazon die-back and impacts
As the results of the DCC project described above show, climate change has the potential to have severe consequences for the Amazon forest and the populations – both local and remote – that it supports. Previous work has suggested that under climate change, the forest could die back and be replaced with a different vegetation type. These experiments have been done in different ways. As described in Section 4, integrating a dynamic vegetation model into the climate model is emerging science, and as more of the new generation of models include this component, further progress can be made in understanding climate change-vegetation dynamics. Other studies have used climate change projections as inputs in stand-alone vegetation models,
(C. Nobre, G. Sampaio, G. Kay, R. Betts)
The results of the DCC project show that climate change has the potential to have severe consequences for the Amazon forest and the populations – both local and remote – that it supports.
Figure 17 shows the results from one such study,43 which used the INPE-CPTEC Potential Vegetation Model (CPTEC-PVM) driven with climate projections from three different climate models (to sample uncertainty in the model projections; refer to Section 5: Assessing climate change uncertainty) from a high (SRES A2) emissions scenario. It compares the 43. Salazar2009
distribution of vegetation types simulated under today’s climate with that of the end of the century (2070-2099). All of these models show that under the new climate state, tropical forest (green colour, Fig. 17) is lost in Amazonia and replaced by savanna (pink colour), with changes in some models more extensive than in others. The changes in these models can be explained by the effects of increases in CO2 concentration and temperature, and reductions in rainfall such that the dry season becomes longer. Under these conditions, the tropical forest becomes less viable and is replaced in the model by savanna-type vegetation. However, this vegetation model does not include the fertilizing effect of CO2.
to determine what sort of vegetation we should expect – the ‘potential vegetation’ – under a new future climate.

44 DANGEROUS CLIMATE CHANGE IN BRAZIL
Figure 17: Projected distribution of biomes in South America for 2070-2099 from output from three climate models: ETA CCS,RegCM3andHadRM3PmodelsrunundertheA2emissionscenario.Thetopleftplotrepresentsthecurrentpotentialbiomes(biomesinequilibriumwithobservedclimate).Source:Salazar,2009.
The interactions between forest, climate and CO2 are complex. Indications are that over recent decades, the forest has been gaining biomass, possibly because of fertilization of the vegetation under higher atmospheric concentrations of CO2.
44 Further research, updating the experiments described above using a new version of the vegetation model (CPTEC-PV2) driven by a range of GCMs, indicates that the effects of CO2 fertilization may be large.45 The new study shows that when CO2 fertilization is included along with changes in climate, the resultant simulated biome distributions are not considerably different from the present day. However,
where dry season length is simulated to exceed four months, as is the case for the HadCM3 driving model, the Amazon rainforest is largely replaced by drier biomes such as savanna or shrubland irrespective of the fertilizing effect of CO2. The Hadley Centre model that projected the Amazon die-back, HadCM3LC, which has an integrated dynamic vegetation model, shows that the forest is likely to continue to gain biomass into the future for a time as CO2 concentrations continue to increase. However, the projections in this particular model indicate that the climate changes caused by the greenhouse gas emissions then start to override this
fertilization effect, and tree mortality commences (Fig. 8).
44. Phillipsetal.200845. Lapolaetal.2009
An Amazon Forest degraded or diminished through climate change is likely to have serious consequences for the inhabitants of the region and beyond – through loss of biodiversity, regulation of rainfall, influence over the global carbon budget, and all of the ecosystem services that the forest provides.

45DANGEROUS CLIMATE CHANGE IN BRAZIL
An Amazon Forest degraded or diminished through climate change is likely to have serious consequences for the inhabitants of the region and beyond – through loss of biodiversity, regulation of rainfall, influence over the global carbon budget, and all of the ecosystem services that the forest provides (Section 1). It should always be remembered, however, that these climate and vegetation models are subject to large uncertainties, and while the Met Office Hadley Centre HadCM3 models tend towards strong warming and drying over Amazonia, other models do not.
Climate change may have serious – though uncertain - detrimental effects to the Amazon forest in the long term, but direct deforestation poses an immediate threat.
Climate change may have serious – though uncertain - detrimental effects to the Amazon forest in the long term, but direct deforestation poses an immediate threat.
Deforestation in the Amazon
A reduction in deforestation would see immediate benefits in mitigation of global greenhouse gas emissions. In addition, similar effects on the regional climate that are possible under die-back scenarios may apply for direct deforestation. As well as the influence over the regional water cycle, the removal of large areas of forest would change the surface energy exchanges, such that changes in surface temperature would also occur. Both observations and modelling studies indicate that large-scale deforestation could cause a warmer and somewhat drier regional climate. Model results46 suggest that when more than 40% of the original extent of the Amazon forest is lost, rainfall decreases significantly across eastern Amazonia (Fig.
18). Complete deforestation could cause eastern Amazonia to warm by more than 4 °C, and rainfall from July to November could decrease by up to 40%.
Crucially, these changes would be in addition to any change resulting from global warming. It has been suggested that 40% deforestation (Fig. 18) may be a ‘tipping point’ beyond which forest loss causes climate impacts which in turn lead to further forest loss.47 Global warming of 3 °C to 4 °C may also lead to a similar tipping point.48 Although the existence of these tipping points still requires clarification, interactions between climate change and deforestation may make them more likely.
Photo:Stock.xchng
46. Sampaioetal.2007;Sampaio200847. Sampaioetal.200748. NobreandBorma2009

46 DANGEROUS CLIMATE CHANGE IN BRAZIL
Figure 18: SimulatedimpactsofdeforestationonrainfallinAmazonia.ThecurvesshowthefractionofrainfallineasternAmazoniafordifferentlevelsofdeforestationacross the whole of Amazonia, compared to the original forest extent, for eachseason.Inthemodel,deforestedlandwasconvertedtosoybeanplantations.Source:Sampaioetal.2007.
40% deforestation may be a ‘tipping point’ beyond which forest loss causes climate impacts which in turn lead to further forest loss. Global warming of 3 °C to 4 °C may also lead to a similar tipping point.
Through the DCC project, a vegetation model has been integrated into a regional climate model for the first time. This was based on the global model that gave the Amazon forest die-back result (Section 4), and includes a new land-surface model and dynamic vegetation. That is, instead of having one land type assigned to each grid box, there can be up to nine, comprising five vegetation and four non-vegetation classes. Each of these has its own properties and fluxes between the land surface, the subsurface and the atmosphere. With this arrangement, vegetation no longer has to remain fixed
as the vegetation types can compete and change from one to another as the climatic conditions change, making one type more or less viable.
This makes it possible to assess potential effects of fine-scale climate change on vegetation, which can then go on to feed back upon and modify the regional climate. Furthermore, it allows realistic deforestation scenarios,49 supplied through the DCC project, to be imposed on the model, and the effects of deforestation on the regional climate and remaining vegetation to be investigated.
Loss of the Amazon either in the short term through direct deforestation or in the long term through climate change could have widespread impacts, some of which have the potential to exacerbate the changes in climate or in forest cover in a positive feedback loop (Fig. 19). Furthermore, these two drivers of change in forest cover are unlikely to act independently of one another.
49. Soares-Filhoetal.200650. Hirotaetal.2010
Deforestation and climate synergies
An additional environmental driver of change in Amazonia associated with deforestation would be an increase in vulnerability of a broken forest to ‘edge effects’ such as strong winds, and especially forest fires. In this project, there has been no explicit modelling of effects of direct deforestation combined with climate change. However, it can be conjectured that climate changes acting on a region already fragmented by deforestation could have larger effects than on continuous forest. Forest fragmentation opens up the forest to points of ignition, which are in the main supplied by human action: deliberate or otherwise. Of course, natural fires do occur, and have been shown to influence the forest-savanna transition. A simplified climate-vegetation-natural fire model50 estimated that under current climate conditions, the tropical forest would penetrate 200 km into the savanna in the absence of lightning-triggered fires.
Climate changes acting on a region already fragmented by deforestation could have larger effects than on continuous forest. A broken forest would be more vulnerable to forest fires, and human activity is likely to supply the ignition. A changing climate may lead to heightened fire risk, allowing fires to catch and spread more readily.
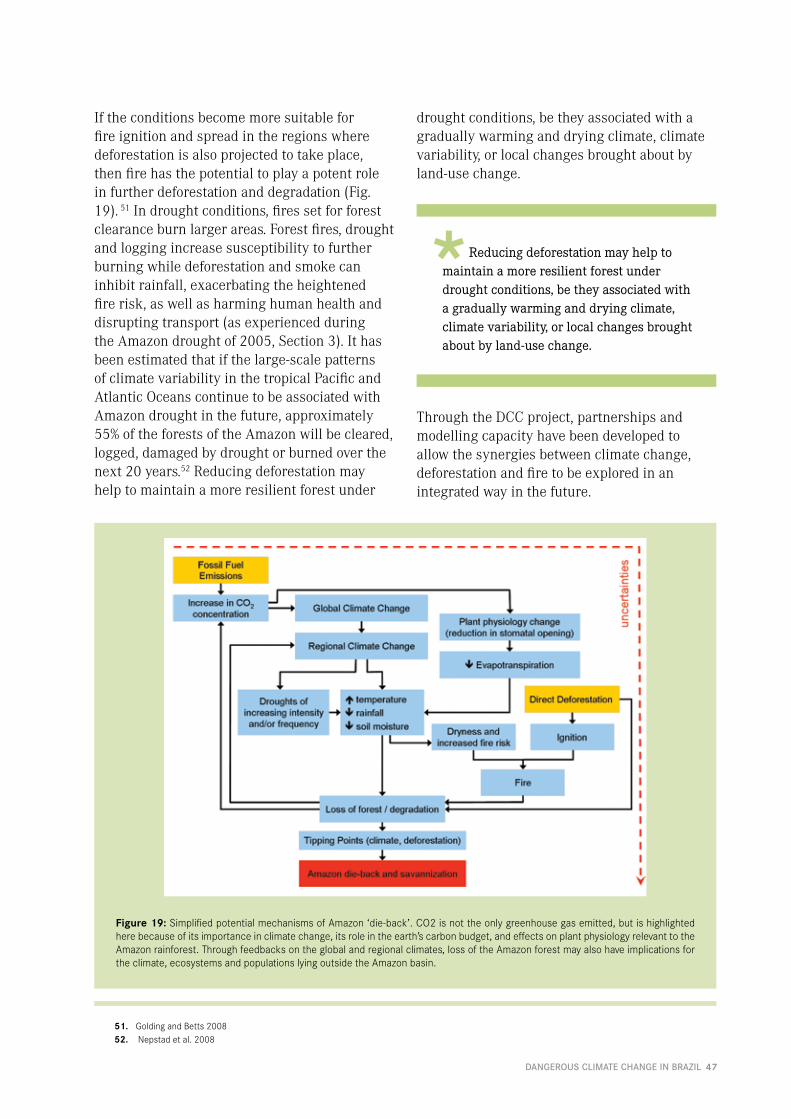
47DANGEROUS CLIMATE CHANGE IN BRAZIL
If the conditions become more suitable for fire ignition and spread in the regions where deforestation is also projected to take place, then fire has the potential to play a potent role in further deforestation and degradation (Fig. 19). 51 In drought conditions, fires set for forest clearance burn larger areas. Forest fires, drought and logging increase susceptibility to further burning while deforestation and smoke can inhibit rainfall, exacerbating the heightened fire risk, as well as harming human health and disrupting transport (as experienced during the Amazon drought of 2005, Section 3). It has been estimated that if the large-scale patterns of climate variability in the tropical Pacific and Atlantic Oceans continue to be associated with Amazon drought in the future, approximately 55% of the forests of the Amazon will be cleared, logged, damaged by drought or burned over the next 20 years.52 Reducing deforestation may help to maintain a more resilient forest under
51. GoldingandBetts200852. Nepstadetal.2008
Reducing deforestation may help to maintain a more resilient forest under drought conditions, be they associated with a gradually warming and drying climate, climate variability, or local changes brought about by land-use change.
Through the DCC project, partnerships and modelling capacity have been developed to allow the synergies between climate change, deforestation and fire to be explored in an integrated way in the future.
Figure 19:SimplifiedpotentialmechanismsofAmazon‘die-back’.CO2isnottheonlygreenhousegasemitted,butishighlightedherebecauseofitsimportanceinclimatechange,itsroleintheearth’scarbonbudget,andeffectsonplantphysiologyrelevanttotheAmazonrainforest.Throughfeedbacksontheglobalandregionalclimates,lossoftheAmazonforestmayalsohaveimplicationsfortheclimate,ecosystemsandpopulationslyingoutsidetheAmazonbasin.
drought conditions, be they associated with a gradually warming and drying climate, climate variability, or local changes brought about by land-use change.

48 DANGEROUS CLIMATE CHANGE IN BRAZIL
The Amazon forest plays a significant role in regulating the local, regional and even the global climate system. It provides a host of ecosystem services that underpin human activities and well-being in regions both local and remote. Therefore, any changes within the basin – be they climate changes, land use changes, or a combination of the two – are likely to have far-reaching consequences for the operation of natural systems and the people they support. Understanding how the Amazon functions as an integrated part of the Earth system and the risks of how that may change in the future is a prerequisite to producing optimal development strategies.
This DCC project has allowed high-resolution projections of climate change to be made over the Brazil region along with an assessment of uncertainty in these simulations. The projections are for large increases in temperature and decreases in rainfall during this century. Other studies have shown that in addition to these changes, the risk of extreme events such as the drought of 2005 would become more frequent in the future. As well as these changes that would directly affect human systems that are vulnerable to climate, there could be impacts on the continued viability of the Amazon forest. In turn, loss of forest through a changing climate is likely to affect the regional climate through the forest’s role in the recycling of rainfall within the basin and beyond. Economically important regions of agribusiness, hydropower and industry of Brazil and other South American countries lie to the south of the Amazon, and are estimated to generate some US$1.5 trillion, or 70% of the combined GDP these countries. The extent to which moisture transported from the Amazon contributes to the economic well-being of the South American continent is as yet unquantified.
Summary and conclusions(J. Marengo, C. Nobre, R. Betts, G. Kay)
Until the Amazon forest ecosystem services are integrated into policy and financial frameworks, the forest will be regarded as worth more dead than standing.
It is clearly acknowledged that there are large uncertainties in the strong tendency displayed by the Met Office HadCM3 models towards drier future conditions, any ‘die-back’ of the forest, and the timing of such changes. However we know that deforestation presents a more immediate threat to the Amazon. Studies of the hydrological cycle in the Amazon suggest that it recycles as much as 50% of its rainfall, and that if as little as 30% of the Amazon is cleared, it will be unable to generate enough rainfall to sustain itself, leading to a positive feedback loop of more forest loss and less rainfall. Rainfall in other words is essential for sustaining the Amazonian ecosystems and all the ecosystem services they generate, and the value of the Amazon as a water-regulating eco-utility becomes indistinguishable from the value of all ecosystem services provided by the Amazon. As deforestation approaches this critical threshold, the marginal value of the forest ecosystem can be expected to rise rapidly, approaching the infinite if we believe that the loss of the Amazon ecosystem is unacceptable. Compounding the uncertainty of how much forest loss the climate system can tolerate before it can no longer generate adequate rainfall to sustain itself, climate change is likely to have substantial impacts on such thresholds.
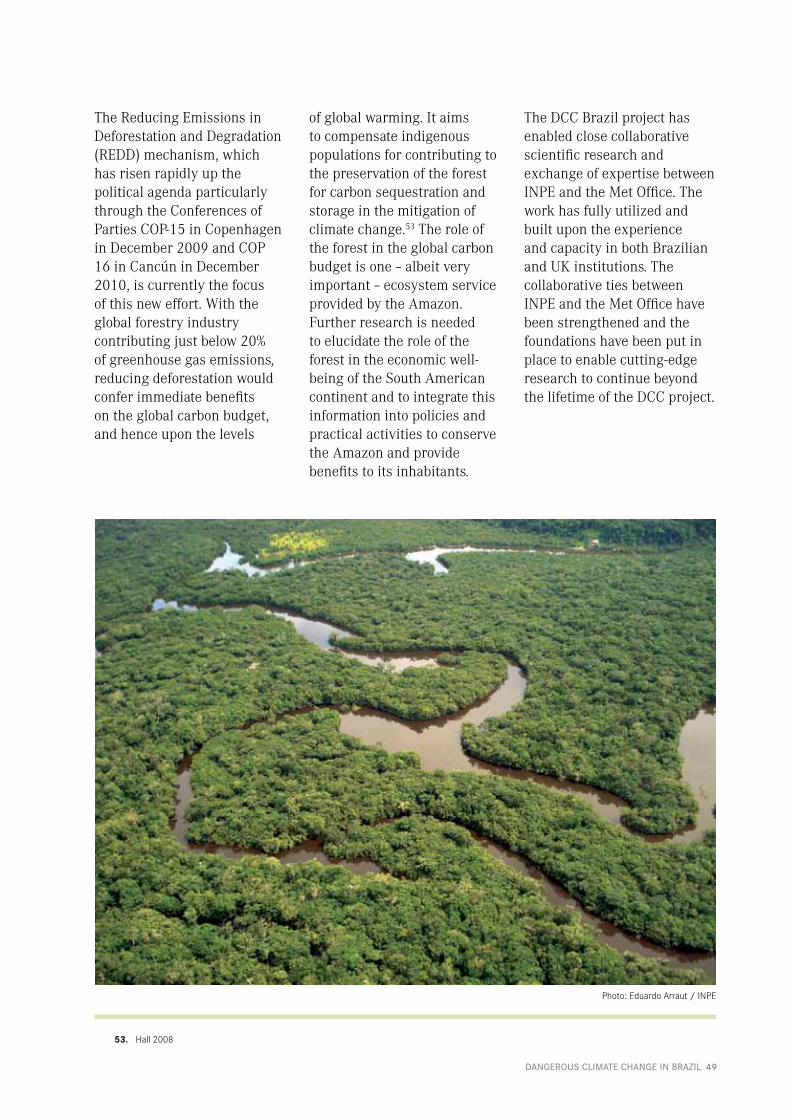
49DANGEROUS CLIMATE CHANGE IN BRAZIL
53. Hall2008
The Reducing Emissions in Deforestation and Degradation (REDD) mechanism, which has risen rapidly up the political agenda particularly through the Conferences of Parties COP-15 in Copenhagen in December 2009 and COP 16 in Cancún in December 2010, is currently the focus of this new effort. With the global forestry industry contributing just below 20% of greenhouse gas emissions, reducing deforestation would confer immediate benefits on the global carbon budget, and hence upon the levels
Photo:EduardoArraut/INPE
of global warming. It aims to compensate indigenous populations for contributing to the preservation of the forest for carbon sequestration and storage in the mitigation of climate change.53 The role of the forest in the global carbon budget is one – albeit very important – ecosystem service provided by the Amazon. Further research is needed to elucidate the role of the forest in the economic well-being of the South American continent and to integrate this information into policies and practical activities to conserve the Amazon and provide benefits to its inhabitants.
The DCC Brazil project has enabled close collaborative scientific research and exchange of expertise between INPE and the Met Office. The work has fully utilized and built upon the experience and capacity in both Brazilian and UK institutions. The collaborative ties between INPE and the Met Office have been strengthened and the foundations have been put in place to enable cutting-edge research to continue beyond the lifetime of the DCC project.

50 DANGEROUS CLIMATE CHANGE IN BRAZIL
We would like to thank M. Sumire, D. Grabois, L. Carrijo, R. Ferreira, from the climate team in the UK Embassy in Brasilia for their help in designing and implementing the DCC project. Further thanks go to M. Valverde and E. Andrade who worked to make this project a success, and to J Miguez and H. Machado Filho from the National Coordination of Climate Change of the Ministry of Science and Technology from Brazil for their support and help in making this project possible. Special thanks go to INPE´s director, Gilberto Câmara, for all the facilities in developing the project at the CCST INPE.
Additional thanks go to UNDP Project BRA/05/G31 and the FCO GOF-Dangerous Climate Change DCC project from the UK. JM and SC were funded by the Brazilian National Research Council CNPq. Additional funds came from the Brazilian programs Rede-CLIMA, the National Institute of Science and Technology for Climate Change (INCT-CC) from the CNPq, and the FAPESP-Program on Global Climate Change, Project Assessment of Impacts and Vulnerability to Climate Change in Brazil and Strategies for Adaptation Options.
Photo:LauraBorma/INPE
51DANGEROUS CLIMATE CHANGE IN BRAZIL
•Aragão,L.E.,Y.Malhi,N.Barbier,A.Lima,Y.Shimabukuro,L.Anderson,andS.Saatchi(2008),Interactionsbetweenrainfall,deforestationandfiresduringrecentyearsintheBrazilianAmazonia, Phil. Trans. R. Soc. B.,363:1779-1785;doi:10.1098/rstb.2007.002.
•Betts,R.,P.Cox,M.Collins,P.Harris,C.Huntingford,andC.Jones(2004),Theroleofecosystem-atmosphereinteractionsinsimulatedAmazonianprecipitationdecreaseandforestdiebackunderglobalchangewarming. Theor. Appl. Climatol.,78,157-175.
•Betts,R.A.,M.SandersonandS.Woodward(2008),Effectsoflarge-scaleAmazonforestdegradationonclimateandairqualitythroughfluxesorcarbondioxide,water,energy,mineraldustandisoprene. Phil. Trans. R. Soc. B., 363(1498),1873-1880,doi:10.1098/rstb.2007.0027.
•Brown,I.F.,W.Schroeder,A.Setzer,M.deLosRiosMaldonado,N.Pantoja,A.DuarteandJ.Marengo(2006),MonitoringfiresinsouthwesternAmazoniarainforests. Eos, Trans. Amer. Geophys. Union, 87(253).
•Boyd,E.(2008),NavigatingAmazoniaunderuncertainty:past,presentandfutureenvironmentalgovernance. Phil. Trans. R. Soc. B, 363:1911-1916;doi:10.1098/rstb.2007.0023.
•BustamanteJ.F.,J.L.Gomes,S.C.Chou(2006),5-YearEtaModelseasonalforecastclimatologyoverSouthAmerica.In:InternationalConferenceonSouthernHemisphereMeteorologyandOceanography,08.24–28April2006,FozdoIguaçu(PR),pp503–506.
•Chen,T.-C.,J.-H.Yoon,K.J.St.CroixandE.S.Takle(2001),SuppressingimpactsoftheAmazoniandeforestationbytheglobalcirculationchange.Bull. Amer. Met. Soc.82,2209-2215.
•Christensen,J.H.,T.R.Carter,M.RummukainenandG.Amanatidis(2007),Evaluatingtheperformanceandutilityofregionalclimatemodels:ThePRUDENCEproject, Climatic Change,81,1-6.
•Chou,S.C.,C.A.S.Tanajura,Y.Xue,andC.A.Nobre(2002),ValidationofthecoupledEta/SSiBmodeloverSouthAmerica, J. Geophys. Res., 107(D20),8088,doi:10.1029/2000JD000270.
•Chou, S. C.,J.F.BustamanteandJ.L.Gomes(2005),EvaluationofEtaModelseasonalprecipitationforecastsoverSouthAmerica, Nonlin. Processes Geophys.,12,537-555,doi:10.5194/npg-12-537-2005
•Collins,M.,S.-I.An,W.Cai,A.Ganachaud,E.Guilyardi,F.-F.Jin,M.Jochum,M.Lengaigne,S.Power,A.Timmermann,G.VecchiandA.Wittenberg(2010),TheimpactofglobalwarmingonthetropicalPacificOceanandElNiño. Nature Geoscience, doi:10.1038/ngeo868.
•Cox,P.,R.Betts,C.Jones,S.SpallandT.Totterdell(2000),Accelerationofglobalwarmingduetocarbon-cyclefeedbacksinacoupledclimatemodel. Nature,408,184-187.
•Cox,P.M.,R.A.Betts,M.Collins,P.Harris,C.HuntingfordandC.D.Jones(2004),Amazoniandiebackunderclimate-carboncycleprojectionsforthe21stcentury. Theor. Appl. Climatol., 78,137-156.
52 DANGEROUS CLIMATE CHANGE IN BRAZIL
•Cox,P.,P.Harris,C.Huntingford,R.Betts,M.Collins,C.Jones,T.Jupp,J.MarengoandC.Nobre(2008),IncreasingriskofAmazonianDroughtduetodecreasingaerosolpollution. Nature,453,212-216.
•CPRM(2010),MonitoramentoHidrológico2010Boletimno32–22/10/2010.AgenciaNacionaldeAguasANA,ServiçoGeológicodoBrasilCPRM.Manaus,AM.13pp.
•Eltahir,E.A.B.andL.Bras(1994),PrecipitationrecyclingintheAmazonbasin. Q. J. R. Meteorol. Soc., 120(518),861-880,doi:10.1002/qj.49712051806.
•FuR.,R.E.Dickinson,M.X.ChenandH.Wang(2001),HowdotropicalseasurfacetemperaturesinfluencetheseasonaldistributionofprecipitationintheequatorialAmazon? J. Climate,14,4003-4026.
•Giorgi,F.(2008),Asimpleequationforregionalclimatechangeandassociateduncertainty. J. Climate,21,1589-1604.
•Golding,N.andR.Betts(2008),FireriskinAmazoniaduetoclimatechangeintheHadCM3climatemodel:Potentialinteractionswithdeforestation.GlobalBiogeochem. Cycles, 22, GB4007, doi:10.1029/2007GB003166.
•Good,P.,J.A.Lowe,M.CollinsandW.Moufouma-Okia(2008),AnobjectivetropicalAtlanticseasurfacetemperaturegradientindexforstudiesofsouthAmazondry-seasonclimatevariabilityandchange. Phil. Trans. R. Soc. B.,363(1498),1761-1766,doi:10.1098/rstb.2007.0024.
•Hall,A.(2008),BetterREDthandead:payingthepeopleforenvironmentalservicesinAmazonia, Phil. Trans. R. Soc. B 363:1925-1932,doi:10.1098/rstb.2007.0034.
•Harris,G.R.,D.M.H.Sexton,B.B.B.Booth,M.Collins,J.M.MurphyandM.J.Webb(2006),Frequencydistributionsoftransientregionalclimatechangefromperturbedphysicsensemblesofgeneralcirculationmodelsimulations. Climate Dynamics, 27,357–375,doi:10.1007/s00382-006-0142-8.
•Hirota,M.,C.Nobre,M.D.OyamaandM.M.C.Bustamante(2010),Theclimaticsensitivityoftheforest,savannaandforest–savannatransitionintropicalSouthAmerica. New Phytologist 187:707–719
•Huntingford,C.andCox,P.M.(2000),AnanaloguemodeltoderiveadditionalclimatechangescenariosfromexistingGCMsimulations. Climate Dynamics, 16,575-586.
•IntergovernmentalPanelonClimateChangeIPCC(2007a),ClimateChange2007:ThePhysicalScienceBasis.ContributionofWorkingGroupItotheFourthAssessmentReportoftheIntergovernmentalPanelonClimateChangeSolomon,S.,D.Qin,M.Manning,Z.Chen,M.Marquis,K.B.Averyt,M.TignorandH.L.MillerEds.,CambridgeUniversityPress,Cambridge,UnitedKingdomandNewYork,NY,USA,996pp.
•IntergovernmentalPanelonClimateChangeIPCC(2007b),ClimateChange2007:Mitigation.ContributionofWorkingGroupIIItotheFourthAssessmentReportoftheIntergovernmentalPanelonClimateChange[B.Metz,O.R.Davidson,P.R.Bosch,R.Dave,L.A.Meyer(eds)],CambridgeUniversityPress,Cambridge,UnitedKingdomandNewYork,NY,USA.
•IntergovernmentalPanelonClimateChangeIPCC(2007c),ClimateChange2007:Impacts,AdaptationandVulnerability.ContributionofWorkingGroupIItotheFourthAssessmentReportoftheIntergovernmentalPanelonClimateChange,M.L.Parry,O.F.Canziani,J.P.Palutikof,P.J.vanderLindenandC.E.Hanson,Eds.,CambridgeUniversityPress,Cambridge,UK,976pp.
•IntergovernmentalPanelonClimateChangeIPCC(2007d),ClimateChange2007:SynthesisReport.ContributionofWorkingGroupsI,IIandIIItotheFourthAssessmentReportoftheIntergovernmentalPanelonClimateChange[CoreWritingTeam,Pachauri,R.K.andA.Reisinger(eds.)].IPCC,Geneva,Switzerland,104pp.
53DANGEROUS CLIMATE CHANGE IN BRAZIL
•INPE(2010),RelatorioTecnicosobreaSecade2010naAmazoniaInpe-SãoJosedosCamposSPBrazil(inpreparation)
•Lapola,D.M.,M.D.OyamaandC.A.Nobre(2009),ExploringtherangeofclimatebiomeprojectionsfortropicalSouthAmerica:TheroleofCO2fertilizationandseasonality. Global Biogeochem. Cycles, 23,GB3003,doi:10.1029/2008GB003357
•LiW.,R.FuR.andR.E.Dickinson(2006),RainfallanditsseasonalityovertheAmazoninthe21stcenturyasassessedbythecoupledmodelsfortheIPCCAR4. J. Geophys. Res., 111,D02111.
•Li,W.,R.Fu,R.I.NegrónJuárez,andK.Fernandes(2008),Observedchangeofthestandardizedprecipitationindex,itspotentialcauseandimplicationstofutureclimatechangeintheAmazonregion. Phil. Trans. R. Soc. B, 363,1767–1772,doi:10.1098/rstb.2007.0022.
•Marengo,J.A.(2003),CondiçõesclimáticaserecursoshídricosnoNorteBrasileiro.In:Tucci,C.E.;Braga,B. Clima e Recursos Hídricos no Brasil, AssociaçãoBrasileiradeRecursosHídricosFBMC/ANA.PortoAlegre,Brasil,9,117-161.
•Marengo,J.A.(2004),InterdecadalvariabilityandtrendsofrainfallacrosstheAmazonbasin. Theor. Appl. Climatol., 78,79-96.
•Marengo,J.A.(2009),Long-termtrendsandcyclesinthehydrometeorologyoftheAmazonbasinsincethelate1920s. Hydrological Processes, 23: 3236–3244.doi: 10.1002/hyp.7396.
•Marengo,J.A.,W.Soares,C.Saulo,andM.Nicolini(2004),ClimatologyoftheLLJeastoftheAndesasderivedfromtheNCEPreanalyses. J. Climate,17,2261-2280.
•MarengoJ.A.,C.Nobre,J.Tomasella,M.Oyama,G.Sampaio,H.Camargo,L.AlvesandR.Oliveira(2008a),ThedroughtofAmazoniain2005.J.Climate, 21,495-516.
•MarengoJ.A.,C.Nobre,J.Tomasella,M.CardosoandM.Oyama(2008b),Hydro-climaticandecologicalbehaviourofthedroughtofAmazoniain2005. Phil. Trans. R. Soc. B, 21,1-6.
•Marengo,J.A.,R.Jones,L.M.Alves,andM.C.Valverde(2009a),FuturechangeoftemperatureandprecipitationextremesinSouthAmericaasderivedfromthePRECISregionalclimatemodelingsystem. Int. J. Climatol., 15,2241-2255.
•Marengo,J.A.,T.Ambrizzi,R.P.Rocha,L.M.Alves,S.V.Cuadra,M.C.Valverde,S.E.T.Ferraz,R.R.Torres,andD.C.Santos(2009b),FuturechangeofclimateinSouthAmericainthelateXXICentury:Intercomparisonofscenariosfromthreeregionalclimatemodels. Climate Dynamics,doi:10.1007/s00382-009-0721-6.
•Marengo,J.A.,J.Tomasella,L.Alves,W.R.SoaresandC.A.Nobre(2010a),ExtremeclimaticeventsintheAmazonBasin:ClimatologicalandHydrologicalcontextofrecentfloods,submittedto Theor. Appl. Climatol.
•Marengo,J.S.C.Chou,G. Kay,L.M.Alves,J.F.Pesquero,W.R.Soares,D.C.Santos,A.Lyra,G.Sueiro,R.Betts,D.J.Chagas,J.L.Gomes,J.F.BustamanteandP.Tavares(2010b),DevelopmentofregionalfutureclimatechangescenariosinSouthAmericausingtheEtaCPTEC/HadCM3climatechangeprojections:ClimatologyandregionalanalysesfortheAmazon,SãoFranciscoandtheParanáRiverBasins,submittedto Climate Dynamics.
•MeehlG.,C.Covey,T.Delworth,M.Latif,B.McAvaney,J.F.B.Mitchell,R.StoufferandK.Taylor(2007),TheWCRPCMIP3multimodeldataset.Anewerainclimatechangeresearch. Bull. Am. Meteorol. Soc,. 88(9),1383–1394.
•Mitchell,T.D.(2003),Patternscaling:Anexaminationoftheaccuracyofthetechniquefordescribingfutureclimates. Climatic Change, 60, 217–242.
•Molion,L.C.B.(1975),AclimatonomicstudyoftheenergyandmoisturefluxesoftheAmazon’sbasinwithconsiderationsofdeforestationeffects.Ph.D.thesis,UniversityofWisconsin,Madison.
54 DANGEROUS CLIMATE CHANGE IN BRAZIL
•Naki enovi ,N.,J.Alcamo,G.Davis,H.J.M.deVries,J.Fenhann,S.Gaffin,K.Gregory,A.Grubler,T.Y.Jung,T.Kram,E.L.LaRovere,L.Michaelis,S.Mori,T.Morita,W.Papper,H.Pitcher,L.Price,K.Riahi,A.Roehrl,H.-H.Rogner,A.Sankovski,M.Schlesinger,P.Shukla,S.Smith,R.Swart,S.vanRooijen,N.Victor,andZ.Dadi(2000),SpecialReportonEmissionsScenarios.IntergovernmentalPanelonClimateChange,CambridgeUniversityPress,Cambridge.
•NegrónJuárez,R.I.,J.Q.Chambers,G.Guimaraes,H.Zeng,C.F.M.Raupp,D.M.Marra,G.H.P.M.Ribeiro,S.S.Saatchi,B.W.NelsonandN.Higuchi(2010),WidespreadAmazonforesttreemortalityfromasinglecross-basinsqualllineevent. Geophys. Res. Lett., 37,L16701,doi:10.1029/2010GL043733.
•Nepstad,D.C.,C.M.Stickler,B.Soares-FilhoandF.Merry(2008),InteractionsamongAmazonlanduse,forestsandclimate:prospectsforanear-termforesttippingpoint. Phil. Trans. R. Soc. B, 363,1737–1746.doi:10.1098/rstb.2007.0036.
•Nobre,C.A.andL.S.Borma(2009),‘Tippingpoints’fortheAmazonforest. Current Opinion in Environmental Sustainability,1,28-36.
•ObregonG.andJ.A.Marengo(2007),CaracterizaçãodoclimadoSéculoXXnoBrasil:Tendênciasdechuvasetemperaturasmédiaseextremas.Relatório2,MinistériodoMeioAmbiente-MMA,SecretariadeBiodiversidadeEFlorestas–SBF,DiretoriadeConservaçãodaBiodiversidade–DCBioMudançasClimáticasGlobaiseEfeitossobreaBiodiversidade-Subprojeto:CaracterizaçãodoclimaatualedefiniçãodasalteraçõesclimáticasparaoterritóriobrasileiroaolongodoSéculoXXI.Brasília.
•Phillips,O.L.,S.L.Lewis,T.R.Baker,K.-J.ChaoandN.Higuchi(2008),ThechangingAmazonforest. Phil. Trans. R. Soc. B., 363(1498),doi:10.1098/rstb.2007.0033.
•Phillips,O.L.,L.E.O.C.Aragão,S.L.Lewis,J.B.Fisher,J.Lloyd,G.López-González,Y.Malhi,A.Monteagudo,J.Peacock,C.A.Quesada,G.vanderHeijden,S.Almeida,I.Amaral,L.Arroyo,G.Aymard,T.R.Baker,O.Bánki,L.Blanc,D.Bonal,P.Brando,J.Chave,A.C.A.deOliveira,N.DávilaCardozo,C.I.Czimczik,T.R.Feldpausch,M.A.Freitas,E.Gloor,N.Higuchi,E.Jiménez,G.Lloyd,P.Meir,C.Mendoza,A.Morel,D.A.Neill,D.Nepstad,S.Patiño,M.C.Peñuela,A.Prieto,F.Ramírez,M.Schwarz,J.Silva,M.Silveira,A.SotaThomas,H.terSteege,J.Stropp,R.Vásquez,P.Zelazowski,E.AlvarezDávila,S.Andelman,A.Andrade,K.-J.Chao,T.Erwin,A.DiFiore,E.HonorioC.,H.Keeling,T.J.Killeen,W.F.Laurance,A.PeñaCruz,N.C.A.Pitman,P.NúñezVargas,H.Ramírez-Angulo,A.Rudas,R.Salamão,N.Silva,J.Terborgh,J.andA.Torres-Lezama(2009),DroughtSensitivityoftheAmazonRainforest.Science,323:1344-1347.
•Ronchail,J.,G.Cochonneau,M.Mounier,J.L.Guyot,A.GorretideMirandaChaves,V.Guimaräes,andE.deOliveira(2002),InterannualrainfallvariabilityintheAmazonbasinandseasurfacetemperaturesintheequatorialPacificandthetropicalAtlanticOceans. Int. J. Climatol., 22,1663-1686.
•Salati,E.(1987),Theforestandthehydrologicalcycle.In:Dickinson,R.E.(Ed.),GeophysiologyofAmazonia,JohnWiley&Sons,NewYork,pp.273–96.
•Salazar,L.F.(2009),ConseqüênciasdasmudançasclimáticasnadistribuiçãodosbiomasnaAméricadoSul,comênfasenaamazoniaenordeste.277p.(INPE-16573-TDI/1566).Tese(DoutoradoemMeteorologia)-InstitutoNacionaldePesquisasEspaciais,SãoJosédosCampos,SãoPaulo,Brasil.
•Saleska,S.R.,K.Didan,A.R.HueteandH.R.Rocha(2007),Amazonforestsgreen-upduring2005drought, Science, 318(5850),612,doi:10.1126/science.1146663.
•SamantaA,S.Ganguly,H.Hashimoto,S.Devadiga,E.Vermote,Y.Knyazikhin,R.R.NemamiandR.B.Myneni(2010),Amazonforestsdidnotgreen-upduringthe2005drought. Geophys. Res. Lett. 37,L05401.
55DANGEROUS CLIMATE CHANGE IN BRAZIL
•Sampaio,G.(2008),ClimaticconsequencesofgradualconversionofAmazonianTropicalForestsintodegradedpastureorsoybeancropland:aGCMsimulationstudy.PhDThesisinMeteorology-(INPE-15263-TDI/1346)-InstitutoNacionaldePesquisasEspaciais,SãoJosédosCampos417p.Availableon:<http://urlib.net/sid.inpe.br/mtc-m17@80/2008/02.28.17.17>.
•Sampaio,G.,C.Nobre,M.H.Costa,P.Satyamurty,B.S.Soares-Filho,andM.Cardoso(2007),RegionalclimatechangeovereasternAmazoniacausedbypastureandsoybeancroplandexpansion, Geophys. Res. Lett., 34,L17709,doi:10.1029/2007GL030612.
•Satyamurty,P.,A.A.deCastro,J.Tota,L.E.Gularte,andA.O.Manzi,(2009),RainfalltrendsintheBrazilianAmazonBasininthepasteightdecades. Theor. Appl. Climatol.,doi:10.1007/s00704-009-0133-x.
•Seluchi,M.E.andS.C.Chou(2001),EvaluationoftwoEta/CPTECModelversionsforweatherforecastoverSouthAmerica. Geofísica Internacional, 40,219-237.
•Soares-Filho,B.S.,D.C.Nepstad,L.M.Curran,G.C.Cerqueira,R.A.Garcia,C.A.Ramos,E.Voll,A.McDonald,P.LefebvreandP.Schlesinger(2006),ModellingconservationintheAmazonBasin, Nature, 440(7083),520-523,doi:10.1038/nature04389.
•Tomasella,J.S.Borma,J.A.Marengo,D.A.Rodriguez,L.A.Cuartas,C.A.NobreandM.C.R.Prado(2010a),Thedroughtsof1996-1997and2004-2005inAmazonia:hydrologicalresponseintherivermain-stem.Hydrological Processes,v.10,doi:10.1002/hyp.7889.
•Tomasella,J.P.F.Pinho,L.S.Borma,J.A.Marengo,C.A.Nobre,O.R.F.O.Bittencourt,M.C.R.Prado,D.A.Rodriguez,L.A.Cuartas(2010b).Thedroughtsof1997and2005inAmazonia:hydrological,ecologicalandhumanimpactsinthemainstemfloodplain(submittedto Climatic Change)
•Vera,C.W.Higgins,J.Gutzler,J.A.Marengo,R.Garreaud,J.;Amador,D.Gochis,J.Nogues-Paegle,J.C.Zhang,T.Ambrizzi,C.R.Mechoso,D.Lettenmaier(2006),TowardsaunifiedviewoftheAmericanmonsoonsystems. J. Climate,19,4977-5000.
•Victoria,R.,L.Martinelli,J.Moraes,M.V.Ballester,A.,Krushche,G.Pellegrino,R.AlmeidaandJ.Richey(1998),SurfaceairtemperaturevariationsintheAmazonregionanditsborderduringthiscentury. J. Climate, 11,1105–1110.
•Zeng,N.,JYoon,J.A.Marengo,A.Subramaniam,C.A.NobreandAMariotti(2008),Causesandimpactsofthe2005Amazondrought.Environmental Research Letters, 3,1-6.

56 DANGEROUS CLIMATE CHANGE IN BRAZIL
DANGEROUS CLIMATE CHANGE IN BRAZIL
Centro de Ciência do Sistema Terrestre (CCST)InstitutoNacionaldePesquisasEspaciais(INPE)Av.dosAstronautas1758,PredioBeta,sala58JardimdaGranja,SãoJosédosCampos,SPCEP12227-010Tel:55123208-7137|Fax:55123208-7126
RodoviaPresidenteDutra,Km39CachoeiraPaulista-SPCEP12630-000
Met Office Hadley CentreFitzRoyRoadExeter-Devon-EX13PBUnitedKingdomTel:08709000100|01392885680Fax:08709005050|01392885681

57DANGEROUS CLIMATE CHANGE IN BRAZIL


