+ All Categories
Home > Documents > DANUBE NAVIGATION STATISTICS for 2012 – 2013 · DANUBE COMMISSION . DANUBE NAVIGATION STATISTICS...

DANUBE NAVIGATION STATISTICS for 2012 – 2013 · DANUBE COMMISSION . DANUBE NAVIGATION STATISTICS...

Date post: 18-Apr-2018
Category:
Upload: duonganh
View: 218 times
Download: 0 times
Share this document with a friend
32
DANUBE COMMISSION DANUBE NAVIGATION STATISTICS for 2012 – 2013 The following are statistics on key indicators of the Danube navigation in 2012-2013. The tables list abbreviations of the Member States of the Danube Commission: UA Ukraine МD Republic of Moldova RO Romania BG Republic of Bulgaria RS Republic of Serbia HR Republic of Croatia HU Hungary (Republic of Hungary)* SK Slovak Republic АT Republic of Austria DE Federal Republic of Germany RU Russian Federation *Before 1 January 2012
Transcript

DANUBE COMMISSION

DANUBE NAVIGATION STATISTICS

for 2012 – 2013

The following are statistics on key indicators of the Danube navigation in 2012-2013. The tables list abbreviations of the Member States of the Danube Commission:

UA Ukraine

МD Republic of Moldova

RO Romania

BG Republic of Bulgaria

RS Republic of Serbia

HR Republic of Croatia

HU Hungary

(Republic of Hungary)*

SK Slovak Republic

АT Republic of Austria

DE Federal Republic of Germany

RU Russian Federation

*Before 1 January 2012

1. AVAILABLE DANUBE FLEET AND ITS COMPOSITION BY COUNTRIES AND BY MAIN TYPES OF VESSELS

in 2012–2013

(based on statistical data forms ST-1 – ST-3; DSO-1)

Year UA

MD

(2008) RO

(2012)

BG (2012=2010)

RS

HR

HU (2012)

SK

AT

DE

Total

Motorized vessels Number of units

2013 35 17 103 55 97 13 72 31 * * 423

2012 41 17 103 30 97 12 72 20 * * 392

% 85,4 100 100 183,3 100 108,3 100 155,0 * * 107,9

Total power of motorized vessels (kW)

2013 56 182 3 000 53 539 31 915 37 929 7 940 * 11 946 * * 202 451

2012 66 920 3 000 53 539 18 651 37 929 7 355 * 11 709 * * 199 103

% 84,0 100 100 171,1 100 108,0 102,0 * * 101,7

Total carrying capacity of motorized vessels (t)

2013 75 212 18 281 109 957 61 680 88 066 11 048 * 19 969 * * 384 213

2012 91 205 18 281 109 957 34 077 88 066 9 280 * 23 424 * * 374 290

% 82,5 100 100 181,0 100 119,1 85,3 * * 102,7

Tugs Number of units

2013 5 10 64 13 94 30 49 2 * * 267

2012 9 10 64 13 94 31 49 2 * * 272

% 55,6 100 100 100 100 96,8 100 100 * * 98,2

Total power of tugs (kW)

2013 3 640 8 977 22 059 4 668 24 768 8 748 * 915 * * 73 775

Year UA

MD

(2008) RO

(2012)

BG (2012=2010)

RS

HR

HU (2012)

SK

AT

DE

Total

2012 6 728 8 977 22 059 6 116 24 768 8 834 * 915 * * 78 397

% 54,1 100 100 76,3 100 99,0

100 * * 94,1

Pusher vessels Number of units

2013 71 1 163 42 65 10 23 39 * * 414

2012 73 1 163 38 65 10 23 37 * * 410

% 97,3 100 100 110,5 100 100 100 105,4 * * 101,0

Total power of pusher vessels (kW)

2013 109 445 1 500 172 781 43 425 55 388 5 294 * 37 666 * * 425 499

2012 112 483 1 500 172 781 36 723 55 388 5 205 * 36 916 * * 420 996

% 97,3 100 100 118,3 100 101,7 * 102,0 * * 101,1

Towed barges Number of units

2013 36 26 391 29 228 69 11 11 * * 801

2012 78 26 391 44 228 72 11 11 * * 861

% 46,2 100 100 65,9 100 95,8 100 100 * * 93,0

Total carrying capacity of towed barges (t)

2013 57 707 24 653 238 074 32 793 294 001 39 011 * 6 747 * * 692 986

2012 125 362 24 653 238 074 47 122 294 001 40 056 * 6 747 * * 776 015

% 46,0 100 100 69,6 100 97,4 100 * * 89,3

Pushed barges Number of units

2013 305 * 740 132 180 50 274 130 * * 1 811

2012 335 * 740 122 180 50 274 135 * * 1 836

% 91,0 * 100 108,2 100 100 94,2 96,3 * * 98,6

Total carrying capacity of pushed barges (t) 2013 445 913 * 1 231 674 218 574 169 101 47 507 * 211 749 * * 2 324 518

Year UA

MD

(2008) RO

(2012)

BG (2012=2010)

RS

HR

HU (2012)

SK

AT

DE

Total

2012 486 491 * 1 231 674 202 861 169 101 47 500 * 219 447 * * 2 357 074

% 91,7 100 107,7 100 100,0 96,5 98,6

TOTAL

Total number of vessels (unit)

2013 452 54 1461 271 664 172 429 213 * * 3 716

2012 536 54 1461 247 664 175 429 205 * * 3 771

% 84,3 100 100 109,7 100 98,3 100 103,9 * * 98,5

Total power of fleet (kW)

2013 169 267 13 477 248 379 80 008 118 085 21 982 * 50 527 * * 701 725

2012 186 131 13 477 248 379 61 490 118 085 21 394 * 49 540 * * 698 496

% 90,9 100 100 130,1 100 102,7 102,0 * * 100,5

Total carrying capacity of fleet (t)

2013 578 832 42 934 1 579 705 313 047 551 168 97 566 * 238 465 * * 3 401 717

2012 703 058 42 934 1 579 705 284 060 551 168 96 836 * 249 618 * * 3 507 379

% 82,3 100 100 110,2 100 100,8 * 95,5 * * 97,0

* not available or magnitude "0".

2. COMPOSITION OF THE DANUBE FLEET BY COUNTRIES in 2013

(DRY BULK CARGO AND LIQUID BULK CARGO VESSELS; TUGS AND PUSHER VESSELS)

1. Dry bulk cargo vessels

Country

Dry bulk cargo vessels Total Motorized Barges

Number of

vessels (unit)

Carrying capacity (t)

Power (kW)

Number of

vessels (unit)

Carrying capacity (t)

Power (kW)

Number of

vessels (unit)

Carrying capacity (t)

Power (kW)

UA 32 71 720 54 694 326 481 939 358 553 659 54 694

MD (2008) 8 15 917 .. 26 24 653 34 40 570 0

RO (2012) 90 91 643 53 539 1 051 1 417 918 1 141 1 509 561 53 539

BG 43 51 312 26 702 153 241 618 196 292 930 26 702

RS 97 88 066 37 929 262 351 606 359 439 672 37 929

HR 7 4 849 3 070 98 63 395 105 68 244 3 070

HU (2012) 72 .. .. 283 .. 355 .. ..

SK 28 17 385 10 772 118 182 831 146 200 216 10 772

АT .. .. .. .. .. .. .. ..

DE .. .. .. .. .. .. .. ..

Total 377 340 892 186 706 2 317 2 763 960 2694 3 104 852 186 706

2. Liquid bulk cargo vessels

Country

Liquid bulk cargo vessels Total Motorized Barges

Number of

vessels (unit)

Carrying capacity (t)

Power (kW)

Number of

vessels (unit)

Carrying capacity (t)

Power (kW)

Number of

vessels (unit)

Carrying capacity (t)

Power (kW)

UA 3 3 492 1 488 15 21 681 18 25 173 1 488

MD (2008) 5 4 199 .. 0 0 5 4 199 0

RO (2012) 13 18 314 7 959 80 51 830 93 70 144 7 959

BG 11 9 559 5 213 7 9 269 18 18 828 5 213

RS 0 0 0 146 111 496 146 111 496 0

HR 6 6199 4 870 21 23 123 27 29 322 4 870

HU (2012) 0 .. .. 2 .. 2 0 0

SK 3 2 584 1 174 23 35 665 26 38 249 1 174

АT .. .. .. .. .. .. .. ..

DE .. .. .. .. .. .. .. ..

Total 41 44 347 20 704 294 253 064 335 297 411 20 704

3. Tugs and pusher vessels

Country

Tugs Pusher vessels * Total

Number of vessels (unit)

Power (kW)

Number of vessels (unit)

Power (kW)

Number of vessels (unit)

Power (kW)

UA 5 3 640 71 109 445 76 113 085

MD (2008) 10 8 977 1 1 500 11 10 477

RO (2012) 64 22 059 163 172 781 227 194 840

BG 13 4 668 42 43 425 55 48 093

RS 94 24 768 65 55 388 159 80 156

HR 30 8 748 10 5 294 40 14 042

HU (2012) 49 .. 23 .. 72 ..

SK 2 915 39 37 666 41 38 581

АT .. .. .. .. .. ..

DE .. .. .. .. .. ..

Total 267 73 775 414 425 499 681 499 274

*Including pusher tugs

3. DATA ON DANUBE FLEET BY COUNTRIES AND BY YEARS OF CONSTRUCTION (as of 31 December 2013)

Year of construction

Country Fleet Before 1941

1941-1960

1961-1970

1971-1980

1981-1990

1991-2000

2001-2010

After 2010 Unknown TOTAL*

Overall power of

motorized vessels

TOTAL

UA

Number of vessels 0 1 112 37 197 84 21 0 0 452 536

Power 0 0 67 138 32 921 13 026 0 0 0 0 113 085 56 182 169 267

Carrying capacity 0 1 190 106 857 38 727 223 854 164 454 43 752 0 0 578 834 703 058

MD (2008)

Number of vessels 0 5 27 6 14 2 0 0 0 54 54

Power 0 1 170 4 037 440 3 336 1 488 10 471 3 000 1 3471

Carrying capacity 0 3 203 20 776 4 131 14 824 0 0 0 0 42 934 42 934

RO (2012)

Number of vessels 29 108 188 350 660 121 5 .. 0 1 461 1 461

Power 8 174 14 775 30 794 103 635 35 092 2 370 .. 0 194 840 53 539 248 379

Carrying capacity 29 621 53 118 101 879 370 441 820 285 204 210 151 .. 0 1 579 705 1 579 705

BG

Number of vessels 18 20 59 52 88 24 9 0 0 270 270

Power 0 1 251 12 281 13 692 13 358 7 511 0 0 0 48 093 31 915 80 008

Carrying capacity 22 489 16 379 39 105 66 883 124 283 28 910 14 290 0 0 312 339 312 339

Before 1941

1941-1960

1961-1970

1971-1980

1981-1990

1991-2000

2001-2010

After 2010 Unknown TOTAL*

Overall power of

motorized vessels

TOTAL

RS

Number of vessels 24 94 257 177 98 13 1 0 0 664 664

Power 1 936 7 458 33 960 25 476 9 145 1 945 236 80 156 37 929 118 085

Carrying capacity 10 023 50 210 203 663 166 108 111 354 9 810 0 0 0 551 168 551 168

HR

Number of vessels 4 34 72 42 13 3 2 0 2 172 172

Power** 1 720 5 863 8 622 3 949 1 258 441 0 129 21 982 21 982

Carrying capacity 4 544 17 568 44 176 20 949 8 244 501 926 0 658 97 566 97 566

HU (2012)

Number of vessels 0 72 116 130 109 2 429 429

Power .. .. .. .. .. .. .. .. .. .. .. ..

Carrying capacity .. .. .. .. .. .. .. .. .. .. .. ..

SK

Number of vessels 0 7 29 39 130 5 1 0 2 213 213

Power** 3 124 10 999 17 826 17 248 1 030 300 0 50 527 50 527

Carrying capacity 0 5 735 16 878 34 055 171 361 8 079 399 0 1 958 238 465 238 465

TOTAL 2013 Number of vessels 75 341 860 833 1 309 254 39 0 4 3 715 3 715

Power 3 656 27 040 151 812 125 098 161 006 47 507 2 906 0 129 519 154 182 565 701 719

Carrying capacity 66 677 147 403 533 334 701 294 1 474 205 415 964 59 518 0 2 616 3 401 011 3 401 011

Before 1941

1941-1960

1961-1970

1971-1980

1981-1990

1991-2000

2001-2010

After 2010 Unknown TOTAL*

Overall power of

motorized vessels

TOTAL

TOTAL 2012

Number of vessels 66 340 904 867 1 302 250 37 0 5 3 771 3 771

Power 3 669 26 671 156 777 121 809 161 649 45 141 2 606 0 0 518 322 191 748 710 070

Carrying capacity 55 871 146 800 606 948 757 144 1 465 133 413 748 57 645 0 4 090 3 507 379 3 507 379

in % to 2012

Number of vessels 113,6 100,3 95,1 96,1 100,5 101,6 105,4 0 80,0 98,5 98,5

Power 99,6 101,4 96,8 102,7 99,6 105,2 111,5 0 0 100,2 95,2 98,8

Carrying capacity 119,3 100,4 87,9 92,6 100,6 100,5 103,2 0 64,0 97,0 97,0

*) Disregarding data on power of motorized vessels, excluding Croatia (2012-2013), Slovakia (2013).

**) Based on data on power, including motorized vessels, for every period indicated in columns.

4. SUMMARY DATA ON DANUBE FLEET BY YEARS OF CONSTRUCTION (as of 31 December 2013)

Year Before 1941

1941-1960

1961-1970

1971-1980

1981-1990

1991-2000 2001-2010 After

2010 Unknown TOTAL 1

TOTAL 2013

Number of vessels *

75 341 860 833 1309 254 39 0 4 3 715

% 2,0 9,2 23,1 22,4 35,2 6,8 1,0 0 0,1 100

1) Ukraine, Republic of Moldova (2008), Romania (2012), Bulgaria, Serbia, Croatia, Hungary (2012), Slovakia.

Year Before

1941 1941-1960

1961-1970

1971-1980

1981-1990

1991-2000

2001-2010

After 2010 Unknown TOTAL * TOTAL

TOTAL 2013 Number of vessels 75 341 860 833 1309 254 39 0 4 3 286* 3 715**

% 2,3 10,4 26,2 25,3 39,8 7,7 1,2

0,1 100

Power 3 656 27 040 151 812 125 098 161 006 47 507 2 906 0 129 519 154*** 701 719****

% 0,7 5,2 29,2 24,1 31,0 9,2 0,6

0,0 100

Carrying capacity 66 677 147 403 533 334 701 294 1 474 205 415 964 59 518 0 2 616 3 401 011

% 2,0 4,3 15,7 20,6 43,3 12,2 1,8

0,1 100

*) Disregarding number of vessels of Hungary, as Hungary does not provide data on power and carrying capacity of vessels. **) Based on data on number of vessels of Hungary.

***) Disregarding data on power of motorized vessels with a breakdown by periods, excluding Croatia and Slovakia. ****) Summarized data on power of vessels of all countries listed above for indicated years.

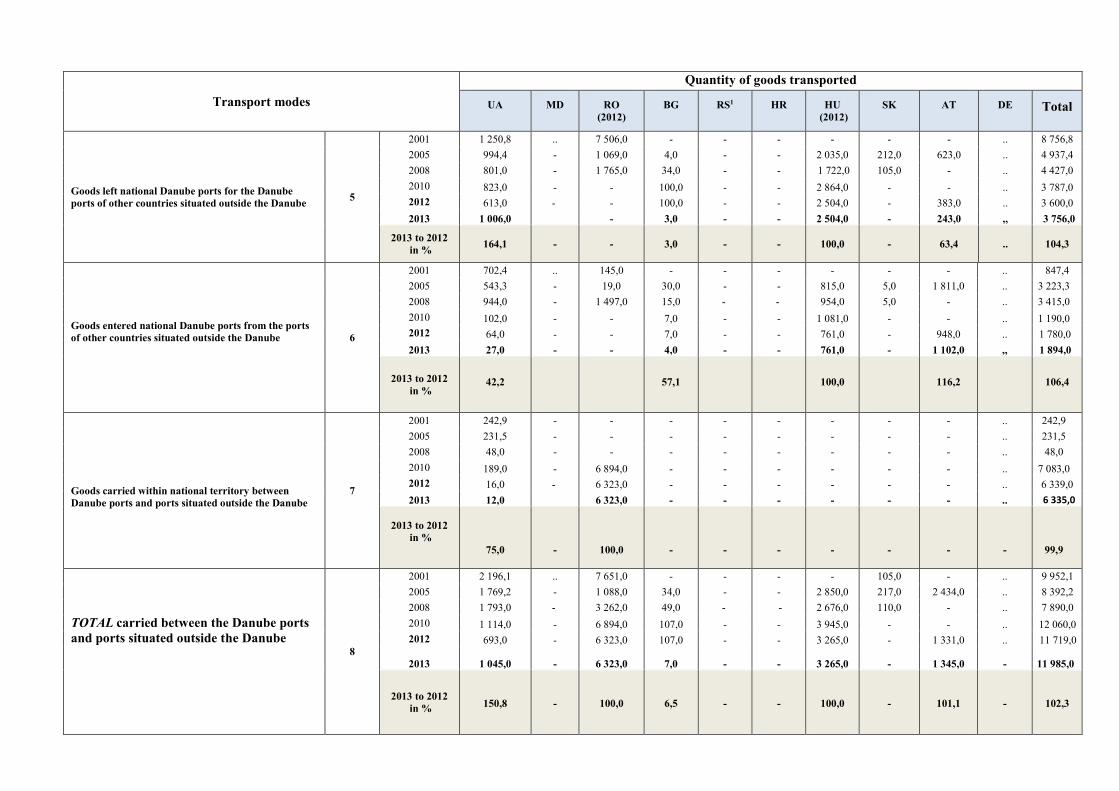
5. GENERAL DATA ON QUANTITY OF GOODS LEFT, ENTERED, CARRIED WITHIN NATIONAL TERRITORIES AND IN TRANSIT ON THE DANUBE for 2001-2013

BY COUNTRIES

(based on statistical data forms ST-5 and DSO-1) In thous. tonnes

Transport modes

Quantity of goods transported

UA

MD RO (2012)

BG

RS1

HR

HU (2012)

SK АT

DE Total

Goods left national Danube ports for the Danube ports of other countries

1

2001 3 951,5 .. 2 140,0 303,5 342,0 88,6 3432,0 1 164,2 1 258,0 7 777,1 18 114,9 2005 8 312,2 - 1 941,0 320,0 1 179,0 773,0 1 454,0 1 059,0 1 031,0 9 070,0 25 140,2 2008 8 390,0 - 2 023,03 904,0 1 324,0 318,0 1 372,0 980,0 2 167,0 6 972,0 24 450,0 2010 7 039,0 .. 2 715,0 580,0 2 161,0 156,0 1 590,0 4 252,0 1 668,0 6 741,0 26 902,0 2012 4 394,0 ,, 2 020,0 3 053,0 3 319,0 256,0 1 310,0 2 411,0 1 348,04 6 686,0 24 814,0 2013 3 286,0 ,, 2 020,0 580,0 3 283,0 273,0 1 310,0 2 756,0 1 242,04 6 065,0 20 798,0

2013 to 2012 in % 133,7 .. 100,0 526,4 101,1 106,6 100,0 87,5 108,5 110,2 119,3

Goods entered national Danube ports from the Danube ports of other countries

2*

2001 215,1 .. 367,0 2 153,6 2 472,0 167,0 1429,0 91,2 5 607,0 .. 12 501,9 2005 389,4 32,8 3 375,0 3 034,0 3 579,0 479,0 719,0 23,0 4 259,0 .. 15 890,2 2008 266,0 159,0 5 405,0 2 673,0 3 986,0 421,0 840,0 182,0 5 731,0 .. 19 663,0 2010 242,0 .. 4 292,0 1 046,0 3 523,0 214,0 739,0 158,0 6 199,0 .. 16 413,0 2012 37,0 .. 2 363,0 1 046,0 1 846,0 340,0 504,0 168,0 4 490,04 .. 10 794,0 2013 94,0 ,, 2 363,0 3 362,0 1 825,0 262,0 504,0 202,0 4 358,04 ,, 12 970,0

2013 to 2012 in % 254,1 ,, 100,0 321,4 98,9 77,1 100,0 120,2 97,1 ,, 120,2

Goods carried between the Danube ports within national territory

3

2001 547,9 .. 7 652,0 949,5 2 284,0 223,4 .. - 1 206,0 .. 12 862,8 2005 55,8 - 13 197,0 1 741,0 4 399,0 14,0 908,0 101,0 356,0 .. 20 771,8 2008 138,0 - 5 166,0 1 392,0 3 688,0 - 75,0 84,0 502,0 .. 11 045,0 2010 - - 635,0 390,0 - 1,0 30,0 71,0 456,0 .. 1 583,0 2012 11,0 - 439,0 390,0 1 076,0 0,0 32,0 38,0 1 239,0 .. 3 225,0 2013 9,0 ,, 439,0 1 200,0 1 053,0 0,0 32,0 25,0 700,0 ,, 3 458,0

2013 to 2012 in % 81,8 ,, 100,0 307,7 97,9 - 100,0 65,8 56,5 ,, 107,2

TOTAL carried between the Danube ports

4

2001 4 714,5 .. 8 159,0 3 406,6 5 098,0 479,0 4 861,0 1 255,4 8 071,0 7 777,1 43 821,6 2005 8 758,4 32,8 18 513,0 5 095,0 9 157,0 1 266,0 3 081,0 1 183,0 5 646,0 9 070,0 61 802,2 2008 8 794,0 159,0 12 594,0 4 969,0 8 998,0 739,0 2 288,0 1 246,0 8 400,0 6 972,0 55 159,0 2010 7 281,0 .. 7 642,0 2 016,0 5 684,0 371,0 2 359,0 4 481,0 8 323,0 6741,0 44 898,0 2012 3 334,0 .. 4 822,0 2 016,0 6 205,0 596,0 1 846,0 2 962,0 6 971,0 6 065,0 34 817,0

2013 4 497,0 ,, 4 822,0 7 615,0 6 197,0 535,0 1 846,0 2 638,0 6 406,0 6 686,0 41 242,0

2013 to 2012 in %

134,9

..

100,0

377,7

99,9

89,8

100,0

89,1

91,9

110,2

118,5

Transport modes

Quantity of goods transported

UA

MD RO (2012)

BG

RS1

HR

HU (2012)

SK АT

DE Total

Goods left national Danube ports for the Danube ports of other countries situated outside the Danube 5

2001 1 250,8 .. 7 506,0 - - - - - - .. 8 756,8 2005 994,4 - 1 069,0 4,0 - - 2 035,0 212,0 623,0 .. 4 937,4 2008 801,0 - 1 765,0 34,0 - - 1 722,0 105,0 - .. 4 427,0 2010 823,0 - - 100,0 - - 2 864,0 - - .. 3 787,0 2012 613,0 - - 100,0 - - 2 504,0 - 383,0 .. 3 600,0 2013 1 006,0 - 3,0 - - 2 504,0 - 243,0 ,, 3 756,0

2013 to 2012 in %

164,1

-

-

3,0

-

-

100,0

-

63,4

..

104,3

Goods entered national Danube ports from the ports of other countries situated outside the Danube

6

2001 702,4 .. 145,0 - - - - - - .. 847,4 2005 543,3 - 19,0 30,0 - - 815,0 5,0 1 811,0 .. 3 223,3 2008 944,0 - 1 497,0 15,0 - - 954,0 5,0 - .. 3 415,0 2010 102,0 - - 7,0 - - 1 081,0 - - .. 1 190,0 2012 64,0 - - 7,0 - - 761,0 - 948,0 .. 1 780,0 2013 27,0 - - 4,0 - - 761,0 - 1 102,0 ,, 1 894,0

2013 to 2012 in %

42,2

57,1

100,0

116,2

106,4

Goods carried within national territory between Danube ports and ports situated outside the Danube

7

2001 242,9 - - - - - - - - .. 242,9 2005 231,5 - - - - - - - - .. 231,5 2008 48,0 - - - - - - - - .. 48,0 2010 189,0 - 6 894,0 - - - - - - .. 7 083,0 2012 16,0 - 6 323,0 - - - - - - .. 6 339,0 2013 12,0 6 323,0 - - - - - - .. 6 335,0

2013 to 2012

in %

75,0

-

100,0

-

-

-

-

-

-

-

99,9

TOTAL carried between the Danube ports and ports situated outside the Danube

8

2001 2 196,1 .. 7 651,0 - - - - 105,0 - .. 9 952,1 2005 1 769,2 - 1 088,0 34,0 - - 2 850,0 217,0 2 434,0 .. 8 392,2 2008 1 793,0 - 3 262,0 49,0 - - 2 676,0 110,0 - .. 7 890,0 2010 1 114,0 - 6 894,0 107,0 - - 3 945,0 - - .. 12 060,0 2012 693,0 - 6 323,0 107,0 - - 3 265,0 - 1 331,0 .. 11 719,0

2013 1 045,0 - 6 323,0 7,0 - - 3 265,0 - 1 345,0 - 11 985,0

2013 to 2012 in % 150,8

-

100,0

6,5

-

-

100,0

-

101,1

-

102,3

Transport modes

Quantity of goods transported

UA

MD RO (2012)

BG

RS1

HR

HU (2012)

SK АT

DE Total

Goods carried in transit on the Danube within national section: a) upstream

b) downstream

9

a) 2001 - .. - 13,6 1 219,0 - 1 268,0 74,9 2 211,0 .. 4 786,5

a) 2005 - - 429,0 - 2 105,0 - 2 535,0 97,0 925,0 .. 6 091,0 а) 2008 178,0 - 533,0 - 4 195,0 - 2 963,0 277,0 2 194,0 .. 10 340,0 a) 2010 - - - - 2 661,0 - 2 653,0 ,, 2 293,0 .. 7 607,0 a) 2012 - - - - 2 474,0 - 2 123,0 - 2 000,0 .. 6 597,0

a)2013 - .. - 2 784,0 - 2 123,0 - 2 306,0 .. 7 213,0 2013 to 2012

in % - - - - 112,5 - 100,0 - 115,3 .. 109,3

b)2001 - .. - 42,1 1 099,0 - 434,0 107,0 1 352,0 .. 3 034,1 b)2005 - - 853,0 - 2 293,0 - 801,0 29,0 334,0 .. 4 310,0 b)2008 6,0 - 1 977,0 - 2 155,0 - 903,0 79,0 615,0 .. 5 735,0 b)2010 0,0 - - 2 304,0 - 996,0 ,, 434,0 3 734,0 b)2012 - - - - 1 853,0 - 901,0 - 412,0 .. 3 166.0 b)2013 - - .. - 1 556,0 - 901,0 - 565,0 .. 3 022,0

2013 to 2012 in % - - - - 84,0 - 100,0 - 137,1 .. 95,4

TOTAL carried in transit 10

2001 - .. - 55,7 2 318,0 - 1 702,0 181,9 3 564,0 .. 7 821,6 2005 - - 1 282,0 - 4 398,0 - 3 336,0 126,0 1 259,0 .. 10 401,0 2008 184,0 - 2 510,0 - 6 350,0 - 3 866,0 356,0 2 809,0 .. 16 075,0 2010 - - - - 4 965,0 - 3 649,0 5 622,0- 2 727,0 .. 16 963,0 2012 - - - - 4 327,0 - 3 024,0 5 280,0 2 412,0 .. 15 043,0 2013 - - - - 4 340,0 - 3 024,0 5 469,0 2 871,0 .. 15 704,0

2013 to 2012 in % - - - - 100,3 - 100,0 103,6 119,0 .. 104,4

TOTAL carried on the Danube 4+8+10

2001 6 910,6 .. 15 810,0 3 462,3 7 416,0 479,0 6 563,0 1 542,3 11 634,0 7 777,1 61 594,3 2005 10 527,6 32,8 20 883,0 5 129,0 13 555,0 1 266,0 9 267,0 1 526,0 9 339,0 9 070,0 80 595,4 2008 10 771,0 159,0 18 366,0 5 018,0 15 348,0 739,0 8 830,0 1 712,0 11 209,0 6 972,05 79 124,0 2010 8 395,0 - 14 536,0 2 123,0 10 649,0 371,0 9 953,0 10 103,0 11 050,0 6 741,05 73 921,0 2012 4 027,0 - 11 145,0 2 123,0 10 532,0 596,0 8 135,0 8 242,0 10 714,0 6 065,05 61 579,0

2013 5 542,0 - 11 145,0 7 622,0 10 537,0 535,0 8 135,0 8 107,0 10 622,0 6 686,05 68 931,0

2013 to 2012 in %

137,6 - 100,0 359,0 100,0 89,8 100,0 98,4 99,1 110,2 111,9

2013 to 2001 in % 80,2 - 70,5 220,2 142,1 114,8 124,0 525,7 91,3 86,0 111,9

* Except for goods in transit. 1 Before 05/06/2006 – Serbia and Montenegro, before 04/02/2003 – Federal Republic of Yugoslavia. 2 (..) or (-) – not available or magnitude "0". 3 Hereinafter for Romania - in 2008 - data for 2007 have been used. 4 Including transport in/from all German and Romanian ports. 5 WSV.de — Verkehrsbericht, 2008-2013.

6. VOLUME OF GOODS TRANSPORTED ON THE DANUBE in 2012 - 2013 In thous. tonnes

Countries Left countries by the Danube Transported within national

territories by the Danube TOTAL

2012 2013 in % to 2012 2012 2013 in % to

2012 2012 2013 in % to 2012

UA 3 899,0 5 400,0 138,5 27,0 21,0 77,8 3 926,0 5 421,0 138,1

MD .. .. .. .. .. .. .. .. ..

RO (2012) 2 020,0 2 020,0 100,0 6 762,0 6 762,0 100,0 8 782,0 8 782,0 100,0

BG (2012=2010) 680,0 3 053,0 449,0 390,0 1 200,0 32,5 1 070,0 4 253,0 397,5

RS 3 283,0 3 319,0 101,1 1 076,0 1 053,0 97,9 4 359,0 4 372,0 100,3

HR 256,0 273,0 106,6 0 0 0 256,0 273,0 106,6

HU (2012) 3 814,0 3 814,0 100,0 32,0 32,0 100,0 3 846,0 3 846,0 100,0

SK 2 756,0 2 411,0 87,5 38,0 25,0 65,8 2 794,0 2 436,0 87,2

АT 1 622,0 1 592,0 98,2 1 239,0 700,0 56,5 2 861,0 2 292,0 80,1

DE 6 065,0 6 686,0 110,2 .. .. .. 6 065,0 6 686,0 110,2

Total 24 395,0 28 568,0 117,1 9 564,0 9 793,0 102,4 33 959,0 38 361,0 113,0

Arrived on the Danube: through the Sulina canal from the sea 328,0 459,0 139,9

through the Kiliya arm from the sea 792,0 732,0 92,4

through the Danube-Black Sea canal from the sea and from canal ports 13 721,0 13 966,0 101,8

through the Main-Danube canal from the Main and from canal ports 2 365,0 2 727,0 115,3

Total volume of goods transported on the Danube per year 51 165,0 56 245,0 109,9

The importance of cargo flows arrived on the Danube through the canals: Main-Danube; Sulina; Danube-Black Sea and Kiliya arm in 2012-2013 is featured by the following data:

Goods in thous. tonnes 2013 % % 2012 % % % to 2012 Arrived on the Danube from the sea and from the Main and ports on the Main-Danube canal, including through:

- the Sulina canal 459,0 2,6 0,8 328 1,9 0,6 139,9

- the Kiliya arm 732,0 4,1 1,3 792 4,5 1,5 92,4

- the Danube-Black Sea canal

13 966,0 78,1 24,8 13 721 78,5 26,8 101,8

- the Main-Danube canal 2 727,0 15,2 4,8 2 365 15,1 5,2 103,5

A total of goods arrived on the Danube

17 884,0 100 31,8 17476,0 100 34,2 102,3

Volume of goods transported on the Danube per year

56 245,0 100 51 165,0 100 109,9

7. MAJOR PORTS ON THE DANUBE with cargo turnover over 1 mln. t

(2012-2013) in thous.t

Ports 2013 2012

Izmail

2 654,0

2 872,5

Reni 2 729,0 1 061,8

Galaţi** 4 984,0 3 987,0

Brăila** 3 075,0 2 166,0

Tulcea** 2 342,0 2 220,0

Vidin 1 224,0 ..

Svishtov 1 213,0 ..

Russe 1 166,0 1 007,0*

Oriahovo 2 613,0 ..

Prahovo 1 140,0 1 140,0

Novi Sad 1 545,0 1 545,0

Pančevo 1 103,0 1 103,0

Dunaújváros** 1 053,0 1 053,0

Budapest** 789,0 789,0

Bratislava 2 373,0 2 677,0

Vienna 1 665,0 1 218,0

Linz 4 356,0 5 309,0

Regensburg 1 645,0

1 563,0

* 2010 ** 2012

8. CARGO TURNOVER OF THE DANUBE PORTS in 2012-2013

in thous.tonnes

Countries

Loaded Unloaded Total cargo turnover

2013 2012 in % to 2012 2013 2012 in %

to 2012 2013 2012 in % to 2012

UA 5 413,0 3 902,0 138,7 128,0 125,0 102,4 5 541,0 4 027,0 137,6

MD .. .. .. .. .. .. .. .. ..

RO (2012) 5 160,0 5 160,0 100,0 5 985,0 5 985,0 100,0 11 145,0 11 145,0 100,0

BG (2012=2010) 4 084,0 364,0 1 122,0 3 538,0 1 737,0 203,7 7 622,0 2 101,0 362,8

RS 4 553,0 4 776,0 95,3 3 137,0 2 620,0 119,7 7 690,0 7 396,0 104,0

HR 272,0 256,0 106,3 263,0 340,0 77,4 535,0 596,0 89,8

HU (2012) 3 845,0 3 845,0 100,0 1 265,0 1 265,0 100,0 5 110,0 5 110,0 100,0

SK 2 436,0 2 794,0 87,2 227,0 206,0 110,2 2 663,0 3 000,0 88,8

АT 2 292,0 1 624,0 141,1 6 161,0 5 439,0 113,3 8 453,0 7 063,0 119,7

DE* 828,0 1 157,0 71,6 2 360,0 2 169,0 108,8 3 188,0 3 326,0 95,9

TOTAL 28 883,0 23 878,0 121,0 23 064,0 19 886,0 116,0 51 947,0 43 764,0 118,7

* Data from internet - Statstische Berichte/ Bayerisches Landesamt für Statistik und Datenverarbeitung – German ports on the Danube: Kelheim, Regensburg, Straubing-Sand, Deggendorf, Passau and other.

CARGO TURNOVER OF THE DANUBE PORTS in 2012-2013

(accordingly to Goods Nomenclature)

Goods Nomenclature NST-2007 1

01 Products of agriculture, hunting, forestry and fishing 11 Machinery and equipment not elsewhere classified (n.e.c.); products of ICT and precision instruments

02 Coal and lignite; crude petroleum and natural gas 12 Transport equipment

03 Metal ores, peat and other mining and quarrying products 13 Furniture, other manufactured goods n.e.c.

04 Food products, beverages and tobacco 14 Secondary raw materials, wastes

05 Textile, leather and their products 15 Mail, parcels

06 Wood, paper, pulp and publishing products

16 Equipment utilized in transport of goods

07 Coke and refined petroleum products 17 Goods moved and non-market goods, baggage and motor vehicles being moved for repair

08 Chemicals, rubber, plastic and nuclear fuel 18 Grouped goods

09 Other non-metallic mineral products 19 Unidentifiable goods

10 Basic metals, fabricated metal products

20 Other goods n.e.c.

1 Decision of the 71st session of the Danube Commission on Economic and Statistical Issues (Dok. DK/TAG 71/10), of December 10, 2008, stipulates transition of NST/R to new Standard Goods Nomenclature NST-200, to be used for drafting statistics publications for 2008. By the Decision of the 79th session of the Danube Commission on Technical Issues of December 18, 2012 (Dok. DK/TAG/79/11) draft of the short designations at a double-digit level of Nomenclature NST 2007 (Dok. DK/TAG/79/10), to be used for collecting statistics within the Danube Commission, has been endorsed.

CARGO TURNOVER OF ALL DANUBE PORTS in 2012 -2013 (statistical data form ST-12)

Thous.tonnes

Nomenclature NST-2007

UA MD

RO

(2012) BG

(2012=2010) RS HR

HU

(2012) SK АT

DE1 Total %

01

2013 548 * 953 930 1 333 61 2 622 168 736 1 050 8 401 16,2

2012 378 * 953 317 1 860 33 2 622 148 507 1 218 8 036 18,4

02

2013 1 400 * 353 1 190 113 69 548 22 49 38 3 782 7,3

2012 1 648 * 353 723 206 49 548 40 262 47 3 876 8,9

03

2013 890 * 3 119 1590 3 694 29 43 1 405 3 546 455 14 771 28,4

2012 1 340 * 3 119 116 2 683 132 43 1 634 3 189 347 12 603 28,8

04

2013 32 * 14 * 7 51 74 * 306 313 797 1,5

2012 6 * 14 21 * 5 74 * 318 401 839 1,9

05

2013 * * 33 * * * * * * * 33 0,1

2012 * * 33 * * * * * * * 33 0,1

06

2013 31 * 181 33 4 * 5 * 15 43 312 0,6

2012 4 * 181 17 5 * 5 * 16 38 266 0,6

07

2013 99 * 242 * 1 223 8 1 032 668 2 511 330 6 113 11,8

2012 121 * 242 388 1 071 12 1 032 632 1 462 197 5 157 11,8

08

2013 1 984 * 201 158 500 232 297 294 696 421 4 783 9,2

2012 266 * 201 65 508 247 297 334 745 484 3 147 7,2

Nomenclature NST-2007

UA MD

RO

(2012) BG

(2012=2010) RS HR

HU

(2012) SK АT

DE1 Total %

09

2013 222 * * 13 21 18 25 79 7 90 475 0,9

2012 38 * * 65 55 30 25 108 7 82 410 0,9

10

2013 327 * 1 215 * 463 59 337 6 497 275 3 179 6,1

2012 212 * 1 215 91 380 84 337 7 477 289 3 092 7,1

11

2013 1 * 3 * * 8 8 18 58 16 112 0,2

2012 0 * 3 30 9 4 8 35 27 13 129 0,3

12

2013 * * * 3 675 2 * 19 * 1 16 3 713 7,1

2012 * * * * 2 * 19 39 1 39 100 0,2

13

2013 * * * * 8 * * * * * 8 0,0

2012 * * * 1 16 * * * * 1 18 0,0

14

2013 * * 274 * 314 * 36 * 16 131 771 1,5

2012 * * 274 * 590 * 36 21 4 158 1 083 2,5

15

2013 * * * * 1 * * * * * 1 0,0

2012 * * * * * * * * * * 0

16

2013 * * * * 1 * 4 2 10 2 19 0,0

2012 * * * * * * 4 * 5 3 12 0,0

17

2013 * * * * 3 * * * 4 * 7 0,0

2012 * * * * 1 * * * 2 * 3

Nomenclature NST-2007

UA MD

RO

(2012) BG

(2012=2010) RS HR

HU

(2012) SK АT

DE1 Total %

18

2013 * * * * * * * * * * 0 0,0

2012 * * * * * * * * * * 0 0,0

19

2013 1 * 4 534 * * * * * 1 8 4 544 8,7

2012 * * 4 534 23 8 * * * 42 9 4616 10,5

20

2013 7 * 23 33 3 * 61 1 * * 128 0,2

2012 13 * 23 244 2 * 61 2 * * 345 0,8

TOTAL

2013 5 542 * 11 145 7 622 7 690 535 5 111 2 663 8 453 3 188 51 949

100 2012 4 026 * 11 145 2 101 7 396 596 5 111 3 000 7 064 3 326 43 765

in % to 2012

137,7 * 100,0 362,8 104,0 89,8 100,0 88,8 119,7 95,9 118,7

* not available or magnitude "0". 1 Data from internet - Statstische Berichte/ Bayerisches Landesamt für Statistik und Datenverarbeitung – German ports on the Danube: Kelheim, Regensburg, Straubing-Sand, Deggendorf, Passau and other.

9. PASSENGER FLEET AND TRANSPORT OF PASSENGERS BY NATIONAL VESSELS ON THE DANUBE in 2012-2013

Indicator Year UA MD RO

(2012) BG

(2012=2010)

RS HR HU (2012)

SK

АT DE1

Total

Number of passenger vessels in service (units)

2013 6 * 8 5 * *

1022

17 * 37 175

2012 6 * 8 5 * *

1022

15

*

35

171

including:

Number of passenger recreational crafts without cabins

2013 2 * 6 * * *

1022

16 * * 126

2012

2 *

6

*

* *

1022

14

* * 124

Number of passenger cabin vessels with berths

2013 4 * 2 5 * * * 1 * 37 49

2012 4 *

2

5

* * * 1 *

35

47

Number of passenger places available in vessels in service (units)

2013 1 167 * 1764 879 * * 13 9802 1 614 * 12 428 31 832

2012 1 167 * 1764 822 * * 13 9802 1 504 * 11 878 31 115

including:

Number of seats in passenger vessels without cabins

2013 320 * 1 400 * * * 13 9802 1 564 * * 17 264

2012 320 * 1 400 * *

*

13 9802 1 454 * * 17 154

Number of berths in passenger cabin vessels

2013 847 * 364 879 * * * 50 * * 2 140

2012 847 * 364 822 * * * 50 * * 2 083

Year UA MD RO

(2012) BG

(2012=2010)

RS HR HU (2012)

SK

АT DE1

Total

Number of passengers carried (thous. people) within national territory - total

2013 7 * 150 * * * 711 73 * * 941

2012 7 * 150 * * * 711 88 * * 956

Number of passengers carried (thous. people) in international navigation - total

2013 8 * 6 20 * * 5 36 * 474 543

2012 10 * 6 21 * * 5 32 * 530 598

Number of passenger-kilometers released (thous. passenger – km) within national territory - total

2013 376 * * * * * 11 919 1 191 * * 13 486

2012 378 * * * * * 11 919 1 387 * * 13 684

*

Number of passenger-kilometers released (thous. passenger – km) in international navigation - total

2013 17 208 * * 4 203

*

* 1584 3 460 * * 26 455

2012 24 278 * * 4 568 * * 1584 2 727 * * 33 157

* not available or magnitude "0" (statistical forms ST-14 - ST-15) 1 WSD Süd— Verkehrsbericht 2013; Verkehrsbericht 2012 2 Data for 2009

10. STATISTICS ON INLAND NAVIGATION OF GERMANY, including Danube and Main-Danube Canal1

Federal waterways

TOTAL

Including:

7476 km

Rhine with tributaries 1797 km

Including: Main-Danube Canal (at the confluence with the Main to the confluence with the Danube)

171 km

Danube (from Kelheim to the Austrian border) 213 km

German fleet of inland navigation vessels status 31 December 2013

Types of vessels Number Carrying capacity in tonnes

2013 2012 2013 2012 motor dry cargo vessels 887 912 1 138 677 1 160 299

motor tankers 366 380 675 006 697 592

pushed dry cargo barges 758 778 763 499 795 618

pushed tank barges 41 42 40 352 42 676

towed dry cargo barges 49 50 31 155 31 547

towed tank barges 12 12 3 499 3 499

TOTAL 2 113 2 174 2 652 188 2 731 231

bunker vessels 89 91 13 565 13 757

Engine power in kW

tug boats 122 123 27 323 27 268

pusher boats 301 300 135 964 143 530

Number of passenger-places

day-trip vessels 992 987 229 122 229 025

Number of berths

passenger cabin vessels 62 58 7 568 6 874

Source: Zentrale Binnenschiffsbestandsdatei bei der WSD Südwest, Mainz

1(For more details refer to "FACTS AND FIGURES FOR 2013/2014", Federal Association of the German Inland Navigation - Bundesverband der Deutschen Binnenschifffahrt e.V. – BDB).

2

Enterprises, employees, economic turnover

Number of enterprises engaged in economic activities in inland navigation,

status 30 June

2012 2011 2010 2009 dry cargo fleet 489 473 501 523

tanker fleet 167 148 148 168

tug boats and pusher boats

44 42 42 45

passenger transport 333 292 302 311

TOTAL: 1 011* 934* 970* 1 023* * By double-counting total amount doesn’t correspond to the amount for the certain fields.

Carriage of goods by inland water transport*

Share in total transport volumes 2013 2012 13-12 in %

12-11 in % mln.t in % in % in %

Products of agriculture and other agriculture-related manufactures

17,2 7,6 16,3 7,3 +5,5 +9,4

Coal and lignite; crude petroleum and natural gas

37,5 16,5 34,1 15,3 +10,0 +1,8

Metal ores and other mining and quarrying products; and other

54,9 24,2 55,6 24,9 -1,3 -5,9

Consumer goods, wood and products of wood

12,6 5,6 12,8 5,7 -1,6 +5,8

Coke and refined petroleum products 38,7 17,1 38,0 17,0 +1,8 +6,1

Chemical products 25,9 11,4 26,1 11,7 -0,8 +1,6

Basic metals; fabricated metal products 11,2 4,9 11,2 5,0 +/-0 -5,9 Machinery and equipment 2,0 0,9 2,0 0,9 +/-0 +5,3

Secondary raw materials; wastes 12,1 5,3 12,2 5,5 -0,8 +3,4

Other products 14,8 6,5 14,9 6,7 -0,7 -2,6

Total 226,9 100,0 223,0 100,0 +1,7 +0,5

* By all inland waterways of Germany

3

Transport flows in inland navigation

Number of goods transported in

mln. t

Turnover in bln. t-km

2013 2012 13-12 in %

2013 2012 13-12 in %

54,7 54,6 +0,2 11,0 10,9 +0,9

domestic transport within Germany 172,2 168,6 +2,1 49,1 47,6 +3,2

cross-border transport

including 104,6 100,0 +4,6 23,3 22,2 +5,0

import 47,8 48,3 -1.0 12,9 12,7 +1,6

export 19,8 20,3 -2,5 12,9 12,7 +1,6

transit 226,9 223,2 +1,7 60,1 58,5 +2,7

Total transport volume by German waterways

71,2 70,6 +0,8 17,7 18,0 -1,7

including German vessels 31,4 31,6 -0,2 29,5 30,8 -1,3

in %

Waterway freight transport, in mln.t1

2013 2012 13-12 in %

Rhine basin, including: 193,5 189,4 +2,2

Upper Rhine 53,6 52,9 +1,3

Middle Rhine 81,8 80,9 +1,1 Lower Rhine 177,8 174,4 +1,9

Mosel 13,5 12,7 +6,3

Neckar 7,4 7,1 +4,2

Main 16,2 16,7 -3,0

Main-Danube Canal 5,9 5,9 +/-0

Danube (German section) 6,6 6,5 +1,5

Canals of the Western Germany,

including: 39,3 37,7 +4,2

Rhine-Herne 12,3 11,8 +4,2

Wesel-Datteln 20,1 18,6 +8,1

Datteln-Hamm 7,1 6,0 +18,3

4

Dortmund-Ems 18,4 18,5 -0,5

Küsten Canal 4,7 4,2 +11,9

Elbe basin 17,6 16,3 +8,0

Weser basin 8,5 8,9 -4,5 German Midland canal,

including: 21,5 20,5 +4,9

Salzgitter branch canal 2,5 2,8 -10,7

Berlin waterways 4,7 4,2 +11,9

State of Brandenburg

State of Mecklenburg – Western Pomerania 3,6 3,5 +2,9

1 By double-counting total amount for the certain regions appears to be higher than the German-wide indicators.

Container transport by inland waterway vessels

Number of containers transported, in thous. TEU*

2013 2012 13-12 in %

domestic transport within Germany 227 248 -8,5

cross-border transport 1 980 1 944 +1,9

including

import 841 820 +2,5

export 897 881 +1,8

transit 242 243 -0,4

Total transport volume on German waterways 2 207 2 192 +0,7

including German vessels 355 352 +0,9

in % 16,1 16,1 +/-0

* In Twenty-Foot-Equivalent-Unit.

Container transport in Germany, in 1000 TEU* 2013 2012 13-12 in % Rhine, Main, Neckar, Mosel, Saar 1 788 1 748 +2,3

Canals region1, Ruhr 150 145 +3,4

Elbe Region2 114 110 +3,6

Weser 138 192 -28,1

Danube and Main-Danube Canal 2 3 -33,3

TOTAL: 2 192 2 198 -0,3 * In Twenty-Foot-Equivalent-Unit. 1 RHK, WDK, DHK, DEK, MLK. 2 Elbe, ESK, EKK, EHK, UHW, NOK, Saale.

5 Comparison of transport modes for long distance routes

train vessel truck

Route length in km1 33 576 7 476 230 500

Transport volume in mln.t 2 373,7 226,9 1 284,9 3

share of each transport mode in %

19,8 12,1 68,1 3

Cargo turnover in bln.tkm 2 112,6 60,1 251,0 3

share of each transport mode in %

26,6 14,2 59,2 3

Cargo volume in t per1 km of route4 11 130 30 350 5 574

Average distances in km for the means of transport in Germany4

301 265 195

Transport of dangerous goods in mln.t per year 65,7 45,0 - 5

Accident costs, cent/100 tkm6 6,0 3,3 42,9

Noise costs, cent/100 tkm6 0,84 0,00 0,79

Energy consumption in bulk freight transport in MJ/tkm6,7

0,43 0,23 0,92

Costs related to (СО2) emissions, cent/tkm5

for bulk freight transport7 0,18 0,12 0,47

for container transport7 0,16 0,11 0,26

1 Source: Verkehr in Zahlen 2013/2014 (Verkehr in Zahlen 2013/2014) DIW. 2 Market observation for road transport for 2013, BAG Köln. 3 Excluding data on carriage by road transport for short distances and within a national territory. 4 Own calculations. 5 Not available. 6 PLANCO Study "Comparison of transport modes" for 2007. 7 By separate ratio.

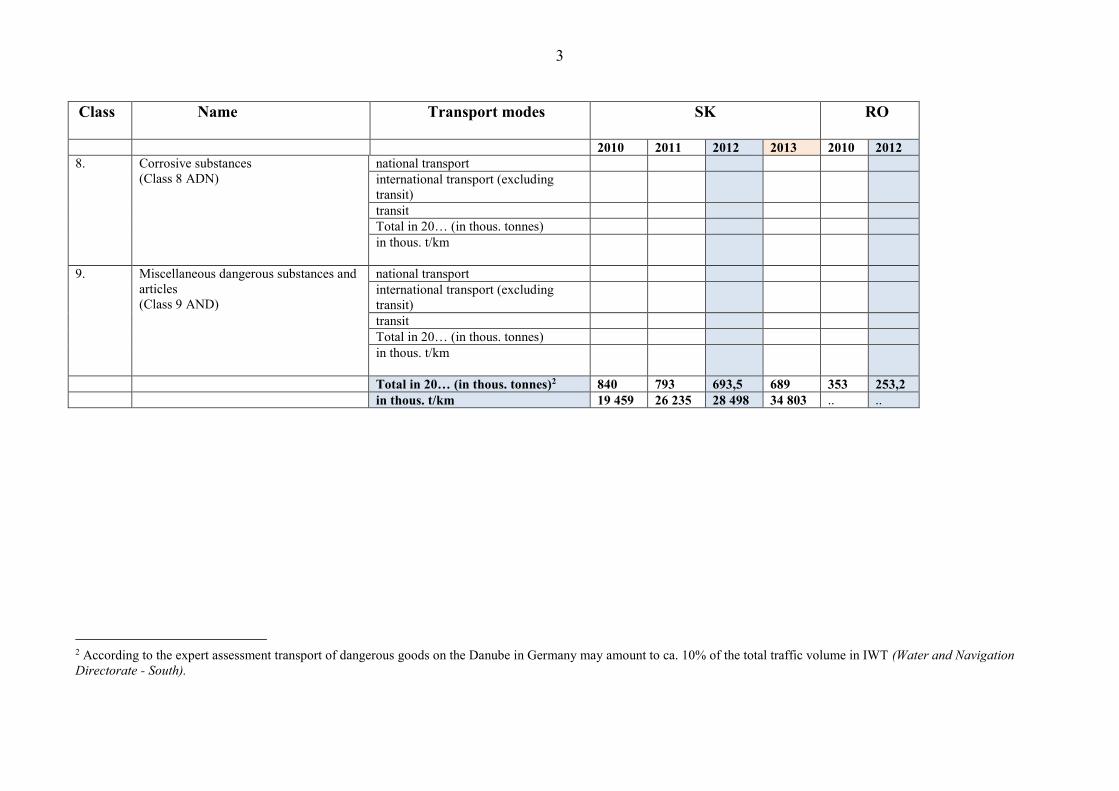
11. TRANSPORT OF DANGEROUS GOODS ON THE DANUBE for 2010-2013 (in accordance with ADN 1 )

thous.tonnes Class Name Transport modes SK RO

2010 2011 2012 2013 2010 2012 1. Explosive substances and

articles (Class 1 ADN) national transport international transport (excluding transit) transit Total in 20… (in thous. tonnes) in thous. t/km

2. Gases (Class 2 ADN)

national transport 0 0 international transport (excluding transit) 21 10,4 transit 0 0 Total in 20… (in thous. tonnes) 21 10,4 in thous. t/km ..

..

3. Flammable liquids (Class 3ADN)

national transport 0 0 0 0 28 18,5 international transport (excluding transit) 816 748 617,3 630 304 224,3 transit 21 45 72,2 56,5 Total in 20… (in thous. tonnes) 837 793 689,5 686,5 332 242,8 in thous. t/km 19 225 26 235 28 444 26 879

1 Draft "Form and table for data collection on transport of dangerous goods on the Danube in accordance with ADN" (Dok. DK/TAG 73/14) has been approved by the Decision of the 73rd session of the DC of December 15, 2009 (Dok. DK/TAG 73/15). Competent authorities of Member States were recommended to use form for data collection for 2009 on transport of dangerous goods on the Danube beginning January 1, 2010 to provide Secretariat of the Danube Commission with them on voluntary basis.

2 Class Name Transport modes SK RO

2010 2011 2012 2013 2010 2012 4. Flammable solids, self-reactive

substances and desensitized explosives, substances liable to spontaneous combustion and substances which, in contact with water, emit flammable gases (Classes 4.1, 4.2 and 4.3ADN)

national transport 0 0 international transport (excluding transit) 0 4 transit 1 0 Total in 20… (in thous. tonnes) 1 4 in thous. t/km 208 54

5. Oxidizing substances and organic peroxides (Classes 5.1 and 5.2 ADN)

national transport international transport (excluding transit) transit Total in 20… (in thous. tonnes) in thous. t/km

6. Toxic substances and infectious substances (Classes 6.1 and 6.2 ADN)

national transport 0 0 international transport (excluding transit) 2 0 transit 0 2 Total in 20… (in thous. tonnes) 2 2 in thous. t/km

26 7 924,5

7. Radioactive materials (Class 7ADN)

national transport international transport (excluding transit) transit Total in 20… (in thous. tonnes) in thous. t/km

3 Class Name Transport modes SK RO

2010 2011 2012 2013 2010 2012 8. Corrosive substances

(Class 8 ADN) national transport international transport (excluding transit)

transit Total in 20… (in thous. tonnes) in thous. t/km

9. Miscellaneous dangerous substances and articles (Class 9 AND)

national transport international transport (excluding transit)

transit Total in 20… (in thous. tonnes) in thous. t/km

Total in 20… (in thous. tonnes)2 840 793 693,5 689 353 253,2 in thous. t/km 19 459 26 235 28 498 34 803 .. ..

2 According to the expert assessment transport of dangerous goods on the Danube in Germany may amount to ca. 10% of the total traffic volume in IWT (Water and Navigation Directorate - South).


Recommended